moisture absorption and swelling nylatron gs-5 1...
TRANSCRIPT
-
SANDIA REPORT SAND82-0985 Unlimited Release UC-25 Printed May 1982
Moisture Absorption and Swelling of Nylatron GS-5 1 = 13
Michael R. Keenan
Prepared by Sandia National Laboratories Albuquerque, New Mexico 87 185 and Livermore, California 94550 for the United States Department of Energy under Contract DE-AC04-76DP00789
i . . .^ .
Issued by Sandia National Laboratories, operated for the United States Department of Energy by Sandia Corporation. NOTICE This report waa repared aa an account of work sponsored by an agency rf the United States k vemment. Neither the United States Govern- ment nix any agency thereof, nor any of their employees, nor any of their contractors, subcontractors, or their employees, makes any warranty, express or implied, or assumes any 1 al Lability or responsibility for the accuracy, cornpleamess. or usefulness 3 a n y information, apparatus, product, or pro- cess dlec-iosed or represents that its w would not infringe privately owned rights Reference herein to any specific commercial product, process, or Berme by trade name, trademark, manufacturer, or otherwise, does not necegaard> constitute or imply ita endorsement, recommendation, or favoring by the United States Government, any agency thereof or any of their contractors or subcontractors. The views and opinions expressed herein do not necessarily state or reflect those of the United States Government, any agency thereof or any of their contractors or subcontractors.
Printed in the United States of America Available from National Technical Information Service U.S. Department of Commerce 5285 Port Ro al Road Springfield, {A 22161
NTIS price codes Printed copy: A03 Microfiche copy A01
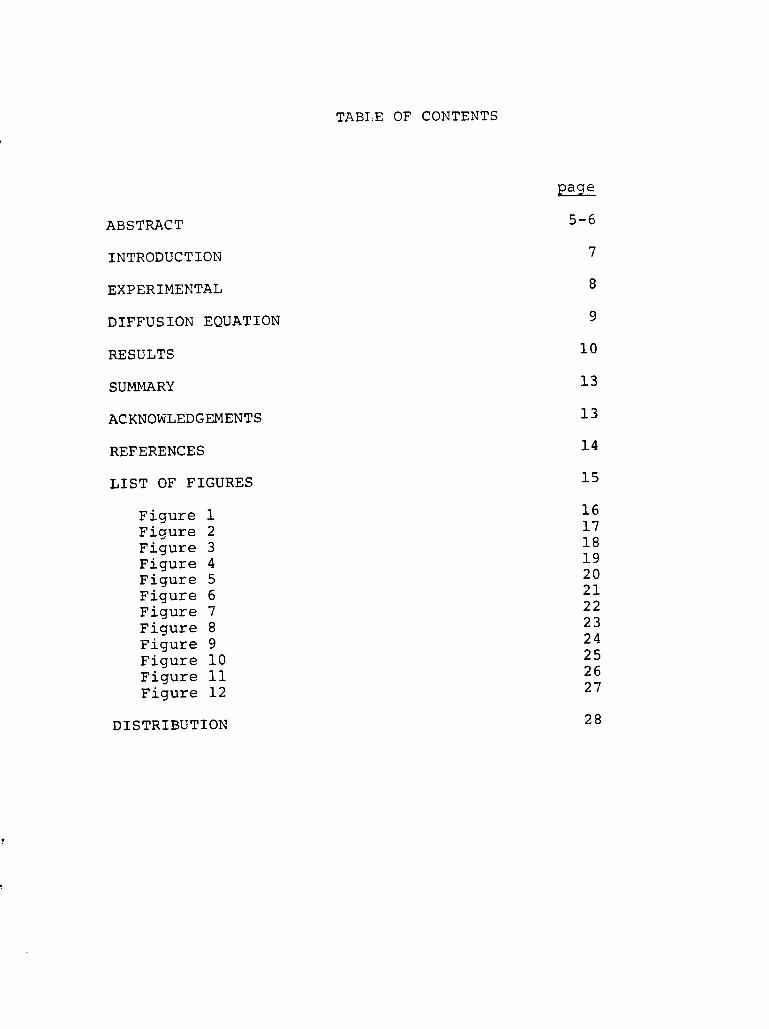
TAB1:E OF CONTENTS
page
ABSTRACT
INTRODUCTION
EXPERIMENTAL
DIFFUSION EQUATION
RESULTS
SUMMARY
ACKNOWLEDGEMENTS
REFERENCES
LIST OF FIGURES
Figure 1 Figure 2 Figure 3 Figure 4 Figure 5 Figure 6 Figure 7 Figure 8 Figure 9 Figure 10 Figure 11 Figure 12
D I S TRI BU T I ON
5 - 6
7
8
9
10
13
13
14
15
16 1 7 1 8 1 9 20 21 22 23 2 4 2 5 26 27
28
MOISTURE ABSORPTION AND SWELLING OF NYLATROX GS-51-13
M. R. Keenan Sandia National Laboratories
Albuquerque, New Mexico 87185
ABSTRACT
The moisture absorption and swelling properties of Nylatron
GS-51-13 detent wheels have been characterized at high humidity
and at several temperatures. Thickness changes of the parts
were found to be linearly related to the amount of water uptake.
Diffusion theory was used to analyze the data. The parts were
modeled as hollow right circular cylinders and the diffusion
equation was solved for this geometry. Diffusion was found to ,e
Fickian with the effective diffusion constants, D (in cm / s ) ,
given by the Arrhenius equation, D = 4.23 exp(-6740/T , where T is the absolute temperature.
mole. Since the parts deviate slightly from the model geometry,
the effective diffusion constants contain a geometrical factor.
However, by varying the cylinder dimensions, it was estimated
that the effective diffusion constants for the parts are within
20% of the true Nylatron material properties. From the fore-
going work, a model was developed to predict dimensional changes
in the parts as a function of environmental conditions.
2
The activation energy is 13.4 kcal/
5-6
INTRODUCTION
In the design of a mechanical component, a major concern is
dimensional stability with respect to environmental conditions.
Thermal expansion at elevated temperatures, for example, must be
considered to ensure that the part will remain within tolerances
and perform reliably. For parts made of polymeric materials, the
greatest source of dimensional instability is often swelling of
the polymer due to absorption of water. Under environments likely
to be encountered, the dimensional changes resulting from moisture
absorption may be an order of magnitude larger than the effects
of temperature alone. This report shows that if the relationship
between moisture absorption and swelling is known, the theory of
diffusion can be used to predict dimensional changes as a function
of time, temperature and relative humidity.
In this study, the swelling of Nylatron GS-51-13 (40%
glass filled nylon 6,6 with MoS2 powder as a dry lubricant) due
to water absorption is analyzed. Nylatron finds application in
parts such as dry bearings and gears. The geometry of a
typical part is given in Fig. 1. The moisture absorption
and swelling characteristics of the parts themselves were
examined under a variety of conditions and a linear relation-
ship was found between the amount of moisture uptake and the
extent of swelling. By modeling the part as a hollow right
circular cylinder, effective diffusion constants for water in
Nylatron were determined. These, in turn,serve as a basis for
predicting dimensional changes. Vhile the diffusion constants
7
exhibit internal consistency, they contain contributions due to
the component's deviation from the model geometry.
estimated, however, that they are within 20% of the true Nylatron
It is
material properties.
EXPERIMENTAL
The parts were dried by vacuum baking at 8OoC for 7 2 hrs
after which three parts each were immersed in distilled water
(100% relative humidity) at 2loC, 5OoC and 71OC. The parts
were periodically removed from the water, cooled, dried, weighed
and had their thickness measured with a micrometer. Figure 2
summarizes the thickness changes as a function of time at the
three temperatures.
measurements on each of the three parts.
parts are shown in Fig. 3 .
namely, immersion and interruption of absorption affected the
results, the water uptake of a single part was measured
continuously at 59OC and 96% RH using a sensitive microbalance.
No significant effects were seen.
Each point represents the average of three
The mass gains of the
To see if the experimental procedure,
1
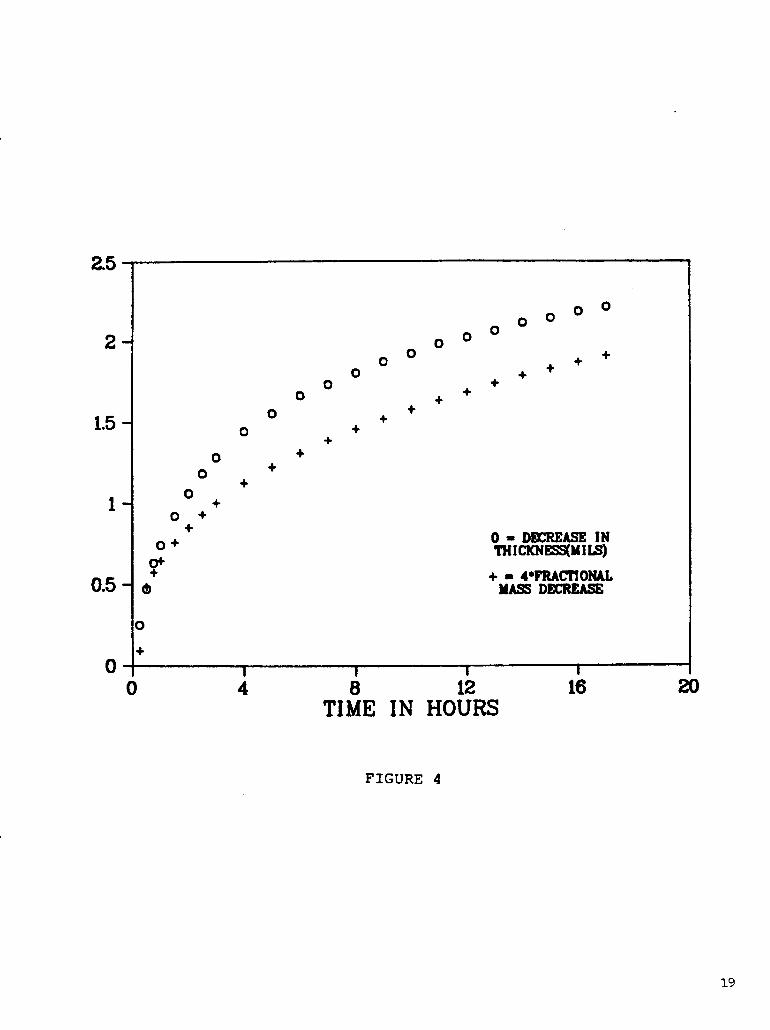
Finally, water desorption from the parts was briefly
examined. To measure the rate of thickness decrease, an
initially saturated part at 7OoC was allowed to desorb into a
dry nitrogen atmosphere (also 7 O O C ) . The thickness change was
monitored continuously in a thermomechanical analyzer.
equilibrated 59OC part was desorbed into a vacuum in the
microbalance with its mass decrease measured.
The
The results of
these experiments are shown in Fig. 4 .
8
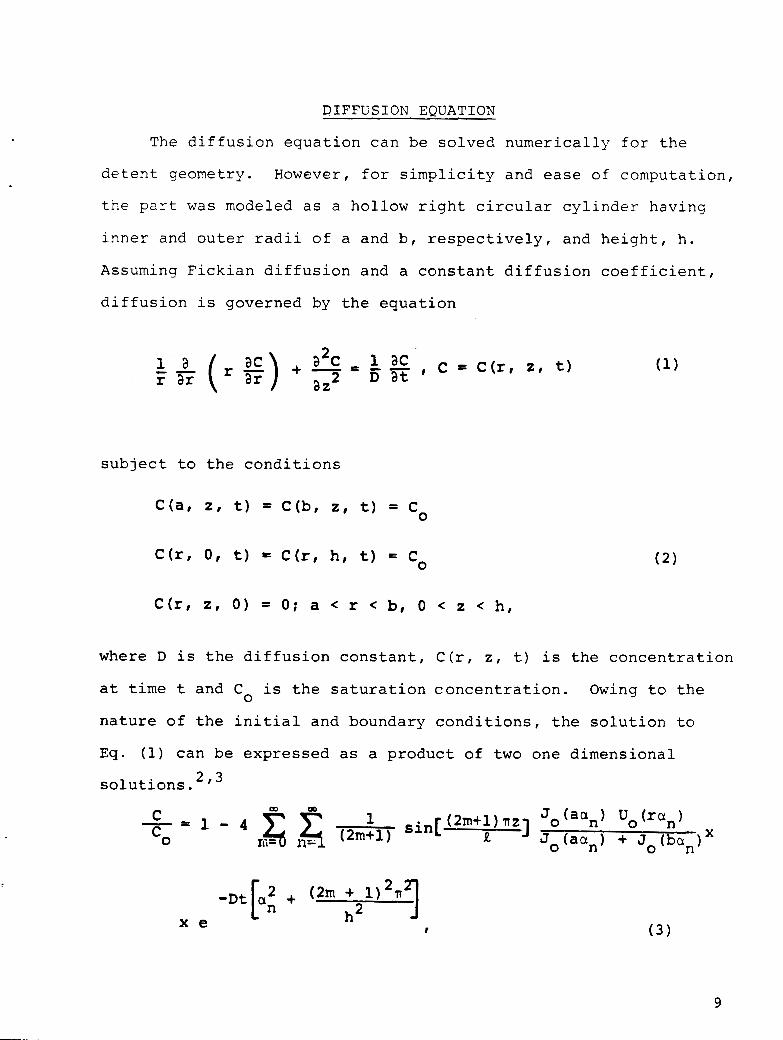
DIFFUSION EQUATION
The diffusion equation can be solved numerically fo r the
detent geometry. However, for simplicity and ease of cornputatLon,
the part was modeled as a hollow right circular cylinder having
inner and outer radii of a and b, respectively, and height, h.
Assuming Fickian diffusion and a constant diffusion coefficient,
diffusion is governed by the equation
subject to the conditions
C ( a , z, t) = C ( b , z, t) = Co
C(r, 0, t) = C ( r , h , t) = C,
C ( r , z, 0 ) = 0; a < r < b, 0 < z < h,
where D is the diffusion constant, C(r, z , t) is the concentration
at time t and Co is the saturation concentration.
nature of the initial and boundary conditions,
Eq.
Owing to the
the solution to
(1) can be expressed as a product of two one dimensional 2 , 3 solutions.
9
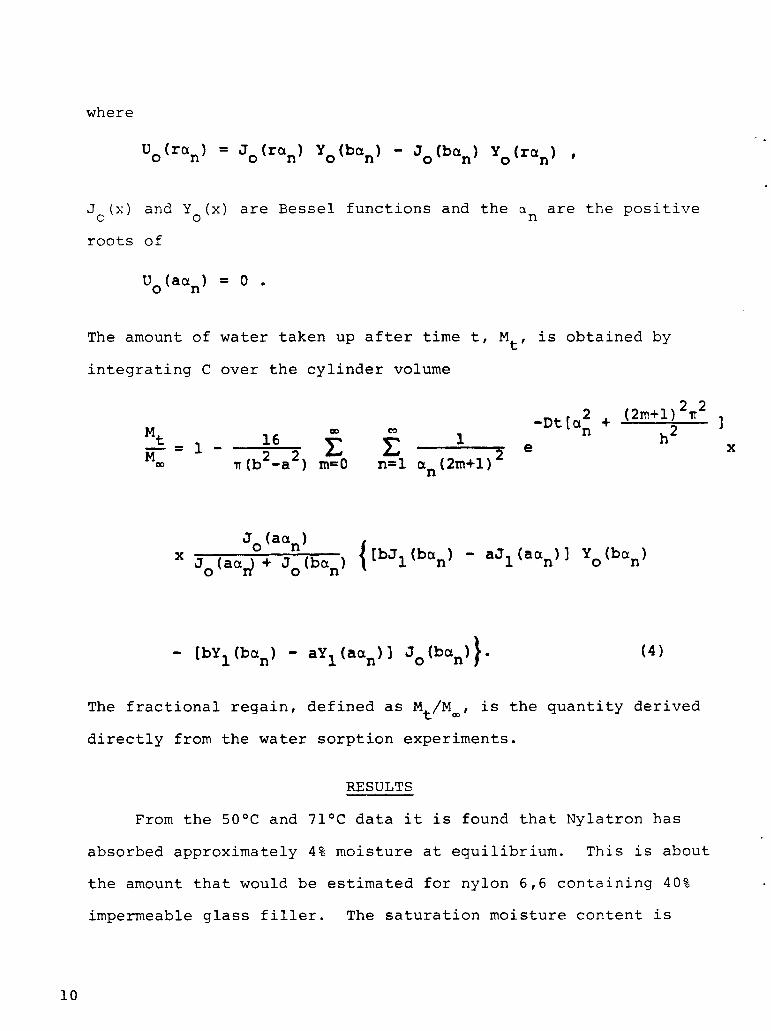
where
J ( x ) and Y (x) are Bessel functions and the an are the positive
roots of 0 0
Uo(aan) = 0 .
The amount of water taken up after time t, Mt, is obtained by
integrating C over the cylinder volume
2 2 I (2m+1) lr -Dt[at +
X h2 e Mt 1 6 5 1
2 2 2 K = l - n ( b -a ) m-0 n-1 a n ( 2 m + l )
The fractional regain, defined as Mt/M,, is the quantity derived
directly from the water sorption experiments.
RESULTS
From the 5OoC and 71OC data it is found that Nylatron has
absorbed approximately 4 % moisture at equilibrium. This is about
the amount that would be estimated for nylon 6,6 containing 40%
impermeable glass filler. The saturation moisture content is
10
4 essentially independent of temperature as is found in nylon 6,6
and polymers in general.5
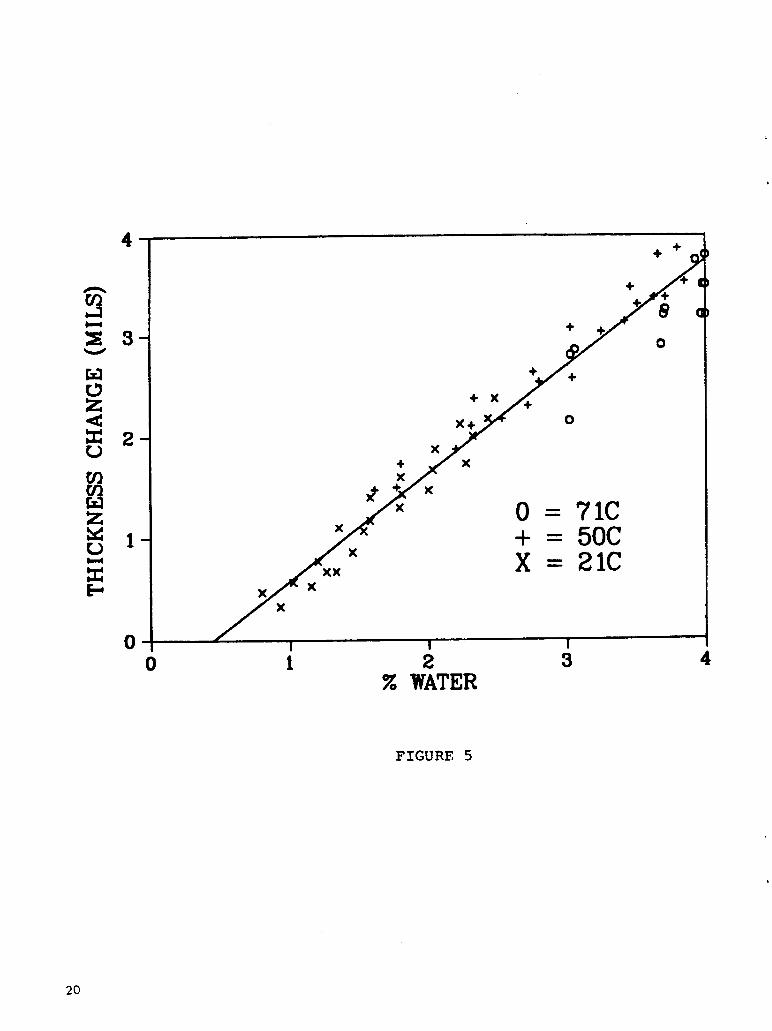
linear relationship was found between the water uptake and
th?e thickness change for these parts. After a slow initial
increase, the thickness increases by about 0.6% for each 1%
rise in water content. The nonzero intercept in Fig. 5 is
consistent with a threshold concentration below which swelling
does not occur.
In addition, as shown in Fig. 5, a
6
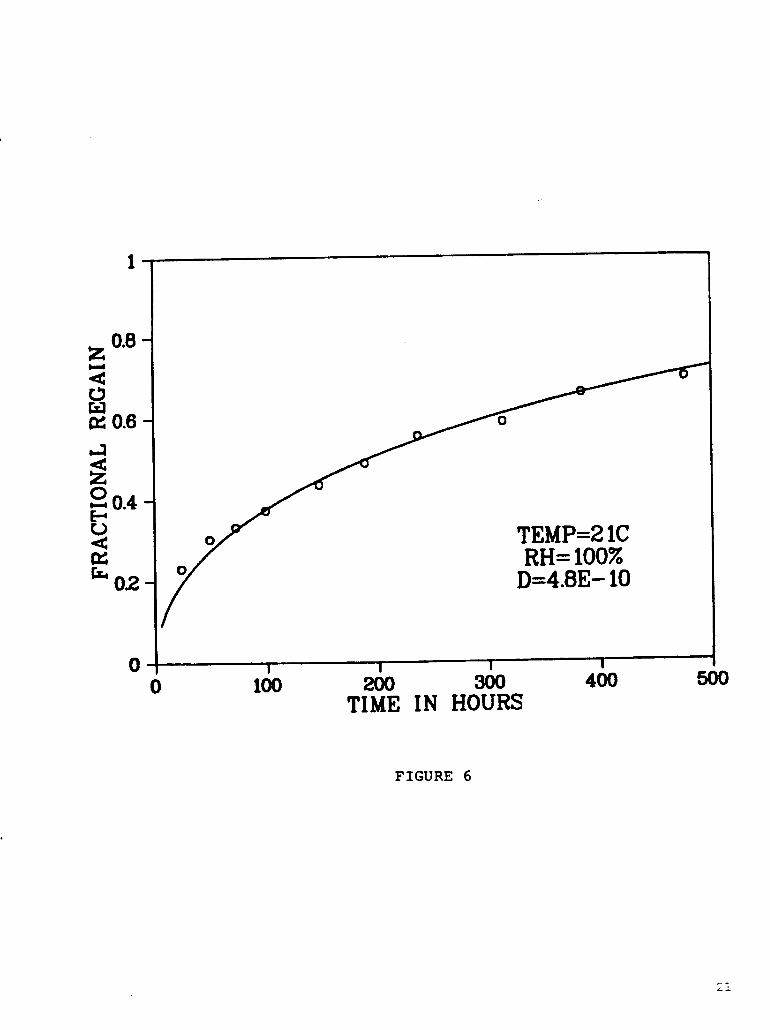
The water absorption of the detents was analyzed in terms of
diffusion constants according to E q . ( 4 ) . The parts were modeled
as hollow cylinders having inner and outer radii of 0.14 and
0.30 in. respectively, and a height of 0.125 in. D was then varied
in E q . (4) until the predicted regain curves suitably matched
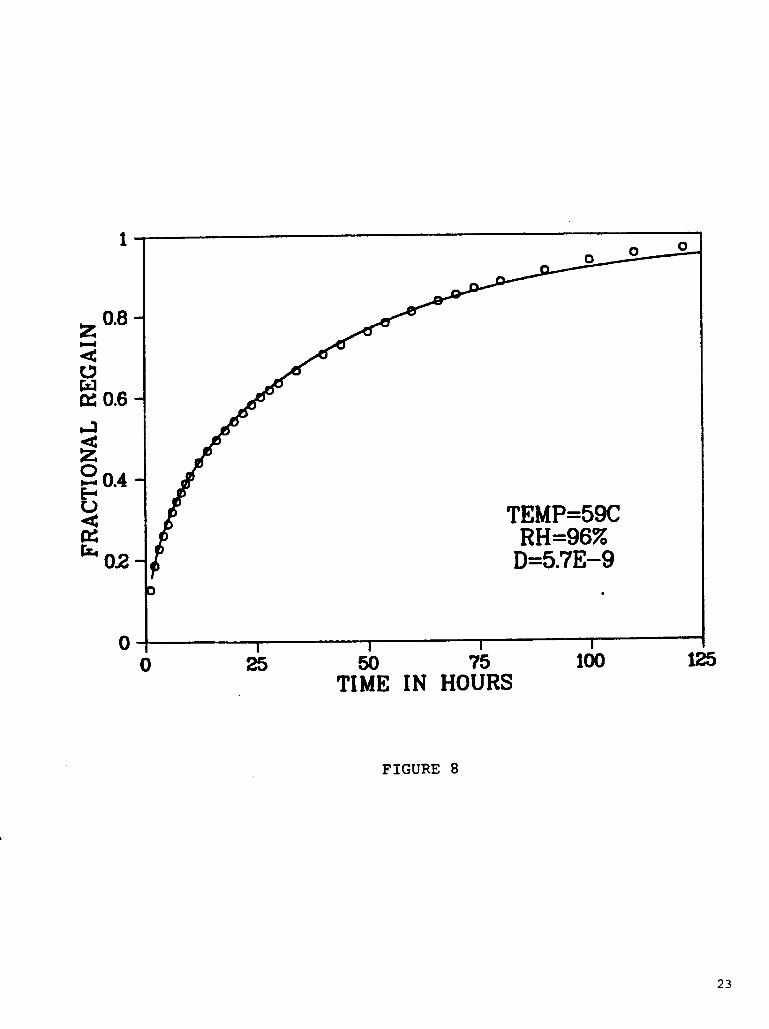
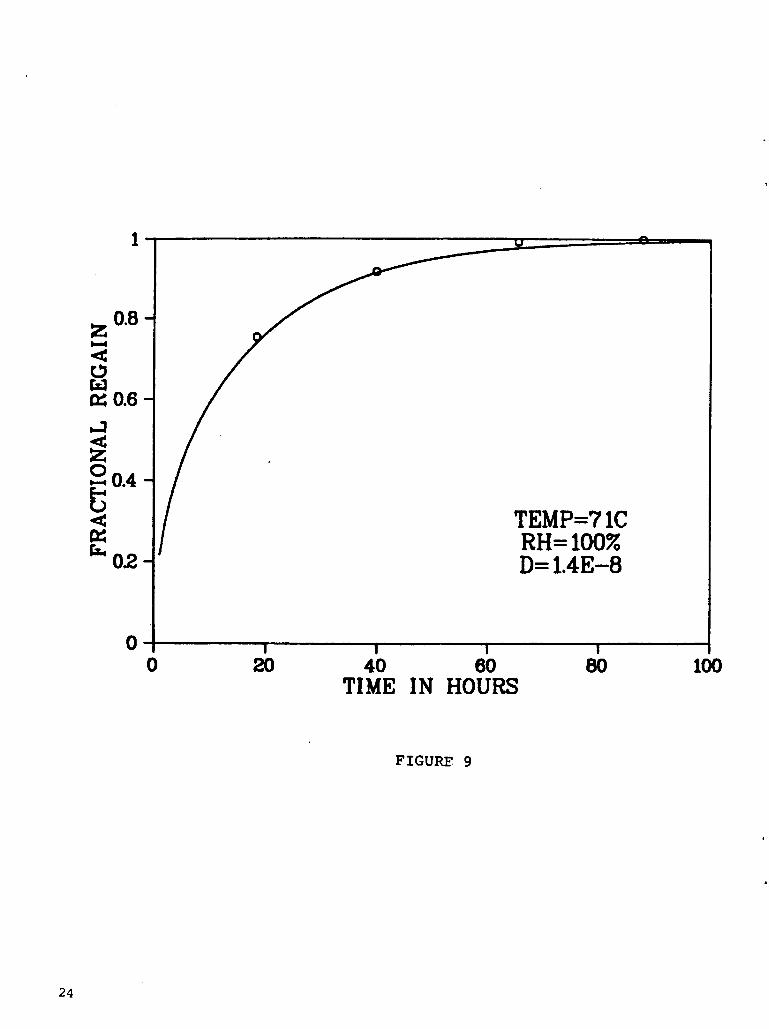
experiment. Figures 6-9 compare theory and experiment for the
four temperatures examined. The excellent agreement indicates
that the model geometry adequately describes the part. D,
however, is somewhat sensitive to the cylinder dimensions chosen.
To examine this effect, the 59OC data were analyzed in terms of
several cylinders having the extremes of the detent dimensions with
the derived D's showing variations of up to 20%. This figure is
typical of variations in D generally found in the literature,
t h u s , the material constants for Nylatron are reasonably well
determined. As a final check on the diffusion picture, the
two desorbing parts (see Fig. 4 ) indicate that the process is
reversible and that the rate of desorption is consistent with
the D's found above.
11
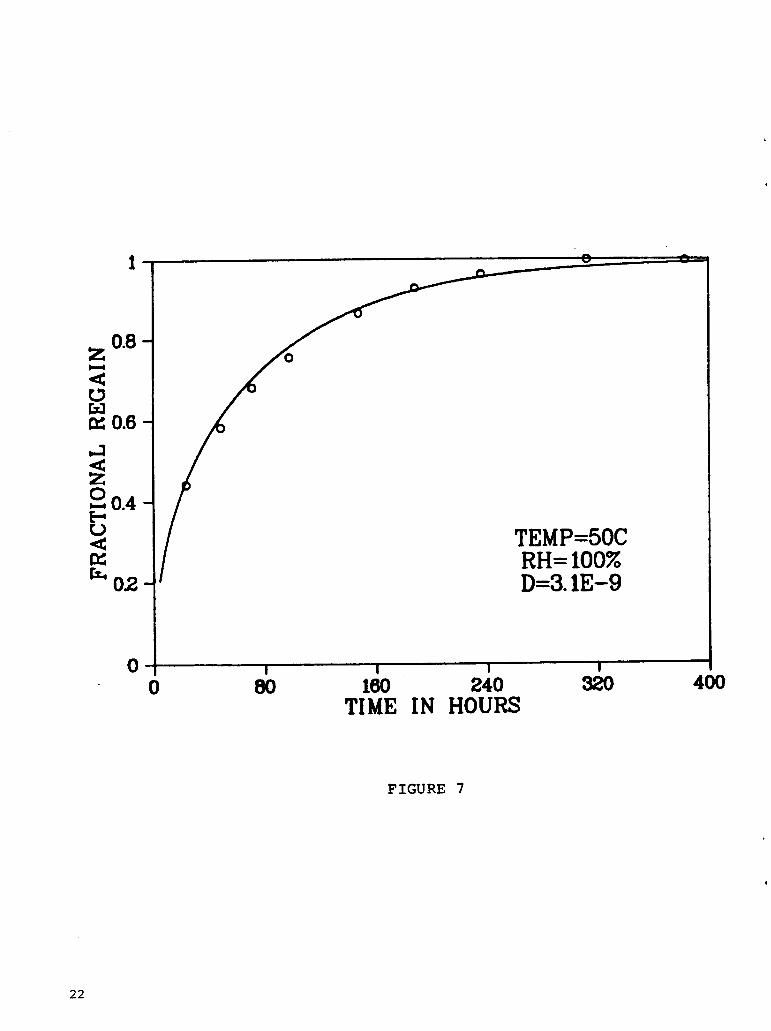
Although the final mass uptake and thickness change of a
detent is independent of temperature at constant humidity, the
rate of approach to equilibrium is a strong function of
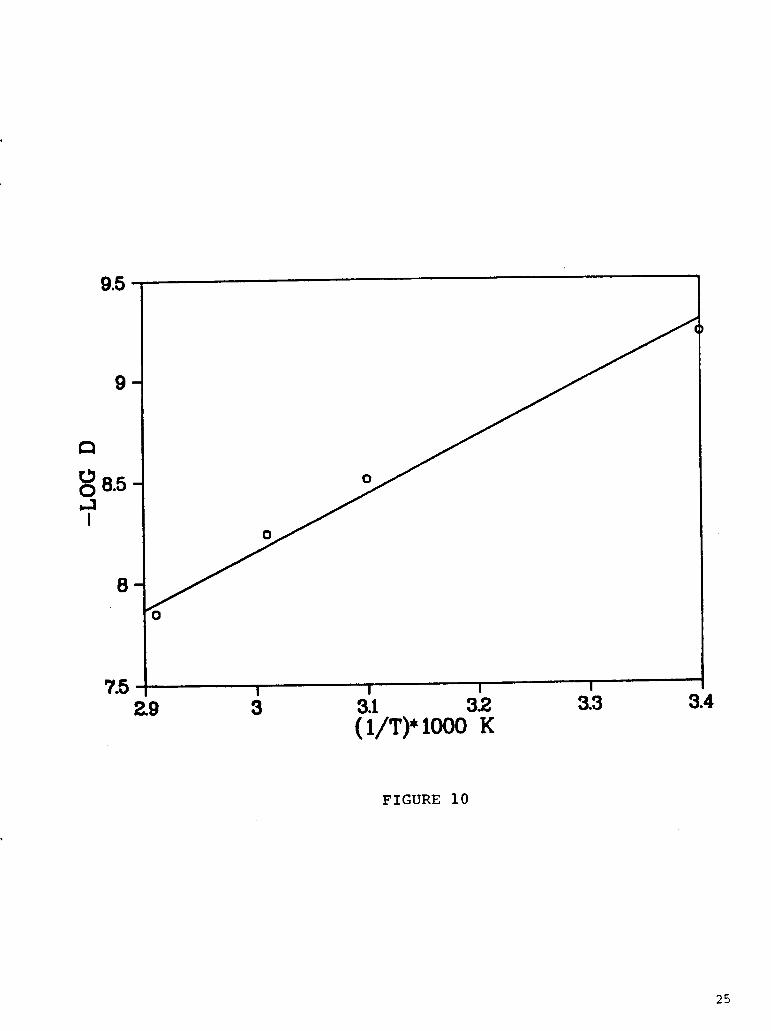
temperature. This strong dependence of D on temperature, as
exhibited in Figs. 6-9, indicates that the diffusion is a
thermally activated process. Figure 10 shows an Arrhenius
plot in which the diffusion constants are found to obey the
equation
2 Both the constants, D (in cm / s ) , and the activation energy
(13.4 kcal/mole) are consistent with literature values for
nylon. 7
The theory of diffusion presented above alonu with the
empirical relationship between moisture content and swelling
permit the dimensional changes of the parts to be predicted,
as a function of time, for a variety of environmental conditions.
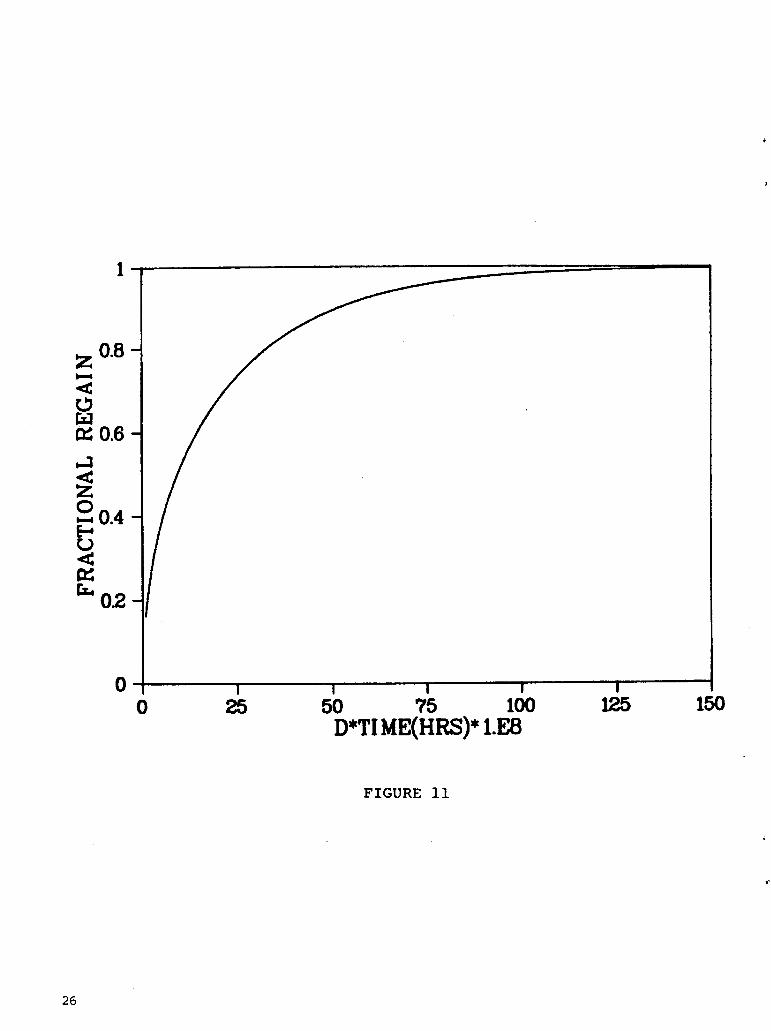
The diffusion constants merely scale the time axis of the
fractional regain (FR) curves. That is, the product of D and
time is a constant for a given FR. Fiuure 11 shows the relation-
ship between the FR and the D-time product. Once D is computed
at a given temperature from Eq. (5), the time, t, to a given FR
is easily determined. The mass gain at t is obtained by multi-
plying the FR by the equilibrium moisture content, M . The
corresponding thickness change of a part is obtained from a
the mass gain with the aid of Fig. 5. While no work was done
at humidities lower than 96% RH, the rate of approach to
12
equilibrium (as measured by the FR) should be independent of
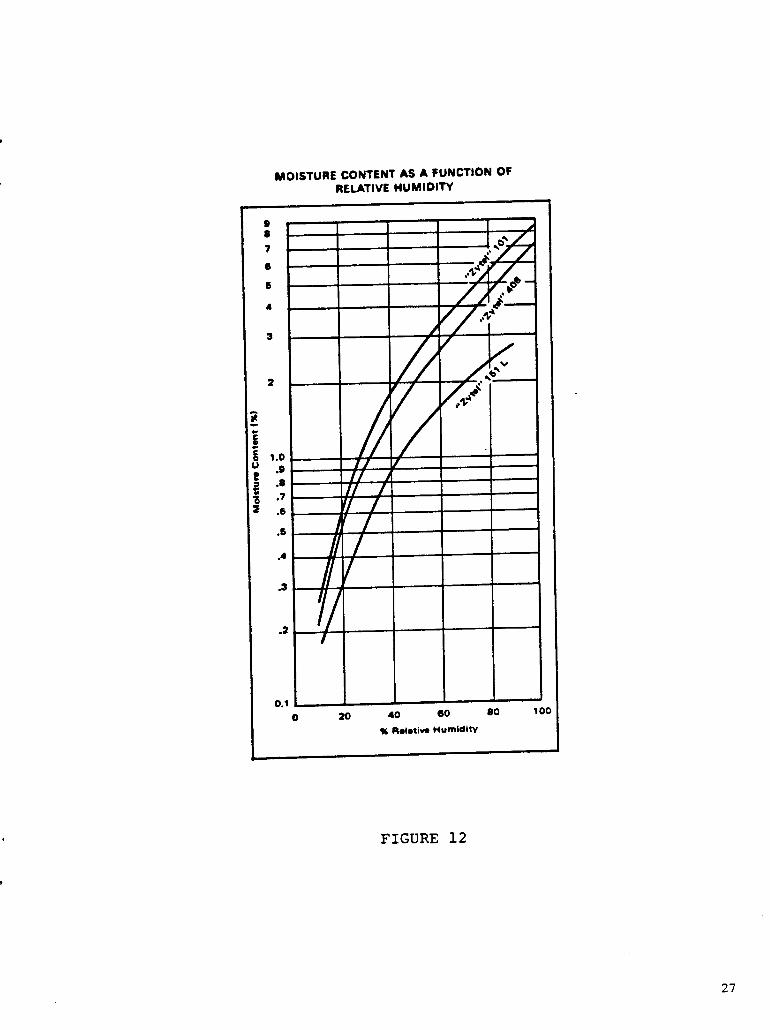
RH. The RH simply determines Co in Eq. (3). Figure 12 gives
Co for nylon 6,6 ("Zytel" 101) .4
approximated by dividing the corresponding "Zytel" 101 figure
by 2, reflecting the large fraction of impermeable filler in
the Nylatron.
C for Nylatron can be 0
SUMMARY
The dimensional stability and moisture absorption
characteristics of Nylatron GS-51-13 detent wheels were investi-
gated as a function of temperature. The swelling of the parts
was found to be linearly related to the amount of water uptake.
The diffusion equation was solved fo r a simplified model of
the detent geometry and used to determine the diffusion constants
for Nylatron. The diffusion constants displayed Arrhenius
behavior, adequately represented the data and were consistent
with published values for nylon. As a result of this work,
a model was developed to predict dimensional changes in the parts
under a variety of environmental conditions.
ACKNOWLEDGEMENTS
I thank L. Orear (5814) for performing the microbalance
experiments and J. A . Sayre (5813) for many valuable discussions.
13
REFERENCES
K . D. B o u l t i n g h o u s e , S a n d i a L a b o r a t o r i e s Repor t SAND80-0975 J u n e 1980.
1.
2.
3 .
4.
5.
6 .
7.
1 4
J . Crank , Ma themat i c s o f - D i f f u s i o n , 2nd Ed . , ( O x f o r d U n i v e r s i t y Press , London, 1 9 7 5 ) .
H . S. C a r s l a w and J . C . J a e g e r , Conduc t ion of P e a t i n S o l i d s , 2nd Ed. (Oxford U n i v e r s i t y P r e s s , Oxfo rd , 1 9 5 9 ) .
---
" Z y t e l " Des ign Handbook, DuPont Co., Wilmington , Delaware.
V. S t a n n e t t , D i f f u s i o n i n Polymers , J. Crank and G . S. P a r k , Eds . , (Academic P r e s s , N Y , 1968) p. 41.
G. A s t a r i t a and G . C . S a r t i , Po ly . S c i . Eng. , 18, 388 ( 1 9 7 8 ) .
J. A. Ba r r i e , D i f f u s i o n i n Polymers, J. Crank and G . S . P a r k , Eds . , (Academic P r e s s , N T 1968) p. 259.
LIST OF FIGURES
1.
2 .
3.
4.
5.
6 .
7 .
8.
9.
10.
11.
12.
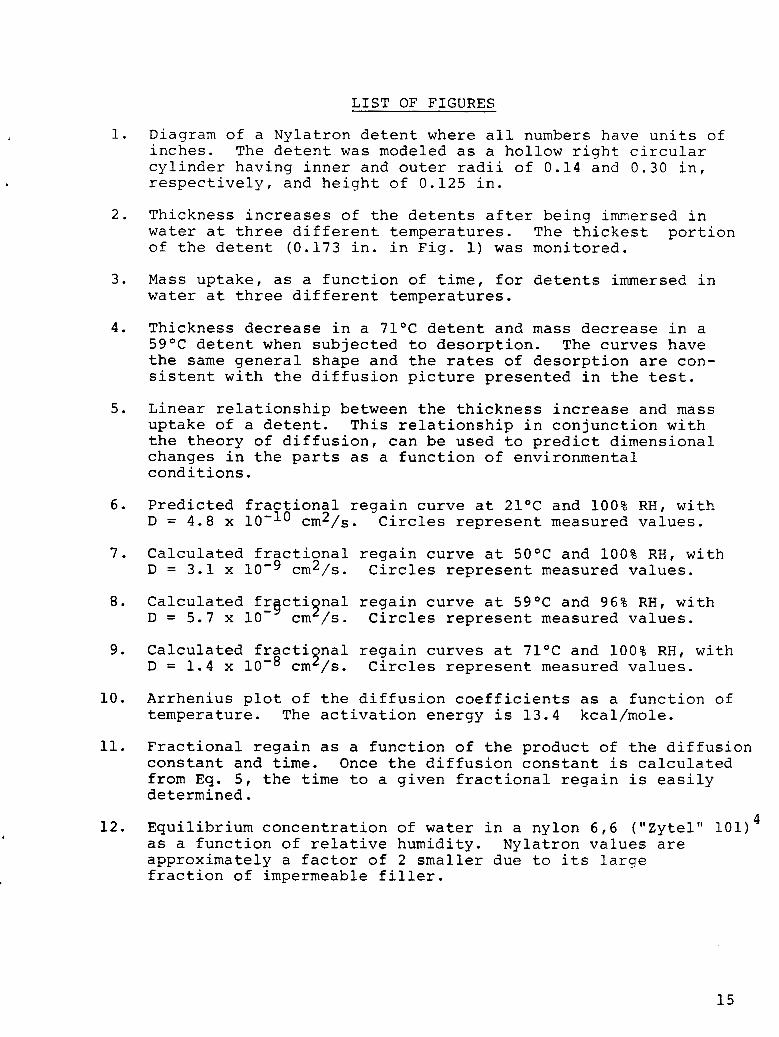
Diagram of a Nylatron detent where all numbers have units of inches. The detent was modeled as a hollow right circular cylinder having inner and outer radii of 0.14 and 0.30 in, respectively, and height of 0.125 in.
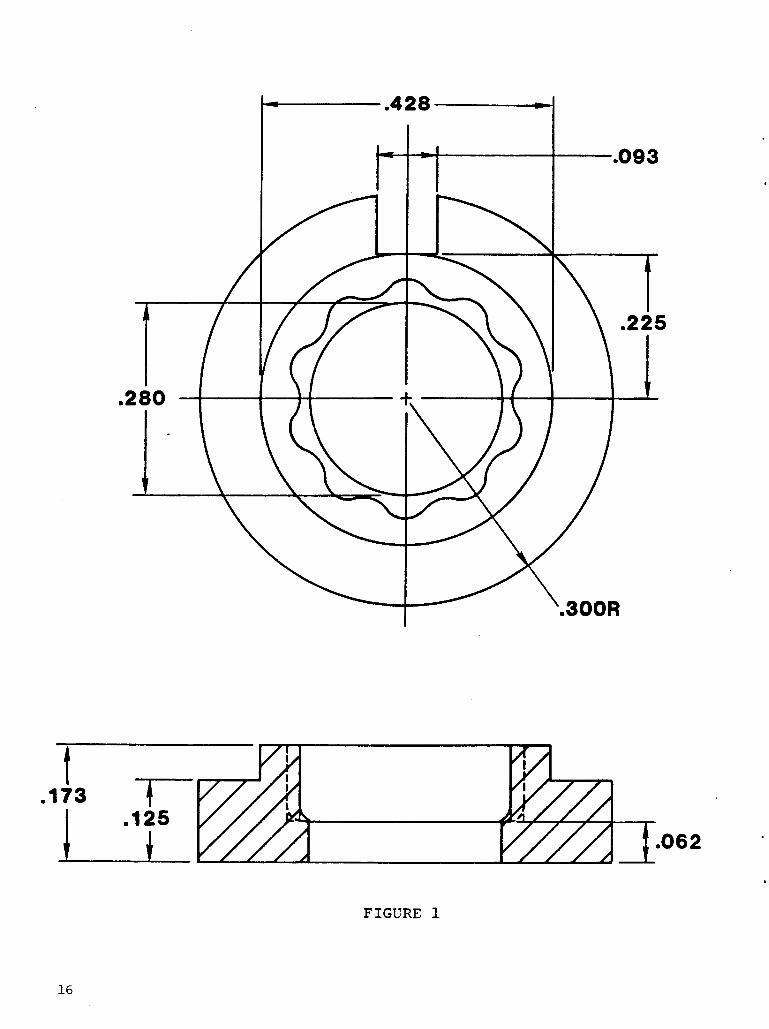
Thickness increases of the detents after being immersed in water at three different temperatures. The thickest portion of the detent (0.173 in. in Fig. 1) was monitored.
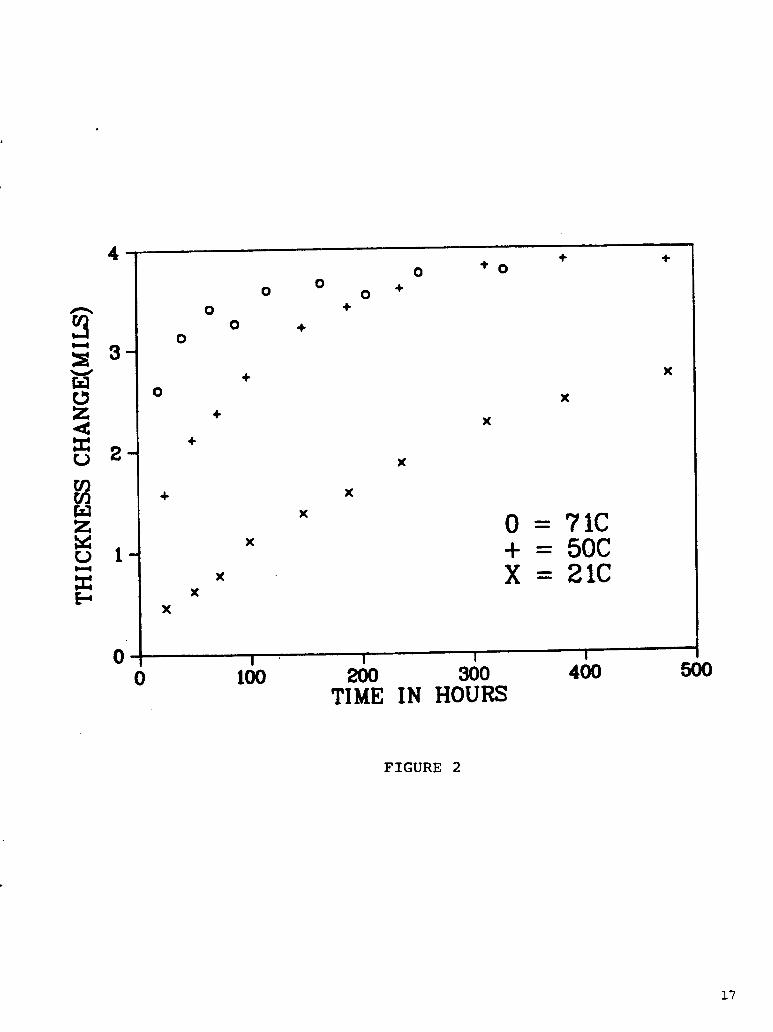
Mass uptake, as a function of time, for detents immersed in water at three different temperatures.
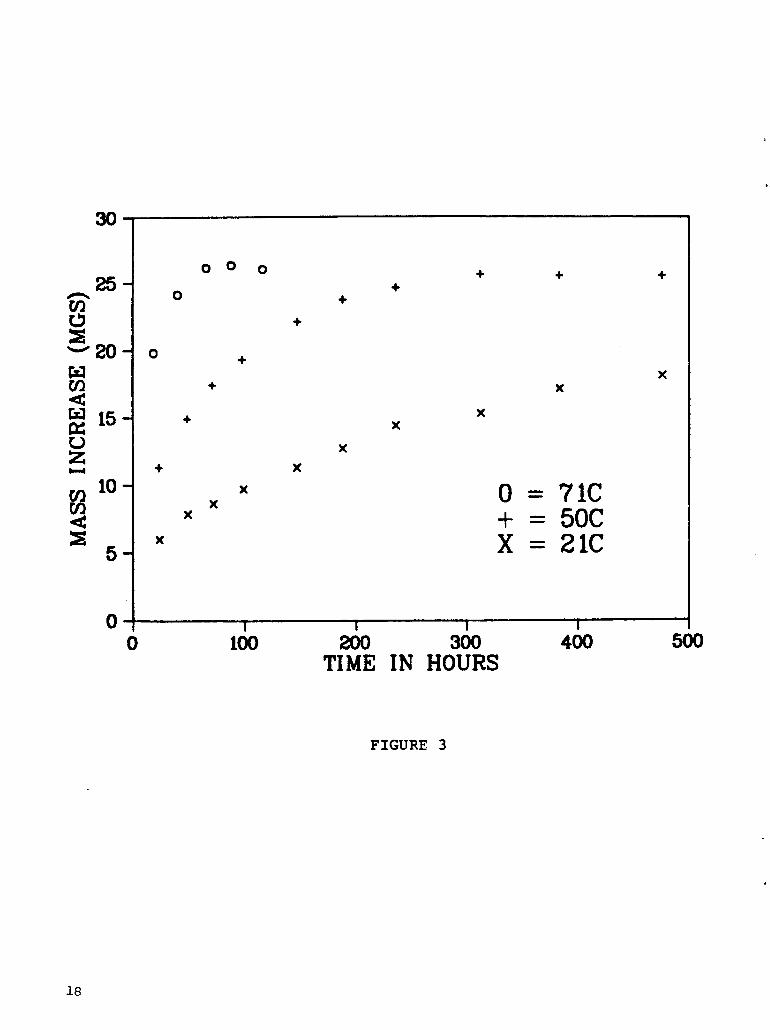
Thickness decrease in a 71OC detent and mass decrease in a 59OC detent when subjected to desorption. The curves have the same general shape and the rates of desorption are con- sistent with the diffusion picture presented in the test.
Linear relationship between the thickness increase and mass uptake of a detent. the theory of diffusion, can be used to predict dimensional changes in the parts as a function of environmental conditions.
Predicted fractional regain curve at 21OC and 100% RH, with D = 4.8 x cm2/s. Circles represent measured values.
Calculated fractional regain curve at 5OoC and 100% RH, with D = 3.1 x cm2/s. Circles represent measured values.
Calculated frgcti3nal regain curve at 59OC and 96% RH, with D = 5.7 x 10- cm / s . Circles represent measured values.
This relationship in conjunction with
Calculated fracti nal regain curves at 71OC and 100% RH, with D = 1.4 x cm /s. Circles represent measured values.
Arrhenius plot of the diffusion coefficients as a function of temperature. The activation energy is 13.4 kcal/mole.
Fractional regain as a function of the product of the diffusion constant and time. Once the diffusion constant is calculated from Eq. 5, the time to a given fractional regain is easily determined.
Equilibrium concentration of water in a nylon 6,6 ("Zytel" 101) as a function of relative humidity. Nylatron values are approximately a factor of 2 smaller due to its large fraction of impermeable filler.
4
4
1 5
.093
t
t e173 'F u 1.062
FIGURE 1
16
+ +
4
3-
2 -
1-
0
X
+ + 0 + O
0 + 0 0 0 +
0 + 0
X + 0
+
X
I I 1 0 100 200 300 400
I E
X
X
X
x
X X
X
0 = 71c + = 50C x = 21c
FIGURE 2
30
25 n
8 E - 20
15
10
5
0
0
+
X
0 0 0
0
+ +
+
X X
X
+ + + +
+ +
x X
X X
X
X
0 = 71c + = 50C x = 21c
I I I I 0 100 200 300 400 500
TIME IN HOURS
FIGURE 3
18
25
2
1.5
1
0.5
0 0
0 0
O + o + +
O +
?+ 6
c
0 0
+
0
+
0
+
0
+
0
+
0
+
0
+
0
+
0
+
0
+
0
+
0
+
0
+
+
0-DECREASEIN THICKNI;,ss(Y I IS)
+ = I*FRACTIONAL YASS DECREASE
4 8 12 TIME IN HOURS
FIGURE 4
16 D
19
4
3
2
1
0 0
+ +
+ +Y +
0 + X
0
= 71C = 50C = 21c
0
/ x
I I I
1 2 3 X WATER
FIGURE 5
20
1
0.8 Y
d 0 w @ 0.6 J
f3 0.4 f-c u 6 U
2
02
(I
TEMP=2 1C RH= 100%
Dz4.8E- 10
I I 1 I I 100 200 300 400 500
TIME IN HOURS
FIGURE 6
1
0.8
c7
0.4 t., u 4 lz t( 02
0 0
TEMP=SOC RH= 100% D=3.1E-9
t I I I
sb 160 240 TIME IN HOURS
320 400
FIGURE 7
22
1
I 1 1 1 0 25 50 75 100 125
0.8
w E 0.6
u 02
0
TEMP=59C RH=96% D=5.7E-9
FIGURE 8
23
1
0.8 Y
6 CJ w
0.6 c7
d E Oa4 6
0 0
TEMP=7 IC RH= 100% D= 1.4E-8
20 40 60 TIME IN HOURS
80 1( D
FIGURE 9
24
9.5
8
7.5 I I I
29 31 3:2 (1/T)*1000 K
FIGURE 10
33 3.4
25
1
0.8
c5 W o$ 0.6 cs
0 - 0.4 F u d U c4 02
0 0 50 75 100
D*TI ME(HRS)* 1.M 125 150
FIGURE 11
26
4
MOISTURE CONTENT AS A FUNCfION OF RELATIVE HUMIDITY
0 0 7
6
6
4
3
2
FIGURE 12
27
D I STRI BUT1 ON
The Bendix Corporation K a n s a s City Division A t t n : C . H. Smith, D/814
S . L. DeGisi, D/814 R . B. Hendrick, D/822
P. 0. Box 1159 Kansas City, Missouri 64141
2153 C. W. Jennings 2336 C. R . Blaine 2336 N . M. Nelson 2540 K . Gillespie 2544 J. P. Ford 2544 L. D. Miller 5810 R . G. Kepler 5811 L. A. Harrah 5811 R . A. Assink 5811 R . J. Martinez 5811 K. E . Mead 5813 J. G. Curro 5813 D. D. Drummond 5813 M. R. Keenan (5) 5813 J. A. Sayre 5814 F. P. Gerstle 5814 L. Orear 5833 R . E. Fisher 8315 D. H. Doughty
3141 L. H. Erickson (5) 3151 W. L. Garner (3) 3154-4 C. Dalin (25)
for DOE/TIC 8214 M . A . Pound
L 28
'