moisture absorption properties of unidirectional glass ... · 1 in press, composites, part a, 2004...
TRANSCRIPT
1
In Press, Composites, Part A, 2004
Moisture Absorption Properties of Unidirectional Glass/Polymer Composites Used in Composite (Non-Ceramic) Insulators
L. Kumosa, B. Benedikt, D. Armentrout and M. Kumosa
Center for Advanced Materials and Structures,
Department of Engineering, University of Denver 2390 S. York St., Denver, CO 80208
Abstract Moisture absorption tests were performed on unidirectional glass/polymer composite materials used in high voltage composite (non-ceramic) insulators. The composites were based on E-glass, high seed count ECR-glass and low seed count ECR-glass fibers with modified polyester, epoxy and vinyl ester resins. The composites were exposed to a moist environment with a relative humidity of 80% at 50°C, and their resistance to moisture absorption in terms of the rate of moisture absorption, maximum moisture content and apparent diffusivities was determined. Moisture absorption in unidirectional composite specimens was also studied numerically in this work using finite element techniques. In particular, the effects of specimen geometry (the edge effect) and specimen orthotropy on moisture absorption by the composites were evaluated. Significant differences in the moisture absorption properties of the composites were found indicating that the effect of moisture on the mechanical and electrical properties of the insulators will depend on the type of composite used. It was shown that the vinyl ester based materials had the most favorable moisture diffusion properties for use in high voltage composite insulator applications. The modified polyester based composites exhibited the worst moisture absorption performance. The epoxy-based materials had adequate rates of absorption, however these materials did not reach equilibrium and kept slowly taking on more moisture in a non-Fickian manner. 1. Introduction Unidirectional glass reinforced polymer (GRP) composites have become a popular alternative to porcelain in the manufacture of high voltage insulators (see Figure 1) [1-23]. Their mechanical and electrical properties are of great importance, and both these factors will greatly depend on the presence of moisture in the composites. Under certain circumstances the GRP rods of composite insulators can be exposed to moisture ingress. This can happen if the end-fittings of the insulators are not protected against moisture [5,8-10,18,19]. Water can also penetrate the rubber-housing layer if the thickness of the rubber is insufficient, especially if the rubber is damaged by erosion (cracks or abrasion) [8,19]. The GRP rods of the insulators can also be damaged by gunshots [11] which seems to be a commonly occurring in-service phenomenon. Water inside can become nitric acid [10,13] causing brittle fracture [1-10,12-20]. However, if the acid
2
concentration is not high, brittle fracture will not occur [10]. Instead, the moisture will propagate along the GRP rod leading to electrical failures [8,10]. The brittle fracture process, which is actually stress corrosion cracking (SCC) of the rod composites based on E-glass fibers [5,7-10,12,17,19,20,24-30], can occur in the insulators and the initiation of SCC is strongly controlled by the water/acid diffusion through a polymer matrix [27-30]. It has been shown that brittle fracture of composite insulators can be prevented by the proper design of the composite rod materials [18,20,23,27-30]. However, to prevent SCC of the composites used in the insulators and thus brittle fracture, the water/acid absorption properties of the composites must be well understood. It has been shown that the electrical properties of the GRP rods depend very strongly on the amount of moisture absorbed [20,31,32]. In order to evaluate the effect of absorbed moisture on the electrical properties of composites used in composite insulators, the moisture absorption properties of the composites need to be first determined. Then, absorbed moisture vs. leakage current relations can be established [32]. There are several experimental and numerical procedures which can be used to evaluate the resistance of composite materials to moisture absorption [33-48]. In this study, the moisture absorption properties of the composites commonly used in composite (non-ceramic) insulators were investigated following well established experimental and numerical techniques. The composites were then compared for their resistance to moisture and a recommendation was provided on the most suitable glass/polymer composite system for composite insulator applications. 2. Finite Element Simulation of Moisture Absorption Moisture diffusion in materials can be simulated numerically using for example the finite element method (FEM). FEM can be used to solve the diffusion equation (1), which is given by the following formula [49]:
��
���
�
∂∂
∂∂+��
�
����
�
∂∂
∂∂+�
�
���
�
∂∂
∂∂=
∂∂
ztzyxc
Dzy
tzyxcD
yxtzyxc
Dxt
tzyxczyx
),,,(),,,(),,,(),,,( (1)
where c(x, y, z, t) denotes the moisture concentration, which depends upon position and time, Dx, Dy and Dz are diffusivities along x, y and z directions, respectively. In the case of a unidirectional composite plate, it has been assumed that the fibers are aligned along the x direction; therefore diffusivity Dx is different than the diffusivities corresponding to the remaining two directions. In order to determine the moisture distribution in a composite plate, boundary conditions have to be specified in addition to equation (1). It can be assumed that at the initial time t0, concentration c is equal to zero everywhere inside the plate. However, on the surfaces, the moisture concentration is different than zero, which corresponds to the fact that these surfaces are subjected to diffusion from the surrounding environment. The magnitude of
3
the initial concentration ci on the surfaces can only be determined from an experiment. However, if the magnitude of ci is known, the changes of concentration c with time can be quite easily determined from equation (1). ANSYS 6.1 [49] with 3D 8-node elements (Solid 70) was used in this study to generate finite element representations of isotropic and unidirectional composite plates with different thicknesses subjected to moisture. The width and length of the specimen was 50 mm. Due to symmetry conditions, it was sufficient to model only one-eighth of each plate. The FEM model of one of the considered plates with prescribed boundary conditions is presented in Figure 2. 3. Materials and Experimental Procedures 3.1 Materials tested for moisture absorption Eight unidirectional composites were tested based on three different glass fibers and three different polymer resins. The glass fibers were E-glass, ECR (high seed)-glass, and ECR (low seed)-glass fibers. All three types of fibers fall into the ASTM classification of E-glass, however the ECR-glass fibers are made with no added boron. It has been found that boron severely hampers a fiber’s ability to withstand corrosive environments. The terms low and high seed refer to the relative amount of gaseous inclusions within the glass fibers themselves. The high seed ECR-glass fibers have a larger fiber diameter (20 mm compared to the 14 mm of E-glass), whereas the low seed glass fibers have the same 14 mm diameter as the standard E-glass fibers along with a higher amount of TiO2. The three resins used were: modified polyester (polyester enhanced with a thermoplastic additive), epoxy (epoxy-anhydride) and vinyl ester (Bis A vinyl ester). The materials were made using the process of pultrusion and no post curing was applied to the final products. Glasforms, Inc provided all the materials. ECR (low seed)-glass/modified polyester was not provided by the manufacturer. 3.2 Specimen preparation process The composites were supplied by the manufacturer in the form of pultruded 50.8 mm x 6.35 mm x 304.8 mm plates. Specimens for the moisture absorption tests with the geometries of 50 mm wide and 50 mm long were made from the plates by machining. The ASTM standard [42] calls for a nominal-length-of-one-side to thickness ratio of 100:1 to minimize the effects of the edges. Since the recommended ratio of 100:1 was not feasible, different thickness values were used corresponding to 50:1 (1 mm thickness), 25:1 (2 mm thickness) and 12.5:1 (4 mm thickness) ratios. This would allow the evaluation of the effect of the edges. One 1 mm thick specimen, three 2 mm thick specimens and one 4 mm thick specimen were made for each of the eight materials, giving a total of five specimens per material. It was assumed in the preliminary stages of this research that thick specimens would generate moisture absorption data significantly affected by the edge effect. Thin specimens on the other hand would absorb moisture very fast and would be very susceptible to internal cracking due to machining. Therefore, it was decided to use the 2 mm thick specimens as the primary specimen geometry in the
4
moisture tests. This was the reason why one 1 mm thick, three 2 mm thick and one 4 mm thick specimens were made out of each composite plate. Major efforts were made to minimize the amount of damage in the specimens during machining. However, it cannot be assumed that damage caused by machining was entirely avoided even for relatively large specimen thicknesses (2 and 4 mm thick). Since no research has been done on the effect of specimen machining on the moisture tests, it is difficult to say what type of damage would affect the moisture results. It has been recently shown [31] that low and medium sandblasting applied to the composites does not affect the moisture absorption of the composites. However, if significant micro-cracks are generated in the composites, larger than the damage caused by sandblasting, their effect on moisture absorption could be significant. 3.3 Volume fractions of fibers The volume fractions of fibers in the eight investigated composite systems were determined. Ten SEM micrographs from randomly selected regions of a specimen for each of the materials were taken showing a high contrast between the fibers and the resin and fillers. This allowed us to separate the fibers from the remaining material and calculate the number of pixels in a SEM micrograph associated with fibers and the number of pixels associated with the resin and filler. This was accomplished with the aid of the UTHSCSA ImageTool 2.0 software package and the “threshold” tool. Microscopic work was done using a JEOL 5800LV scanning electron microscope using the backscatter electron detector and an operating voltage of 20kV. The results of this analysis are presented in Table 1. With the exception of the ECR (high seed)-glass/vinyl ester system all composites exhibited very similar volume fractions of fibers with the average fractions ranging from 53% to 57% with relatively little scatter. The ECR (high seed)-glass/vinyl ester composite specimens had an approximately 11% higher volume fraction of fibers. In further sections, when using the models for the edge effect, a value of 55% is used for all the materials except ECR (high seed)-glass/vinyl ester, which uses 66% instead. 3.4 Moisture absorption experiments The testing procedure closely followed the procedure detailed in ASTM standard D5229/D5229M-92 [42]. The specimens were ultrasonically cleaned in methanol to remove any oil residue and dirt from machining and then dried in a 60°C oven. The environment in the oven was not monitored for relative humidity, however the Denver climate is sufficiently dry to lead us to believe that any humidity in the oven during drying would have little impact on the moisture absorption process. Moreover, a 2-3% RH inside the drying oven would most likely be lost in the scatter of the measurements. Masses of the specimens were measured periodically during drying, and drying continued until no further change in weight was observed. The 1 and 2 mm specimens dried within a period of 2 months while the 4 mm thick specimens took significantly longer to dry.
5
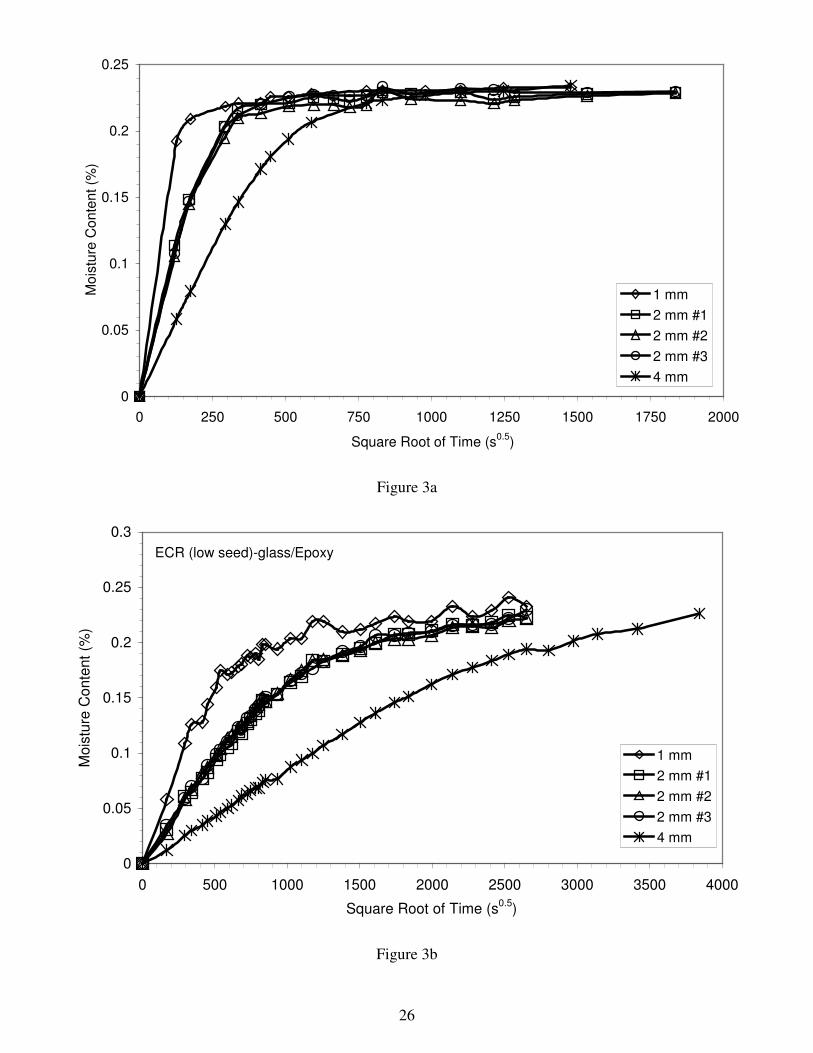
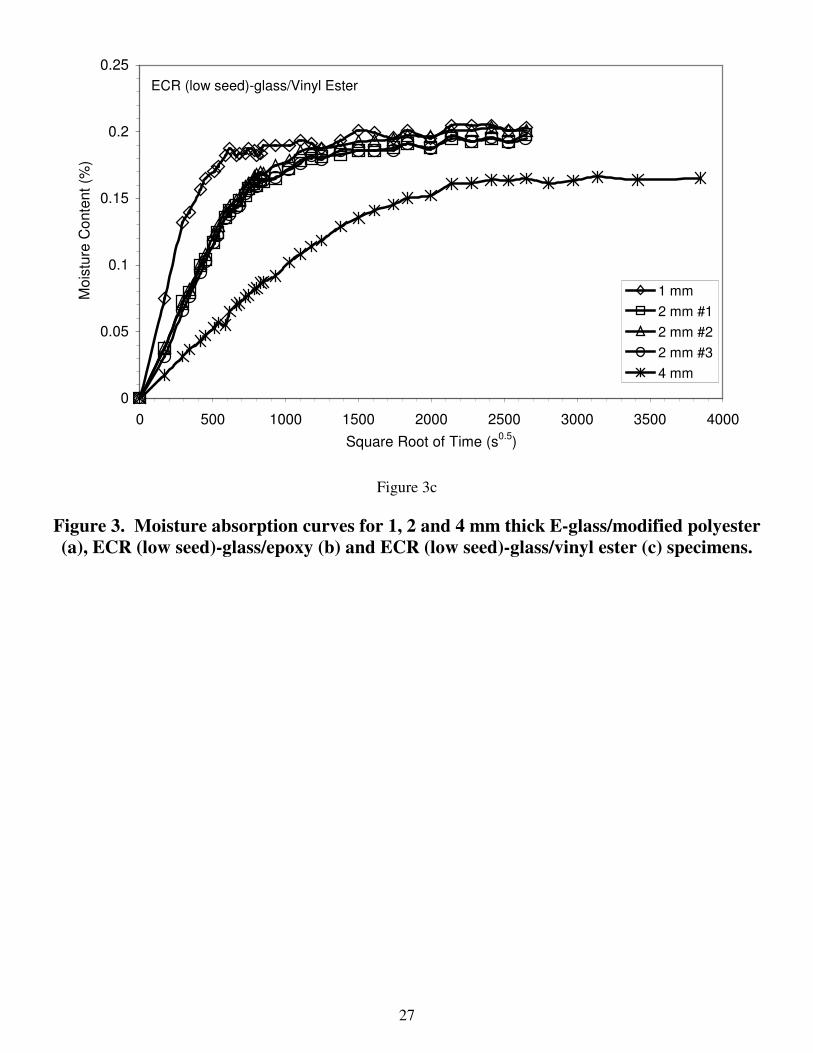
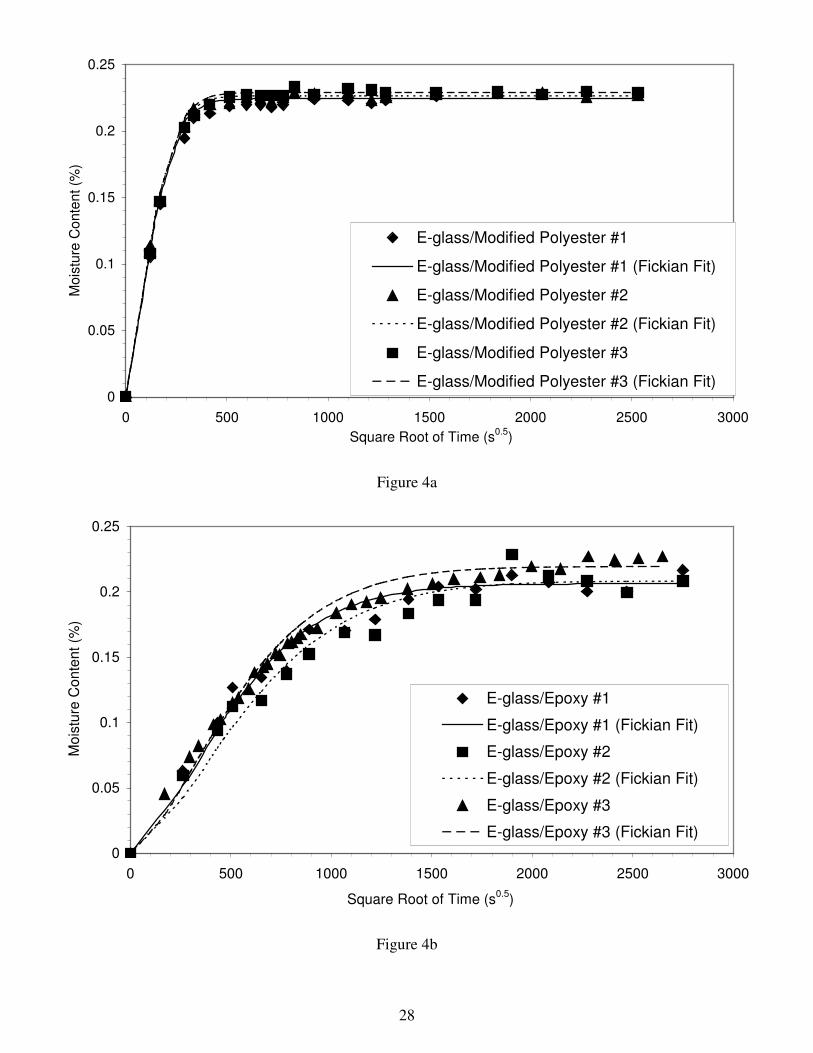
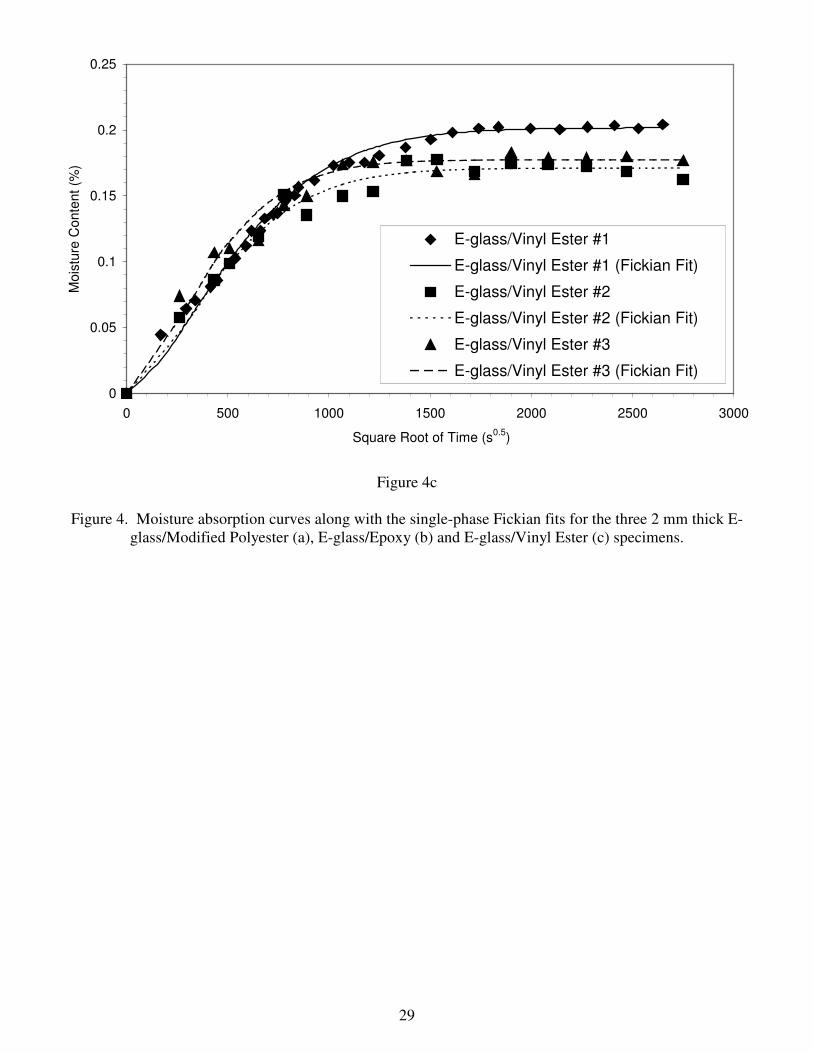
Once dried, the initial weights of the specimens were recorded and the specimens were immediately placed into a Standard Environmental Systems, Inc. model SHB/4 environmental chamber. A temperature of 50°C and a relative humidity of 80% were chosen for the environment. The temperature was kept within ±1°C, and the humidity was kept within ±3%, per ASTM standard D5229 [42]. The change in mass was measured, using a mechanical analytical balance with an accuracy of 0.1 mg, at changing intervals due to the irregular time measurements. The specimens were exposed to moisture until their reached equilibrium or a certain behavior was established. 4. Moisture Absorption Results The weight gain vs. square root of time ( t ) curves for each composite material was determined. As an example, the curves for the E-glass/modified polyester composite tested in three 2 mm thick specimens, one 1 mm thick and one 4 mm thick specimens are presented in Figure 3a, the corresponding curves for ECR (low seed)-glass/epoxy are presented in Figure 3b and for ECR (low seed)-glass/vinyl ester in Figure 3c. The specimen thickness effect is clearly visible in Figures 3a-c with the thinner specimens reaching equilibrium faster than the thicker ones, as expected. It can also be seen in Figure 3a that the maximum moisture contents for the modified polyester based composite were the same irrespective of the specimen thickness. However, not all composite systems behaved this way. In the case of the vinyl ester-based composites the 4 mm thick specimens reached equilibrium at lower moisture content (see Figure 3c). This could just be a matter of scatter considering only one 4 mm thick specimen was tested per material, however there were three unique composites based on the vinyl ester resin and in each case the 4 mm thick specimens did not reach the same MMAX, indicating a pattern among the 4 mm thick vinyl ester based composite specimens. The epoxy-based composites did not fully stabilized within the 3-4 months of moisture testing, for all specimen thickness and type of fibers, with the moisture content gradually increasing with time (see Figure 3b). Since only one 1 mm thick and one 4 mm thick specimen of each composite was tested, the scatter could not be evaluated for the thin and thick specimens. However, if the moisture data presented in Figure 4(a-c) for 2 mm thick specimens made of the E-glass/modified polyester (a), E-glass/epoxy (b) and E-glass/vinyl ester (c) composites are examined it can be seen that the scatter is relatively small taking into account all the possible effects on the moisture absorption measurements (drying, material defects, specimen variability, etc). The Fickian numerical fits are also plotted in Figure 4a-c, given by using the following equation [35]:
���
�
�
��
�
�
��
�
���
���
� ⋅−−=75.0
23.7exp1h
tDMM x
MAX (2)
where M is the moisture content at any given point in time (t), MMAX is the maximum moisture content, Dx is the diffusivity of the material through the thickness and h is the
6
thickness of the specimen. The term Dx is approximated from the experimental data using equation 3 [35]:
2
12
12
2
4 ��
�
�
��
�
�
−−⋅��
�
����
�=
ttMM
Mh
DMAX
A π (3)
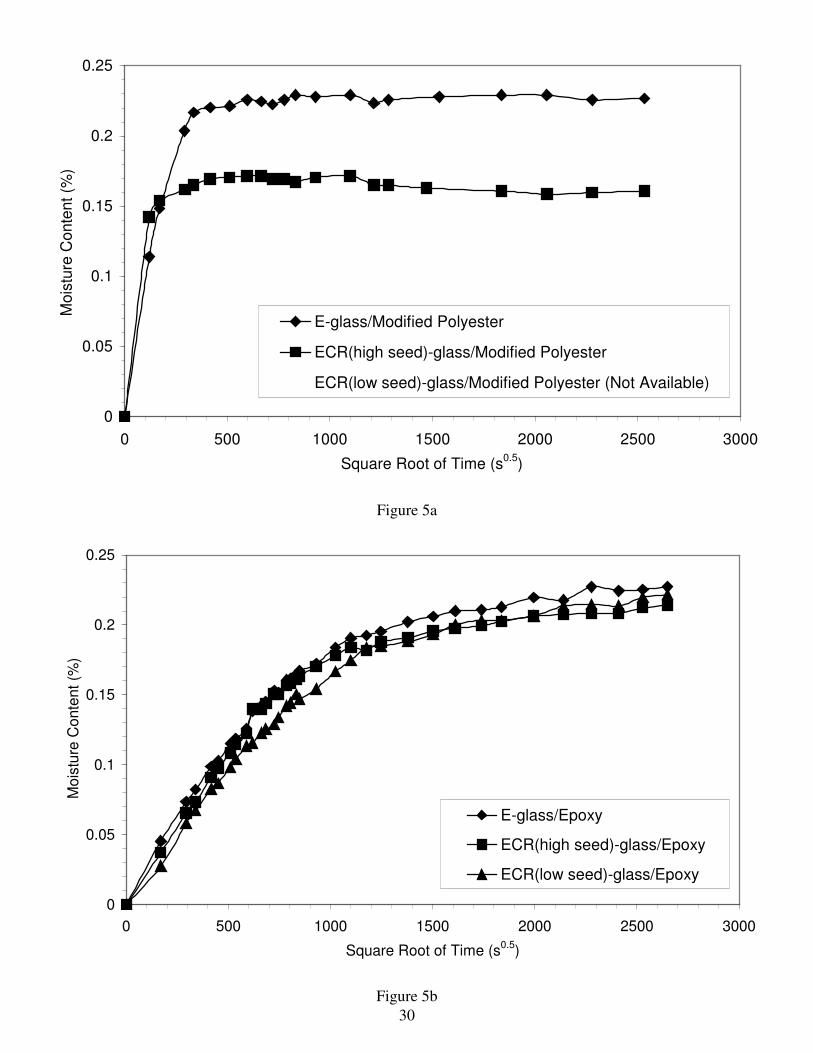
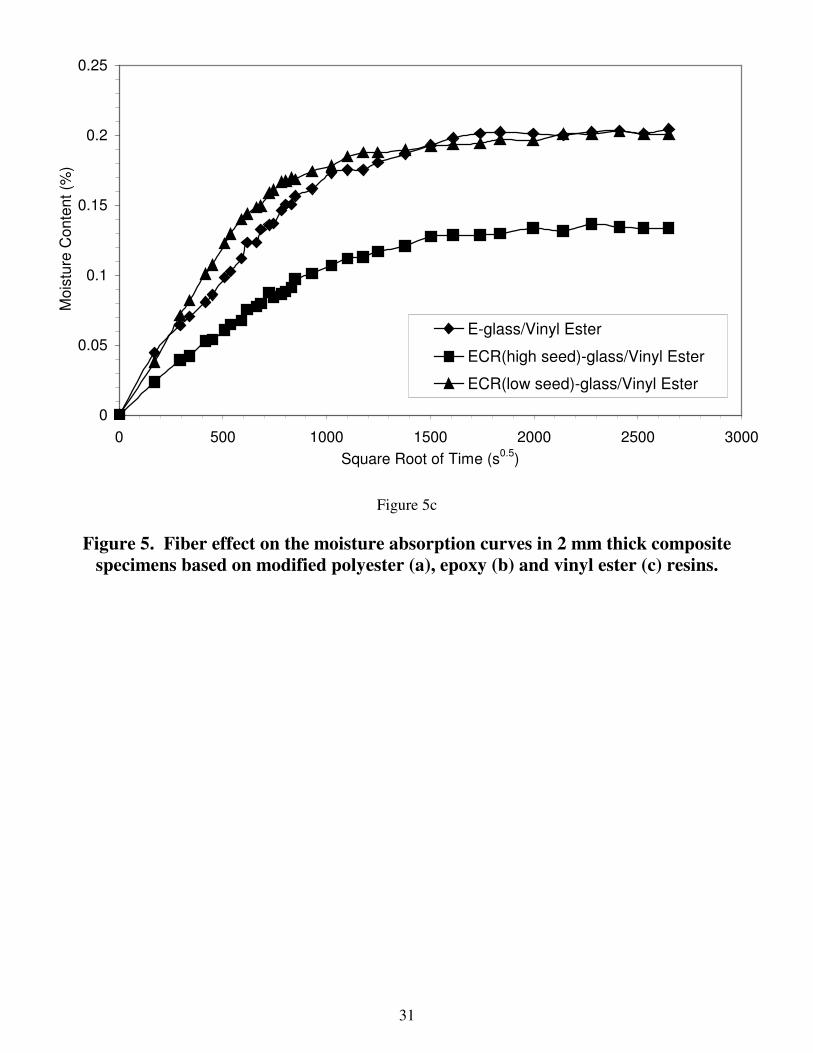
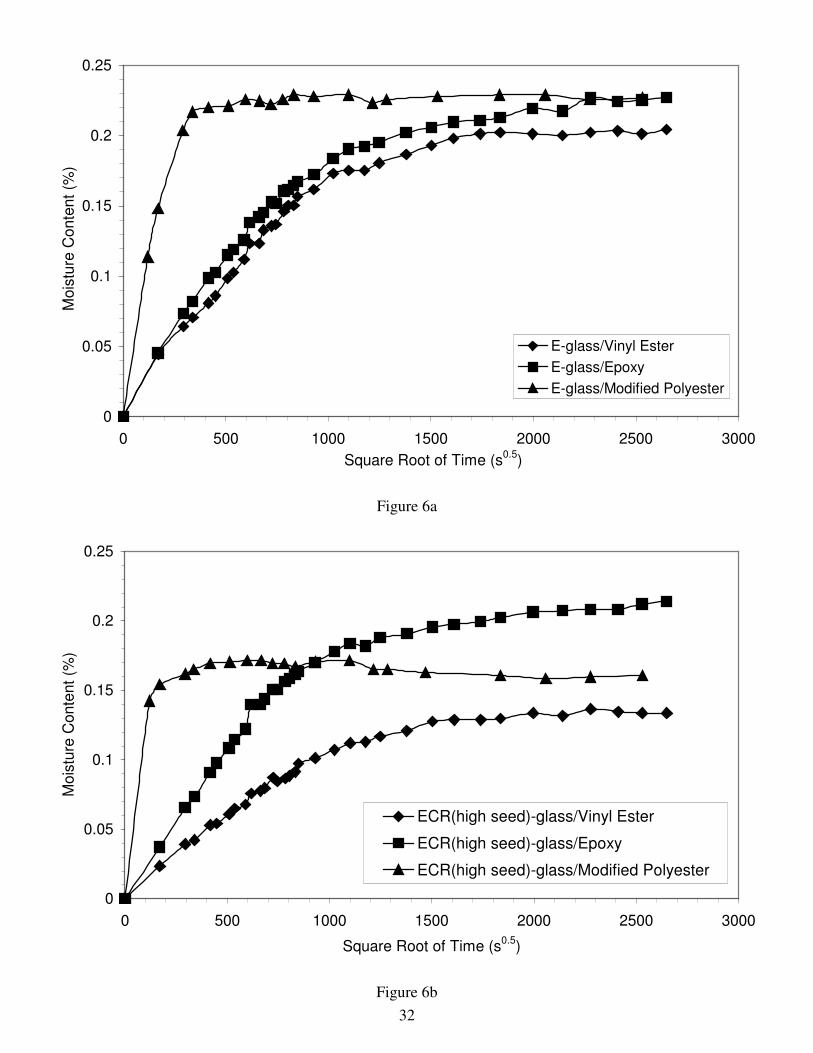
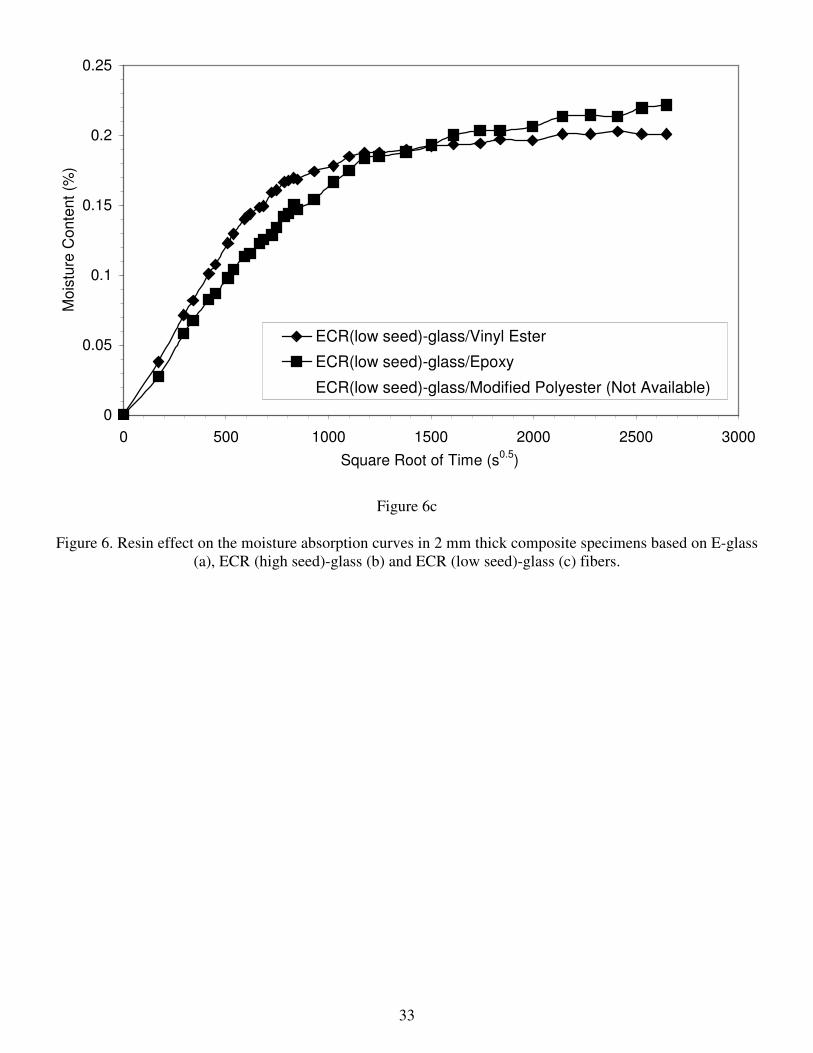
which neglects the effect of any edges and assumes that the total apparent diffusivity (DA) of a thin specimen is the same as the diffusivity through the thickness (Dx). The modified polyester and vinyl ester based composites appear to follow the Fickian numerical fits very closely. The epoxy-based composites did not follow the Fickian numerical fits with the moisture contents gradually increasing with time. This effect is further investigated in Section 7. It was observed that the moisture curves do not only depend on the specimen thickness but also on the type of glass fiber and the polymer resin. These effects can be seen in the data presented in Tables 2a-c. To better illustrate the fiber type effect on the moisture behavior, the moisture curves for one particular resin and three different glass fiber types are shown in Figures 5 for (a) modified polyester, (b) epoxy and (c) vinyl ester resins. The most representative curves for each composite from the 2 mm thick specimens were selected (one out of three tests) and presented in Figures 5a-c. The resin effect can be clearly seen in Figures 6a-c where the data from the 2 mm thick specimens are shown for three different resins with the E-glass (Figure 5a), ECR (high seed)-glass (Figure 6b) and ECR (low seed)-glass (Figure 6c) fibers. The most important observations from the moisture tests are listed below.
• All modified polyester based composites reached equilibrium for the 1, 2 and 4 mm thick specimens. The maximum moisture content in the 1, 2 and 4 mm thick specimens for any specific composite was found to be very similar (see Figure 3a). It was also found that the ECR (high seed)-glass/modified polyester material absorbed less moisture than its E-glass counterpart.
• All E-glass, ECR (high seed)-glass and ECR (low seed)-glass/epoxy composites
do not reach equilibrium for the 1, 2 and 4 mm thick specimens within the allotted time for the moisture experiments. They seem to have a second slower rate of moisture absorption. The amount of moisture in the 4 mm thick E-glass, ECR (high seed)-glass and ECR (low seed)-glass epoxy specimens is lower than in the corresponding 1 and 2 mm thick specimens (see Figure 3b).
• All E-glass, ECR (high seed)-glass and ECR (low seed)-glass/vinyl ester
composites reach equilibrium for the 1, 2 and 4 mm thick specimens. However, for each fiber type the 4 mm specimens reach equilibrium at much lower MMAX than the 1 and 2 mm thick specimens (see Figure 3c). Also, the maximum
7
moisture contents in the ECR (high seed)-glass/vinyl ester specimens were significantly lower than in the specimens based with the E-glass and ECR (low seed)-glass fibers and the same vinyl ester resin.
• There is a large effect of thickness on the rate of water absorption (slope). The 1
mm specimens reach equilibrium faster than 2 mm thick specimens, which in turn reach equilibrium faster than 4 mm thick specimens (see Figures 3a-c).
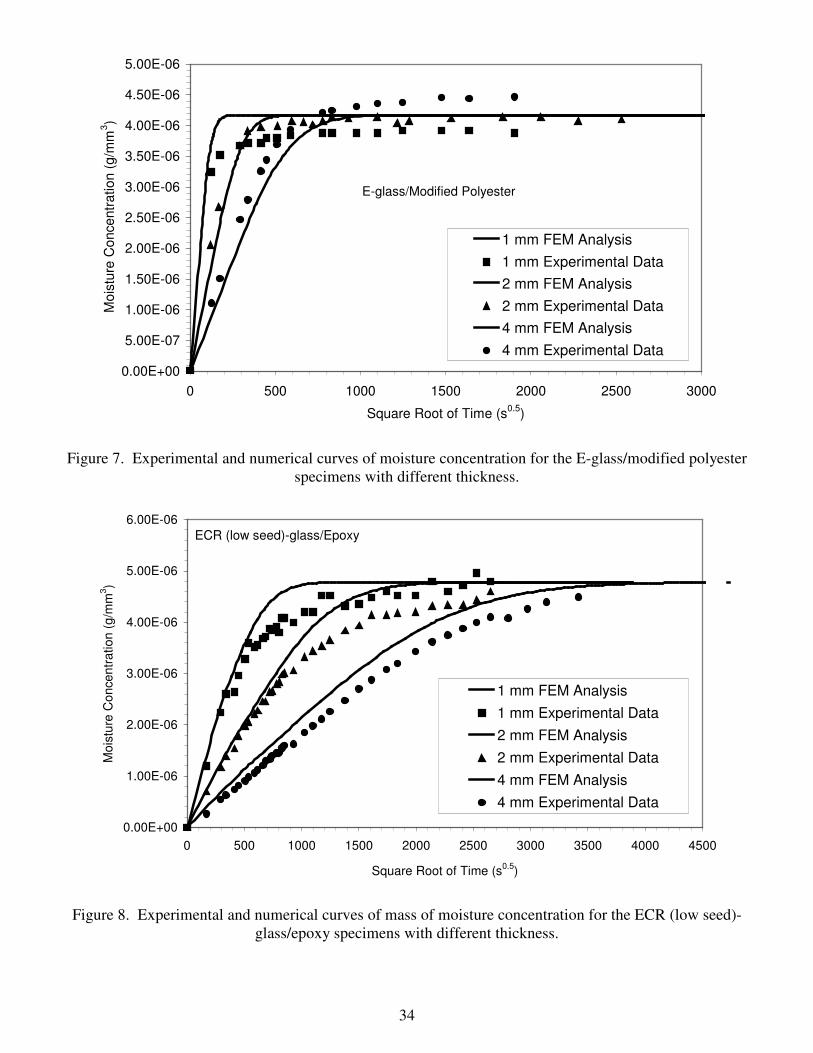
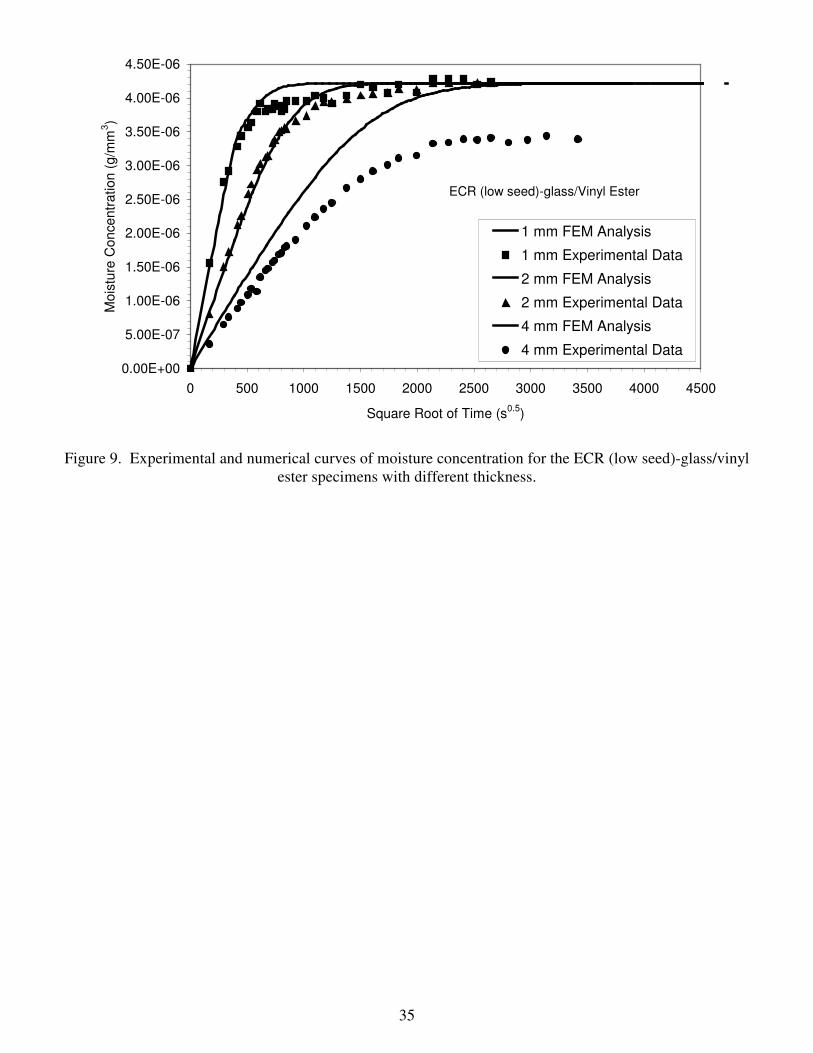
All the data from the moisture absorption tests for the eight investigated composite systems are shown in Table 2a-c. 5. Comparison of Experimental Results with FEM Predictions The moisture absorption curves for each composite and specimen thickness were also simulated using the finite element moisture absorption model as described in Section 2. This was done by calculating the apparent diffusivity (DA) and maximum (MMAX) moisture for each of the 1 and 2 mm thick specimens for each composite system and then calculating the average apparent diffusivity and average maximum moisture content. Since the maximum moisture contents of the 4 mm thick specimens were in some cases below that of the 1 and 2 mm thick specimens, the 4 mm thick specimens were left out of the averaging process. This averaged data was entered into the FEM model and numerical moisture absorption curves were calculated for the 1, 2 and 4 mm thick geometries. The average maximum moisture values had to be converted from percent of total specimen mass to moisture concentration (g/mm3). The experimental data was then also converted from percent to moisture concentration and plotted on the same curves. This process was performed for each of the eight composite systems and the results were examined. Examples of these numerical fits to the experimental data are shown for E-glass/modified polyester in Figure 7, for ECR (low seed)-glass/epoxy in Figure 8 and for ECR (low seed)-glass/vinyl ester in Figure 9. The agreement between the FEM model and the experiment was good for the 1 mm, 2 mm and 4 mm thick modified polyester based composite specimens. Since the epoxy based composites did not saturate in our tests, the agreement between the experiment and FEM model was reasonably good only for short and medium periods of time. For the vinyl ester based composites tested in the 1 mm and 2 mm thick specimens the agreement was always very good. On the other hand, the numerical predictions of the moisture curves for the 4 mm thick vinyl ester based specimens differed significantly from the experimental data. However, this can be expected since the data used for the numerical calculations came only from the thinner specimens. The relationships between the numerical and experimental data shown in Figures 7-9 are very representative for all the composite systems tested in this study. 6. Numerical Evaluation of the Edge Effect To select the most appropriate insulator rod composite with the highest resistance to moisture absorption, the moisture absorption results presented in Tables 2a-c need to be

8
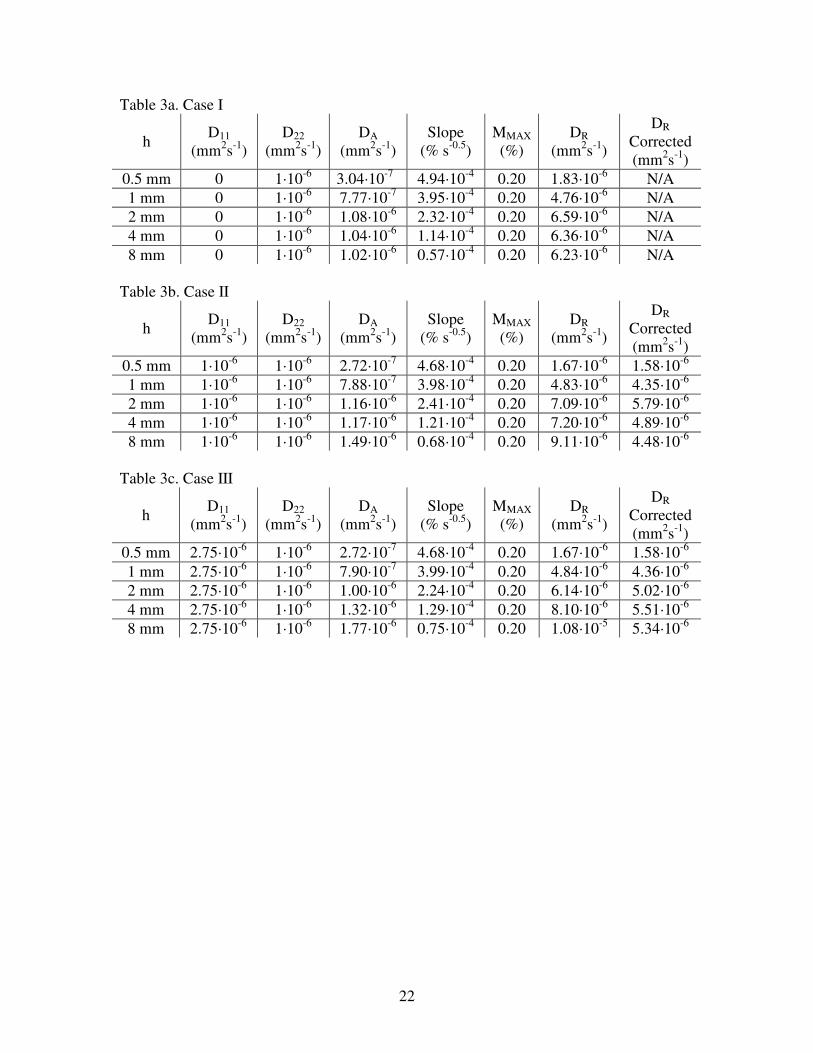
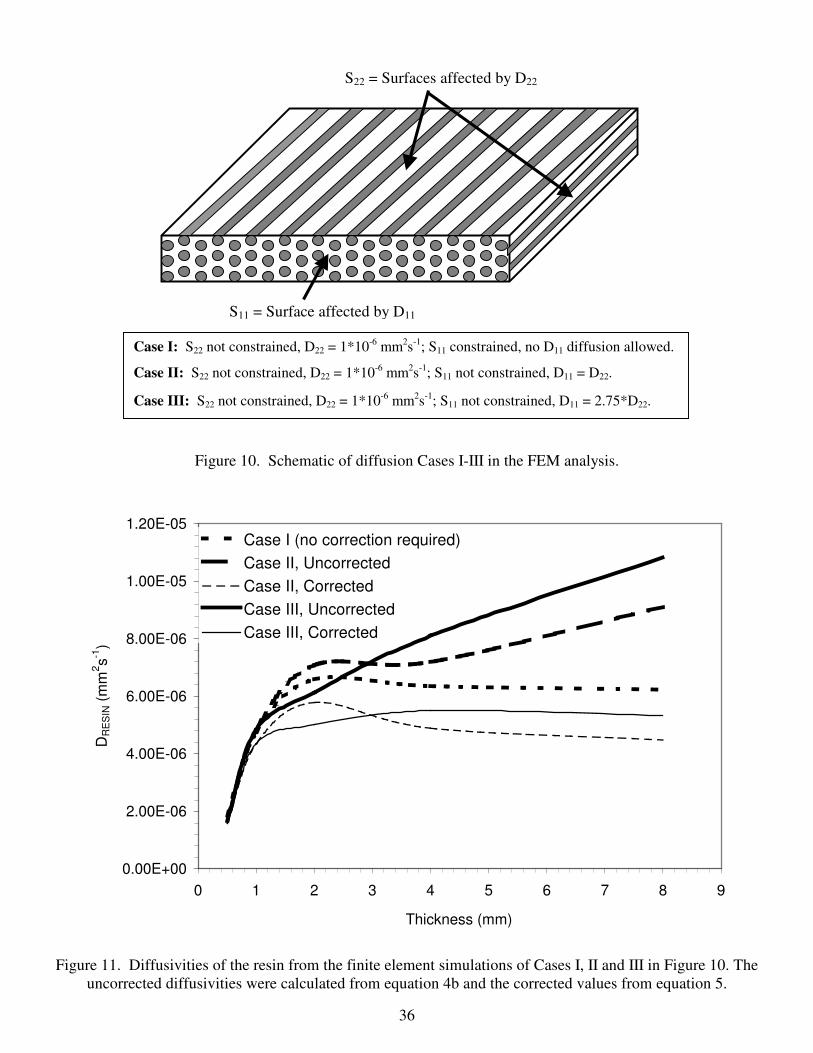
carefully evaluated. However, if we look at the data in these tables several effects can be immediately noticed. For example, a strong specimen thickness effect on the moisture data can be observed. Therefore, before any evaluation could be made of the response of different composite systems to moisture exposure, potential errors in the measurements of the diffusivity of the composites need to be carefully examined. In particular, the edge effect [35,42] and its influence on the moisture data in Tables 2a-c must be evaluated. According to the ASTM standard [42] the ratio between the width (l) and the thickness (h) of unidirectional composite specimens used in moisture absorption tests should be preferably larger than 100. If this is satisfied, the edge effect will be minimized (according to the standard) since the low l/h ratio will essentially eliminate the effect of the surfaces transverse to the fibers and the diffusion process will occur essentially only in the direction perpendicular to the fibers. Since the composite plates provided by the manufacturer had a nominal width of 50 mm, this dimension limited the width of the specimens used in the moisture absorption tests. To evaluate the edge effect and its influence on the moisture absorption data presented in Tables 2a-c, finite element calculations were performed to simulate moisture absorption by the 1 mm, 2 mm and 4 mm thick specimens (50 mm wide and 50 mm long). The following three different diffusion cases were considered (see Figure 10): Case I. No diffusion was allowed parallel to the fibers and the diffusion process was only perpendicular to the specimens. In this case the thickness of the specimens was finite (ranging from 0.5 to 8 mm) however their length and width were infinite. Case II. The same diffusion was allowed parallel and perpendicular to the fibers (D11=D22) and the specimens had the finite thickness (ranging from 0.5 to 8 mm) as well as the finite width (50 mm) and length (50 mm). Case III. The specimen thickness (between 0.5 and 8 mm), width (50 mm) and length (50 mm) were finite. Moisture diffusion was allowed along and perpendicular to the fibers however D11 was assumed to be different than D22, with D11/D22 = 2.75. These assumptions simulated the actual unidirectional E-glass/polymer composite specimens exposed to water. The D11 to D22 ratio of 2.75 was determined from Shen and Springer’s model [35] for parallel (equation 4a) and perpendicular (equation 4b) diffusion, assuming a 55% volume fraction of fibers (vf). This ratio would be even greater if the volume fraction of fibers were higher.
)1(11 fR vDD −= (4a)
���
����
�−= π
fR
vDD 2122 (4b)
For each diffusion case (Cases I, II and III) the rates of water absorption and maximum moisture contents (MMAX) were determined and the apparent diffusivities (DA) were calculated as a function of the specimen thickness. These numerical data are presented in Table 3. Then, the diffusivity of the resin (DR) was determined using equation 4b and
9
plotted as a function of the specimen thickness. The corrected diffusivity of the resin (DR) was also determined using equation 5; the correction procedure recommended in Ref. 35:
2
22
22
22
22
22
sin21cos)1(
sin21cos)1(
sin21cos)1(
sin21cos)1(
1sin21cos)1(
−
������
�
�
�
������
�
�
�
��
�
�
��
�
�−+−
��
�
�
��
�
�−+−
+
��
�
�
��
�
�−+−
��
�
�
��
�
�−+−
+��
�
�
�
��
�
�
��
�
�−+−=
απ
α
γπ
γ
απ
α
βπ
β
απ
αf
f
ff
ff
ff
ffAR
vv
vv
nh
vv
vv
lhv
vDD
(5)
where DR is the diffusivity of the resin, DA is the apparent diffusivity of a specimen, vf is the volume fraction of fibers and α, β and γ are the angles between the direction of the fibers and each axis in the specimen’s local Cartesian coordinate system as defined in Ref. 35. The uncorrected and corrected diffusivities of the resin for Cases II and III as well as the diffusivity of the resin for Case I as a function of the specimen thickness are shown in Figure 11. Since no edge effect was allowed in Case I these data did not have to be corrected. Obviously, from a perfect moisture absorption experiment, without the edge effect or any other undesirable effects for that matter, the diffusivity of the resin should not depend on the specimen thickness, and should be constant. However, if the data presented in Figure 11 is examined it is apparent that the uncorrected values of the diffusivity of the resin from Cases II and III are very strongly influenced by the specimen thickness effect. Even for Case I, where the edge effect was not allowed, the DR values rapidly decrease with a decrease in the specimen thickness. For larger values of the specimen thickness, larger than about 1 mm, the resin diffusivity is almost constant, as expected. The uncorrected values of DR for Case II (isotropic diffusion) and Case III (orthotropic diffusion) rapidly increase as a function of the specimen thickness. Only after the corrections for the edge effect, the data stabilize and become almost constant above approximately 1.5 mm specimen thickness indicating that the correction for the edge effect was successful in the specimen thickness range. However, similar to Case I for small specimen thickness, DR rapidly decreases (for both Cases II and III) with a decrease in the thickness. The results presented in Figure 11 and the above observations strongly suggest that there is also another effect that is responsible for this sudden reduction in DR for a small specimen thickness. As could be expected, the edge effect for the D11=D22 (Case II) is weaker than for the orthotropic case (Case III). Also, the corrected values of DR in the stable region for Case III are higher than for Case II suggesting that the correction procedure for the edge effect is useful but not exact. It can also be seen in Figure 11 that the DR values of the resin from the computations without the edge effect (Case I) are in between the uncorrected and corrected values of DR from the isotropic and orthotropic diffusions. This could also suggest that the correction for the edge effect underestimates the actual values of DR. In order to calculate apparent diffusivity DA, the slope of the initial part of the moisture content vs. square root of time curve must be determined. However, an error associated with this determination exists, which increases with the magnitude of the slope (rate of
10
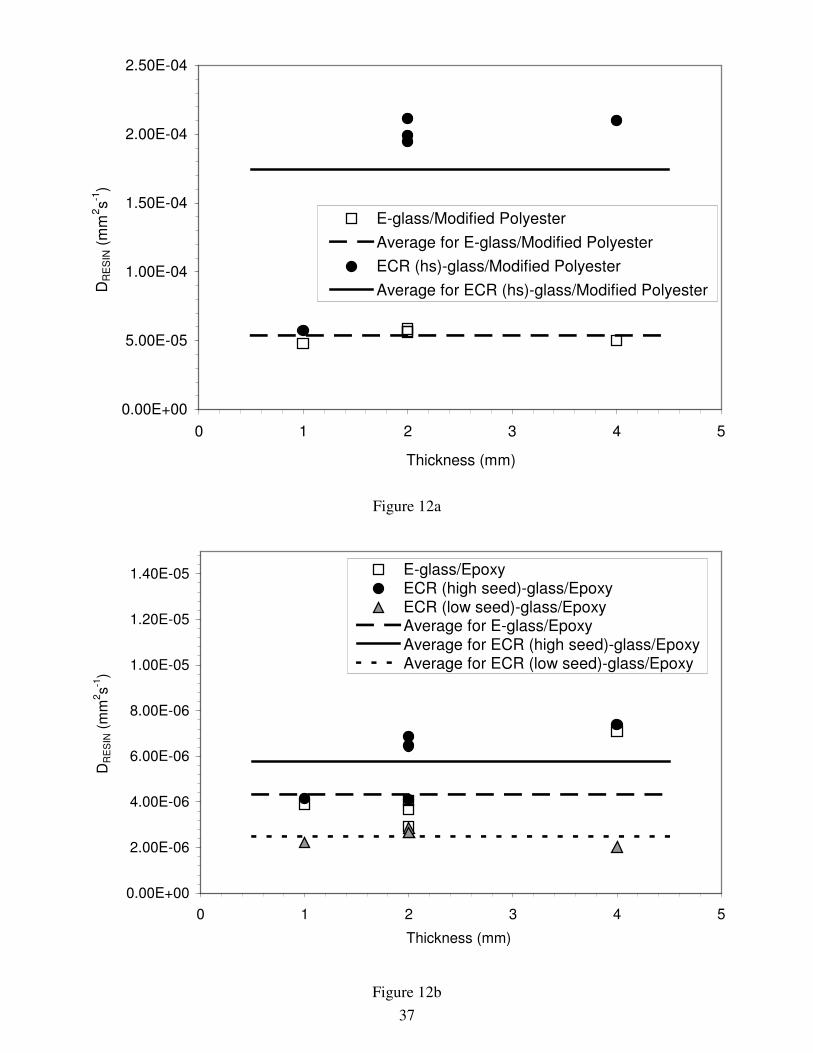
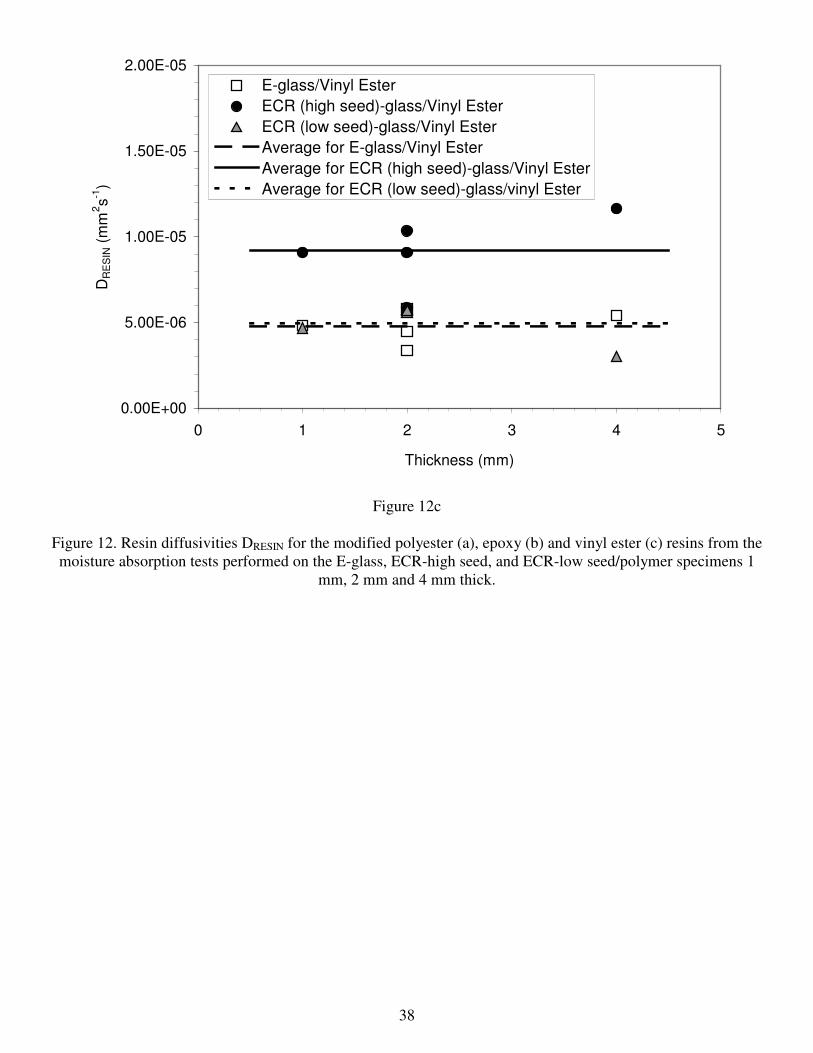
water absorption). This error occurs when a specimen absorbs water to fast. Due to this high rate of water uptake, the weight gain in the initial part of the moisture content vs. square root of time curves cannot be measured quickly enough since the specimen would end up spending too much time outside the humidity chamber, thus influencing the moisture absorption data. As a result, the initial slope determination used in equation 3 is underestimated since the specimen is already reaching equilibrium by the time the initial measurement is made. Consequently, the calculation of the initial slope leads to erroneous results for specimens that are either too thin or if they exhibit an extremely fast rate of water absorption. This error, can however be reduced by using specimens with a greater mass (larger specimen). It has been shown in this work that the moisture data presented in Tables 2a-c must be affected by the edge effect (especially for the 4 mm thick specimens) and by the error associated with the slope determination for the 1 mm thick specimens. Therefore, both sets of moisture absorption data in Table 2c, from the 1 mm and 4 mm thick specimens, could be significantly affected by the above two effects. However, the moisture data from the 2 mm thick specimens might not be noticeably affected by either the edge effect or the numerical error. The correction procedure for the edge effect was applied to the moisture data presented in Tables 2a-c and the diffusivity of the resins (modified polyester, epoxy and vinyl ester) were determined from the tests performed on the 1 mm, 2 mm and 4 mm thick specimens with the E-glass, ECR (high seed)-glass and ECR (low seed)-glass fibers. The uncorrected and corrected resin diffusivities from all the moisture absorption tests are presented in Table 4 whereas the plots of the corrected resin diffusivities for the modified polyester, epoxy and vinyl ester systems are shown in Figures 12a-c, respectively. Again, if the applied testing and correction procedures were accurate, the DR values for the three different resins should not depend on the specimen thickness. They should also not depend on the type of glass fiber (E-glass, ECR (low seed)-glass or ECR (high seed)-glass) providing that the volume fractions of fibers in the composites based on the same resin are the same. The predicted values of resin diffusivities for the modified polyester, epoxy and vinyl ester resin are shown in Table 4. Some of the 4 mm thick specimens were also corrected for their lower value of MMAX based on the assumption that the low maximum moisture values are artificial. These corrected values are presented in addition to the normal values (labeled with “*”) for comparison. Cleary, the data shown in Figures 12a-c and in Table 4 do depend on the type of glass fiber used with the largest difference in the DR values observed for the modified polyester based composites (Figure 12a). It seem that the differences are always the largest for the ECR (high seed)-glass composites if compared with the ECR (low seed)-glass and E-glass fiber systems. This could be caused by the differences in the fiber diameters which are similar for the E-glass and ECR (low seed)-glass fibers and significantly larger for the ECR (high seed)-glass fibers. For a constant volume fraction of fibers, larger diameter fibers would create less fiber/resin interfaces than smaller diameter fibers, thus severely
11
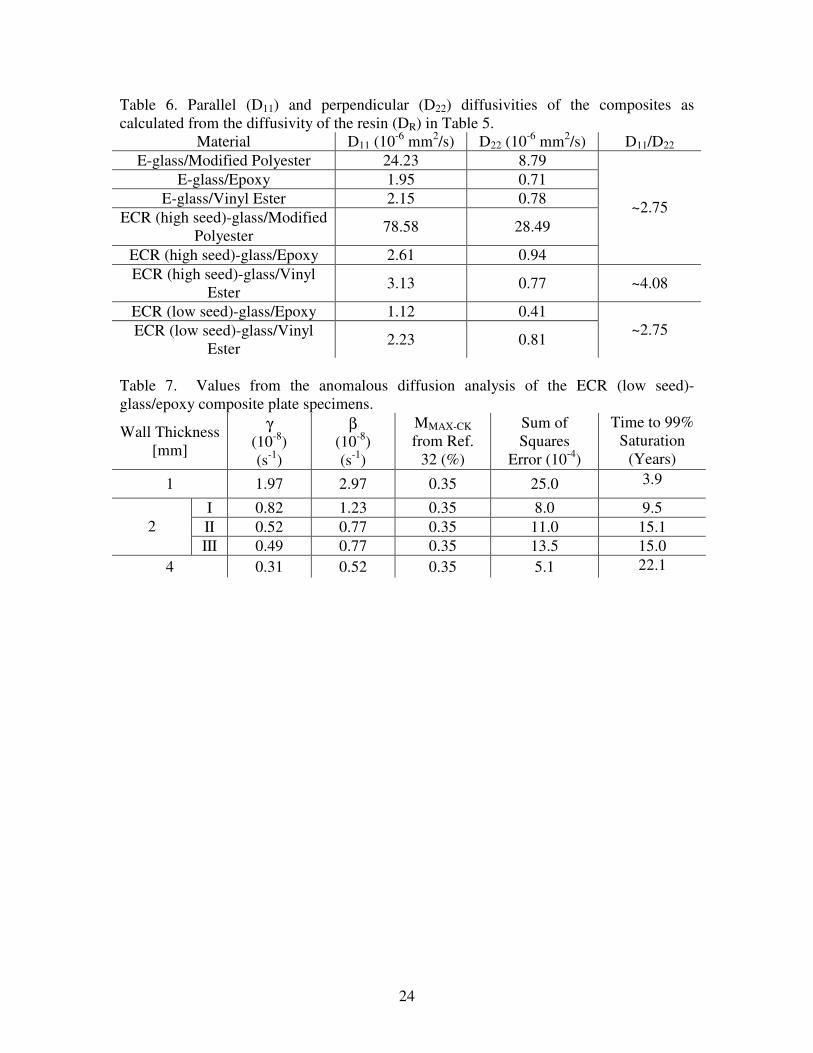
impacting the moisture absorption process. The quality of the interfaces themselves could also be responsible for the observed differences in the DR data for the three resins. Using the calculated values for the diffusivity of the resins listed in Table 5, the parallel (D11) and perpendicular (D22) diffusivity of the composites can be calculated using Shen and Springer’s model parallel and perpendicular diffusion [35]. These data are shown in Table 6. It can be seen that in the case of each of the composites, the diffusivity in the direction of the fibers is much higher than in the direction perpendicular to the fibers. For each of the composites, except ECR (high seed)-glass/vinyl ester, the value of D11/D22 is approximately equal to 2.75. As was discussed earlier, this value is determined by the volume fraction of fibers. ECR (high seed)-glass/vinyl ester has a higher volume fraction of fibers (66%) than the other composites (55%) and therefore its D11/D22 is much higher at around 4. 7. Anomalous Diffusion Analysis The analysis presented in the previous sections deals with single-phase diffusion where there is only one phase of moisture uptake followed by equilibrium. Anomalous diffusion implies numerous different phases of moisture sorption leading to a final equilibrium [43-48]. The behavior of the epoxy-based composite materials investigated in this research has been demonstrated to be anomalous (non-Fickian) (see Section 4). This type of diffusion cannot be readily analyzed using the single-phase methods presented above; a multi-phase diffusion model is needed which describes the physical behavior of the material. One such model was presented by Carter and Kibler, based partially on Langmuir’s model [44]. This model uses the assumption that moisture in materials with anomalous (two-phase) diffusion occurs in two distinct yet related phases. The first is the absorption of water molecules in the mobile phase into the material with a diffusion coefficient Dγ. Next, the molecules are bound to the molecular structure of the resin with a probability γ and become unbound with a probability β. Using these assumptions, Carter and Kibler devised a model for the analysis of moisture absorption in materials with anomalous diffusion characteristics. A convenient approximation of this model is presented below [44]:
( ) ( ) κβγβγ
βπβγ
β βγβκ
γ <<��
�
�
��
�
�−+−
++
���
�
�−
+= −−−
∞
=
−−
− 2,2;18
1)(
122
2
tttodd
l
tlt
CKMAX eeel
eeMM
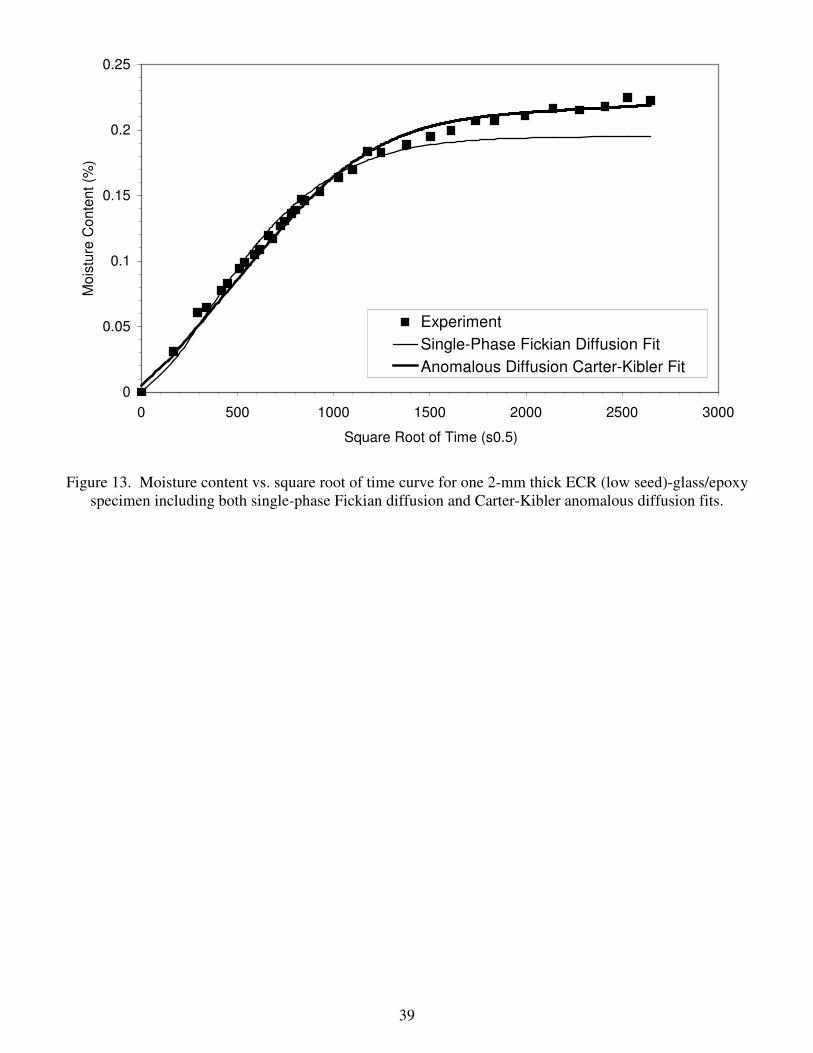
( )22 2/ δπκ γD= (6) The value of Dγ can be assumed from simple single-phase diffusion in equation 3. The necessary MMAX value used to calculate Dγ in equation 3 is chosen to give the best possible fit for the initial slope and first knee in the moisture content vs. square root of time curves, up to the second phase of diffusion. Also, it should be observed in equation 6 that Carter and Kibler assumed no difference in the values of γ and β for specimens of different thickness. It stands to reason that if increasing thickness alters a specimen’s
12
geometry, it’s volume increases much faster than it’s surface area. Therefore, the flow of moisture is considerably hindered in thicker specimens, decreasing proportionally the probabilities of binding γ and unbinding β of water molecules in the resin. Yet this is not accounted for in Carter and Kibler’s model for anomalous diffusion (see equation 6) [32]. Therefore, γ and β should be proportionally smaller as specimen thickness increases. A similar analysis using this model for anomalous diffusion has been performed for ECR (low seed)-glass/epoxy thin walled composite tubes [32]. In that study, a prediction of MMAX-CK and time to full saturation was presented. Using the value of MMAX-CK obtained from previous work (~0.35%), we can perform an analysis of the value of β and γ for the plate specimens considered in this work. Equation 6 was fitted to the experimental data for the five ECR (low seed)-glass/epoxy specimens using non-linear regression analysis/least squares fitting. The values of γ, β and MMAX-CK, along with associated sum-of-squares errors and times to 99% saturation are presented in Table 7. As an example, the moisture content vs. square root of time for one of the 2mm thick specimens is presented in Figure 13 along with both a single-phase Fickian fit (see equation 2) and the Carter-Kibler anomalous diffusion fit (see equation 6). It is clear that this anomalous diffusion model provides a better fit to the experimental data than the single-phase model. The data in Table 7 show that there is also considerable effect of thickness on the values of γ and β, as described in previous work [32]. Also, the magnitude of error in this type of analysis decreases as specimen thickness increases. This is expected since there appears to be more scatter between individual points in the thinner specimens than in the thicker ones. Using Carter and Kibler’s model for anomalous diffusion based on water binding/unbinding, we are able to also predict the time to saturation with a criterion for saturation of 99%. Those values are also shown in Table 7. As would be expected, the thicker the specimens, the more time is required to reach 99% saturation. What is surprising is the extreme difference between saturation in the specimens with single-phase diffusion (~2-4 months, depending on materials and thickness) and the specimens with anomalous diffusion (~4-20 years, depending on thickness). 8. Discussion 8.1 Evaluation of the moisture absorption results It has been shown in this research that not all unidirectional glass/polymer composites will exhibit the same behavior when exposed to moisture. Some composites will saturate relatively quickly and the saturation will not depend on the geometry of the specimens. Other composites will not readily saturate and will gradually absorb moisture without following the single-phase diffusion model. The glass/epoxy systems are the best examples of this behavior. These could be caused by numerous effects, for example: the void content in the resin, the quality of the fiber matrix interfaces, relaxation of the resin in the presence of moisture and elevated temperature, the binding of water molecules to the molecular structure of the resin, etc. For this type of behavior in the presence of
13
moisture, the single phase Fickian model devised by Shen and Springer [35] does not accurately portray moisture absorption characteristics. Therefore, a two-phase model developed by Carter and Kibler was utilized which assumed the binding and unbinding of water molecules to the resin [44]. It should be noted, that the anomalous diffusion exhibited by the epoxy-based composites most likely is affected by more phenomena than just water binding, however a model taking into account these various phenomena is not presently available. For that reason, a model describing one specific phenomenon was chosen. The volume fraction of fibers and most likely their diameters will also affect the moisture data, as expected. Since the ECR (high seed)-glass/vinyl ester composite specimens exhibited significantly higher volume fractions of fibers (approximately 66%) in comparison with the other seven composite systems (between 53% and 57%) the rates of moisture absorption and the maximum moisture contents obtained from those specimens were much lower than the corresponding data for the other system (see Tables 2a,b). However, the effect of the much higher volume fraction of fibers of the ECR (high seed)-glass/vinyl ester composite did not affect its apparent diffusivity which seems to be very similar to the diffusivities of the E-glass/vinyl ester and ECR (low seed)-glass/vinyl ester composites (Table 2c). In the calculations of DA both effects (lower diffusion rate and lower moisture content) cancelled each other out. The above observations clearly indicate that for the proper evaluation of moisture properties of the composites their volume fraction of fibers must be known. All of the moisture absorption data presented in this study were obtained from the composite specimens which were prepared by surface grinding. Surely, this type of machining must have caused a certain amount of damage to the composites, affecting their resistance to moisture. It can be expected that the resistance to damage caused by machining is related to the fracture toughness of the polymer resins and the toughness of the glass fiber/resin interfaces. This issue has been briefly examined by Kumosa et al. [29,30] by examining the micro-hardness of the polymer resins in the E-glass and ECR-glass composites investigated in this study. It was found that the micro-hardness of the modified polyester based composites was the highest followed by the micro-hardness of the epoxy and vinyl ester based composites. Since the micro-hardness of polymers is usually inversely proportional to their micro-toughness, the vinyl ester based composites should have the highest resistance to damage caused by machining due to their low micro-hardness. The modified polyester based composites should have the largest amounts of damage caused by machining. However, detailed SEM observations revealed no visible damage to the composites neither in the matrix, glass fibers nor at the interfaces. Therefore, the effect of machining on the moisture data obtained in this project can be safely ignored. The only observation that cannot be explained at the moment is the apparent lower maximum moisture contents in the 4 mm thick vinyl ester based composite specimens (see Table 2b) in comparison with the data from the 1 mm and 2 mm thick specimens. The thickness of the specimens should affect the rates of moisture absorption and
14
diffusivities but not the maximum moisture contents. It is unclear why all 4 mm thick specimens from these vinyl ester based composites behaved this way. 8.2 Rating of the glass/polymer composites for their resistance to moisture absorption The ultimate goal of this research was to provide a ranking of the unidirectional E-glass, ECR (high seed)-glass and ECR (low seed)-glass fiber composites with the modified polyester, epoxy and vinyl ester resins for their resistance to moisture absorption. Since moisture has an extremely negative influence on the electrical and mechanical properties of composite high voltage insulators [20,31,32], the resistance of the composites to moisture absorption should be as high as possible. The best insulator rod composite should have the slowest moisture absorption rate and the lowest amount of the absorbed moisture. If we look at the moisture absorption data presented in Tables 2a-c for the 2 mm thick specimens, the ECR (high seed)-glass/modified polyester system has the fastest rate of water absorption (slope) followed by E-glass/modified polyester. Also, the ECR (high seed)-glass/modified polyester has the highest apparent diffusivity followed by E-glass/modified polyester. Since ECR (low seed)/modified polyester was not available for the moisture absorption tests, it cannot be compared with the other composite systems. Considering the fact that the fiber type (for the same resin) has an effect on moisture absorption it can be stipulated that an ECR (low seed)-glass/modified polyester system would have somewhat different moisture absorption properties as the other two E-glass and ECR (high seed)-glass/modified polyester composites. Most likely, taking into account the behavior of fibers in the vinyl ester based composites, the ECR (low seed)-glass/modified polyester composite would behave similar to the E-glass/modified polyester material. Therefore, the composites based on modified polyester cannot be recommended for high voltage composite insulator applications. The low resistance of the composites to moisture uptake will certainly increase the possibility of brittle fracture and electrical failures of composite insulators. The epoxy and vinyl ester based composite systems appear to have very similar resistance to moisture uptake in the initial stage of moisture exposure. However, it was found that all of the epoxy-based composites did not reach equilibrium within the allotted time for the moisture experiment with the moisture content in the composites gradually increasing with time. This could suggest that the epoxy-based composites are rather unstable when exposed to moisture. Since this effect was not observed in the case of the vinyl ester based composites, these composites have superior resistance to moisture exposure. Conclusions 1. The moisture absorption testing on glass/polymer composite is a fairly straightforward procedure. However, the interpretation of the experimentally obtained moisture data can be much more complicated. Many effects can influence the proper interpretation of the moisture absorption results. In particular, the specimen geometry effect needs to be
15
considered. If the edge effect is not eliminated, the moisture absorption data will be very strongly dependent on the specimen geometry. Even if the edge effect is eliminated by testing very thin composite specimens with large (l/h) ratios, the numerical error associated with the determination of the rates of water absorption can significantly distort the actual moisture absorption data. 2. Unidirectional E-glass and ECR-glass polymer matrix composites used in high voltage composite insulators have been tested for their resistance to moisture absorption at 50°C in 80% relative humidity. It has been shown in this research that the modified polyester based composites with either E-glass or ECR-glass fibers have the highest moisture uptake with the largest rates of water absorption. The other composites based on epoxy and vinyl ester have much lower rates of water absorption. However, the epoxy based composites with E-glass and ECR-glass fibers were found to gradually absorbed moisture without reaching equilibrium, indicating non-Fickian behavior. 3. A noticeable fiber effect was found to exist on the moisture absorption properties of the composites based on the three resins. In general, composites based on the ECR (high seed)-glass fibers take smaller amounts of moisture than their E-glass and ECR (low seed)-glass fiber-based counterparts. 4. Based on the experimental data obtained in this study, the following ranking of the composites for their water absorption resistance is recommended for high voltage composite insulator applications:
#1. (Best) All vinyl ester based composites with either E-glass, ECR (low seed)-glass or ECR (high seed)-glass fibers,
#2. All epoxy based composites with either E-glass, ECR (low seed)-glass or ECR (high seed)-glass fibers (non-Fickian behavior observed),
#3. (Worst) All modified polyester based composites with either E-glass, ECR (low seed)-glass or ECR (high seed)-glass fibers.
References
1. S.J. Harris, B. Noble and M.J. Owen, “Metallographic Investigation of the Damage Caused to GRP by the Combined Action of Electrical, Mechanical, and Chemical Environments,” J. Material Science, Vol. 19, (1984) pp. 1596-1604.
2. A. Akhtar, J.S. Nadeau, J.Y. Wang, D.P. Romily and C. Taggart, “Brittle Fracture
of Non-Ceramic Insulators,” Report for the Canadian Electrical Association (186 T 350), Prepared by the British Columbia Hydro and Power Authority, September 1986.
16
3. M.J. Owen, S.J. Harris and B. Noble, “Failure of High Voltage Electrical Insulators with Pultruded Glass Fiber-Reinforced Plastic Cores,” Composites, Vol. 17, (1986), 217-226.
4. A. Akhtar and J.Y. Wong, “Failure Analysis of Brittle Fracture in Nonceramic
Insulators”, J. Composite Technology and Research, Vol. 9, (1987) pp. 95 –100.
5. M. Kumosa et al., Micro-Fracture Mechanisms in Glass/Polymer Insulator Materials under Combined Effects of Electrical, Mechanical and Environmental Stresses, Final Report to the Bonneville Power Administration, Electric Power Research Institute and the Western Area Power Administration, Oregon Graduate Institute, Portland, Oregon, July 1994.
6. M. Kumosa, Q. Qiu, E. Bennett, C. Ek, T. S. McQuarrie and J. M. Braun, “Brittle
Fracture of Non-Ceramic Insulators,” in the Proceed. Fracture Mechanics for Hydroelectric Power Systems Symposium '94, Canadian Committee for Research on the Strength and Fracture of Materials (CSFM), BC Hydro, Sept. 1, 1994, pp. 235-254.
7. Q. Qiu, “Brittle Fracture Mechanisms of Glass Fiber Reinforced Polymer
Insulators,” Ph.D. Thesis, Oregon Graduate Institute of Science & Technology, Portland, Oregon, October 1995.
8. M. Kumosa and Q. Qiu, “Failure Analysis of Composite Insulators (Failure
Investigation of 500 kV Non-ceramic Insulators for Pacific Gas & Electric Company),” Final Report to the Pacific Gas and Electric Company, May 1996, Department of Engineering, University of Denver.
9. M. Kumosa, H. Shankara Narayan, Q. Qiu and A. Bansal, “Brittle Fracture of
Non-Ceramic Suspension Insulators with Epoxy Cone End-Fittings,” Composites Science and Technology, Vol. 57, (1997) pp. 739-751.
10. Interview with Maciej Kumosa, “Research of Brittle Fractures in Composite
Insulators,” Insulator News & Market Report, July/August (1997) pp. 46-51.
11. J.T. Burnham and R.J. Waidelich, “Gunshot Damage to Ceramic and Nonceramic Insulators,” IEEE Transactions on Power Delivery, Vol. 12, No. 4 (1997) pp. 1651-1656.
12. M. Kumosa et al., “Micro-Fracture Mechanisms in Glass/Polymer Insulator
Materials under the Combined Effect of Mechanical, Electrical and Environmental Stresses,” Final report to BPA, APA, PG&E, WAPA and NRECA, University of Denver, Denver, Colorado, December 1998.
17
13. A. R. Chughtai, D. M. Smith and M. Kumosa, “Chemical Analysis of a Field-Failed Composite Suspension Insulator,” Composite Science and Technology, Vol. 58, (1998) pp. 1641-1647.
14. D. Armentrout, T. Ely, S. Carpenter, and M. Kumosa, “An Investigation of Brittle
Fracture in Composite Materials Used for High Voltage Insulators,” Journal of Acoustic Emission, Vol. 16, No. 1-4, (1998) pp. S10-S18.
15. T. S. McQuarrie, “Improved Dielectric & Brittle Fracture Resistant Core Rods for
Non-Ceramic Insulators,” Insulator 2000 World Congress on Insulator Technologies for the Year 2000 & Beyond, Barcelona, Spain November 14-17, 1999.
16. S. H. Carpenter and M. Kumosa, “An Investigation of Brittle Fracture of
Composite Insulator Rods in an Acidic Environment with Static or Cyclic Loading,” Journal of Materials Science, Vol. 35, Issue 17 (2000) pp. 4465-4476.
17. C. de Tourreil, L. Pargamin, G. Thevenet and S. Prat, “’Brittle Fracture’ of
Composite Insulators: Why and How they Occur,” Power Engineering Society Summer meeting 2000, Vol. 4, 2000, pp. 2569-2574.
18. M. Kumosa et al., “Fracture Analysis of Composite Insulators,” EPRI, Palo Alto,
CA: 2001. 1006293.
19. J. T. Burnham, T. Baker, A. Bernstorf, C. de Tourreil, J.-M. George, R. Gorur, R. Hartings, B. Hill, A. Jagtiani, T. S. McQuarrie, D. Mitchell, D. Ruff, H. Schneider, D. Shaffner, J. Yu and J. Varner, “IEEE Task Force Report: Brittle Fracture in Non-Ceramic Insulators,” IEEE Transaction on Power Delivery, Vol. 17, No. 3 July, 2002.
20. M. Kumosa et al, “Failure Analysis of Composite High Voltage Insulators,”
EPRI, Palo Alto, CA: 2002. 1007464
21. M. Kumosa, Y. Han and L. Kumosa, “Analyses of Composite Insulators with Crimped End-Fittings: Part I – Non-linear Finite Element Computations,” Composites Science and Technology, Vol. 62 (2002) pp. 1191-1207.
22. M. Kumosa, D. Armentrout, L. Kumosa, Y. Han and S.H. Carpenter, “Analyses
of Composite Insulators with Crimped End-Fittings: Part II – Suitable Crimping Conditions,” Composites Science and Technology, Vol. 62 (2002) pp. 1209-1221.
23. D. Armentrout, M. Kumosa and T. S. McQuarrie, “Boron Free Fibers for
Prevention of Acid Induced Brittle Fracture of Composite Insulator GRP Rods,” IEEE Transactions on Power Delivery, Vol. 18, No. 3 (2003) pp. 684-693.
18
24. Q. Qiu and M. Kumosa, “Corrosion of E-Glass Fibers in Acidic Environments,” Composites Science and Technology, Vol. 57 (1997) pp. 497-507.
25. T. Ely and M. Kumosa, “The Stress Corrosion Experiments on an E-glass/Epoxy
Unidirectional Composite,” J. Composite Materials, Vol. 34 (2000) pp. 841-878.
26. T. Ely, D. Armentrout and M. Kumosa, “Evaluation of Stress Corrosion Properties of Pultruded Glass Fiber/Polymer Composite Materials,” J. Composite Materials, 35 (2001) pp. 751-773.
27. M. Megel, L. Kumosa, T. Ely, D. Armentrout and M. Kumosa, “Initiation of
Stress Corrosion Cracking in Unidirectional Glass/Polymer Composite Materials,” Composites Science and Technology, Vol. 61 (2001) pp. 231-246.
28. L. Kumosa, D. Armentrout, M. Kumosa, “An Evaluation of the Critical
Conditions for the Initiation of Stress Corrosion Cracking in Unidirectional E-glass/Polymer Composites,” Composites Science and Technology, 61 (2001) pp. 615-623.
29. L. Kumosa, D. Armentrout and M. Kumosa, “The Effect of Sandblasting on the
Initiation of Stress Corrosion Cracking in Unidirectional E-glass/Polymer Composites Used in High Voltage Composite (Non-Ceramic) Insulators,” Composites Science and Technology, Vol. 62, No. 15 (2002) pp. 1999-2015.
30. L. Kumosa, M. Kumosa and D. Armentrout, “Resistance to Stress Corrosion
Cracking of Unidirectional Glass/Polymer Composites Based on Low and High Seed ECR-glass Fibers for High Voltage Composite Insulator Applications,” Composites, Part A, Vol. 34, No. 1 (2003) pp. 1-15.
31. D. Armentrout, M. Kumosa and L. Kumosa, “The Behavior of Composite
Insulator Rods Subjected to the Water Diffusion Electrical Test,” IEEE Transactions on Dielectrics and Electrical Insulation, (March, 2003) submitted.
32. L. Kumosa, D. Armentrout and M. Kumosa, “High Voltage Testing of Hollow
Core Glass/Polymer Composite Rods Under Controlled Moisture Diffusion Conditions,” IEEE Transactions on Dielectrics and Electrical Insulation, (December 2003) submitted.
33. G.S. Springer and S.W. Tsai, “Thermal Conductivities of Unidirectional
Materials,” Journal of Composite Materials, Vol. I, No. 2 (1967) pp. 166-173.
34. J. Halpin and S.W. Tsai, “Effects of Environmental Factors of Composite Materials,” AFML-TR 67-423 (1969).
35. C.-H. Shen and G.S. Springer, “Moisture Absorption and Desorption of
Composite Materials,” Journal of Composite Materials, Vol. 10 (1976) pp. 2-20.
19
36. G.S. Springer, “Moisture Content of Composites under Transient Conditions,”
Journal of Composite Materials, Vol. 10 (1976) p. 107.
37. C.D. Shirell and J. Halpin, “Moisture Absorption and Desorption in Epoxy Composite Laminates,” Composite Materials: Testing and Design (4th Conference), ASTM STP 617, American Society for testing and Materials, (1977) pp. 514-528.
38. K. Kondo and T. Taki, “Moisture Diffusivity of Unidirectional Composites,”
Environmental Effects on Composite Materials, Vol. 1. Lancaster, PA: Technomic Publishing Company, (1981) pp. 288-299.
39. G.S. Springer, ed. Environmental Effects on Composite Materials, Vol. 1.
Lancaster, PA: Technomic Publishing Company, (1981).
40. G.S. Springer, ed. Environmental Effects on Composite Materials, Vol. 2. Lancaster, PA: Technomic Publishing Company, (1984).
41. M. Woo and M.R. Piggott, Journal of Composite Technology and Research, Vol.
10 (1988) pp. 20-24.
42. ASTM standard D5229/D5229M-92, “Standard Test Methodology for Moisture Absorption Properties and Equilibrium Conditioning of Polymer Matrix Composite Materials,” American Society for Testing and Materials, 1992.
43. L.-R. Bao and A.F. Yee, “Moisture Diffusion and Hygrothermal Aging in
Bismaleimide Matrix Carbon Fiber Composites: Part I – Uni-Weave Composites,” Composites Science and Technology, Vol. 62 (2002) pp. 2099-2110.
44. H.G. Carter and G. Kibler, “Langmuir-Type Model for Anomalous Moisture
Diffusion In Composite Resins,” Journal of Composite Materials, Vol. 12 (1978) pp. 118-131.
45. M.E. Gurtin and C. Yatomi, “On a Model for two Phase Diffusion in Composite
Materials,” Journal of Composite Materials, Vol. 13 (1979) pp. 126-130.
46. J.P. Lucas and J. Zhou, “The Effects of Sorbed Moisture on Resin-Matrix Composites,” JOM, December (1993) pp. 37-40.
47. L.-W. Cai and Y. Weitsman, “Non-Fickian Moisture Diffusion in Polymeric
Composites,” Journal of Composite Materials, Vol. 28 (1994) pp. 130-154.
20
48. J. Zhou and J.P. Lucas, “The Effects of a Water Environment on Anomalous Absorption Behavior in Graphite/Epoxy Composites,” Composites Science and Technology, Vol 53, No. 1 (1995) pp. 57-64.
49. ANSYS 6.1 Reference Manual
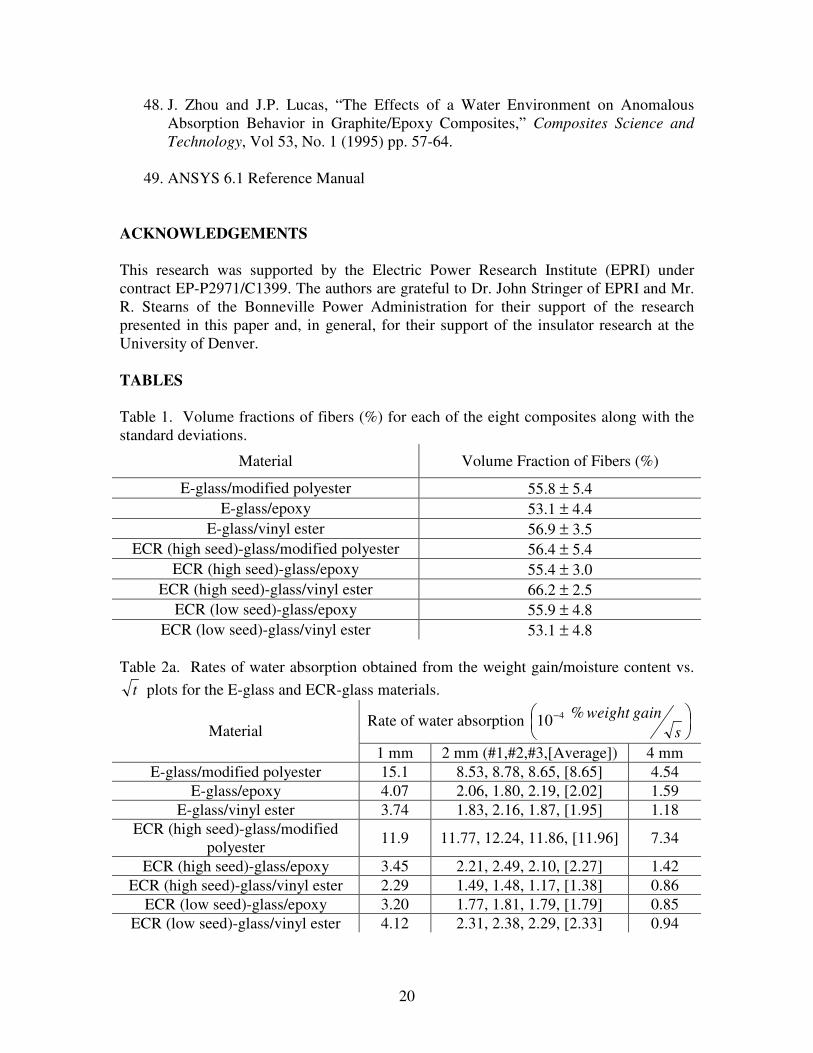
ACKNOWLEDGEMENTS This research was supported by the Electric Power Research Institute (EPRI) under contract EP-P2971/C1399. The authors are grateful to Dr. John Stringer of EPRI and Mr. R. Stearns of the Bonneville Power Administration for their support of the research presented in this paper and, in general, for their support of the insulator research at the University of Denver. TABLES Table 1. Volume fractions of fibers (%) for each of the eight composites along with the standard deviations.
Material Volume Fraction of Fibers (%)
E-glass/modified polyester 55.8 ± 5.4 E-glass/epoxy 53.1 ± 4.4
E-glass/vinyl ester 56.9 ± 3.5 ECR (high seed)-glass/modified polyester 56.4 ± 5.4
ECR (high seed)-glass/epoxy 55.4 ± 3.0 ECR (high seed)-glass/vinyl ester 66.2 ± 2.5
ECR (low seed)-glass/epoxy 55.9 ± 4.8 ECR (low seed)-glass/vinyl ester 53.1 ± 4.8
Table 2a. Rates of water absorption obtained from the weight gain/moisture content vs.
t plots for the E-glass and ECR-glass materials.
Rate of water absorption ��
���
� −
sgainweight%10 4
Material 1 mm 2 mm (#1,#2,#3,[Average]) 4 mm
E-glass/modified polyester 15.1 8.53, 8.78, 8.65, [8.65] 4.54 E-glass/epoxy 4.07 2.06, 1.80, 2.19, [2.02] 1.59
E-glass/vinyl ester 3.74 1.83, 2.16, 1.87, [1.95] 1.18 ECR (high seed)-glass/modified
polyester 11.9 11.77, 12.24, 11.86, [11.96] 7.34
ECR (high seed)-glass/epoxy 3.45 2.21, 2.49, 2.10, [2.27] 1.42 ECR (high seed)-glass/vinyl ester 2.29 1.49, 1.48, 1.17, [1.38] 0.86
ECR (low seed)-glass/epoxy 3.20 1.77, 1.81, 1.79, [1.79] 0.85 ECR (low seed)-glass/vinyl ester 4.12 2.31, 2.38, 2.29, [2.33] 0.94
21
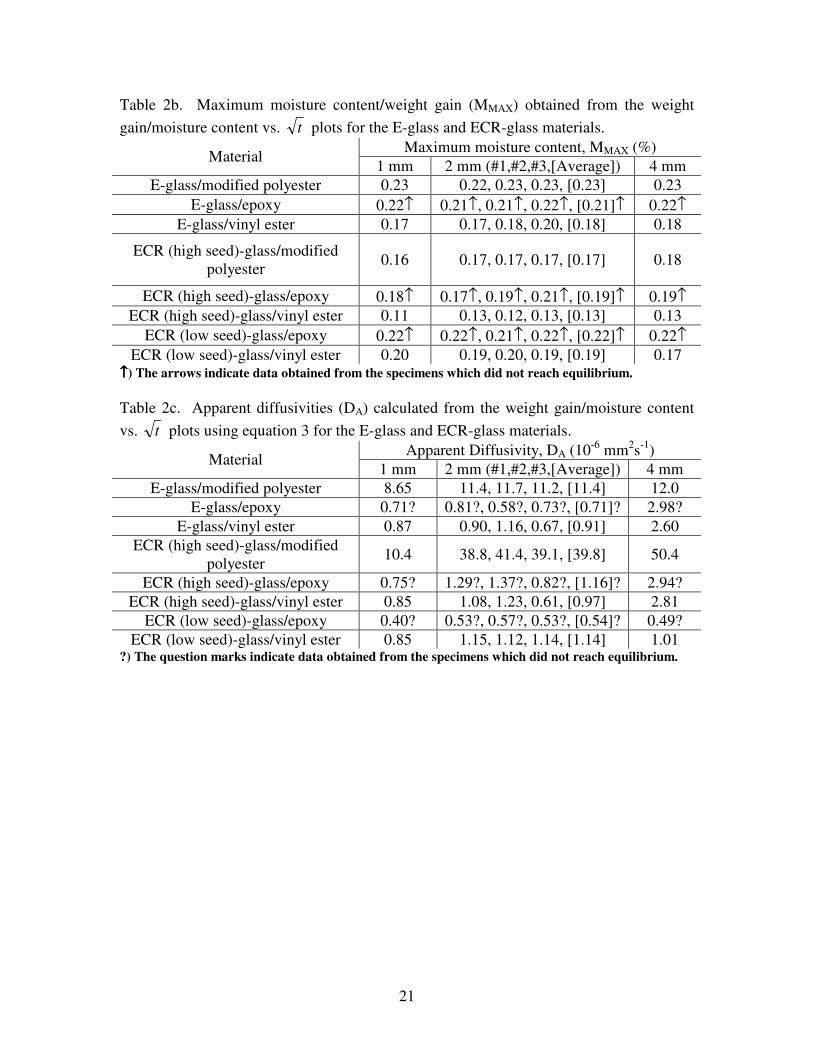
Table 2b. Maximum moisture content/weight gain (MMAX) obtained from the weight gain/moisture content vs. t plots for the E-glass and ECR-glass materials.
Maximum moisture content, MMAX (%) Material 1 mm 2 mm (#1,#2,#3,[Average]) 4 mm
E-glass/modified polyester 0.23 0.22, 0.23, 0.23, [0.23] 0.23 E-glass/epoxy 0.22↑ 0.21↑, 0.21↑, 0.22↑, [0.21]↑ 0.22↑
E-glass/vinyl ester 0.17 0.17, 0.18, 0.20, [0.18] 0.18
ECR (high seed)-glass/modified polyester 0.16 0.17, 0.17, 0.17, [0.17] 0.18
ECR (high seed)-glass/epoxy 0.18↑ 0.17↑, 0.19↑, 0.21↑, [0.19]↑ 0.19↑ ECR (high seed)-glass/vinyl ester 0.11 0.13, 0.12, 0.13, [0.13] 0.13
ECR (low seed)-glass/epoxy 0.22↑ 0.22↑, 0.21↑, 0.22↑, [0.22]↑ 0.22↑ ECR (low seed)-glass/vinyl ester 0.20 0.19, 0.20, 0.19, [0.19] 0.17
↑↑↑↑) The arrows indicate data obtained from the specimens which did not reach equilibrium. Table 2c. Apparent diffusivities (DA) calculated from the weight gain/moisture content vs. t plots using equation 3 for the E-glass and ECR-glass materials.
Apparent Diffusivity, DA (10-6 mm2s-1) Material 1 mm 2 mm (#1,#2,#3,[Average]) 4 mm
E-glass/modified polyester 8.65 11.4, 11.7, 11.2, [11.4] 12.0 E-glass/epoxy 0.71? 0.81?, 0.58?, 0.73?, [0.71]? 2.98?
E-glass/vinyl ester 0.87 0.90, 1.16, 0.67, [0.91] 2.60 ECR (high seed)-glass/modified
polyester 10.4 38.8, 41.4, 39.1, [39.8] 50.4
ECR (high seed)-glass/epoxy 0.75? 1.29?, 1.37?, 0.82?, [1.16]? 2.94? ECR (high seed)-glass/vinyl ester 0.85 1.08, 1.23, 0.61, [0.97] 2.81
ECR (low seed)-glass/epoxy 0.40? 0.53?, 0.57?, 0.53?, [0.54]? 0.49? ECR (low seed)-glass/vinyl ester 0.85 1.15, 1.12, 1.14, [1.14] 1.01
?) The question marks indicate data obtained from the specimens which did not reach equilibrium.
22
Table 3a. Case I
h D11 (mm2s-1)
D22 (mm2s-1)
DA (mm2s-1)
Slope (% s-0.5)
MMAX (%)
DR (mm2s-1)
DR Corrected (mm2s-1)
0.5 mm 0 1·10-6 3.04·10-7 4.94·10-4 0.20 1.83·10-6 N/A 1 mm 0 1·10-6 7.77·10-7 3.95·10-4 0.20 4.76·10-6 N/A 2 mm 0 1·10-6 1.08·10-6 2.32·10-4 0.20 6.59·10-6 N/A 4 mm 0 1·10-6 1.04·10-6 1.14·10-4 0.20 6.36·10-6 N/A 8 mm 0 1·10-6 1.02·10-6 0.57·10-4 0.20 6.23·10-6 N/A
Table 3b. Case II
h D11 (mm2s-1)
D22 (mm2s-1)
DA (mm2s-1)
Slope (% s-0.5)
MMAX (%)
DR (mm2s-1)
DR Corrected (mm2s-1)
0.5 mm 1·10-6 1·10-6 2.72·10-7 4.68·10-4 0.20 1.67·10-6 1.58·10-6 1 mm 1·10-6 1·10-6 7.88·10-7 3.98·10-4 0.20 4.83·10-6 4.35·10-6 2 mm 1·10-6 1·10-6 1.16·10-6 2.41·10-4 0.20 7.09·10-6 5.79·10-6 4 mm 1·10-6 1·10-6 1.17·10-6 1.21·10-4 0.20 7.20·10-6 4.89·10-6 8 mm 1·10-6 1·10-6 1.49·10-6 0.68·10-4 0.20 9.11·10-6 4.48·10-6
Table 3c. Case III
h D11
(mm2s-1) D22
(mm2s-1) DA
(mm2s-1) Slope
(% s-0.5) MMAX (%)
DR (mm2s-1)
DR Corrected (mm2s-1)
0.5 mm 2.75·10-6 1·10-6 2.72·10-7 4.68·10-4 0.20 1.67·10-6 1.58·10-6 1 mm 2.75·10-6 1·10-6 7.90·10-7 3.99·10-4 0.20 4.84·10-6 4.36·10-6 2 mm 2.75·10-6 1·10-6 1.00·10-6 2.24·10-4 0.20 6.14·10-6 5.02·10-6 4 mm 2.75·10-6 1·10-6 1.32·10-6 1.29·10-4 0.20 8.10·10-6 5.51·10-6 8 mm 2.75·10-6 1·10-6 1.77·10-6 0.75·10-4 0.20 1.08·10-5 5.34·10-6

23
Table 4. Calculated values for uncorrected DR using equation (4b) and corrected DR using equation (5) for each of the specimens tested.
DR (10-6 mm2s-1) DR corrected (10-6 mm2s-1) Material 1 mm 2 mm 4 mm 1 mm 2 mm 4 mm
E-glass/modified polyester 53.02
69.62 71.56 68.69
73.37 47.80 56.87 58.45 56.11
49.88
E-glass/epoxy 4.32 4.97 3.57 4.50
18.25 3.90 4.06 2.92 3.83
12.41 7.10*
E-glass/vinyl ester 5.34 5.49 7.14 4.13
15.93 4.81 3.37 4.48 5.83
10.83 5.43*
ECR (high seed)-glass/modified
polyester 63.68
238.25 259.03 244.05
309.18 57.40 194.62 211.59 199.35
210.18
ECR (high seed)-glass/epoxy 4.62
7.91 8.41 5.01
18.02 3.90 4.24 6.46 6.87
12.25 7.40*
ECR (high seed)-glass/vinyl ester 10.24
11.14 13.00 7.35
33.91 9.11 9.10
10.35 5.85
22.00 11.64*
ECR (low seed)-glass/epoxy 2.48
3.26 3.49 3.27
2.99 2.23 2.66 2.85 2.67
2.04
ECR (low seed)-glass/vinyl ester 5.19
7.05 6.88 6.98
6.19 4.68 5.77 5.62 5.70
4.21 3.03*
* Corrected also for MMAX due to unexpectedly lower total amount of moisture absorbed for some of the 4 mm thick specimens. Table 5. Predicted values of resin diffusivities calculated from averages of the corrected values of DR in Table 4.
Diffusivity of the Resin, DR (10-6 mm2/s)
Resin E-glass Composites
ECR-high seed
composites
ECR-low seed composites
Average for each resin
Modified Polyester 53.84 174.63 N/A 114.24 Epoxy 4.33 5.80 2.49 4.21
Vinyl Ester 4.78 9.21 4.96 6.32
24
Table 6. Parallel (D11) and perpendicular (D22) diffusivities of the composites as calculated from the diffusivity of the resin (DR) in Table 5.
Material D11 (10-6 mm2/s) D22 (10-6 mm2/s) D11/D22 E-glass/Modified Polyester 24.23 8.79
E-glass/Epoxy 1.95 0.71 E-glass/Vinyl Ester 2.15 0.78
ECR (high seed)-glass/Modified Polyester 78.58 28.49
ECR (high seed)-glass/Epoxy 2.61 0.94
~2.75
ECR (high seed)-glass/Vinyl Ester 3.13 0.77 ~4.08
ECR (low seed)-glass/Epoxy 1.12 0.41 ECR (low seed)-glass/Vinyl
Ester 2.23 0.81 ~2.75
Table 7. Values from the anomalous diffusion analysis of the ECR (low seed)-glass/epoxy composite plate specimens.
Wall Thickness [mm]
γ (10-8) (s-1)
β (10-8) (s-1)
MMAX-CK from Ref.
32 (%)
Sum of Squares
Error (10-4)
Time to 99% Saturation
(Years)
1 1.97 2.97 0.35 25.0 3.9
I 0.82 1.23 0.35 8.0 9.5 II 0.52 0.77 0.35 11.0 15.1 2 III 0.49 0.77 0.35 13.5 15.0
4 0.31 0.52 0.35 5.1 22.1

25
Figure 1. Schematic of a high voltage non-ceramic GRP rod insulator.
Figure 2. Finite element representation of the moisture diffusion specimens.
Fiber Orientation
GRP Composite Rod
End-Fitting at Tower End
Rubber Housing with Multiple Weather-Sheds
End-Fitting at Energized End
26
0
0.05
0.1
0.15
0.2
0.25
0 250 500 750 1000 1250 1500 1750 2000
Square Root of Time (s0.5)
Moi
stur
e C
onte
nt (%
)
1 mm2 mm #12 mm #22 mm #34 mm
Figure 3a
0
0.05
0.1
0.15
0.2
0.25
0.3
0 500 1000 1500 2000 2500 3000 3500 4000
Square Root of Time (s0.5)
Moi
stur
e C
onte
nt (
%)
1 mm2 mm #12 mm #22 mm #34 mm
ECR (low seed)-glass/Epoxy
Figure 3b
27
0
0.05
0.1
0.15
0.2
0.25
0 500 1000 1500 2000 2500 3000 3500 4000Square Root of Time (s0.5)
Moi
stur
e C
onte
nt (
%)
1 mm2 mm #12 mm #22 mm #34 mm
ECR (low seed)-glass/Vinyl Ester
Figure 3c
Figure 3. Moisture absorption curves for 1, 2 and 4 mm thick E-glass/modified polyester (a), ECR (low seed)-glass/epoxy (b) and ECR (low seed)-glass/vinyl ester (c) specimens.
28
0
0.05
0.1
0.15
0.2
0.25
0 500 1000 1500 2000 2500 3000Square Root of Time (s0.5)
Moi
stur
e C
onte
nt (%
)
E-glass/Modified Polyester #1
E-glass/Modified Polyester #1 (Fickian Fit)
E-glass/Modified Polyester #2
E-glass/Modified Polyester #2 (Fickian Fit)
E-glass/Modified Polyester #3
E-glass/Modified Polyester #3 (Fickian Fit)
Figure 4a
0
0.05
0.1
0.15
0.2
0.25
0 500 1000 1500 2000 2500 3000
Square Root of Time (s0.5)
Moi
stur
e C
onte
nt (%
)
E-glass/Epoxy #1
E-glass/Epoxy #1 (Fickian Fit)
E-glass/Epoxy #2
E-glass/Epoxy #2 (Fickian Fit)
E-glass/Epoxy #3
E-glass/Epoxy #3 (Fickian Fit)
Figure 4b
29
0
0.05
0.1
0.15
0.2
0.25
0 500 1000 1500 2000 2500 3000
Square Root of Time (s0.5)
Moi
stur
e C
onte
nt (%
)
E-glass/Vinyl Ester #1
E-glass/Vinyl Ester #1 (Fickian Fit)
E-glass/Vinyl Ester #2
E-glass/Vinyl Ester #2 (Fickian Fit)
E-glass/Vinyl Ester #3
E-glass/Vinyl Ester #3 (Fickian Fit)
Figure 4c
Figure 4. Moisture absorption curves along with the single-phase Fickian fits for the three 2 mm thick E-glass/Modified Polyester (a), E-glass/Epoxy (b) and E-glass/Vinyl Ester (c) specimens.
30
0
0.05
0.1
0.15
0.2
0.25
0 500 1000 1500 2000 2500 3000
Square Root of Time (s0.5)
Moi
stur
e C
onte
nt (%
)
E-glass/Modified Polyester
ECR(high seed)-glass/Modified Polyester
ECR(low seed)-glass/Modified Polyester (Not Available)
Figure 5a
0
0.05
0.1
0.15
0.2
0.25
0 500 1000 1500 2000 2500 3000
Square Root of Time (s0.5)
Moi
stur
e C
onte
nt (%
)
E-glass/Epoxy
ECR(high seed)-glass/Epoxy
ECR(low seed)-glass/Epoxy
Figure 5b
31
0
0.05
0.1
0.15
0.2
0.25
0 500 1000 1500 2000 2500 3000Square Root of Time (s0.5)
Moi
stur
e C
onte
nt (%
)
E-glass/Vinyl Ester
ECR(high seed)-glass/Vinyl Ester
ECR(low seed)-glass/Vinyl Ester
Figure 5c
Figure 5. Fiber effect on the moisture absorption curves in 2 mm thick composite specimens based on modified polyester (a), epoxy (b) and vinyl ester (c) resins.
32
0
0.05
0.1
0.15
0.2
0.25
0 500 1000 1500 2000 2500 3000Square Root of Time (s0.5)
Moi
stur
e C
onte
nt (%
)
E-glass/Vinyl EsterE-glass/EpoxyE-glass/Modified Polyester
Figure 6a
0
0.05
0.1
0.15
0.2
0.25
0 500 1000 1500 2000 2500 3000
Square Root of Time (s0.5)
Moi
stur
e C
onte
nt (%
)
ECR(high seed)-glass/Vinyl Ester
ECR(high seed)-glass/Epoxy
ECR(high seed)-glass/Modified Polyester
Figure 6b
33
0
0.05
0.1
0.15
0.2
0.25
0 500 1000 1500 2000 2500 3000Square Root of Time (s0.5)
Moi
stur
e C
onte
nt (%
)
ECR(low seed)-glass/Vinyl Ester
ECR(low seed)-glass/Epoxy
ECR(low seed)-glass/Modified Polyester (Not Available)
Figure 6c
Figure 6. Resin effect on the moisture absorption curves in 2 mm thick composite specimens based on E-glass (a), ECR (high seed)-glass (b) and ECR (low seed)-glass (c) fibers.
34
0.00E+00
5.00E-07
1.00E-06
1.50E-06
2.00E-06
2.50E-06
3.00E-06
3.50E-06
4.00E-06
4.50E-06
5.00E-06
0 500 1000 1500 2000 2500 3000
Square Root of Time (s0.5)
Moi
stur
e C
once
ntra
tion
(g/m
m3 )
1 mm FEM Analysis1 mm Experimental Data2 mm FEM Analysis2 mm Experimental Data4 mm FEM Analysis4 mm Experimental Data
E-glass/Modified Polyester
Figure 7. Experimental and numerical curves of moisture concentration for the E-glass/modified polyester specimens with different thickness.
0.00E+00
1.00E-06
2.00E-06
3.00E-06
4.00E-06
5.00E-06
6.00E-06
0 500 1000 1500 2000 2500 3000 3500 4000 4500
Square Root of Time (s0.5)
Moi
stur
e C
once
ntra
tion
(g/m
m3 )
1 mm FEM Analysis1 mm Experimental Data2 mm FEM Analysis2 mm Experimental Data4 mm FEM Analysis4 mm Experimental Data
ECR (low seed)-glass/Epoxy
Figure 8. Experimental and numerical curves of mass of moisture concentration for the ECR (low seed)-glass/epoxy specimens with different thickness.
35
0.00E+00
5.00E-07
1.00E-06
1.50E-06
2.00E-06
2.50E-06
3.00E-06
3.50E-06
4.00E-06
4.50E-06
0 500 1000 1500 2000 2500 3000 3500 4000 4500
Square Root of Time (s0.5)
Moi
stur
e C
once
ntra
tion
(g/m
m3 )
1 mm FEM Analysis
1 mm Experimental Data
2 mm FEM Analysis
2 mm Experimental Data
4 mm FEM Analysis
4 mm Experimental Data
ECR (low seed)-glass/Vinyl Ester
Figure 9. Experimental and numerical curves of moisture concentration for the ECR (low seed)-glass/vinyl ester specimens with different thickness.
36
\
Figure 10. Schematic of diffusion Cases I-III in the FEM analysis.
0.00E+00
2.00E-06
4.00E-06
6.00E-06
8.00E-06
1.00E-05
1.20E-05
0 1 2 3 4 5 6 7 8 9
Thickness (mm)
DR
ES
IN (m
m2 s-1
)
Case I (no correction required)Case II, UncorrectedCase II, CorrectedCase III, UncorrectedCase III, Corrected
Figure 11. Diffusivities of the resin from the finite element simulations of Cases I, II and III in Figure 10. The uncorrected diffusivities were calculated from equation 4b and the corrected values from equation 5.
S22 = Surfaces affected by D22
S11 = Surface affected by D11
Case I: S22 not constrained, D22 = 1*10-6 mm2s-1; S11 constrained, no D11 diffusion allowed.
Case II: S22 not constrained, D22 = 1*10-6 mm2s-1; S11 not constrained, D11 = D22.
Case III: S22 not constrained, D22 = 1*10-6 mm2s-1; S11 not constrained, D11 = 2.75*D22.
37
0.00E+00
5.00E-05
1.00E-04
1.50E-04
2.00E-04
2.50E-04
0 1 2 3 4 5
Thickness (mm)
DR
ES
IN (m
m2 s-1
)
E-glass/Modified PolyesterAverage for E-glass/Modified PolyesterECR (hs)-glass/Modified PolyesterAverage for ECR (hs)-glass/Modified Polyester
Figure 12a
0.00E+00
2.00E-06
4.00E-06
6.00E-06
8.00E-06
1.00E-05
1.20E-05
1.40E-05
0 1 2 3 4 5
Thickness (mm)
DR
ES
IN (
mm
2 s-1)
E-glass/EpoxyECR (high seed)-glass/EpoxyECR (low seed)-glass/EpoxyAverage for E-glass/EpoxyAverage for ECR (high seed)-glass/EpoxyAverage for ECR (low seed)-glass/Epoxy
Figure 12b
38
0.00E+00
5.00E-06
1.00E-05
1.50E-05
2.00E-05
0 1 2 3 4 5
Thickness (mm)
DR
ES
IN (m
m2 s-1
)E-glass/Vinyl EsterECR (high seed)-glass/Vinyl EsterECR (low seed)-glass/Vinyl EsterAverage for E-glass/Vinyl EsterAverage for ECR (high seed)-glass/Vinyl EsterAverage for ECR (low seed)-glass/vinyl Ester
Figure 12c
Figure 12. Resin diffusivities DRESIN for the modified polyester (a), epoxy (b) and vinyl ester (c) resins from the moisture absorption tests performed on the E-glass, ECR-high seed, and ECR-low seed/polymer specimens 1
mm, 2 mm and 4 mm thick.
39
0
0.05
0.1
0.15
0.2
0.25
0 500 1000 1500 2000 2500 3000
Square Root of Time (s0.5)
Moi
stur
e C
onte
nt (%
)
ExperimentSingle-Phase Fickian Diffusion FitAnomalous Diffusion Carter-Kibler Fit
Figure 13. Moisture content vs. square root of time curve for one 2-mm thick ECR (low seed)-glass/epoxy specimen including both single-phase Fickian diffusion and Carter-Kibler anomalous diffusion fits.