mojo: a distributed physical layer anomaly detection
TRANSCRIPT
MOJO: A Distributed Physical Layer Anomaly DetectionSystem for 802.11 WLANs
Anmol Sheth Christian Doerr Dirk Grunwald Richard Han Douglas SickerDepartment of Computer ScienceUniversity of Colorado at Boulder
Boulder, CO, 80309-0430{sheth, doerr, grunwald, rhan, sicker}@cs.colorado.edu
AbstractDeployments of wireless LANs consisting of hundreds of802.11 access points with a large number of users have beenreported in enterprises as well as college campuses. How-ever, due to the unreliable nature of wireless links, usersfrequently encounter degraded performance and lack of cov-erage. This problem is even worse in unplanned networks,such as the numerous access points deployed by homeown-ers. Existing approaches that aim to diagnose these prob-lems are inefficient because they troubleshoot at too high alevel, and are unable to distinguish among the root causesof degradation. This paper designs, implements, and testsfine-grained detection algorithms that are capable of distin-guishing between root causes of wireless anomalies at thedepth of the physical layer. An important property thatemerges from our system is that diagnostic observations arecombined from multiple sources over multiple time instancesfor improved accuracy and efficiency.
Categories and Subject DescriptorsC.2.1 [Computer-Communication Networks]: NetworkArchitecture and Design—Wireless communication
General TermsAlgorithms, Measurement, Performance
KeywordsAnomaly detection, wireless networks, self-healing
1. INTRODUCTIONThe reduction in cost and ease of installation of 802.11
based wireless LAN (WLAN) hardware has resulted in asurge of large scale planned and small scale chaotic deploy-ments. Planned WLAN deployments consisting of a largenumber of access points with hundreds of associated clients
Permission to make digital or hard copies of all or part of this work forpersonal or classroom use is granted without fee provided that copies arenot made or distributed for profit or commercial advantage and that copiesbear this notice and the full citation on the first page. To copy otherwise, torepublish, to post on servers or to redistribute to lists, requires prior specificpermission and/or a fee.MobiSys’06, June 19–22, 2006, Uppsala, Sweden.Copyright 2006 ACM 1-59593-195-3/06/0006 ...$5.00.
have been reported in enterprises [6] as well as college cam-puses [15]. Recent studies like [9] and [4] have shown that itis also common to have dense and unplanned deployments ofaccess points consisting of 30-40 APs in range of each otherin residential settings.
With this growing adoption of the technology and in-creasing dependence on WLANs by mission critical app-lications, users are beginning to demand reliability, perfor-mance, scalability and ubiquitous coverage from the wirelessnetworks. However, existing 802.11 deployments provideinadequate coverage and unpredictable performance. Thereasons leading to the degraded performance include densedeployment, noise and interference, RF effects such as hid-den terminals and capture effects, and limitations in the802.11 MAC layer. Existing tools for diagnosing WLANsare unable to distinguish between root causes of perfor-mance degradation because they employ packet metrics atthe MAC layer and above. These metrics tend to aggre-gate the effects of multiple physical (PHY) layer anomalies,which can result in a misdiagnosis and/or the application ofan inappropriate or inefficient remedy.
In this paper, we design, implement, and evaluate detec-tion algorithms for commonly observed problems/faults inWLANs. These detection algorithms are able to distinguishbetween root causes of performance degradation at the gran-ularity of PHY layer phenomena. As we will demonstrate,gaining a more precise understanding of the root causes ofan anomaly at the depth of the PHY layer enables moreinformed remediation. In particular, we devise detectionalgorithms that detect hidden terminals in the network anddifferentiate that activity from terminals experiencing cap-ture effect. We also devise algorithms that detect noise dueto non-802.11 devices and detect anomalous signal strengthvariations at the AP and determine if those signal variationsare caused by environmental conditions or actions by the ac-cess point. An important property that emerges from oursystem is that diagnostic observations are combined frommultiple sources over multiple time instances for improvedaccuracy and efficiency. This property leads us to entitleour tool as Mutual Observation with Joint Optimization(Mojo).
The key contributions of our work are:
• As far as we know, this is the first body of work whichlooks at building a unified framework to be able todetect underlying physical layer anomalies,
• We quantify the effect of different faults on a real net-
191
work and measure the impact at different layers of thestack,
• We build statistical detection algorithms for each phys-ical effect and test the accuracy of the detection algo-rithm on a real testbed,
• And lastly, we use commodity off-the-shelf hardwareto build the entire system.
The rest of the paper is structured as follows. In the nextsection, we give a longer overview of the problems encoun-tered in wireless networks and possible solutions. Section 3presents the architecture of the system and the challenges inbuilding a client-side monitoring framework. In Section 4 wepresent the details of the detection algorithms. Section 5describes our remediation strategies. Section 6 discusses therelated work and Section 7 concludes the paper.
2. OVERVIEWPerformance degradation in 802.11 WLANs arises from
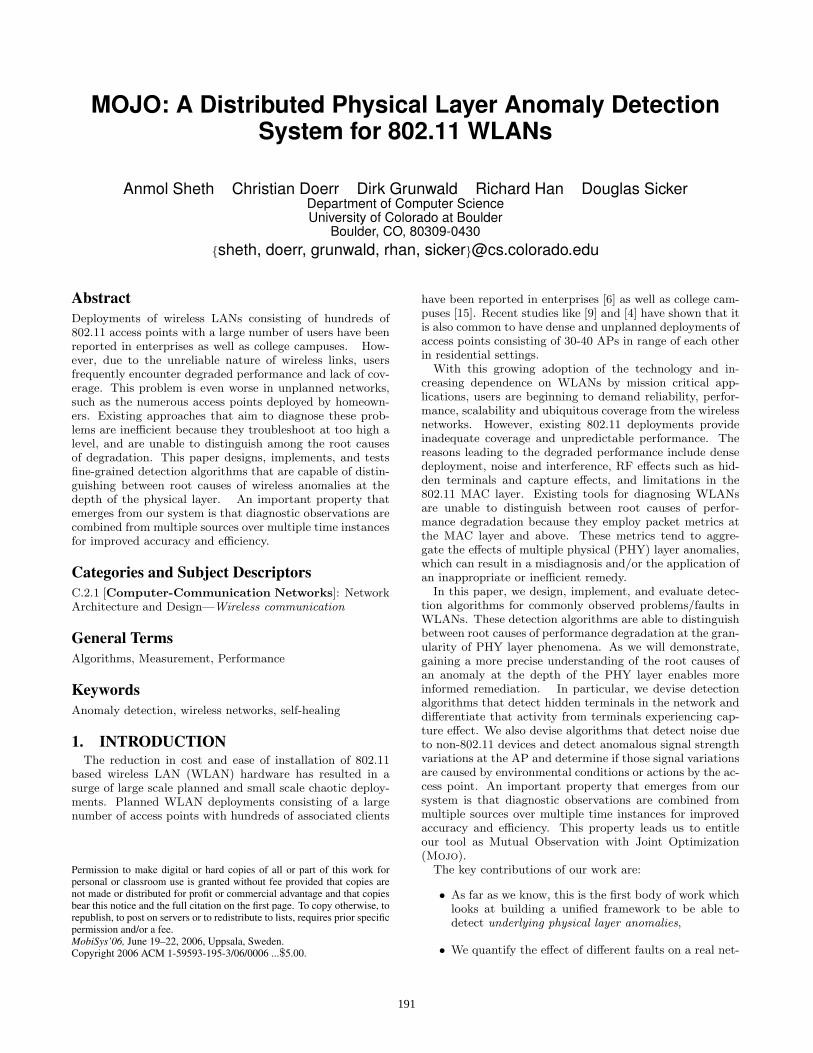
a variety of common sources, including 802.11-based inter-ference, non-802.11 interference [7, 19], RF effects like hid-den terminals and the capture effect [12, 17], heterogeneity,and limitations of the 802.11 MAC itself [16, 14]. First,802.11 deployments are becoming denser and it is commonto have 10-15 APs in range of each other in residential en-vironments [4]. Due to only three non-overlapping channelsfor the 802.11b protocol and significant signal power spillagein the adjacent channels, performance is degraded due toadjacent channel interference [9]. Second, the 2.4 GHz ra-dio spectrum is shared with a host of other communicationprotocols and devices like Bluetooth devices and microwaveovens. The lack of a common media access protocol leadsto a significant amount of degradation and unpredictableperformance. Third, due to the non-isotropic nature of thewireless transmission range, dense deployments are plaguedby the well known hidden terminal problem and capture ef-fects. Figure 1 illustrates the difference between these twoeffects. Station C is isolated by an RF barrier from sta-tions A and B, resulting in the classical “hidden terminal”problem. Stations A and B cannot sense transmissions bystation C; simultaneous transmissions by C and B wouldcause corrupted packets at the access point, AP. However,not all simultaneous transmissions lead to corruption. Forexample, due to aspects of the 802.11 media acquisition, sta-tions A and B may simultaneously transmit; however, thetransmission from station B is likely to “capture” the AP re-ceiver, leading to a successful reception. The standard rem-edy for hidden terminals would be to have station C use theRTS/CTS mechanism when communicating with the accesspoint. This would inform stations A and B that the mediais busy. Likewise, the problem of the “capture effect” canbe remedied either by having station A increase its transmitpower or by adjusting the media acquisition mechanisms.
Heterogeneous transmit power leads to asymmetric trans-mission ranges, which exacerbates the problem of the hiddenterminals and capture effect in the network. Table 1 lists thespecifications of the transmit power and receive sensitivity ofa heterogeneous collection of common 802.11 client adapters.We observe that each client adapter has a different transmitpower and rate sensitivity.
Heterogeneous receiver sensitivities can further lead to un-fairness in performance. Table 1 lists the receive sensitiv-
C
B
A
AP DEST100 Mbps
Figure 1: Network organizations leading to hiddenterminals and capture effect
Tx. 1M 2M 5.5M 11MCisco 350 20 -94 -91 -89 -85Orinoco Gold 15 -94 -91 -87 -82Dlink DWLG650 15 -89 -86 -85 -82Compaq WL110 15 -94 -91 -87 -82Linksys WPC11 18 -91 -89 -85 -82Linksys WPC55AG 17 -93 -91 -88 -86
Table 1: Transmit power and receive sensitivity indBm. Uniformly, receivers are less susceptible tonoise when using the slower data rates and thereis significant variance between different receivers.Transmission power can reach as high as 300 mW(25 dBm).
ity for the four data rates supported by 802.11b protocol.With each client adapter having a different receive sensi-tivity and variations in signal strength at the access point,client adapters select different data rates to communicatewith the AP under identical conditions. Since the 802.11 me-dia access control mechanism promotes “station fairness”,different receive sensitivity can lead to a large portion of themedium being used by the lower data rate stations in thenetwork, and hence effectively slowing down the higher datarate clients in the network [16, 14].
The limitations of the 802.11 protocol itself can furtherdegrade performance. The two main problems consistentlyaddressed by the research community are the collision avoid-ance mechanism of 802.11 [12, 29, 30] and the breakdown ofCSMA under periods of heavy contention.
Thus, even with careful network planning and assignmentof AP parameters, the irregularities of the transmission rangeand receiver sensitivity, the shared 802.11 spectrum and ad-hoc location of clients in the network can cause degradationin the performance of the network. These problems are ex-acerbated in an unplanned network, which in addition isprone to adhoc deployment of APs and interference causedby neighboring APs.
2.1 Performance Diagnostic Tools and TheirLimitations
To address the performance degradation due to an un-planned WLAN network deployment, there are a numberof open source as well as commercial tools [1, 2] available
192
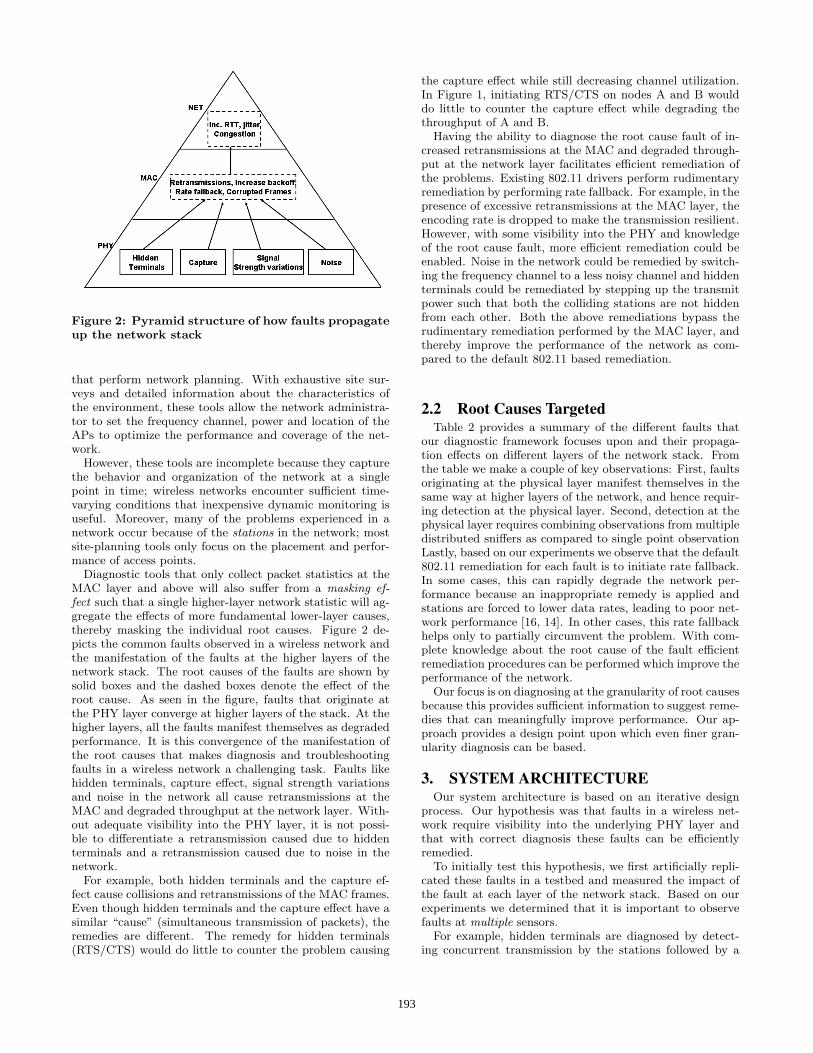
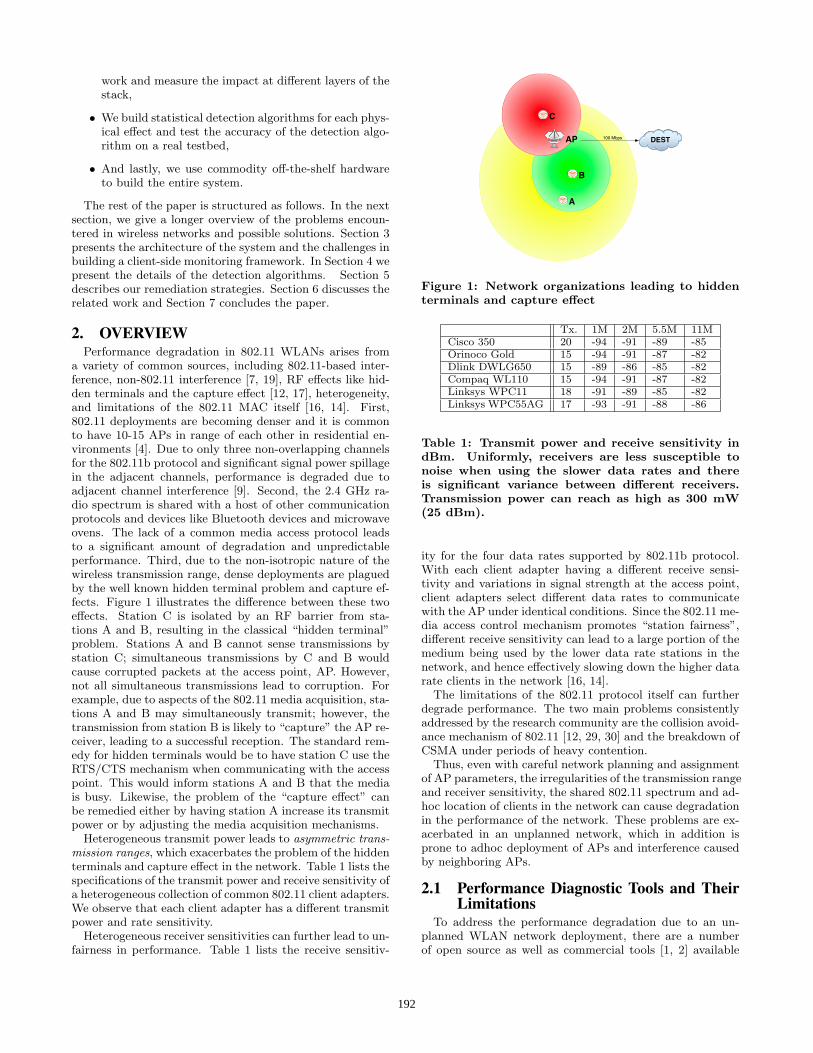
Figure 2: Pyramid structure of how faults propagateup the network stack
that perform network planning. With exhaustive site sur-veys and detailed information about the characteristics ofthe environment, these tools allow the network administra-tor to set the frequency channel, power and location of theAPs to optimize the performance and coverage of the net-work.
However, these tools are incomplete because they capturethe behavior and organization of the network at a singlepoint in time; wireless networks encounter sufficient time-varying conditions that inexpensive dynamic monitoring isuseful. Moreover, many of the problems experienced in anetwork occur because of the stations in the network; mostsite-planning tools only focus on the placement and perfor-mance of access points.
Diagnostic tools that only collect packet statistics at theMAC layer and above will also suffer from a masking ef-fect such that a single higher-layer network statistic will ag-gregate the effects of more fundamental lower-layer causes,thereby masking the individual root causes. Figure 2 de-picts the common faults observed in a wireless network andthe manifestation of the faults at the higher layers of thenetwork stack. The root causes of the faults are shown bysolid boxes and the dashed boxes denote the effect of theroot cause. As seen in the figure, faults that originate atthe PHY layer converge at higher layers of the stack. At thehigher layers, all the faults manifest themselves as degradedperformance. It is this convergence of the manifestation ofthe root causes that makes diagnosis and troubleshootingfaults in a wireless network a challenging task. Faults likehidden terminals, capture effect, signal strength variationsand noise in the network all cause retransmissions at theMAC and degraded throughput at the network layer. With-out adequate visibility into the PHY layer, it is not possi-ble to differentiate a retransmission caused due to hiddenterminals and a retransmission caused due to noise in thenetwork.
For example, both hidden terminals and the capture ef-fect cause collisions and retransmissions of the MAC frames.Even though hidden terminals and the capture effect have asimilar “cause” (simultaneous transmission of packets), theremedies are different. The remedy for hidden terminals(RTS/CTS) would do little to counter the problem causing
the capture effect while still decreasing channel utilization.In Figure 1, initiating RTS/CTS on nodes A and B woulddo little to counter the capture effect while degrading thethroughput of A and B.
Having the ability to diagnose the root cause fault of in-creased retransmissions at the MAC and degraded through-put at the network layer facilitates efficient remediation ofthe problems. Existing 802.11 drivers perform rudimentaryremediation by performing rate fallback. For example, in thepresence of excessive retransmissions at the MAC layer, theencoding rate is dropped to make the transmission resilient.However, with some visibility into the PHY and knowledgeof the root cause fault, more efficient remediation could beenabled. Noise in the network could be remedied by switch-ing the frequency channel to a less noisy channel and hiddenterminals could be remediated by stepping up the transmitpower such that both the colliding stations are not hiddenfrom each other. Both the above remediations bypass therudimentary remediation performed by the MAC layer, andthereby improve the performance of the network as com-pared to the default 802.11 based remediation.
2.2 Root Causes TargetedTable 2 provides a summary of the different faults that
our diagnostic framework focuses upon and their propaga-tion effects on different layers of the network stack. Fromthe table we make a couple of key observations: First, faultsoriginating at the physical layer manifest themselves in thesame way at higher layers of the network, and hence requir-ing detection at the physical layer. Second, detection at thephysical layer requires combining observations from multipledistributed sniffers as compared to single point observationLastly, based on our experiments we observe that the default802.11 remediation for each fault is to initiate rate fallback.In some cases, this can rapidly degrade the network per-formance because an inappropriate remedy is applied andstations are forced to lower data rates, leading to poor net-work performance [16, 14]. In other cases, this rate fallbackhelps only to partially circumvent the problem. With com-plete knowledge about the root cause of the fault efficientremediation procedures can be performed which improve theperformance of the network.
Our focus is on diagnosing at the granularity of root causesbecause this provides sufficient information to suggest reme-dies that can meaningfully improve performance. Our ap-proach provides a design point upon which even finer gran-ularity diagnosis can be based.
3. SYSTEM ARCHITECTUREOur system architecture is based on an iterative design
process. Our hypothesis was that faults in a wireless net-work require visibility into the underlying PHY layer andthat with correct diagnosis these faults can be efficientlyremedied.
To initially test this hypothesis, we first artificially repli-cated these faults in a testbed and measured the impact ofthe fault at each layer of the network stack. Based on ourexperiments we determined that it is important to observefaults at multiple sensors.
For example, hidden terminals are diagnosed by detect-ing concurrent transmission by the stations followed by a
193
Anomaly Effect on PHY Effect on MAC Effect on NET Existing 802.11remediation
Informed remedi-ation
Hidden termi-nals
Collisionsthroughout thelength of thepacket
ReTx. due to col-lisions.
Degradedthroughput
Rate fallback Increase trans-mit power orenable collisionavoidance
Capture effect Collisions mostlyduring the pream-ble
ReTx. due to col-lisions. Strongerframe is received
Degradedthroughputand unfairness
Rate fallback Increase or de-crease tx. power
Noise Rise in calibratednoise floor
ReTx. due to cor-ruption of framesand high backoff
Degradedthroughput
Rate fallback Switch channel orassociate with al-ternate AP
Signalstrengthvariations
Correlated in-crease or decreasein RSSI
ReTx. due todropped packets
Degradedthroughput
Rate fallback Associate with al-ternate AP
Table 2: Propagation of faults at different layers of the stack. The faults converge to degraded performance athigher layers of the stack. Table also shows the existing 802.11 based remediation and informed remediationbased on root cause analysis.
retransmission by atleast one of the stations. This wouldrequire correlating information from distributed sniffers ascompared to looking at the observations from a single sniffer.
This process lead to the design of Mojo. When designingMojo, we desired the framework to be: (a) flexible so thatsniffers can be deployed anywhere in the network; (b) in-expensive to deploy; (c) accurate in diagnosing root causesof wireless performance degradation at the PHY layer forthe previously described physical effects; (d) capable of im-plementing efficient remedies for each of the diagnosed rootcauses; (e) efficient in terms of communication overhead;and, (f) able to perform near-real-time online diagnosis andremediation.
The three main components of the system are the wire-less sniffers, the data collection mechanism and the inferenceengine used to diagnose problems and suggest remedies. Inour initial design, the data collection and diagnosis opera-tions are centralized at a single server. The wireless snifferssense the underlying physical layer parameters and periodi-cally transmit a summary of the information to the inferenceengine via the AP. The inference engine collects this infor-mation from the sniffers and runs the detection algorithms.
We first describe the sniffer placement and then describehow the data is sent to the central server. Section 4 describesthe various detection algorithms that analyze the data fromthe sniffers, and assesses the detection algorithms’ accuracy.Section 5 discusses remedies.
3.1 Sniffer Placement and FunctionSniffer placement is an important factor for wireless net-
work monitoring, as it determines the coverage of the net-work. Due to the unreliable nature of the broadcast medium,wireless traces are inherently lossy; hence, a sub-optimalplacement of these sniffers could leave parts of the networkun-monitored.
Existing wireless network monitoring work has mainly fo-cused on performance monitoring and security monitoring todetect rogue APs [10]. As we will show, a key requirementof diagnosing root cause faults at the physical layer is thatalong with adequate coverage, multiple sniffer observationsare required. Existing work only focuses on placement ofsniffers to ensure complete coverage of the wireless network.
A number of traffic measurement studies have been donethat collect traffic statistics by monitoring the traffic flowingon the wired end of the network by using tools like SNMPand syslog (AP system logs) [15, 11]. Although these toolsprovide complete information of the traffic flowing on thewired end of the network, it provides limited visibility intothe wireless end of the network. These tools cannot recordfine grained information at the MAC and PHY layer andusually only provide aggregate statistics maintained by theAP.
To address the limitations of wired side monitoring, re-searchers have proposed wireless monitoring based on fixedsniffers. These sniffers are carefully placed relative to theclient positions in the wireless network. However, the au-thors in [31] observe that even with careful placement ofwireless sniffers, multiple wireless sniffer traces are requiredto be merged so as to account for data missed by one or moresniffers. Furthermore, often client locations are not knowna priori or these may change over time, requiring snifferslocations to be changed frequently.
An additional constraint of our fault diagnosis system isthat most faults are localized in the network. Hence, sniffersshould be collocated with the client stations. For example,only the client station that is close to a microwave oven issubject to noise/interference, but even the closest sniffer tothe client may not be able to sense the noise in the network.
To extract this fine grained information, we propose in-strumenting the client side driver to collect information aboutthe underlying physical layer. To collect information aboutthe physical layer we have instrumented the Atheros basedMadwifi driver [3]. This information is then aggregated atthe AP, and based on these distributed client side observa-tions faults are diagnosed. However, there are no constraintsin our design that require sniffers to be implemented only inthe client. In general, the sniffers are allowed to be placedanywhere in the network, with the recognition that non-client-side placement of sniffers results in a suboptimal pic-ture of the network.
3.2 Physical layer diagnosis informationIn this subsection we give the details of the PHY layer di-
agnosis information collected and the overhead in collecting
194
this information. In order to diagnose the root causes of theanomalies listed in Table 2, we need to capture three sourcesof information: network interference, signal strength varia-tions in access points and concurrent transmissions. Thisinformation is aggregated over an interval ofEPOCH INTERVAL, which could be adjusted to get finegrained data series of different physical layer metrics. For allour experiments we set the EPOCH INTERVAL to 10 sec.
The Atheros Madwifi driver periodically calibrates thenoise floor of the network. This noise floor is used as abenchmark for the PHY clear channel assessment (CCA)i.e. before a frame is transmitted, the noise floor is sam-pled and only if the sampled noise floor is less than a presetthreshold is the transmission initiated. By examining thethe open source version of the hardware abstraction layer(HAL) used in the OpenBSD project we were able to identifythe hardware register that the driver queries for the noisefloor. Thus, once every EPOCH INTERVAL, the noise floorregister is sampled and the sampled noise floor is transmit-ted to the central server. The sampled noise floor value is 4bytes long.
To detect long term anomalous signal strength variationsat the AP, the sniffer extracts the signal strength field fromthe Prism header for every beacon frame received from theassociated AP. The sniffer computes the average of the re-ceived signal strength over 10 consecutive beacon framesreceived from the AP over a period of EPOCH INTERVAL.These signal strength aggregates along with the start andend sequence numbers of every aggregate are transmittedto the AP. Assuming a default of a 100 ms beacon interval,and each record being 8 bytes long (4 bytes signal strength,2 byte start sequence no, 2 bytes end sequence number),only 80 bytes of information are transmitted everyEPOCH INTERVAL to detect signal strength variations.
Hidden terminals are diagnosed by detecting concurrenttransmissions in the network. To detect concurrent trans-missions the exact time at which data frames are transmit-ted over the air are recorded by each client station. By com-paring the starting transmission time and duration of eachpacket transmission, the central inference engine could iden-tify concurrent transmissions. However, due to limitationsof the existing Atheros driver, we are not able to extractthe exact time at which the data frame was transmitted.1
However, the Atheros driver timestamps every frame thatis received over the interface using an on-board 64-bit mi-crosecond resolution timer. By subtracting the duration ofthe packet transmission and the length of the preamble wecan recover the exact time at which the frame was transmit-ted. Thus, to prototype our implementation of detection ofhidden terminals, we used two wireless interfaces on eachstation in the network. The secondary radio used to recordthe timestamps is placed in monitor mode, and hence doesnot interfere with the primary client radio. Also, the prox-imity of the two radios ensures that the secondary radioreceives every frame transmitted by the primary radio due
1This is because after the driver prepends the 802.11 headerto the sk buff, the sk buff is placed at the end of the hard-ware transmit queue and an interrupt is generated statingcompletion of transmission to allow the driver to processthe next frame. Based on the length of the transmit queue,a variable delay is introduced before the frame is actuallytransmitted. Hence, it is not possible based on the currentdriver design to accurately timestamp the frame.
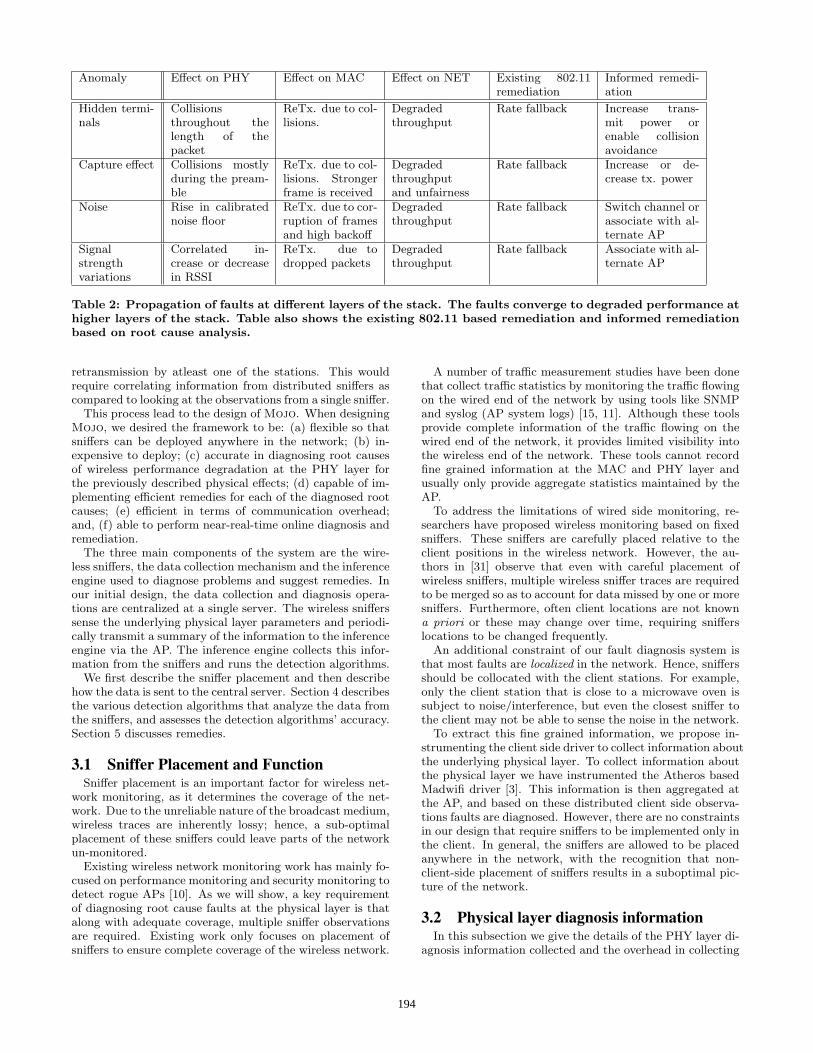
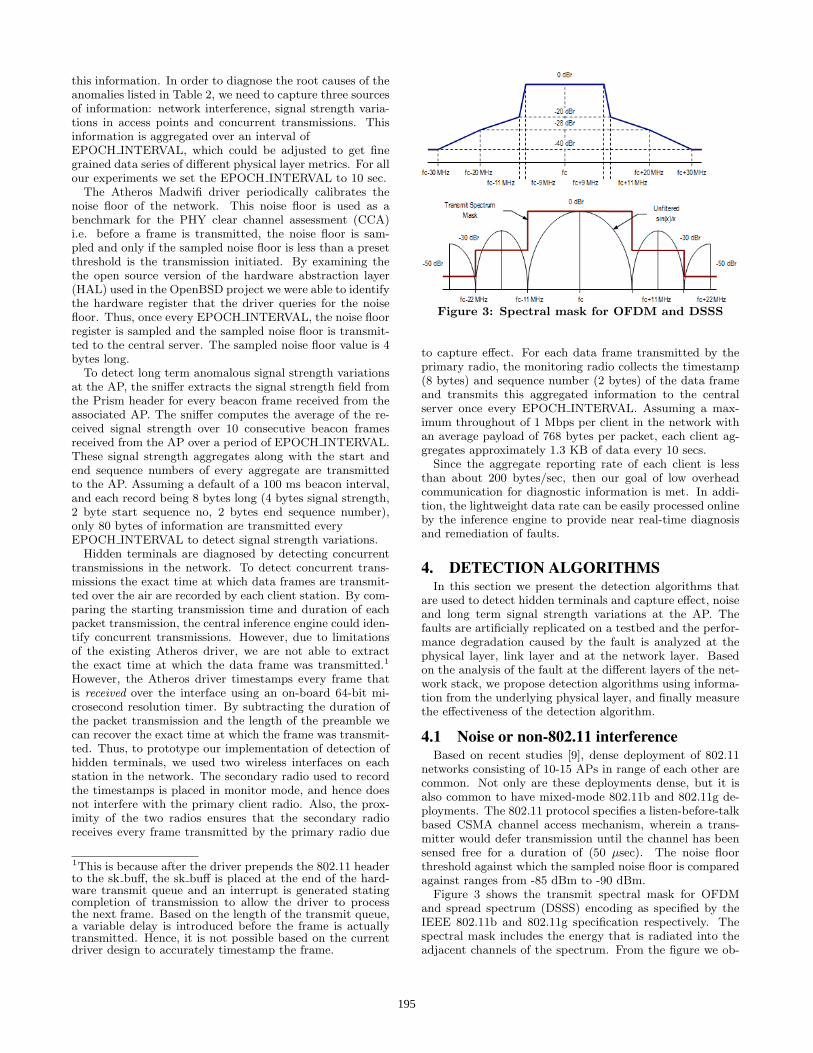
Figure 3: Spectral mask for OFDM and DSSS
to capture effect. For each data frame transmitted by theprimary radio, the monitoring radio collects the timestamp(8 bytes) and sequence number (2 bytes) of the data frameand transmits this aggregated information to the centralserver once every EPOCH INTERVAL. Assuming a max-imum throughout of 1 Mbps per client in the network withan average payload of 768 bytes per packet, each client ag-gregates approximately 1.3 KB of data every 10 secs.
Since the aggregate reporting rate of each client is lessthan about 200 bytes/sec, then our goal of low overheadcommunication for diagnostic information is met. In addi-tion, the lightweight data rate can be easily processed onlineby the inference engine to provide near real-time diagnosisand remediation of faults.
4. DETECTION ALGORITHMSIn this section we present the detection algorithms that
are used to detect hidden terminals and capture effect, noiseand long term signal strength variations at the AP. Thefaults are artificially replicated on a testbed and the perfor-mance degradation caused by the fault is analyzed at thephysical layer, link layer and at the network layer. Basedon the analysis of the fault at the different layers of the net-work stack, we propose detection algorithms using informa-tion from the underlying physical layer, and finally measurethe effectiveness of the detection algorithm.
4.1 Noise or non-802.11 interferenceBased on recent studies [9], dense deployment of 802.11
networks consisting of 10-15 APs in range of each other arecommon. Not only are these deployments dense, but it isalso common to have mixed-mode 802.11b and 802.11g de-ployments. The 802.11 protocol specifies a listen-before-talkbased CSMA channel access mechanism, wherein a trans-mitter would defer transmission until the channel has beensensed free for a duration of (50 µsec). The noise floorthreshold against which the sampled noise floor is comparedagainst ranges from -85 dBm to -90 dBm.
Figure 3 shows the transmit spectral mask for OFDMand spread spectrum (DSSS) encoding as specified by theIEEE 802.11b and 802.11g specification respectively. Thespectral mask includes the energy that is radiated into theadjacent channels of the spectrum. From the figure we ob-
195
serve that OFDM has much higher energy radiation as com-pared to spread spectrum. Even at 22 MHz from the cen-ter frequency (Fc + 22 MHz), the energy radiation of aspread spectrum transmission is -50 dBr and that of OFDMis -30 dBr. Thus, assuming the typical transmit power ofan AP of 20 dBm and a path loss of -60 dBm for a densedeployment of APs, an OFDM transmission on channel 6(2.437 GHz) would radiate approximately -70 dBm power inchannel 11 (2.452 GHz). This radiated energy that cannotbe decoded is sensed as noise by the transmitter on channel11, and causes the transmitter to defer until the transmis-sion of the OFDM transmission on channel 6 is completed.Hence, even with careful planning of the network, the widespectral mask of OFDM transmissions cause interference innon-overlapping channels. This noise level increases withmultiple access points operating in mixed mode and inter-fering with each other.
An alternate source of noise/interference in the networkis the energy radiated by the non-802.11 devices like mi-crowave ovens and cordless phones, which also operate in2.4 GHz ISM band. Most non-802.11 devices like microwaveovens and cordless phones operating in the ISM band do notfollow a channel access protocol. Due to the lack of a com-mon channel access protocol, there is significant interferencecaused by these devices.
To overcome the above problems, it is important to be ableto sense/measure the level of noise/interference on the chan-nel. With detailed knowledge of the noise level, adaptivechannel selection algorithms could be implemented whichcould reduce the degradation in performance.
4.1.1 Impact of noise at MAC and NET layerTo measure the impact of noise/non-802.11 interference
on the network stack we conduct controlled experiments us-ing the Agilent 4438C signal generator as a calibrated noisesource. A frequency modulated signal, similar to the in-terference caused by microwave ovens and cordless phones,was generated. The experiment setup consisted of node Aassociated with the AP. The signal generator was only con-nected to node A using a RF splitter. The other port of theRF splitter was connected to the sniffer, which logged thetimestamp of the frames received and transmitted by nodeA.
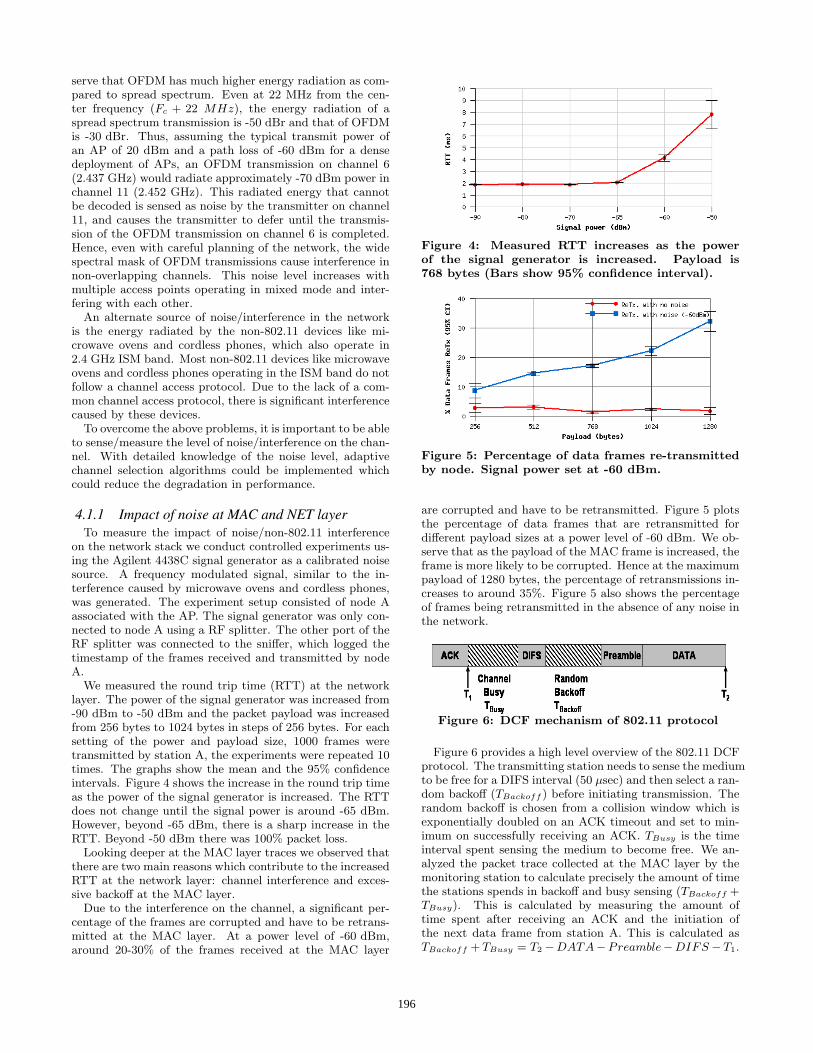
We measured the round trip time (RTT) at the networklayer. The power of the signal generator was increased from-90 dBm to -50 dBm and the packet payload was increasedfrom 256 bytes to 1024 bytes in steps of 256 bytes. For eachsetting of the power and payload size, 1000 frames weretransmitted by station A, the experiments were repeated 10times. The graphs show the mean and the 95% confidenceintervals. Figure 4 shows the increase in the round trip timeas the power of the signal generator is increased. The RTTdoes not change until the signal power is around -65 dBm.However, beyond -65 dBm, there is a sharp increase in theRTT. Beyond -50 dBm there was 100% packet loss.
Looking deeper at the MAC layer traces we observed thatthere are two main reasons which contribute to the increasedRTT at the network layer: channel interference and exces-sive backoff at the MAC layer.
Due to the interference on the channel, a significant per-centage of the frames are corrupted and have to be retrans-mitted at the MAC layer. At a power level of -60 dBm,around 20-30% of the frames received at the MAC layer
Figure 4: Measured RTT increases as the powerof the signal generator is increased. Payload is768 bytes (Bars show 95% confidence interval).
Figure 5: Percentage of data frames re-transmittedby node. Signal power set at -60 dBm.
are corrupted and have to be retransmitted. Figure 5 plotsthe percentage of data frames that are retransmitted fordifferent payload sizes at a power level of -60 dBm. We ob-serve that as the payload of the MAC frame is increased, theframe is more likely to be corrupted. Hence at the maximumpayload of 1280 bytes, the percentage of retransmissions in-creases to around 35%. Figure 5 also shows the percentageof frames being retransmitted in the absence of any noise inthe network.
Figure 6: DCF mechanism of 802.11 protocol
Figure 6 provides a high level overview of the 802.11 DCFprotocol. The transmitting station needs to sense the mediumto be free for a DIFS interval (50 µsec) and then select a ran-dom backoff (TBackoff ) before initiating transmission. Therandom backoff is chosen from a collision window which isexponentially doubled on an ACK timeout and set to min-imum on successfully receiving an ACK. TBusy is the timeinterval spent sensing the medium to become free. We an-alyzed the packet trace collected at the MAC layer by themonitoring station to calculate precisely the amount of timethe stations spends in backoff and busy sensing (TBackoff +TBusy). This is calculated by measuring the amount oftime spent after receiving an ACK and the initiation ofthe next data frame from station A. This is calculated asTBackoff + TBusy = T2 −DATA−Preamble−DIFS− T1.
196
Power (dBm) Mean (µsec) Std.Dev. (µsec)
-90 96.28 160.17-80 96.71 168.60-70 105.37 224.88-65 212.60 876.19-60 286.35 716.97-50 960.28 1978.08
Table 3: Mean and std. dev. of the time spent inbackoff and busy sensing the medium
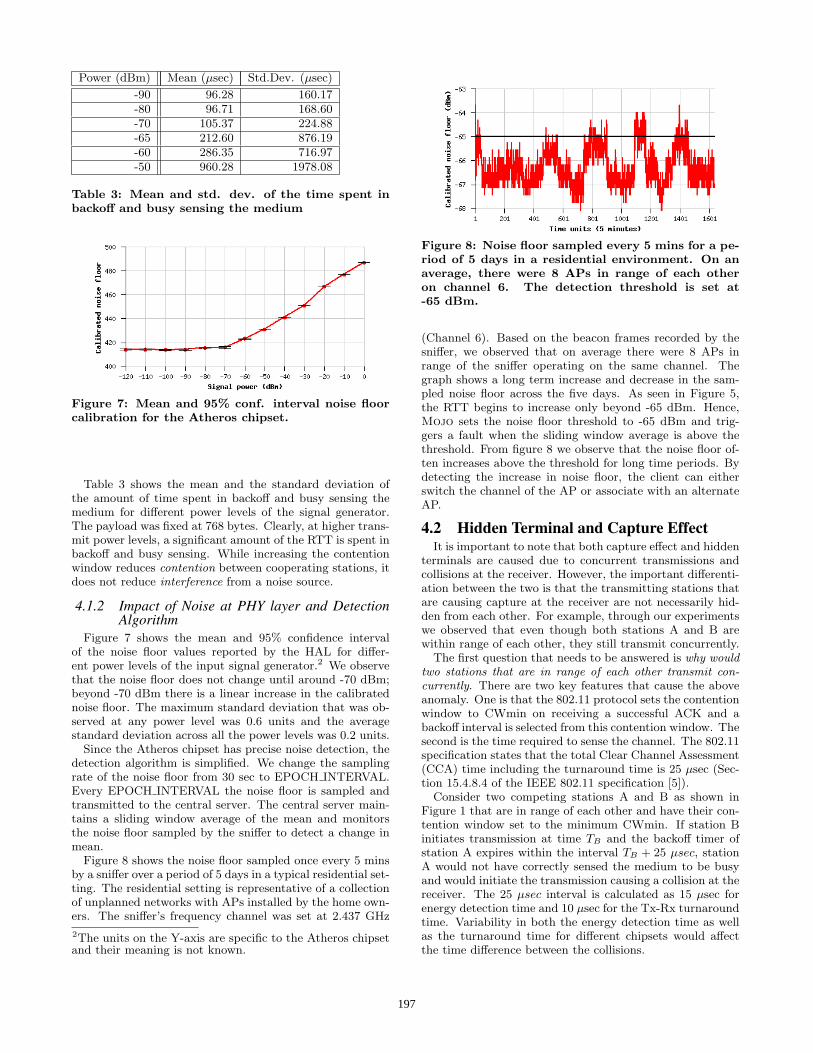
Figure 7: Mean and 95% conf. interval noise floorcalibration for the Atheros chipset.
Table 3 shows the mean and the standard deviation ofthe amount of time spent in backoff and busy sensing themedium for different power levels of the signal generator.The payload was fixed at 768 bytes. Clearly, at higher trans-mit power levels, a significant amount of the RTT is spent inbackoff and busy sensing. While increasing the contentionwindow reduces contention between cooperating stations, itdoes not reduce interference from a noise source.
4.1.2 Impact of Noise at PHY layer and DetectionAlgorithm
Figure 7 shows the mean and 95% confidence intervalof the noise floor values reported by the HAL for differ-ent power levels of the input signal generator.2 We observethat the noise floor does not change until around -70 dBm;beyond -70 dBm there is a linear increase in the calibratednoise floor. The maximum standard deviation that was ob-served at any power level was 0.6 units and the averagestandard deviation across all the power levels was 0.2 units.
Since the Atheros chipset has precise noise detection, thedetection algorithm is simplified. We change the samplingrate of the noise floor from 30 sec to EPOCH INTERVAL.Every EPOCH INTERVAL the noise floor is sampled andtransmitted to the central server. The central server main-tains a sliding window average of the mean and monitorsthe noise floor sampled by the sniffer to detect a change inmean.
Figure 8 shows the noise floor sampled once every 5 minsby a sniffer over a period of 5 days in a typical residential set-ting. The residential setting is representative of a collectionof unplanned networks with APs installed by the home own-ers. The sniffer’s frequency channel was set at 2.437 GHz
2The units on the Y-axis are specific to the Atheros chipsetand their meaning is not known.
Figure 8: Noise floor sampled every 5 mins for a pe-riod of 5 days in a residential environment. On anaverage, there were 8 APs in range of each otheron channel 6. The detection threshold is set at-65 dBm.
(Channel 6). Based on the beacon frames recorded by thesniffer, we observed that on average there were 8 APs inrange of the sniffer operating on the same channel. Thegraph shows a long term increase and decrease in the sam-pled noise floor across the five days. As seen in Figure 5,the RTT begins to increase only beyond -65 dBm. Hence,Mojo sets the noise floor threshold to -65 dBm and trig-gers a fault when the sliding window average is above thethreshold. From figure 8 we observe that the noise floor of-ten increases above the threshold for long time periods. Bydetecting the increase in noise floor, the client can eitherswitch the channel of the AP or associate with an alternateAP.
4.2 Hidden Terminal and Capture EffectIt is important to note that both capture effect and hidden
terminals are caused due to concurrent transmissions andcollisions at the receiver. However, the important differenti-ation between the two is that the transmitting stations thatare causing capture at the receiver are not necessarily hid-den from each other. For example, through our experimentswe observed that even though both stations A and B arewithin range of each other, they still transmit concurrently.
The first question that needs to be answered is why wouldtwo stations that are in range of each other transmit con-currently. There are two key features that cause the aboveanomaly. One is that the 802.11 protocol sets the contentionwindow to CWmin on receiving a successful ACK and abackoff interval is selected from this contention window. Thesecond is the time required to sense the channel. The 802.11specification states that the total Clear Channel Assessment(CCA) time including the turnaround time is 25 µsec (Sec-tion 15.4.8.4 of the IEEE 802.11 specification [5]).
Consider two competing stations A and B as shown inFigure 1 that are in range of each other and have their con-tention window set to the minimum CWmin. If station Binitiates transmission at time TB and the backoff timer ofstation A expires within the interval TB + 25 µsec, stationA would not have correctly sensed the medium to be busyand would initiate the transmission causing a collision at thereceiver. The 25 µsec interval is calculated as 15 µsec forenergy detection time and 10 µsec for the Tx-Rx turnaroundtime. Variability in both the energy detection time as wellas the turnaround time for different chipsets would affectthe time difference between the collisions.
197
Metric Capture(11 Mbps)
Capture(5.5 Mbps)
Hidden Terminal(11 Mbps)
Hidden Terminal(5.5 Mbps)
Degradation in goodput1− Goodput with anomaly
Goodput with no anomaly
0.03 0.05 0.39 0.48
Avg. transmission per dataframe
Total frames Tx.No. of unique frames Tx
1.3A(1.42,±0.14)B(1.18,±0.09)
1.56A(1.87,±0.23)B(1.25,±0.05)
1.97B(1.57,±0.17)C(2.37,±0.11)
2.06B(1.78,±0.33)C(2.34,±0.07)
% of data frame that collided 5.3 5.9 40.46 41.19% of data frame collisions af-ter preamble
2.29 2.44 13.36 19.89
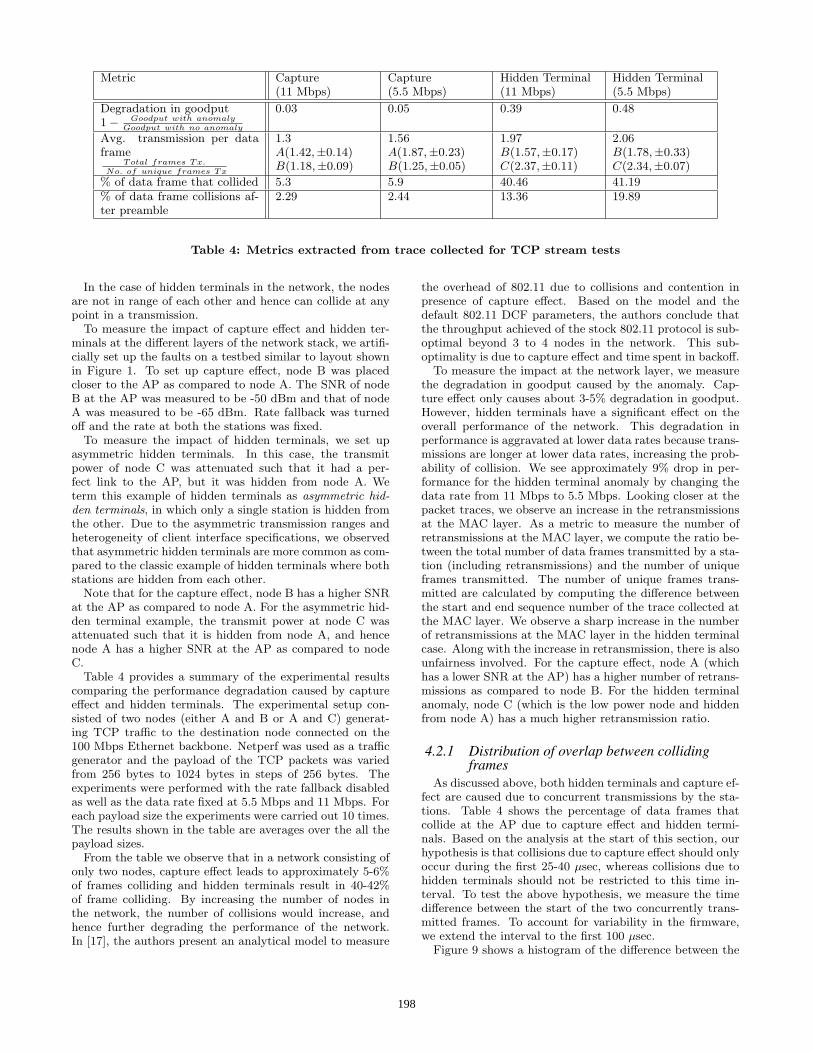
Table 4: Metrics extracted from trace collected for TCP stream tests
In the case of hidden terminals in the network, the nodesare not in range of each other and hence can collide at anypoint in a transmission.
To measure the impact of capture effect and hidden ter-minals at the different layers of the network stack, we artifi-cially set up the faults on a testbed similar to layout shownin Figure 1. To set up capture effect, node B was placedcloser to the AP as compared to node A. The SNR of nodeB at the AP was measured to be -50 dBm and that of nodeA was measured to be -65 dBm. Rate fallback was turnedoff and the rate at both the stations was fixed.
To measure the impact of hidden terminals, we set upasymmetric hidden terminals. In this case, the transmitpower of node C was attenuated such that it had a per-fect link to the AP, but it was hidden from node A. Weterm this example of hidden terminals as asymmetric hid-den terminals, in which only a single station is hidden fromthe other. Due to the asymmetric transmission ranges andheterogeneity of client interface specifications, we observedthat asymmetric hidden terminals are more common as com-pared to the classic example of hidden terminals where bothstations are hidden from each other.
Note that for the capture effect, node B has a higher SNRat the AP as compared to node A. For the asymmetric hid-den terminal example, the transmit power at node C wasattenuated such that it is hidden from node A, and hencenode A has a higher SNR at the AP as compared to nodeC.
Table 4 provides a summary of the experimental resultscomparing the performance degradation caused by captureeffect and hidden terminals. The experimental setup con-sisted of two nodes (either A and B or A and C) generat-ing TCP traffic to the destination node connected on the100 Mbps Ethernet backbone. Netperf was used as a trafficgenerator and the payload of the TCP packets was variedfrom 256 bytes to 1024 bytes in steps of 256 bytes. Theexperiments were performed with the rate fallback disabledas well as the data rate fixed at 5.5 Mbps and 11 Mbps. Foreach payload size the experiments were carried out 10 times.The results shown in the table are averages over the all thepayload sizes.
From the table we observe that in a network consisting ofonly two nodes, capture effect leads to approximately 5-6%of frames colliding and hidden terminals result in 40-42%of frame colliding. By increasing the number of nodes inthe network, the number of collisions would increase, andhence further degrading the performance of the network.In [17], the authors present an analytical model to measure
the overhead of 802.11 due to collisions and contention inpresence of capture effect. Based on the model and thedefault 802.11 DCF parameters, the authors conclude thatthe throughput achieved of the stock 802.11 protocol is sub-optimal beyond 3 to 4 nodes in the network. This sub-optimality is due to capture effect and time spent in backoff.
To measure the impact at the network layer, we measurethe degradation in goodput caused by the anomaly. Cap-ture effect only causes about 3-5% degradation in goodput.However, hidden terminals have a significant effect on theoverall performance of the network. This degradation inperformance is aggravated at lower data rates because trans-missions are longer at lower data rates, increasing the prob-ability of collision. We see approximately 9% drop in per-formance for the hidden terminal anomaly by changing thedata rate from 11 Mbps to 5.5 Mbps. Looking closer at thepacket traces, we observe an increase in the retransmissionsat the MAC layer. As a metric to measure the number ofretransmissions at the MAC layer, we compute the ratio be-tween the total number of data frames transmitted by a sta-tion (including retransmissions) and the number of uniqueframes transmitted. The number of unique frames trans-mitted are calculated by computing the difference betweenthe start and end sequence number of the trace collected atthe MAC layer. We observe a sharp increase in the numberof retransmissions at the MAC layer in the hidden terminalcase. Along with the increase in retransmission, there is alsounfairness involved. For the capture effect, node A (whichhas a lower SNR at the AP) has a higher number of retrans-missions as compared to node B. For the hidden terminalanomaly, node C (which is the low power node and hiddenfrom node A) has a much higher retransmission ratio.
4.2.1 Distribution of overlap between collidingframes
As discussed above, both hidden terminals and capture ef-fect are caused due to concurrent transmissions by the sta-tions. Table 4 shows the percentage of data frames thatcollide at the AP due to capture effect and hidden termi-nals. Based on the analysis at the start of this section, ourhypothesis is that collisions due to capture effect should onlyoccur during the first 25-40 µsec, whereas collisions due tohidden terminals should not be restricted to this time in-terval. To test the above hypothesis, we measure the timedifference between the start of the two concurrently trans-mitted frames. To account for variability in the firmware,we extend the interval to the first 100 µsec.
Figure 9 shows a histogram of the difference between the
198
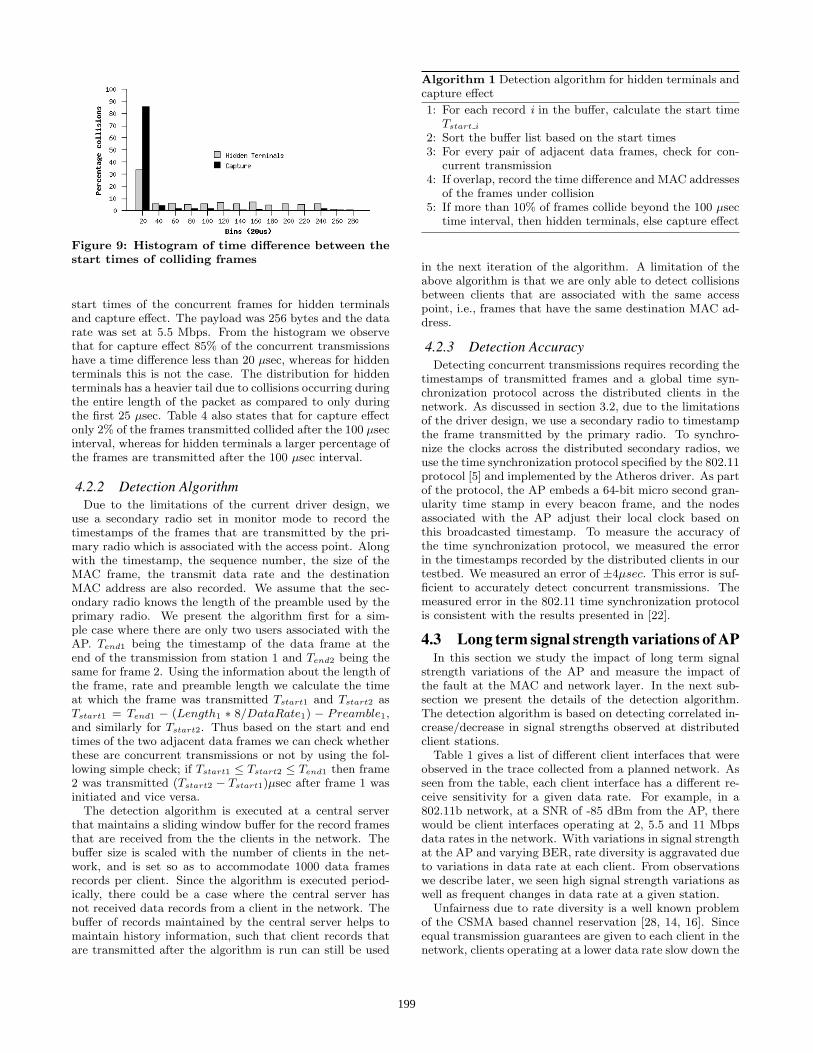
Figure 9: Histogram of time difference between thestart times of colliding frames
start times of the concurrent frames for hidden terminalsand capture effect. The payload was 256 bytes and the datarate was set at 5.5 Mbps. From the histogram we observethat for capture effect 85% of the concurrent transmissionshave a time difference less than 20 µsec, whereas for hiddenterminals this is not the case. The distribution for hiddenterminals has a heavier tail due to collisions occurring duringthe entire length of the packet as compared to only duringthe first 25 µsec. Table 4 also states that for capture effectonly 2% of the frames transmitted collided after the 100 µsecinterval, whereas for hidden terminals a larger percentage ofthe frames are transmitted after the 100 µsec interval.
4.2.2 Detection AlgorithmDue to the limitations of the current driver design, we
use a secondary radio set in monitor mode to record thetimestamps of the frames that are transmitted by the pri-mary radio which is associated with the access point. Alongwith the timestamp, the sequence number, the size of theMAC frame, the transmit data rate and the destinationMAC address are also recorded. We assume that the sec-ondary radio knows the length of the preamble used by theprimary radio. We present the algorithm first for a sim-ple case where there are only two users associated with theAP. Tend1 being the timestamp of the data frame at theend of the transmission from station 1 and Tend2 being thesame for frame 2. Using the information about the length ofthe frame, rate and preamble length we calculate the timeat which the frame was transmitted Tstart1 and Tstart2 asTstart1 = Tend1 − (Length1 ∗ 8/DataRate1) − Preamble1,and similarly for Tstart2. Thus based on the start and endtimes of the two adjacent data frames we can check whetherthese are concurrent transmissions or not by using the fol-lowing simple check; if Tstart1 ≤ Tstart2 ≤ Tend1 then frame2 was transmitted (Tstart2 − Tstart1)µsec after frame 1 wasinitiated and vice versa.
The detection algorithm is executed at a central serverthat maintains a sliding window buffer for the record framesthat are received from the the clients in the network. Thebuffer size is scaled with the number of clients in the net-work, and is set so as to accommodate 1000 data framesrecords per client. Since the algorithm is executed period-ically, there could be a case where the central server hasnot received data records from a client in the network. Thebuffer of records maintained by the central server helps tomaintain history information, such that client records thatare transmitted after the algorithm is run can still be used
Algorithm 1 Detection algorithm for hidden terminals andcapture effect
1: For each record i in the buffer, calculate the start timeTstart i
2: Sort the buffer list based on the start times3: For every pair of adjacent data frames, check for con-
current transmission4: If overlap, record the time difference and MAC addresses
of the frames under collision5: If more than 10% of frames collide beyond the 100 µsec
time interval, then hidden terminals, else capture effect
in the next iteration of the algorithm. A limitation of theabove algorithm is that we are only able to detect collisionsbetween clients that are associated with the same accesspoint, i.e., frames that have the same destination MAC ad-dress.
4.2.3 Detection AccuracyDetecting concurrent transmissions requires recording the
timestamps of transmitted frames and a global time syn-chronization protocol across the distributed clients in thenetwork. As discussed in section 3.2, due to the limitationsof the driver design, we use a secondary radio to timestampthe frame transmitted by the primary radio. To synchro-nize the clocks across the distributed secondary radios, weuse the time synchronization protocol specified by the 802.11protocol [5] and implemented by the Atheros driver. As partof the protocol, the AP embeds a 64-bit micro second gran-ularity time stamp in every beacon frame, and the nodesassociated with the AP adjust their local clock based onthis broadcasted timestamp. To measure the accuracy ofthe time synchronization protocol, we measured the errorin the timestamps recorded by the distributed clients in ourtestbed. We measured an error of ±4µsec. This error is suf-ficient to accurately detect concurrent transmissions. Themeasured error in the 802.11 time synchronization protocolis consistent with the results presented in [22].
4.3 Long term signal strength variations of APIn this section we study the impact of long term signal
strength variations of the AP and measure the impact ofthe fault at the MAC and network layer. In the next sub-section we present the details of the detection algorithm.The detection algorithm is based on detecting correlated in-crease/decrease in signal strengths observed at distributedclient stations.
Table 1 gives a list of different client interfaces that wereobserved in the trace collected from a planned network. Asseen from the table, each client interface has a different re-ceive sensitivity for a given data rate. For example, in a802.11b network, at a SNR of -85 dBm from the AP, therewould be client interfaces operating at 2, 5.5 and 11 Mbpsdata rates in the network. With variations in signal strengthat the AP and varying BER, rate diversity is aggravated dueto variations in data rate at each client. From observationswe describe later, we seen high signal strength variations aswell as frequent changes in data rate at a given station.
Unfairness due to rate diversity is a well known problemof the CSMA based channel reservation [28, 14, 16]. Sinceequal transmission guarantees are given to each client in thenetwork, clients operating at a lower data rate slow down the
199
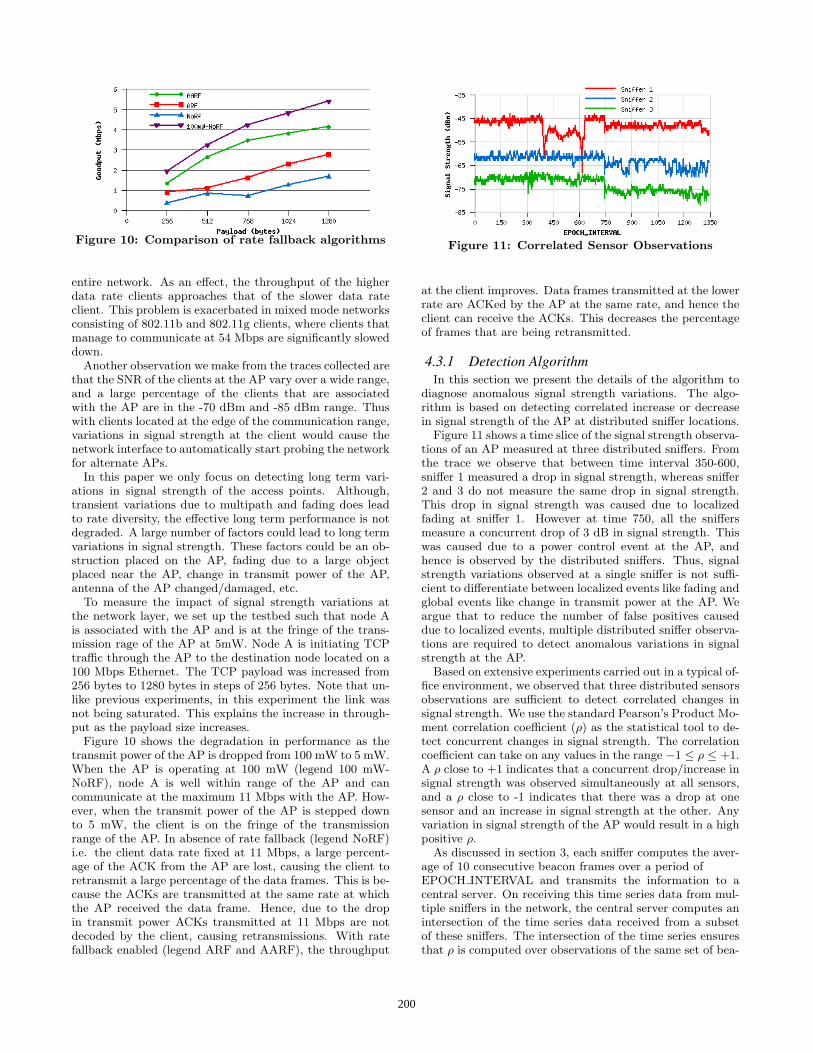
Figure 10: Comparison of rate fallback algorithms
entire network. As an effect, the throughput of the higherdata rate clients approaches that of the slower data rateclient. This problem is exacerbated in mixed mode networksconsisting of 802.11b and 802.11g clients, where clients thatmanage to communicate at 54 Mbps are significantly sloweddown.
Another observation we make from the traces collected arethat the SNR of the clients at the AP vary over a wide range,and a large percentage of the clients that are associatedwith the AP are in the -70 dBm and -85 dBm range. Thuswith clients located at the edge of the communication range,variations in signal strength at the client would cause thenetwork interface to automatically start probing the networkfor alternate APs.
In this paper we only focus on detecting long term vari-ations in signal strength of the access points. Although,transient variations due to multipath and fading does leadto rate diversity, the effective long term performance is notdegraded. A large number of factors could lead to long termvariations in signal strength. These factors could be an ob-struction placed on the AP, fading due to a large objectplaced near the AP, change in transmit power of the AP,antenna of the AP changed/damaged, etc.
To measure the impact of signal strength variations atthe network layer, we set up the testbed such that node Ais associated with the AP and is at the fringe of the trans-mission rage of the AP at 5mW. Node A is initiating TCPtraffic through the AP to the destination node located on a100 Mbps Ethernet. The TCP payload was increased from256 bytes to 1280 bytes in steps of 256 bytes. Note that un-like previous experiments, in this experiment the link wasnot being saturated. This explains the increase in through-put as the payload size increases.
Figure 10 shows the degradation in performance as thetransmit power of the AP is dropped from 100 mW to 5 mW.When the AP is operating at 100 mW (legend 100 mW-NoRF), node A is well within range of the AP and cancommunicate at the maximum 11 Mbps with the AP. How-ever, when the transmit power of the AP is stepped downto 5 mW, the client is on the fringe of the transmissionrange of the AP. In absence of rate fallback (legend NoRF)i.e. the client data rate fixed at 11 Mbps, a large percent-age of the ACK from the AP are lost, causing the client toretransmit a large percentage of the data frames. This is be-cause the ACKs are transmitted at the same rate at whichthe AP received the data frame. Hence, due to the dropin transmit power ACKs transmitted at 11 Mbps are notdecoded by the client, causing retransmissions. With ratefallback enabled (legend ARF and AARF), the throughput
Figure 11: Correlated Sensor Observations
at the client improves. Data frames transmitted at the lowerrate are ACKed by the AP at the same rate, and hence theclient can receive the ACKs. This decreases the percentageof frames that are being retransmitted.
4.3.1 Detection AlgorithmIn this section we present the details of the algorithm to
diagnose anomalous signal strength variations. The algo-rithm is based on detecting correlated increase or decreasein signal strength of the AP at distributed sniffer locations.
Figure 11 shows a time slice of the signal strength observa-tions of an AP measured at three distributed sniffers. Fromthe trace we observe that between time interval 350-600,sniffer 1 measured a drop in signal strength, whereas sniffer2 and 3 do not measure the same drop in signal strength.This drop in signal strength was caused due to localizedfading at sniffer 1. However at time 750, all the sniffersmeasure a concurrent drop of 3 dB in signal strength. Thiswas caused due to a power control event at the AP, andhence is observed by the distributed sniffers. Thus, signalstrength variations observed at a single sniffer is not suffi-cient to differentiate between localized events like fading andglobal events like change in transmit power at the AP. Weargue that to reduce the number of false positives causeddue to localized events, multiple distributed sniffer observa-tions are required to detect anomalous variations in signalstrength at the AP.
Based on extensive experiments carried out in a typical of-fice environment, we observed that three distributed sensorsobservations are sufficient to detect correlated changes insignal strength. We use the standard Pearson’s Product Mo-ment correlation coefficient (ρ) as the statistical tool to de-tect concurrent changes in signal strength. The correlationcoefficient can take on any values in the range −1 ≤ ρ ≤ +1.A ρ close to +1 indicates that a concurrent drop/increase insignal strength was observed simultaneously at all sensors,and a ρ close to -1 indicates that there was a drop at onesensor and an increase in signal strength at the other. Anyvariation in signal strength of the AP would result in a highpositive ρ.
As discussed in section 3, each sniffer computes the aver-age of 10 consecutive beacon frames over a period ofEPOCH INTERVAL and transmits the information to acentral server. On receiving this time series data from mul-tiple sniffers in the network, the central server computes anintersection of the time series data received from a subsetof these sniffers. The intersection of the time series ensuresthat ρ is computed over observations of the same set of bea-
200
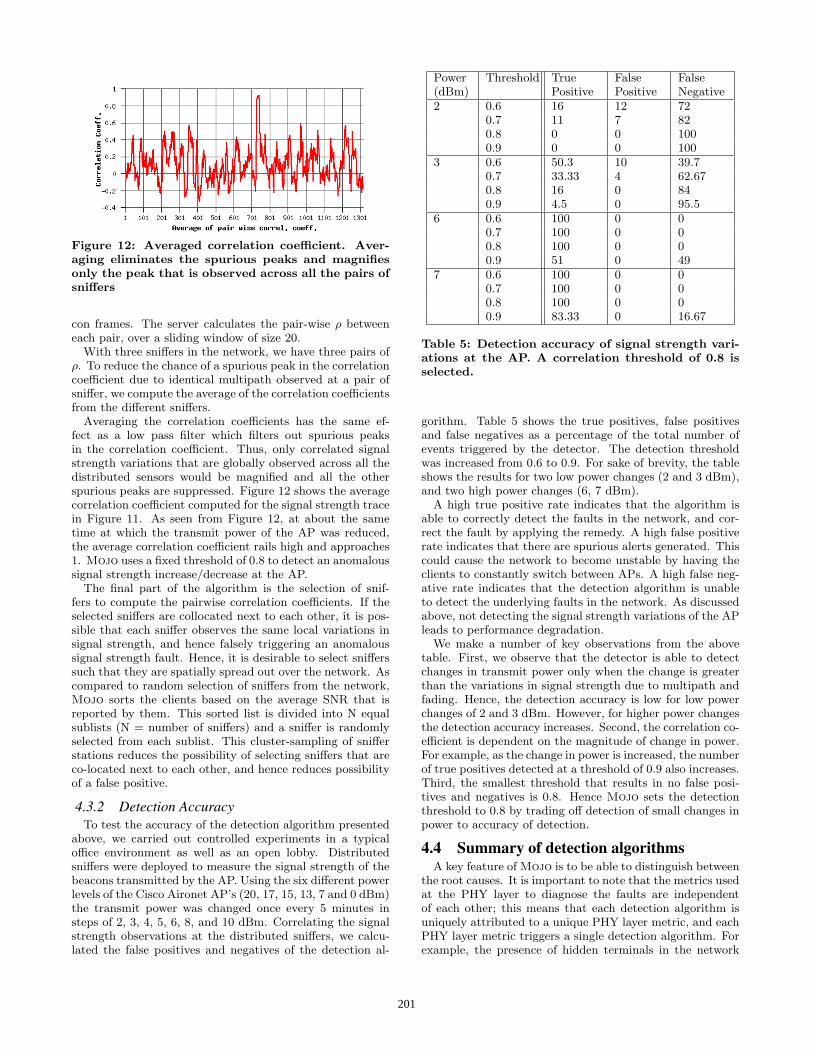
Figure 12: Averaged correlation coefficient. Aver-aging eliminates the spurious peaks and magnifiesonly the peak that is observed across all the pairs ofsniffers
con frames. The server calculates the pair-wise ρ betweeneach pair, over a sliding window of size 20.
With three sniffers in the network, we have three pairs ofρ. To reduce the chance of a spurious peak in the correlationcoefficient due to identical multipath observed at a pair ofsniffer, we compute the average of the correlation coefficientsfrom the different sniffers.
Averaging the correlation coefficients has the same ef-fect as a low pass filter which filters out spurious peaksin the correlation coefficient. Thus, only correlated signalstrength variations that are globally observed across all thedistributed sensors would be magnified and all the otherspurious peaks are suppressed. Figure 12 shows the averagecorrelation coefficient computed for the signal strength tracein Figure 11. As seen from Figure 12, at about the sametime at which the transmit power of the AP was reduced,the average correlation coefficient rails high and approaches1. Mojo uses a fixed threshold of 0.8 to detect an anomaloussignal strength increase/decrease at the AP.
The final part of the algorithm is the selection of snif-fers to compute the pairwise correlation coefficients. If theselected sniffers are collocated next to each other, it is pos-sible that each sniffer observes the same local variations insignal strength, and hence falsely triggering an anomaloussignal strength fault. Hence, it is desirable to select snifferssuch that they are spatially spread out over the network. Ascompared to random selection of sniffers from the network,Mojo sorts the clients based on the average SNR that isreported by them. This sorted list is divided into N equalsublists (N = number of sniffers) and a sniffer is randomlyselected from each sublist. This cluster-sampling of snifferstations reduces the possibility of selecting sniffers that areco-located next to each other, and hence reduces possibilityof a false positive.
4.3.2 Detection AccuracyTo test the accuracy of the detection algorithm presented
above, we carried out controlled experiments in a typicaloffice environment as well as an open lobby. Distributedsniffers were deployed to measure the signal strength of thebeacons transmitted by the AP. Using the six different powerlevels of the Cisco Aironet AP’s (20, 17, 15, 13, 7 and 0 dBm)the transmit power was changed once every 5 minutes insteps of 2, 3, 4, 5, 6, 8, and 10 dBm. Correlating the signalstrength observations at the distributed sniffers, we calcu-lated the false positives and negatives of the detection al-
Power(dBm)
Threshold TruePositive
FalsePositive
FalseNegative
2 0.6 16 12 720.7 11 7 820.8 0 0 1000.9 0 0 100
3 0.6 50.3 10 39.70.7 33.33 4 62.670.8 16 0 840.9 4.5 0 95.5
6 0.6 100 0 00.7 100 0 00.8 100 0 00.9 51 0 49
7 0.6 100 0 00.7 100 0 00.8 100 0 00.9 83.33 0 16.67
Table 5: Detection accuracy of signal strength vari-ations at the AP. A correlation threshold of 0.8 isselected.
gorithm. Table 5 shows the true positives, false positivesand false negatives as a percentage of the total number ofevents triggered by the detector. The detection thresholdwas increased from 0.6 to 0.9. For sake of brevity, the tableshows the results for two low power changes (2 and 3 dBm),and two high power changes (6, 7 dBm).
A high true positive rate indicates that the algorithm isable to correctly detect the faults in the network, and cor-rect the fault by applying the remedy. A high false positiverate indicates that there are spurious alerts generated. Thiscould cause the network to become unstable by having theclients to constantly switch between APs. A high false neg-ative rate indicates that the detection algorithm is unableto detect the underlying faults in the network. As discussedabove, not detecting the signal strength variations of the APleads to performance degradation.
We make a number of key observations from the abovetable. First, we observe that the detector is able to detectchanges in transmit power only when the change is greaterthan the variations in signal strength due to multipath andfading. Hence, the detection accuracy is low for low powerchanges of 2 and 3 dBm. However, for higher power changesthe detection accuracy increases. Second, the correlation co-efficient is dependent on the magnitude of change in power.For example, as the change in power is increased, the numberof true positives detected at a threshold of 0.9 also increases.Third, the smallest threshold that results in no false posi-tives and negatives is 0.8. Hence Mojo sets the detectionthreshold to 0.8 by trading off detection of small changes inpower to accuracy of detection.
4.4 Summary of detection algorithmsA key feature of Mojo is to be able to distinguish between
the root causes. It is important to note that the metrics usedat the PHY layer to diagnose the faults are independentof each other; this means that each detection algorithm isuniquely attributed to a unique PHY layer metric, and eachPHY layer metric triggers a single detection algorithm. Forexample, the presence of hidden terminals in the network
201
would not lead to a long term increase in the noise flooror change the signal strength at the AP. Hence, each faultcan be independently diagnosed and does not depend on thepresence/absence of the others. No specific ordering is re-quired to detect the faults, and the faults could be diagnosedin parallel.
To summarize, in this section we presented the design, im-plementation and evaluation of the most commonly observedfaults in 802.11 based wireless networks. Mojo was imple-mented on a small scale testbed, and the default Atherosdriver was modified to collect fine-grained diagnostic in-formation from the PHY layer. Based on the informationcollected, threshold based detection algorithms were imple-mented to detect noise/interference, hidden and capture ef-fect and signal strength variations at the AP. Noise in thenetwork is diagnosed by detecting an increase in the noisefloor. Based on the calibration of the Atheros chipset noisefloor register, we set the interference detection threshold to-65 dBm. Hidden terminals/capture effect are diagnosed bydetecting concurrent transmissions by the clients in the net-work. By measuring the overlap between two simultaneouslytransmitted frames, we are able to differentiate between hid-den terminals and capture effect. Signal strength variationsat the AP are diagnosed by detecting concurrent changes insignal strength recorded at the distributed sniffers. Basedon experiments carried out in a typical office environmentand open lobby, the algorithm is able to accurately detectsignal strength changes greater than 4 dBm using a correla-tion threshold of 0.8.
Although the list of faults presented in this paper is notexhaustive, Mojo addresses the most commonly observedfaults in wireless networks that are addressed by the researchcommunity. As part of future work, we plan to extend thelist of faults and categorize the faults and detection tech-niques.
5. REMEDIES FOR NETWORKPROBLEMS
Table 2 in section 2 provides a summary of the remedia-tion performed by the stock 802.11 drivers and the remediesproposed by Mojo. Due to the lack of visibility of the under-lying physical layer, existing 802.11 drivers perform rate fall-back as the default remedy for every fault. Existing 802.11drivers trigger rate fallback when an excessive number of re-tries are caused at the MAC layer. However, applying ratefallback as the default remedy to troubleshoot every faultleads to significant degradation of the performance of thenetwork3.
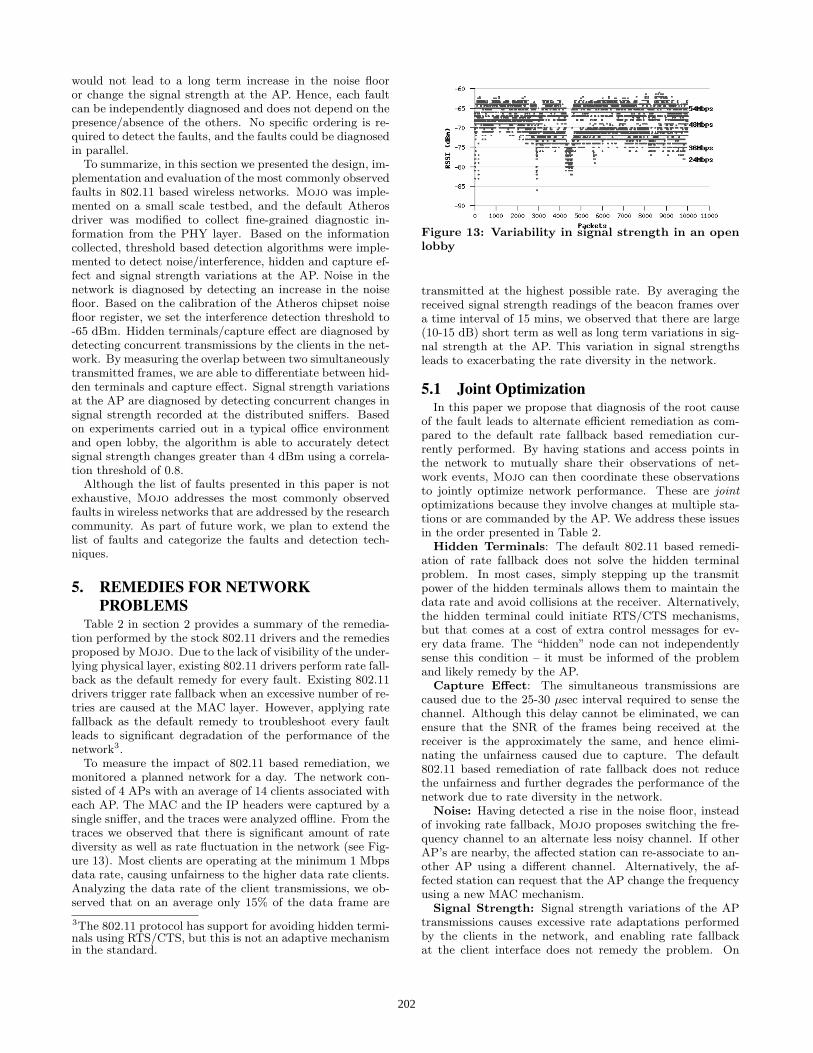
To measure the impact of 802.11 based remediation, wemonitored a planned network for a day. The network con-sisted of 4 APs with an average of 14 clients associated witheach AP. The MAC and the IP headers were captured by asingle sniffer, and the traces were analyzed offline. From thetraces we observed that there is significant amount of ratediversity as well as rate fluctuation in the network (see Fig-ure 13). Most clients are operating at the minimum 1 Mbpsdata rate, causing unfairness to the higher data rate clients.Analyzing the data rate of the client transmissions, we ob-served that on an average only 15% of the data frame are
3The 802.11 protocol has support for avoiding hidden termi-nals using RTS/CTS, but this is not an adaptive mechanismin the standard.
Figure 13: Variability in signal strength in an openlobby
transmitted at the highest possible rate. By averaging thereceived signal strength readings of the beacon frames overa time interval of 15 mins, we observed that there are large(10-15 dB) short term as well as long term variations in sig-nal strength at the AP. This variation in signal strengthsleads to exacerbating the rate diversity in the network.
5.1 Joint OptimizationIn this paper we propose that diagnosis of the root cause
of the fault leads to alternate efficient remediation as com-pared to the default rate fallback based remediation cur-rently performed. By having stations and access points inthe network to mutually share their observations of net-work events, Mojo can then coordinate these observationsto jointly optimize network performance. These are jointoptimizations because they involve changes at multiple sta-tions or are commanded by the AP. We address these issuesin the order presented in Table 2.
Hidden Terminals: The default 802.11 based remedi-ation of rate fallback does not solve the hidden terminalproblem. In most cases, simply stepping up the transmitpower of the hidden terminals allows them to maintain thedata rate and avoid collisions at the receiver. Alternatively,the hidden terminal could initiate RTS/CTS mechanisms,but that comes at a cost of extra control messages for ev-ery data frame. The “hidden” node can not independentlysense this condition – it must be informed of the problemand likely remedy by the AP.
Capture Effect: The simultaneous transmissions arecaused due to the 25-30 µsec interval required to sense thechannel. Although this delay cannot be eliminated, we canensure that the SNR of the frames being received at thereceiver is the approximately the same, and hence elimi-nating the unfairness caused due to capture. The default802.11 based remediation of rate fallback does not reducethe unfairness and further degrades the performance of thenetwork due to rate diversity in the network.
Noise: Having detected a rise in the noise floor, insteadof invoking rate fallback, Mojo proposes switching the fre-quency channel to an alternate less noisy channel. If otherAP’s are nearby, the affected station can re-associate to an-other AP using a different channel. Alternatively, the af-fected station can request that the AP change the frequencyusing a new MAC mechanism.
Signal Strength: Signal strength variations of the APtransmissions causes excessive rate adaptations performedby the clients in the network, and enabling rate fallbackat the client interface does not remedy the problem. On
202
detecting excessive retransmissions due to signal strengthvariations, Mojo proposes disassociating with the AP toan alternate AP or requesting that the AP increase signalstrength using a new MAC mechanism.
5.2 Implementing RemediesUsing our testbed, we have shown that these individual
improvements should improve performance, but we do nothave a full system evaluation that combines all mechanisms.Implementing some of the remedies requires modifying the802.11 MAC protocol to implement new control messages.We are using the SoftMAC framework [24] we have devel-oped to implement a control mechanism to complement ourexisting detection system.
The above listed remedies are some of the simplest reme-dies that could be performed to tolerate faults in the net-work. The remedies proposed require no explicit federationbetween the multiple AP’s in the network. As part of futurework we plan to propose remedies that involve coordina-tion between multiple AP’s and clients in the network totroubleshoot the fault. We also plan to deploy Mojo ina production network consisting of a large number of APsand heterogeneous clients and measure the performance im-provement achieved by diagnosing the faults and applyingefficient remedies.
6. RELATED WORKA large body of work exists in fault diagnosis and trou-
bleshooting for the wired networks. Faults on the wirednetwork include IP link failures, Border Gateway Proto-col (BGP) misconfiguration [23] and network intrusions andDoS attacks [18]. A wide array of tools [21] and architec-tures [13] have been proposed that help researchers to ex-tract information from the network to detect these faults
However, fault diagnosis for wireless networks has to dealwith the inherent spatial and temporal nature of wirelesspropagation. Unlike the wired network monitoring system,a single sniffer is not enough to capture the state of the entirewireless network. Yeo et al. [31, 32] were the first to explorethe feasibility of using multiple sniffers to deal with the spa-tial and temporal variability of the wireless link. However,as compared to ensuring complete coverage of the wirelessnetwork, Mojo requires redundant distributed observationsat the PHY layer.
A large number of measurement based studies have beencarried out to study the usage pattern of 802.11 based wire-less networks [19, 15, 27, 20]. The authors in [27, 20] studythe performance of 802.11 in a conference setting, where alarge number of clients are using the wireless network. Theauthors observed both short term as well as long term vari-ability in link quality and performance degradation underheavy usage of the wireless network. The authors also pointout that the default 802.11 based remediation of rate fall-back exacerbates the problem further, leading to a highernumber of retransmissions and dropped frames.
Existing solutions to diagnose faults in wireless networkshave limited capability to distinguish between multiple rootcauses of a fault. [26] proposes an online trace driven simu-lation tool to diagnose faults in a multi-hop adhoc network.However the tool categorizes faults into very broad cate-gories. One of the categories is “random packet dropping”,which could arise due to a large number of root causes.
There are a large number of commercial tools [1, 8] avail-
able that monitor 802.11 traffic in the network using passiveprobes. Based on policies defined by the network adminis-trator, a variety of security and performance alerts are gener-ated. Performance alerts are generated for excessive retries,low data rate, frequent handoff of client devices, change ofAP parameters, etc. These tools only monitor the 802.11MAC protocol and do not detect the root cause of the faultoriginating at the physical layer.
Client side monitoring to diagnose root cause faults haspotential to diagnose anomalies for the wired network [25] aswell as for wireless networks [6]. In [6], the authors proposean architecture for client side monitoring to detect unau-thorized APs, RF holes and performance problems. How-ever, the performance problems are only limited to detectingwhether the fault exists on the wireless network or the wirednetwork.
Problems like hidden terminals [30, 12], capture effect [22],and carrier sensing in the presence of noise/interference inthe network [19] have been studied by the research com-munity in isolation. As far as we know, Mojo is the firstunified framework which measures the impact of each faultat different layers of the network stack and presents detec-tion algorithms for each of the above faults.
7. CONCLUSIONIn this paper we present the design, implementation and
evaluation of Mojo, a unified framework to diagnose phys-ical layer faults that are commonly observed in existing802.11 based wireless networks. Through detailed experi-ments on a real testbed, we measure the impact of each faultat the different layers of the network stack. A novel clientside monitoring framework is proposed to extract detailedinformation from the underlying physical layer. Informationcollected is used to build threshold based statistical detec-tion algorithms for each fault. We claim that Mojo takesthe first step towards building truly self-healing wireless net-works and provides detailed information for troubleshootingfaults originating at the physical layer.
8. ACKNOWLEDGMENTThe authors would like to thank Dr. Pravin Bhagwat
(CTO, AirTight Networks) for introducing the authors tothe idea of fault diagnosis for wireless networks. Mike Neufeldhelped with the initial system design of Mojo. We alsothank the anonymous reviewers and our shepherd, DushyanthNarayan. This work was supported by the NSF career award(grant #0134051) and the NSF CRI: Wireless Internet Build-ing Blocks for Research, Policy, and Education grant (grant#0454404)
9. REFERENCES[1] AirTight Networks.
http://www.airtightnetworks.net.[2] Aruba. http://www.arubanetworks.com/.[3] Madwifi.
http://sourceforge.net/projects/madwifi.[4] WiFiMaps. http://www.wifimaps.com.[5] Wireless LAN Medium Access Control (MAC) and
Physical Layer (PHY) Spec, IEEE 802.11 Standard.Tech. rep., Institute of Electrical and ElectronicsEngineers, Inc.
[6] Adya, A., Bahl, P., Chandra, R., and Qiu, L.Architecture and techniques for diagnosing faults in
203
ieee 802.11 infrastructure networks. In MobiCom ’04:Proceedings of the 10th annual internationalconference on Mobile computing and networking (NewYork, NY, USA, 2004), ACM Press, pp. 30–44.
[7] Aguayo, D., Bicket, J., Biswas, S., Judd, G., andMorris, R. Link-level measurements from an 802.11bmesh network. SIGCOMM Comput. Commun. Rev.34, 4 (2004), 121–132.
[8] AirDefense. Wireless lan security and operationalsupport. available from http://www.airdefense.net.
[9] Akella, A., Judd, G., Seshan, S., andSteenkiste, P. Self-management in chaotic wirelessdeployments. In MobiCom ’05: Proceedings of the 11thannual international conference on Mobile computingand networking (New York, NY, USA, 2005), ACMPress, pp. 185–199.
[10] Bahl, P., Padhye, J., Ravindranath, L., Singh,M., Wolman, A., and Zill, B. Dair: A frameworkfor troubleshooting enterprise wireless networks usingdesktop infrastructure. In Proceedings of the FourthWorkshop on Hot Topics in Networks (HotNets-IV)(2005), ACM Press.
[11] Balachandran, A., Voelker, G. M., Bahl, P.,and Rangan, P. V. Characterizing user behavior andnetwork performance in a public wireless lan.SIGMETRICS Perform. Eval. Rev. 30, 1 (2002),195–205.
[12] Bharghavan, V., Demers, A. J., Shenker, S., andZhang, L. MACAW: A media access protocol forwireless LAN’s. In SIGCOMM (1994), pp. 212–225.
[13] Clark, D. D., Partridge, C., Ramming, J. C.,and Wroclawski, J. T. A knowledge plane for theinternet. In SIGCOMM ’03: Proceedings of the 2003conference on Applications, technologies, architectures,and protocols for computer communications (NewYork, NY, USA, 2003), ACM Press, pp. 3–10.
[14] Dunn, J., Neufeld, M., Sheth, A., Grunwald, D.,and Bennett, J. A practical cross-layer mechanismfor fairness in 802.11 networks. In ProceedingsBROADNETS 2004 (Oct 2004), pp. 355–364.
[15] Henderson, T., Kotz, D., and Abyzov, I. Thechanging usage of a mature campus-wide wirelessnetwork. In MobiCom ’04: Proceedings of the 10thannual international conference on Mobile computingand networking (New York, NY, USA, 2004), ACMPress, pp. 187–201.
[16] Heusse, M., Rousseau, F., Berger-Sabbatel, G.,and Duda, A. Performance anomaly of 802.11b. InProceedings of IEEE INFOCOM 2003 (San Francisco,USA, March-April 2003).
[17] Heusse, M., Rousseau, F., Guillier, R., andDuda, A. Idle sense: an optimal access method forhigh throughput and fairness in rate diverse wirelesslans. In SIGCOMM ’05: Proceedings of the 2005conference on Applications, technologies, architectures,and protocols for computer communications (NewYork, NY, USA, 2005), ACM Press, pp. 121–132.
[18] Hussain, A., Heidemann, J., and Papadopoulos,C. A framework for classifying denial of serviceattacks. In Proceedings of the ACM SIGCOMMConference (Karlsruhe, Germany, August 2003),ACM, pp. 99–110.
[19] Jamieson, K., Hull, B., Miu, A., andBalakrishnan, H. Understanding the real-worldperformance of carrier sense. In E-WIND ’05:Proceeding of the 2005 ACM SIGCOMM workshop onExperimental approaches to wireless network designand analysis (New York, NY, USA, 2005), ACMPress, pp. 52–57.
[20] Jardosh, A. P., Ramachandran, K. N.,Almeroth, K. C., and Belding-Royer, E. M.Understanding link-layer behavior in highly congested
ieee 802.11b wireless networks. In E-WIND ’05:Proceeding of the 2005 ACM SIGCOMM workshop onExperimental approaches to wireless network designand analysis (New York, NY, USA, 2005), ACMPress, pp. 11–16.
[21] Kandula, S., Katabi, D., and Vasseur, J.-P.Shrink: A Tool for Failure Diagnosis in IP Networks.In ACM SIGCOMM Workshop on mining networkdata (MineNet-05) (Philadelphia, PA, August 2005).
[22] Kochut, A., Vasan, A., Shankar, A., andAgrawala, A. Sniffing out the correct physical layercapture model in 802.11b. 2th IEEE InternationalConference on Network Protocols (ICNP) (2004),252–261.
[23] Mahajan, R., Wetherall, D., and Anderson, T.Understanding bgp misconfiguration. In SIGCOMM’02: Proceedings of the 2002 conference onApplications, technologies, architectures, and protocolsfor computer communications (New York, NY, USA,2002), ACM Press, pp. 3–16.
[24] Neufeld, M., Fifield, J., Doerr, C., Sheth, A.,and Grunwald, D. Softmac – flexible wirelessresearch platform. In Proceedings 2005 HotNetsWorkshop (Nov 2005).
[25] Padmanabhan, V. N., Ramabhadran, S., andPadhye, J. Netprofiler: Profiling wide-area networksusing peer cooperation. In Proceedings of the FourthInternational Workshop on Peer-to-Peer Systems(IPTPS) (New York, NY, USA, 2005).
[26] Qiu, L., Bahl, P., Rao, A., and Zhou, L.Troubleshooting multihop wireless networks.SIGMETRICS Perform. Eval. Rev. 33, 1 (2005),380–381.
[27] Rodrig, M., Reis, C., Mahajan, R., Wetherall,D., and Zahorjan, J. Measurement-basedcharacterization of 802.11 in a hotspot setting. InE-WIND ’05: Proceeding of the 2005 ACMSIGCOMM workshop on Experimental approaches towireless network design and analysis (New York, NY,USA, 2005), ACM Press, pp. 5–10.
[28] Tan, G., and Guttag, J. The 802.11 MAC ProtocolLeads to Inefficient Equilibria. In IEEE INFOCOM(Miami, FL, March 2005).
[29] Weinmiller, J., Woesner, H., Ebert, J., andWolisz, A. Analyzing the rts/cts mechanism in thedfwmac media access protocol for wireless lan’s. InIFIP TC6 Workshop Personal WirelessCommunications (Wireless Local Access) (Praque,April 1995).
[30] Xu, K., Gerla, M., and Bae, S. How effective is theieee 802.11 rts/cts handshake in ad hoc networks? InProceedings of the Global TelecommunicationsConference, GLOBECOM (2002), IEEE, pp. 72–76.
[31] Yeo, J., Youssef, M., and Agrawala, A. Aframework for wireless lan monitoring and itsapplications. In WiSe ’04: Proceedings of the 2004ACM workshop on Wireless security (2004), ACMPress, pp. 70–79.
[32] Yeo, J., Youssef, M., Henderson, T., andAgrawala, A. An accurate technique for measuringthe wireless side of wireless networks. In WiTMeMo’05: Papers presented at the 2005 workshop onWireless traffic measurements and modeling (Berkeley,CA, USA, 2005), USENIX Association, pp. 13–18.
204