mokhethi, n.i. , bahta, y.t. and ogundeji,...
TRANSCRIPT

312
TRADE STRUCTURE AND PATTERN OF WOOL AND MOHAIR EXPORT OF LESOTHO
Mokhethi, N.I.1, Bahta, Y.T.
1* and Ogundeji, A.A.
1
1University of Free State, Department of Agricultural Economics, P.O.Box 339, Internal box 58,
Bloemfontein 9300, South Africa.
*Corresponding author: Tel.: +27735591859; +27514019050; E-mail address: [email protected] and
Abstract
Trade structure and pattern of Lesotho’s wool and mohair sub-sector were analyzed using 4 digits
Standard International Trade Classification (SITC) of wool and Mohair and different trade indicators
from 2003-2012. Revealed Comparative Advantage (RCA), Hirschman Index (HI), Effective Rate of
Protection (ERP) and Nominal Rate of Protection (NRP) were calculated. Trade map was also used to
assess the diversification of wool and mohair markets. The study revealed that Lesotho have a Revealed
Comparative Advantage (RCA) of wool and mohair sub-sector from 2003 to 2012. Hirschman Index (HI)
indicated that wool and mohair sub-sectors shows low concentration from 2003 to 2012. Lower
concentration reduces the impact of international trade risk due to the possibility of price fluctuation of
wool and mohair products. ERP and NRP were also calculated, using an enterprise budget of Lesotho for
wool and mohair production. The result shows that the ERP and NRP shows negative which indicate that
the weighted input tariffs on wool and mohair inputs amount are more than the output tariffs, this implies
that the sub-sector is taxed by the government tariff policies. The NRP is higher than the ERP; this
implies that tariff applied on the output is higher than the tariff applied on the inputs. The results from the
trade map indicated that Lesotho’s wool and mohair have high degree of concentration in China and
South Africa. The structure of the tariff schedule may have an important bearing on efficiency. Thus, the
study recommended that the tariff structure of the input sector for wool and mohair should be
reinvestigated and Lesotho should be diversifying its market of wool and mohair.
Keywords: Wool and Mohair, Revealed comparative advantage index, Hirschman index, Effective rate of
protection, Nominal rate of protection
1. Introduction
Lesotho is committed to the implementation of World Trade Organization (WTO) agreements, which
include liberalization of trade. Lesotho is signatory to a variety of trade agreements which afford
expanded access to regional and international markets, and trade agreements are to expand market access
for goods and services. It is also involved in the Cotonou agreement which is the most comprehensive
partnership agreement between developing countries and the European countries (Rakoto, 2011).
Wool and mohair are the main agricultural exports, and Lesotho is the world’s second producer of
mohair after South Africa, it produces 14 percent of mohair produced globally (Rath et al., 2014). In
Lesotho more than 28,000 smallholder producers have their sheep and goats shorn, 1.2 million sheep and
500,000 goats were shorn and their fleeces were marketed on the international market.
Marketing of Lesotho’s wool and mohair is unique for smallholder producers. Individual smallholder
producers are marketing most of their fleece wool directly on a major international auction market at Port
20th International Farm Management Congress, Laval University, Québec City, Québec, Canada
Vol.1 - Peer Review July 2015 - ISBN 978-92-990062-3-8 - www.ifmaonline.org - Congress Proceedings Page 1 of 8

TRADE STRUCTURE AND PATTERN OF WOOL AND MOHAIR EXPORT OF LESOTHO 313
Elizabeth and Durban in South Africa, where wool and mohair is primarily handled by marketing agent
Boeremakelaars Koöperatief Beperk (BKB) (IFAD, 2014).
There is a well-developed and effective value-chain for the production and marketing of wool and
mohair. Figure 1 indicates Lesotho wool and mohair value chain which consists of associations that use or
link with the government shed, the other one is individual farmers that link with private traders and the
third is marginal groups that use informal market channel. From these three links wool and mohair is sold
at auctions in South Africa where wool and mohair will be absorbed and processed. Other wool and
mohair are re-exported to the international market.
Figure 1: Lesotho wool and mohair value chain.
Source: Tregurtha (undated)
During the 2012/2013 season Lesotho’s wool and mohair produced and exported was 3 599 794
kilograms and 472 132 kilograms respectively. The production of wool and mohair has increased due the
increase of the number of sheep and goats shorn (BKB, 2013).
Constraints to the production of wool and mohair are: inappropriate range management practices, lack
of supplementary feeding, low quality of sheep due to poor cross breeding husbandry practices,
inadequate disease control measures, inclement weather, long term declining terms of trade that have
affected the major wool exporters of the world and taxation of the sub-sector (Department of Livestock
Services, 2013).
20th International Farm Management Congress, Laval University, Québec City, Québec, Canada
Vol.1 - Peer Review July 2015 - ISBN 978-92-990062-3-8 - www.ifmaonline.org - Congress Proceedings Page 2 of 8
314 MOKHETHI, N.I., BAHTA, Y.T., OGUNDEJI, A.A.
The significance of the wool and mohair sub sectors in Lesotho economy is undeniable. To answer
the questions appertaining to the effect of trade policy on the wool and mohair sub sectors is vitally
important. The world has witnessed a rapid spread of economic regionalism and integration, especially in
the last two decades. One of the most visible outputs from this expansion is the proliferation of Free
Trade Agreements (FTAs) among nations. The Lesotho government engaged in a large number of FTAs.
These conditions create a need to critically evaluate the role of trade policy in the wool and mohair sub
sectors.
The main objective of the study is to analyze trade structure and pattern of wool and mohair of
Lesotho uses the trade map and applies theoretical and empirical principles of RCA, HI, ERP, NRP to
better understand the structure and pattern of wool and mohair export in Lesotho.
2. Methodologies and data used
The Lesotho agricultural trade at 4-digit standardized international trade classification (SITC) level is
used for the trade structure and pattern analysis; it includes two groups of agricultural commodities which
are wool and mohair. The data sources are the Ministry of Trade, Industry Cooperatives and marketing
(2014), Lesotho Bureau of Statistics (2014), International Trade Centre (2014), United Nations
Commodity Trade (UNCOMTRADE) (2014), Central Bank of Lesotho (2014) and the Ministry of
Agriculture and Food Security (2014). In order to calculate the Balassa Effective Rate of Protection
(ERP) and Nominal Rate of Protection (NRP) an enterprise budget developed for the calendar year of
2013/2014. The economic price of wool and mohair were calculated by giving due consideration to the
shadow value of the exchange rate, transportation cost, Insurance and Freight (CIF), import parity, export
parity price as well as tariffs imposed on inputs.
Indicators can and should be used towards evidence-based policy-making. In an effort to analysis of
trade structure and pattern of wool and mohair export commodities of Lesotho different methodologies
was employed. The study will use the trade maps, apply theoretical and empirical principles of Revealed
Comparative Advantage (RCA), Effective Rate of Protection (ERP) and Nominal Rate of Protection
(NRP); Hirschman Index (HI) used to better understand a pattern of production and trade of wool and
mohair in Lesotho.
In 1965, Bela Balassa introduced the notion of revealed comparative advantage as a way to
approximate comparative advantage in self-sufficiency. Balassa and others have used consumption,
import and export data to conduct various trade performance indicators. The revealed comparative
advantage (RCA) indexes of Bela Balassa are well known, the difference between the two indexes lies in
the fact that one of them includes only exports whereas the other include both exports and imports (Bahta
et al., 2013 and Leishman et al., 2013).
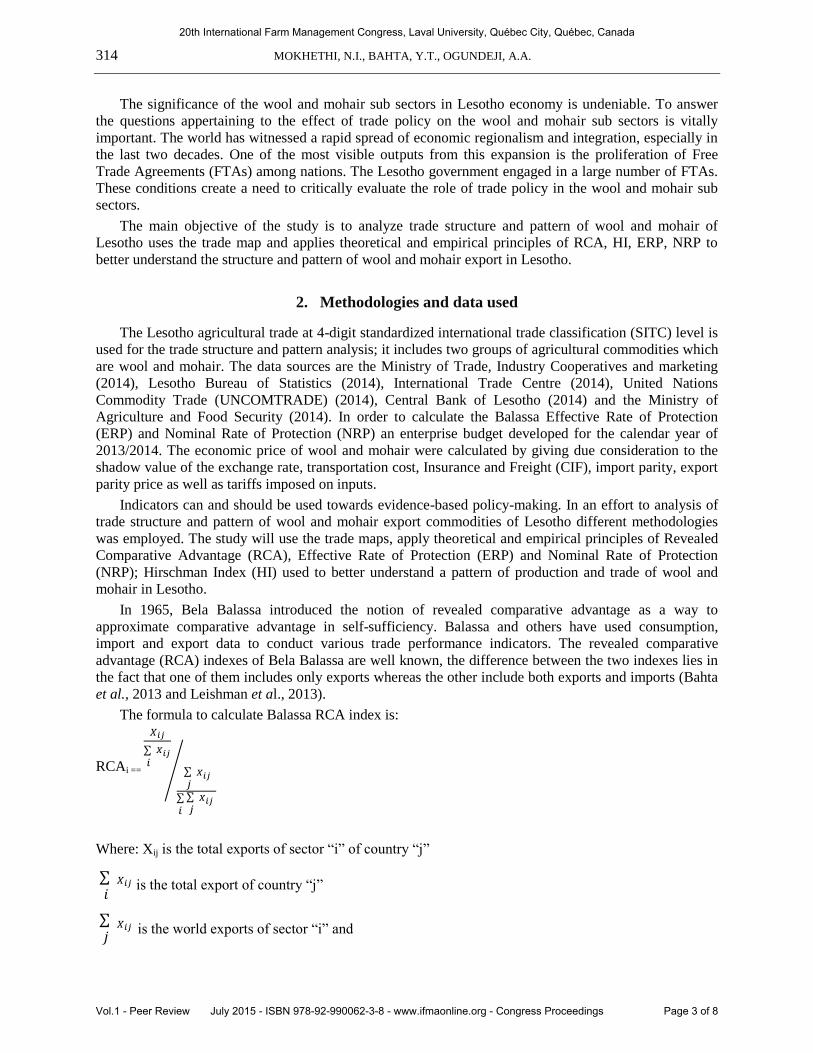
The formula to calculate Balassa RCA index is:
RCAi ==
Where: Xij is the total exports of sector “i” of country “j”
is the total export of country “j”
is the world exports of sector “i” and
20th International Farm Management Congress, Laval University, Québec City, Québec, Canada
Vol.1 - Peer Review July 2015 - ISBN 978-92-990062-3-8 - www.ifmaonline.org - Congress Proceedings Page 3 of 8

TRADE STRUCTURE AND PATTERN OF WOOL AND MOHAIR EXPORT OF LESOTHO 315
is the total “world” export
This index measures a specific product’s share in the country’s total export relative to a share of this
product in the world trade. When the product’s share in the world export (RCA >1), interpret it as the
country revealed comparative advantage in this particular product. In contrast, for products whose (RCA<
1), country is said to reveal comparative disadvantage. Often this index is interpreted as RCA in
production of product.
ERP is the commonly used measure of net effect of trade policies on the incentives facing domestic
producers. The measurement of effective protection is clearly a two- stage process- firstly, determining
the nominal protection of the policies in question, secondly, analyzing the implications for effective
protection of different firms, sectors or activities (Reed, 2001).
ERP is a measure of how tariff structure affects value added in an industry. ERP measure has been
widely used both by governments to determine the level of protection to provide to domestic industries
and by international organizations such as the World Bank, the Organization for Economic Co-operation
and Development (OECD), and the World Trade Organization in trade policy negotiations (Diakantoni
and Escalth, 2012).
ERP expressed as:
−
Where: VAd is value added in the activity as measured at protection –Inclusive domestic
prices
VAw is value added in the activity as measured at undisorted world prices
The NRP is an estimation of the equivalent tariff that would lead to the total disparity between
domestic and international prices, over and beyond the known price- raising effect of the import tariff.
NRP is derived from the difference between the domestic price of a good and the observable world price
of a comparable good (USAID, 2008).
NRP expressed as:
−
Where: Pd is domestic price
Pw is world price
t is ad valorem equivalents of taxes
d is duties on imports of good
e is the net ad valorem tariff equivalent of other non-tax, Non- tariff trade
Restrictions
HI index is a measure of market concentrate named after ORRIS Herfindahl, who applied the index in
his doctoral dissertation in 1950 and Albert Hirschman who presented the index in a book in 1945. The
index is widely used measure of market diversification and market concentration (Chen and Godager,
2011).
HI is calculated as:
HI =
Where: Xi is value of product i‘s export
20th International Farm Management Congress, Laval University, Québec City, Québec, Canada
Vol.1 - Peer Review July 2015 - ISBN 978-92-990062-3-8 - www.ifmaonline.org - Congress Proceedings Page 4 of 8

316 MOKHETHI, N.I., BAHTA, Y.T., OGUNDEJI, A.A.
X is value of total export of country
The lower the index, the less concentrated of a country’s exports. This index values ranges between 0
and 1. Values closer to one indicate more concentrated trade structures. It is generally assumed that lower
export concentration reduces the impact of international trade risks due to the possible price fluctuations
of specific products. A country with few major trade partners might have a lower HI value.
Trade map provides on country or product performance, demand, alternative markets, performance of
competitors and information on importing and exporting.
3. Result and discussion
As Table 1 and 2 indicates, RCA of wool and mohair sub-sector in Lesotho has shown a revealed
comparative advantage during the study period 2003 to 2012. Lesotho is a net exporter of wool and
mohair. Table 1 and 2 also indicates HI, the index of trade concentration or Hirschman index indicates
that wool and mohair sub-sector shows lower concentration throughout the period of ten years from 2003
to 2012, lower concentration reduces the impact of international trade risk due to the possibility of price
fluctuation of wool and mohair products. Export diversification is likely to be a proxy for a widening of
comparative advantage that comes with a more diversified economy.
Table 1: Revealed comparative advantage of wool in Lesotho (RCA)
Year World
total
export of
all
commo-
dities
(Million
US$)
World
total
export
of wool
(5101)
(Million
US$)
Lesotho
total
export of
all
commo-
dities
(Million
US$)
Lesotho
wool
(5101)
export
(Million
US$)
Wool
share in
Lesotho
export
(%)
Wool
share
in the
world
trade
(%)
RCA Hirschman
Index
1 2 3 4 (4/3) (2/1) (4/3)/(2/1) (4/3)sq.
2003 7586000 5000 221 2875620 1.30 0.07 19.74 0.026
2004 9081466 5300 714 3181214 0.45 0.06 7.63 0.009
2005 10359677 5100 650 3235230 0.51 0.05 10.27 0.010
2006 11983856 5200 689 5800537 0.84 0.04 19.40 0.017
2007 13827071 6000 770 7908540 1.03 0.04 23.67 0.021
2008 15970882 5600 883 5769092 0.65 0.04 18.63 0.013
2009 1238360 4000 723 9040902 1.25 0.03 38.71 0.025
2010 15075181 5600 801 12706802 1.59 0.04 42.70 0.032
2011 18013288 7800 1168 16728294 1.43 0.04 33.08 0.029
2012 18013778 6800 1099 19644514 1.79 0.04 47.35 0.036
Source: Author’s calculations
20th International Farm Management Congress, Laval University, Québec City, Québec, Canada
Vol.1 - Peer Review July 2015 - ISBN 978-92-990062-3-8 - www.ifmaonline.org - Congress Proceedings Page 5 of 8

TRADE STRUCTURE AND PATTERN OF WOOL AND MOHAIR EXPORT OF LESOTHO 317
Table 2: Revealed comparative advantage of mohair in Lesotho (RCA)
Year World
total
export of
all
commo-
dities
(Million
US$)
World
total
export
of
mohair
(5102)
(Million
US$)
Lesotho
total
export of
all
commo-
dities
(Million
US$)
Lesotho
mohair
(5102)
export
(Million
US$)
Mohair
share in
Lesotho
export
(%)
Mohair
share in
the world
trade (%)
RCA Hirschman
Index
1 2 3 4 (4/3) (2/1) (4/3)/(2/1) (4/3)sq.
2003 7586000 5000 221 618459.6 0.28 0.07 4.25 0.006
2004 9081466 5300 714 608506.8 0.09 0.06 1.46 0.002
2005 10359677 5100 650 1262497 0.19 0.05 3.95 0.004
2006 11983856 5200 689 1687681 0.24 0.04 5.65 0.005
2007 13827071 6000 770 1385753 0.18 0.04 4.15 0.004
2008 15970882 5600 883 1267546 0.14 0.04 4.09 0.003
2009 1238360 4000 723 1609281 0.22 0.03 6.89 0.004
2010 15075181 5600 801 2130903 0.27 0.04 7.16 0.005
2011 18013288 7800 1168 2785083 0.24 0.04 5.51 0.005
2012 18013778 6800 1099 2374134 0.22 0.04 5.72 0.004
Source: Author’s calculations
Table 3 shows the result of ERP and NRP, the Balassa ERP of wool is -99.96 and ERP of mohair is -
99. 52 in Lesotho. The negative ERP indicates that the weighted input tariffs on wool and mohair inputs
amount is more than the output tariff, wool and mohair sub-sector is taxed by government tariff policies.
The NRP is higher than ERP, which implies that tariff applied on the output is higher than the tariff on
inputs.
Table 3: Effective and nominal rate Protection
Balassa ERP NRP
Wool -99.96 12.67
Mohair -99.52 64
Source: Author’s calculation.
From Trade map analysis tool revealed that Lesotho has exported 6, 250 tons of wool and 790 tons of
mohair to the world at an average value of US$ 2,607/unit and US$ 866/ unit respectively. The results
further indicated exported value of wool and mohair in 2013 was 16,298 and 684 US$ US$ thousand
respectively. This indicated the growth of wool product of Lesotho both in value and quantities.
China, South Africa and India are the leading importers of wool from Lesotho, accounting 47 percent,
31.4 percent and 21.7 percent share of Lesotho’s export respectively. South Africa is the world first
leading importer of wool from Lesotho in the period from 2009 to 2013 with 31.7 percent in growth in
value. India has 8 percent growth in quantity from 2009-2013, the results also revealed that Lesotho is
having high degree of concentration in terms of wool export to South Africa, China and India, therefore
there is a need for Lesotho to diversify its markets.
20th International Farm Management Congress, Laval University, Québec City, Québec, Canada
Vol.1 - Peer Review July 2015 - ISBN 978-92-990062-3-8 - www.ifmaonline.org - Congress Proceedings Page 6 of 8

318 MOKHETHI, N.I., BAHTA, Y.T., OGUNDEJI, A.A.
4. Summary, conclusion and recommendation
The main objective of the study was to analyze trade structure and pattern of wool and mohair of
Lesotho in order to better understand the structure and pattern of wool and mohair export in Lesotho. The
study indicates that the RCA of wool and mohair sub-sector in Lesotho has shown a revealed comparative
advantage from 2003 to 2012. The index of trade concentration indicates that wool and mohair sub-sector
shows lower concentration throughout ten years. The results of ERP and NRP are negative; this indicates
that the weighted input tariffs on wool and mohair inputs amount more than the output tariff. This
indicates that wool and mohair sub-sector is not protected but it is taxed. The tariff schedule structure may
have a substantial impact on efficiency. A very dispersed and cumbersome tariff structure on inputs and
outputs may mean that protection remains uneven, and gains from openness may still be inadequate.
Thus, the tariffs structure of the input sector for wool and mohair sub-sector should be looked into.
Lesotho is having high degree of concentration in terms of wool export to South Africa, China and India,
while mohair is highly concentrated in South Africa only.
It is recommended that Lesotho should diversify geographic destination of its trade and should have
the capacity to process the greasy wool and mohair into a high quality raw material required by the textile
industry in the world markets, this can be achieved through the establishment of a scouring plant where
value can added to wool and mohair before exported directly to the international markets. This will help
farmers to relate directly with the international markets for their products rather than to sell their wool and
mohair in auctions where these commodities will be re-exported and this will help to avoid double
taxation of the sub-sector
5. References
Bahta, Y.T., Willemse, B. J. and Grove, B. (2013). The comparative advantage of South Africa Soybean
production. Department of Agricultural Economics. University of Free State. South Africa.
Balassa, B. (1965). Trade Liberalization and Revealed Comparative Advantage. The Manchester School
of Economics and Social Studies, 33(99): 99-125.
BKB Fibretrack (2013). Wool and Mohair Marketing Reporting Service: Lesotho Wool and Mohair
2012/2013. South Africa.
Central bank of Lesotho (2014). Fiscal policy sustainability in Lesotho. Annual report. Maseru. Lesotho.
Chen, X. and Godager, G. (2011). Development of competition indicators in the Norwegian general
practice. Department of health management and health economics. University of OSLO.
Department of Livestock Services (2013). Lesotho wool and mohair production annual report. Maseru.
Lesotho.
Diakantoni, A. and Escalth, H. (2012). Reassessing Effective protection Rates in trade in tasks
perspective: Evolution of trade policy in factory Asia. World Trade organization. Geneva.
Switzerland.
IFAD (2014). Kingdom of Lesotho: Wool and Mohair Promotion Project. Programme Management
Department. East and Southern African Division.
International Trade Centre (2014). Trade Statistics for international Business Development. Monthly,
Quarterly and yearly trade data. Import and export values, growth rates and market shares. Available
from: www.trademap.org. (Accessed on the 24 October 2014).
Leishman, D., Menkhaus, D. J. and Whipple, D.G. (2013). Revealed Comparative Advantage and the
measurement of international competitiveness for agricultural commodities: An Empirical Analysis of
Wool Exporters. Fargo ND. Western Agricultural Economics Association.
Lesotho Bureau of Statistics (2014). Lesotho Livestock Statistical Report. 2013/2014. Kingdom of
Lesotho.
20th International Farm Management Congress, Laval University, Québec City, Québec, Canada
Vol.1 - Peer Review July 2015 - ISBN 978-92-990062-3-8 - www.ifmaonline.org - Congress Proceedings Page 7 of 8

TRADE STRUCTURE AND PATTERN OF WOOL AND MOHAIR EXPORT OF LESOTHO 319
Ministry of Agriculture and Food Security (2014). Annual report. Maseru. Lesotho.
Ministry of Trade Industry Cooperatives and Marketing (2014). Quarterly report. Maseru. Lesotho.
Rakoto, L. D. (2011). Trade liberalization in Southern Africa with particular reference to Lesotho and
SACU’s regional trade agenda. Stellenbosch: Tralac.
Rath, T., Risopoulos, J., Twomlow, S., Rota, A., Mazzoli, E., Creswell, R., Baumgartner, P. and
Anyonge, T. (2014). The kingdom of Lesotho. Wool and mohair promotion project. Maseru Lesotho.
Reed, R. M. (2001). International trade in agricultural products. Prentice-Hall. United States of America.
Tragurtha (Undated). Enhancing the structure and Performance of Value Chains: A Case Study of the
Lesotho Wool and Mohair Sector. Commark Trust.
UN COMTRADE (2014). International Trade Statistics, Trade by Commodities. Department of
Economics and Social Affairs, United Nation.
USAID (2008). Development of the effective Rate of Protection Model for Ghana. America.
20th International Farm Management Congress, Laval University, Québec City, Québec, Canada
Vol.1 - Peer Review July 2015 - ISBN 978-92-990062-3-8 - www.ifmaonline.org - Congress Proceedings Page 8 of 8