mold growth prediction by computational simulation - fraunhofer
TRANSCRIPT

Sedlbauer, K.; Krus, M.; Zillig, W.; Künzel, H.M.: Mold Growth Prediction by Computational Simulation. Tagungsabend (auf CD) zur ASHRAE-Konferenz IAQ 2001, San Francisco.
Mold Growth Prediction by Computational Simulation K. Sedlbauer, M. Krus, Dr.-Ing., W. Zillig, H. M. Künzel, Dr.-Ing. Fraunhofer Institute for Building Physics (Director: Prof. Dr. Dr. h.c. mult Dr. E.h. mult. Karl Gertis)
ABSTRACT Up to now the common methods to assess the risk of mold growth are based on steady boundary
conditions. The newly developed model, describing the hygrothermal behavior of the spore, allows for the first time to encounter the changing surface temperatures and RH’s for the prediction of mold growth. Special research is still necessary in order to determine the required hygrothermal material properties of the spore, like moisture retention curve and vapor resistance of the spore wall. Nevertheless the capability of the Biohygrothermal Model to assess the risk of mold growth can be demonstrated impressively with the chosen example. A new basis has been built up to describe non-steady biological processes in mold spores, up to the start of the metabolism at least.
KEY WORDS microbiology, modeling, moisture, roof, testing, vapor retarder

Mold Growth Prediction by Computational Simulation K. Sedlbauer, M. Krus, Dr.-Ing., W. Zillig, H. M. Künzel, Dr.-Ing. Fraunhofer Institute for Building Physics (Director: Prof. Dr. Dr. h.c. mult Dr. E.h. mult. Karl Gertis)
ABSTRACT Up to now the common methods to assess the risk of mold growth are based on steady boundary
conditions. The newly developed model, describing the hygrothermal behavior of the spore, allows for the first time to encounter the changing surface temperatures and RH’s for the prediction of mold growth. Special research is still necessary in order to determine the required hygrothermal material properties of the spore, like moisture retention curve and vapor resistance of the spore wall. Nevertheless the capability of the Biohygrothermal Model to assess the risk of mold growth can be demonstrated impressively with the chosen example. A new basis has been built up to describe non-steady biological processes in mold spores, up to the start of the metabolism at least.
INTRODUCTION Roofs covered with metal sheets have a very high vapor diffusion resistance, so that virtually no
moisture can escape through the covering. Therefore, a sufficiently permeable inside vapor retarder must allow the moisture to dry out towards the room side, especially during the warm summer months. In order to compare different vapor retarders, extensive investigations were carried out in the outdoor-testing field of the Fraunhofer Institute for Building Physics (IBP). Fig. 1 shows an overview of the testing area in Holzkirchen (top) and the test house used for the investigations (bottom).
Because of the high insolation on the southern plane of the roof and the resulting high temperatures of the metal covering, so-called summer condensation occurs. This means that moisture diffuses from the hot outer parts of the roof assembly to the cooler room side and temporarily increases the humidity at the vapor retarder. The above mentioned outdoor tests show that a polyamide sheet results in the lowest wood moisture levels so that the proper function of this kind of vapor retarder could be confirmed. In the variant conducted with kraft paper, moldy odor and patches of mold were found at the end of the investigations which showed that extensive mold growth had taken place in the roof assembly.
These damages due to mold were the motive to investigate in more detail the conditions which are necessary to allow or promote mold growth.
GROWTH CONDITIONS FOR MOLD German literature often states a relative humidity of 80% at wall surfaces as the decisive criterion for
mold growth, independent of temperature. Sometimes it is mentioned that many types of mold can also thrive at lower humidities (see for example the new draft of DIN 4108-X, Mold (DIN 1999)). Other growth conditions, namely a suitable nutrient substrate and a temperature within the growth range are taken for granted on all types of building elements usually.
The growth conditions for mold may be described in so-called isopleth diagrams, as was already done by (mainly British) biologists in the sixties and seventies (Fig.2, left: spore germination; right: mycelium growth) (Ayerst 1969; Smith and Hill 1982). These diagrams are different for different types of mold and describe the germination times or growth rates. Beyond the lowest line every mold activity ceases, under these unfavorable temperature and humidity conditions spore germination or growth can be ruled out. The isopleths are determined under steady state conditions, i.e. constant temperature and relative humidity.
However, the temperatures and relative humidities encountered in buildings are usually unsteady. For this reason (Reiß and Erhorn 1994) performed extensive investigations with changing climate conditions. The experimental set-up for mold tests on rough surfaces (Fig. 3 top) allows to adjust the air and surface temperatures and humidities and to use different substrate materials. For the tests a spore suspension which
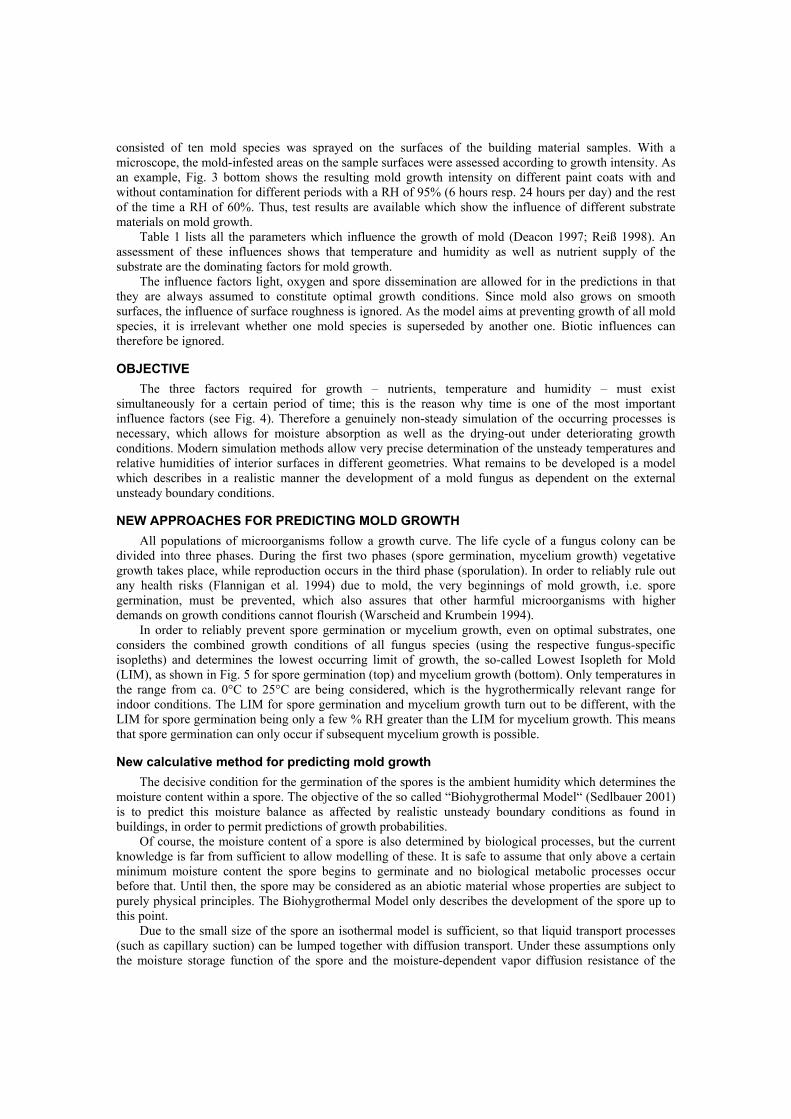
consisted of ten mold species was sprayed on the surfaces of the building material samples. With a microscope, the mold-infested areas on the sample surfaces were assessed according to growth intensity. As an example, Fig. 3 bottom shows the resulting mold growth intensity on different paint coats with and without contamination for different periods with a RH of 95% (6 hours resp. 24 hours per day) and the rest of the time a RH of 60%. Thus, test results are available which show the influence of different substrate materials on mold growth.
Table 1 lists all the parameters which influence the growth of mold (Deacon 1997; Reiß 1998). An assessment of these influences shows that temperature and humidity as well as nutrient supply of the substrate are the dominating factors for mold growth.
The influence factors light, oxygen and spore dissemination are allowed for in the predictions in that they are always assumed to constitute optimal growth conditions. Since mold also grows on smooth surfaces, the influence of surface roughness is ignored. As the model aims at preventing growth of all mold species, it is irrelevant whether one mold species is superseded by another one. Biotic influences can therefore be ignored.
OBJECTIVE The three factors required for growth – nutrients, temperature and humidity – must exist
simultaneously for a certain period of time; this is the reason why time is one of the most important influence factors (see Fig. 4). Therefore a genuinely non-steady simulation of the occurring processes is necessary, which allows for moisture absorption as well as the drying-out under deteriorating growth conditions. Modern simulation methods allow very precise determination of the unsteady temperatures and relative humidities of interior surfaces in different geometries. What remains to be developed is a model which describes in a realistic manner the development of a mold fungus as dependent on the external unsteady boundary conditions.
NEW APPROACHES FOR PREDICTING MOLD GROWTH All populations of microorganisms follow a growth curve. The life cycle of a fungus colony can be
divided into three phases. During the first two phases (spore germination, mycelium growth) vegetative growth takes place, while reproduction occurs in the third phase (sporulation). In order to reliably rule out any health risks (Flannigan et al. 1994) due to mold, the very beginnings of mold growth, i.e. spore germination, must be prevented, which also assures that other harmful microorganisms with higher demands on growth conditions cannot flourish (Warscheid and Krumbein 1994).
In order to reliably prevent spore germination or mycelium growth, even on optimal substrates, one considers the combined growth conditions of all fungus species (using the respective fungus-specific isopleths) and determines the lowest occurring limit of growth, the so-called Lowest Isopleth for Mold (LIM), as shown in Fig. 5 for spore germination (top) and mycelium growth (bottom). Only temperatures in the range from ca. 0°C to 25°C are being considered, which is the hygrothermically relevant range for indoor conditions. The LIM for spore germination and mycelium growth turn out to be different, with the LIM for spore germination being only a few % RH greater than the LIM for mycelium growth. This means that spore germination can only occur if subsequent mycelium growth is possible.
New calculative method for predicting mold growth The decisive condition for the germination of the spores is the ambient humidity which determines the
moisture content within a spore. The objective of the so called “Biohygrothermal Model“ (Sedlbauer 2001) is to predict this moisture balance as affected by realistic unsteady boundary conditions as found in buildings, in order to permit predictions of growth probabilities.
Of course, the moisture content of a spore is also determined by biological processes, but the current knowledge is far from sufficient to allow modelling of these. It is safe to assume that only above a certain minimum moisture content the spore begins to germinate and no biological metabolic processes occur before that. Until then, the spore may be considered as an abiotic material whose properties are subject to purely physical principles. The Biohygrothermal Model only describes the development of the spore up to this point.
Due to the small size of the spore an isothermal model is sufficient, so that liquid transport processes (such as capillary suction) can be lumped together with diffusion transport. Under these assumptions only the moisture storage function of the spore and the moisture-dependent vapor diffusion resistance of the
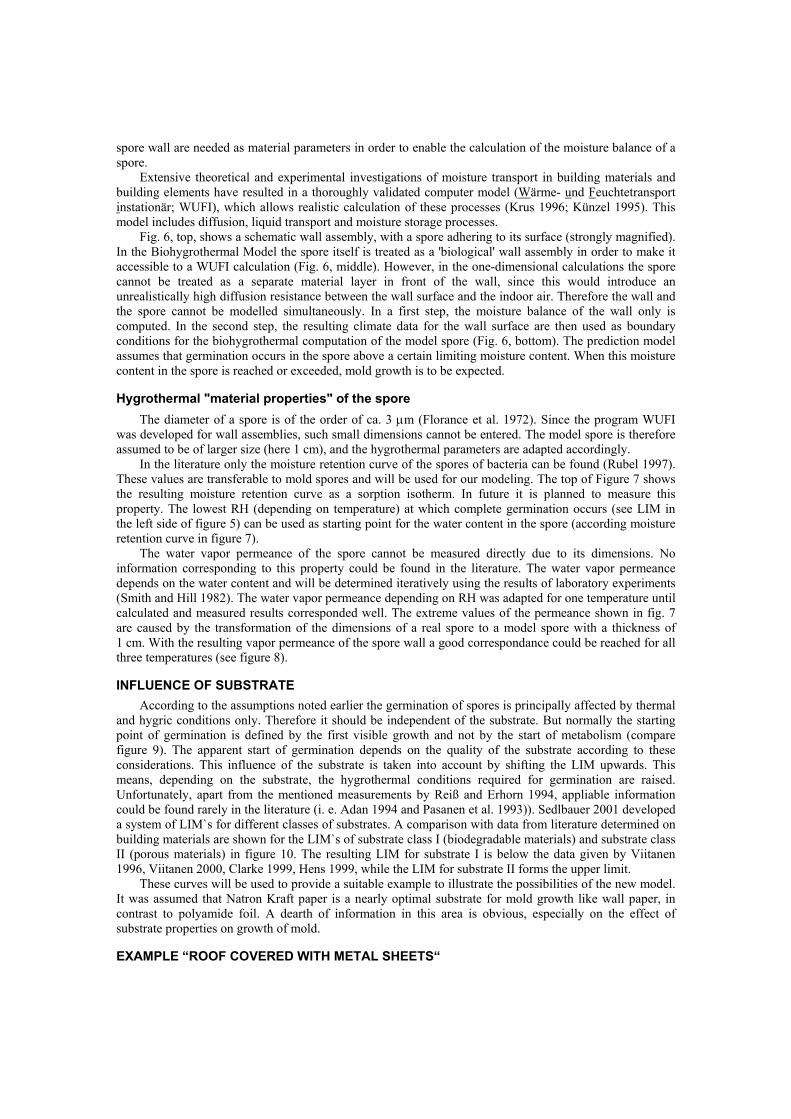
spore wall are needed as material parameters in order to enable the calculation of the moisture balance of a spore.
Extensive theoretical and experimental investigations of moisture transport in building materials and building elements have resulted in a thoroughly validated computer model (Wärme- und Feuchtetransport instationär; WUFI), which allows realistic calculation of these processes (Krus 1996; Künzel 1995). This model includes diffusion, liquid transport and moisture storage processes.
Fig. 6, top, shows a schematic wall assembly, with a spore adhering to its surface (strongly magnified). In the Biohygrothermal Model the spore itself is treated as a 'biological' wall assembly in order to make it accessible to a WUFI calculation (Fig. 6, middle). However, in the one-dimensional calculations the spore cannot be treated as a separate material layer in front of the wall, since this would introduce an unrealistically high diffusion resistance between the wall surface and the indoor air. Therefore the wall and the spore cannot be modelled simultaneously. In a first step, the moisture balance of the wall only is computed. In the second step, the resulting climate data for the wall surface are then used as boundary conditions for the biohygrothermal computation of the model spore (Fig. 6, bottom). The prediction model assumes that germination occurs in the spore above a certain limiting moisture content. When this moisture content in the spore is reached or exceeded, mold growth is to be expected.
Hygrothermal "material properties" of the spore The diameter of a spore is of the order of ca. 3 µm (Florance et al. 1972). Since the program WUFI
was developed for wall assemblies, such small dimensions cannot be entered. The model spore is therefore assumed to be of larger size (here 1 cm), and the hygrothermal parameters are adapted accordingly.
In the literature only the moisture retention curve of the spores of bacteria can be found (Rubel 1997). These values are transferable to mold spores and will be used for our modeling. The top of Figure 7 shows the resulting moisture retention curve as a sorption isotherm. In future it is planned to measure this property. The lowest RH (depending on temperature) at which complete germination occurs (see LIM in the left side of figure 5) can be used as starting point for the water content in the spore (according moisture retention curve in figure 7).
The water vapor permeance of the spore cannot be measured directly due to its dimensions. No information corresponding to this property could be found in the literature. The water vapor permeance depends on the water content and will be determined iteratively using the results of laboratory experiments (Smith and Hill 1982). The water vapor permeance depending on RH was adapted for one temperature until calculated and measured results corresponded well. The extreme values of the permeance shown in fig. 7 are caused by the transformation of the dimensions of a real spore to a model spore with a thickness of 1 cm. With the resulting vapor permeance of the spore wall a good correspondance could be reached for all three temperatures (see figure 8).
INFLUENCE OF SUBSTRATE According to the assumptions noted earlier the germination of spores is principally affected by thermal
and hygric conditions only. Therefore it should be independent of the substrate. But normally the starting point of germination is defined by the first visible growth and not by the start of metabolism (compare figure 9). The apparent start of germination depends on the quality of the substrate according to these considerations. This influence of the substrate is taken into account by shifting the LIM upwards. This means, depending on the substrate, the hygrothermal conditions required for germination are raised. Unfortunately, apart from the mentioned measurements by Reiß and Erhorn 1994, appliable information could be found rarely in the literature (i. e. Adan 1994 and Pasanen et al. 1993)). Sedlbauer 2001 developed a system of LIM`s for different classes of substrates. A comparison with data from literature determined on building materials are shown for the LIM`s of substrate class I (biodegradable materials) and substrate class II (porous materials) in figure 10. The resulting LIM for substrate I is below the data given by Viitanen 1996, Viitanen 2000, Clarke 1999, Hens 1999, while the LIM for substrate II forms the upper limit.
These curves will be used to provide a suitable example to illustrate the possibilities of the new model. It was assumed that Natron Kraft paper is a nearly optimal substrate for mold growth like wall paper, in contrast to polyamide foil. A dearth of information in this area is obvious, especially on the effect of substrate properties on growth of mold.
EXAMPLE “ROOF COVERED WITH METAL SHEETS“

The experiments on the roof covered with metal sheets lead to the development of this model and are additionally serving as its first application. This gable roof has a pitch of 50° and the ridge is oriented in an east-west direction, so that one of the roof planes is facing north and the other is facing south. Fig. 11 (top) displays the basic design of the test sections. The interior view of the insulated roof in Fig. 11 (bottom) shows the three different variants.
The space between the rafters (rafter height 18 cm) had been completely filled with mineral wool (thermal conductivity ca. 0.04 W/mK), so that no air gap was left between the insulation and the rough boarding (30 mm thick). For rafters and boarding moist wood with a moisture content of at least 30 mass-% (dry mass basis) had been used. The investigated vapor retarders were Kraft paper with a permeance of approx. 1 perm, a polyethylene sheet with 0.06 perm and a smart vapor retarder(Künzel 1999) with a permeance between 0.6 and 30 perm, depending on the ambient humidity.
The variation of RH on the inner surfaces of the Kraft paper and the smart vapor retarder in this roof, calculated with the aid of the WUFI model for an observed period of 180 days, are shown in figure 12 (top). The surface temperatures (not shown in fig. 12) were nearly constant with time at about 21 °C. These records have served as boundary conditions for the calculation of the water content inside the spore in step 2 of the analysis.
Due to the high vapor diffusion resistance of the spore wall the courses of the calculated moisture content in the spores are smoothened (compare figure 12 (bottom)) compared to the RH on the inner surface of the roof. On Kraft paper the spore shows a distinctive higher water content in comparison with the smart vapor retarder and reaches more than 60% per Volume. Additionally the variation of the starting point of germination are implied for both materials. Since the surface temperature was nearly constant these records show almost no change with time. It is evident, that the water content of the spore calculated for the Kraft paper lies for a long period at a much higher level than necessary for germination. After about 30 days the growth of mold starts, a result which is quite consistent with the observations on this roof. With the polyamide foil the moisture content exceeds this limit only for a very short period and therefore no risk of mold growth should be expected.
SUMMARY Up to now the common methods to assess the risk of mold growth are based on steady boundary
conditions. While in Germany only relative humidity is stated as a decisive condition for mold growth, more and more measured Isopleths are used abroad. These isopleths state, depending on temperature, the relative humidity from which mold growth may occur. But all curves for growth are determined with steady state conditions, in spite of the non-steady state conditions in reality. This newly developed model, describing the hygrothermal behavior of the spore, allows for the first time to account for the changing surface temperatures and RH’s for the prediction of mold growth. Special research is still necessary in order to determine the required hygrothermal material properties of the spore, such as the moisture retention curve and vapor resistance of the spore wall. The capability of the Biohygrothermal Model to assess the risk of mold growth has been demonstrated impressively with the chosen example. A new basis has been built up to describe non-steady biological processes in mold spores in building systems, at least up to the start of the metabolism.
BIBLIOGRAPHY Adan, O.: On the fungal defacement of interior finishes. Dissertation, University of Technology, Eindhoven
(1994). Ayerst, G.: The Effect of Moisture and Temperature on Growth and Spore Germination in some Fungi, J.
stored Prod. Res. (1969), 5, S. 127-141. Clarke, J. A. et al.: A technique for the prediction of the conditions leading to mould growth in buildings.
Building and Environment Nr. 34, (1999), S. 515 - 521. Deacon, J. W.: Modern Mycology, Blackwell Science (1997). Deutsches Institut für Normung: Wärmeschutz und Energie Einsparung in Gebäuden, Teil x: Vermeidung
von Schimmelpilzen (heat protection and energy saving in buildings, part x: prevention of mold growth), Beuth Verlag (1999), draft from 10.05.99.
Flannigan, B.; Miller, D. J.: Health implications of fungi in indoor environments – an overview. Samson, R. A. et al. (Hrsg.): Health implications of fungi in indoor environments. Air quality monographs. Elsevier, Amsterdam (1994).

Florance, E. R.; Denison, W. C.; Allen, T. C.: Ultrastructure of Dormant and Germinating Conidia of Aspergillus nidulans, Mycologia (1972), 64, S. 115-123.
Hens, H. L. S. C.: Fungal defacement in buildings: A performance related approach. International Journal of Heating, Ventilation, Air-Conditioning and Refrigerating Research Vol. 5 (1999), H. 3, S. 256 - 280.
Krus, M.: Moisture Transport and Storage Coefficients of Porous Mineral Building Materials. Theoretical Principles and New Test Methods. IRB-Verlag Stuttgart (1996), S. 1-172, ISBN 3-8167-4535-0.
Künzel, H. M.: Simultaneous Heat and Moisture Transport in Building Components. – One- and two-dimensional calculation using simple parameters.IRB Verlag (1995), S. 1-154, ISBN 3-8167-4103-7.
Künzel, H. M.: Flexible vapor control solves moisture problems of building assemblies – Smart Retarder to replace the conventional PE-film. Journal of Thermal Envelope & Building Science, Vol. 23 (1999), pp. 95-102.Pasanen, P.; Pasanen, A. L.; Jantunen, M.: Water condensation promotes fungal growth in ventilation ducts. Indoor Air 3 (1993), H. 2, S. 106 - 112.
Reiß, J; Erhorn, H.: Instationäre bauphysikalische Randbedingungen zum Einsetzen des Schimmelpilzwachstums auf Bauteiloberflächen (non-steady boundary conditions for the start of mold growth on building surfaces), IBP-Bericht WB78/1994 (1994).
Reiß, J.: Schimmelpilze (mold fungi), Springer Verlag (1998). Rubel, G. O.: A non-intrusive method for the measurement of water vapour sorption by bacterial spores.
Journal of Applied Microbiology 83, (1997), S. 243 - 247. Sedlbauer, K.: Vorhersage von Schimmelpilzbildung auf und in Bauteilen. Thesis, University of Stuttgart
2001 Smith, S. L.; Hill, S. T.: Influence of temperature and water activity on germination and growth of
aspergillus restrictus and aspergillus versicolor, Trans. Br. Mycol. Soc. (1982), 79(3), S. 558-560. Viitanen, H.: Factors affecting the development of mould and brown root decay in wooden material and
wooden structures. Dissertation, Uppsala (1996). Viitanen, H.; Hanhijärvi, A.; Hukka, A.; Koskela, K.: Modelling mould growth and decay damages.
Proceedings of Healthy Buildings (2000), Vol. 3, S. 341 - 346. Warscheid, T.; Krumbein, W. E.: Biodeteriorationsprozesse an anorganischen Werkstoffen und mögliche
Gegenmaßnahmen. Werkstoffe und Korrosion 45, (1994), S. 105 - 113. Klaus Sedlbauer is deputy director of the Fraunhofer-Institute for Building Physics (IBP), Holzkirchen, Germany. Dr.-Ing Martin Krus is head of a working group within the hygrothermal division of the IBP. Wolfgang Zillig is graduate engineer wood building construction and interior design and working freelance for the IBP. Dr.-Ing. Hartwig Michael Künzel is head of the hygrothermal division of the IBP.

Table 1
Factors, their assessment and way of implementation within the Biohygrothermal Model.
Factor Assessment way of implementation within the Biohygrothermal Model.
Humidity most relevant criterion for growth
moisture retention curve; diffusion kinetics
Temperature strong influence temperature dependent starting point; diffusion kinetics
Time strong influence non-steady course of the water content of the spore
Substrate influence due to substrate and contamination shift of the LIM
pH-Value is influenced by the fungus itself; difficult to predict not allowed for
Light growth also without light always assumed optimal Oxygen usually present always assumed optimal Spore dissemination spores are ubiquitous always assumed optimal Roughness of the surface increased contamination as change in substrate Biotic interactions biotic interactions are unavoidable not allowed for, since all species shall be avoided

Figure 1 Field testing area in Holzkirchen, Germany Top: Photographic view of the whole area
Bottom: Photographic view of the building with roof made of metal sheets

� �� �� �� �� ��
���
��
��
��
��
�
�
�� �� �� �� �� ��
�� �������������
����������� ��������� �
�
�
�
����
�� �!���"!��� �����
�#�
�#�
�#�
�#�
�#��
�#�
�"$��������� %��
Figure 2
Isopleths for mold spores of Aspergillus restrictus. Left side: Isopleth for spore germination Right side: Isopleth for mycelium growth

Figure 3
Investigations on mold growth at the surface of building materials Top: Photographic view of the experimental set-up
Bottom: Resulting mold growth intensity on different paint coats with and without contamination after an observation time of 6 weeks with different periods with RH of 95% (6 hours resp. 24 hours per day) and the rest of the time RH of 60%. The class of
mold intensity of 1 indicates a first growth visible by microscopy, while class 5 indicates total covering with mold.

Figure 4 Schematic view of the most important factors humidity, temperature, substrate and time, which affect the probability of growth.

0 5 10 15 20 25 30Temperature [°C]
70
75
80
85
90
Rel
ativ
e hu
mid
ity [%
]
95
10070
75
80
85
90
95
100
Lowest Isopleth for MoldDifferent species
Figure 5 Development of the Lowest Isopleth for Mold from Isopleths of different species.
Top: Spore germination Bottom: Mycelium growth

��������
�����
�����
�� ������
�����
���� �
�� ������������������������������������ �
��� ������������ �
�� �������
�� ����������� �
����� �
���� �
�������� ���������� ������
�������� ���������� ������
Figure 6 Development of the Biohygrothermal Model
Top: Wall with a mold spore (highly enlarged) on the inner surface Middle: Spore treated as “biological layer“. This yields to a nonrealistic additional diffusion resistance for the building wall.
Bottom: Separate consideration of the biological layer. The inner surface temperature and humidity of the building wall serve as boundary conditions on both sides of the spore (biological layer).

0 20 40 60 80 100Relative humidity [%]
0
20
40
60
80
100
Wat
er c
onte
nt [V
ol.-%
]
� �� �� �� �� ����
���
����
�����
������
��
������������ ����� !
"��������������!
Figure 7 Hygrothermal “material properties“ of the model spore
Top: Moisture retention curve Bottom: Permeance of the spore wall used in the model.

70 75 80 85 90 95 1000
10
20
30
40
Relative humidity [%]
Ger
min
atio
n tim
e [d
]Experimental germination time [Smith]Calculated germination time
24 °C
20 °C
15 °C
Figure 8 Comparison of the experimental germination times to the results calculated with the Biohygrothermal Model. For all
temperatures a good correspondance is reached.

first visiblefungal growth
Gro
wth
optim
um s
ubst
rate
substr
ate cl
ass I
substrate class II
Time
time for visible germinationon different substrate
initiation of metabolism
Figure 9 First visible fungal growth, which is defined as starting point for germination, on different substrates. In contrast to the start of
metabolism a dependency on the substrate is given.

��
������������ ����� !
#�$� �$ �� �$
#$
��
�$
%�
%$
���
&�������������'(!)�
*�������(��+�,���
-./0���.-./0���..
Figure 10 Comparison of the LIM`s of substrate class I (biodegradable materials) and substrate class II (porous materials) with data from literature determined on building materials. The resulting LIM for substrate I is below the data given by the authors mentioned
above, while the LIM for substrate II builds up the upper limit.

1�/��������2������
&�!'�������!(�����)���������*""��!�+������!(���������,�!�����*""�
-��)��.���� + ����/��"����������
Figure 11 The tested roof covered with metal sheets.
Top: Basic design of the test sections. Bottom: Photographical view of the interior

0 30 60 90 120 150 180
0
20
40
60
80
Time [d]
Rel
ativ
e hu
mid
ity [%
]
100
0
15
30
45
60
Wat
er c
onte
nt [V
ol.-%
]
75
Natron Kraft PaperSmart Vapor Retarder
Figure 12:
Calculated results for the vapor retarders inside the roof. Top: Courses of the relative humidities on Kraft paper and smart vapor retarder. This courses serves as boundary conditions for
the calculation of the moisture balance of the spore. Bottom: Courses of the water content inside the spores on Kraft paper and smart vapor retarder. The courses of the starting
point for germination are implied for both materials (horizontal lines).