molecular mapping and breeding of physiological traitsmedcraveonline.com/apar/apar-03-00120.pdf ·...
TRANSCRIPT
Submit Manuscript | http://medcraveonline.com
biology experimentation, and systems analyses in finding solutions to the challenging goals of plant breeding and agricultural biotechnology for crop improvement.1 In addition, the amount of genetic variability particularly additive genetic variability available and the effectiveness with which the selection is performed for the trait of interest decides the advance of any breeding program. Selection based on phenotypic basis becomes confined especially when the traits are of complex nature. Here, molecular markers may prove to be beneficial as they provide several advantages over traditional phenotypic markers.1 Hence, selection based on molecular marker approach will be more precise and accurate way of selection. This method will screen the markers linked to the gene(s) or quantitative trait loci (QTLs).
Drought is the most devastating abiotic stress affecting crop productivity. The primary step to understand the genetic control of tolerance is the physiological dissection of complex traits that as a result could improve competence of molecular breeding strategies.2 High temperature related to drought promotes evapotranspiration and affects photosynthetic kinetics intensifying the effects of drought and resulting into reduced crop yields. Unfortunately, in response to climate change, the occurrence of drought in many food–producing regions has been predicted to be increased considerably.3,4 Hence, it is focused to ensure sustainable and long–term benefits through genetic improvement for water stress tolerance.5
There is acute need for having corresponding information of plant physiological response and integrative modelling to embark upon the puzzling effects connected with environment and gene interaction.6 Physiological progress in this connection increases the probability of crosses resulting in additive gene action for stress adaptation, a benefit over empirical breeding for yield per se offering thorough characterization of the germplasm than for yield alone.7 Further, mapping and cloning of genes concerned in various physiological traits is somewhat a complex progression. However, sequencing technology has provided affluence of genomic (total DNA) and expressed sequence information in locating, interpreting, and assigning biological function.8
Plant breeding institutes have adopted the capacity for marker development and marker–assisted selection (MAS) recognizing the enormous potential of DNA markers. Though non–molecular
biologists may not understand the utility of DNA markers in plant breeding in view of the rapid progresses made in marker technology, statistical methodology for identifying quantitative trait loci (QTLs) and the terminology used by molecular biologists.
This review provides an introduction to criteria for using physiological traits in breeding programmes; molecular markers that includes DNA markers and the concept of polymorphism; QTL detection for physiological traits focusing upon mapping QTLs relevant to photosynthetic potential, absorption and assimilation of nutrients, flowering, drought tolerance and water use efficiency. Besides these, a brief idea regarding heat tolerant–related morpho–physiological traits followed by techniques for identification of putative molecular markers associated with root traits have been also incorporated. This compact and comprehensive review can be of assistance to related researchers.
Criteria for using physiological traits in breeding programmes
Osmotic adjustment, accumulation and remobilization of stem reserves, superior photosynthesis, heat– and desiccation–tolerant enzymes, and so on are important physiological traits (PTs) in a breeding programme either by direct selection or in the course of a substitute such as molecular markers. Several pieces of information on important PTs may be collected on potential parental lines that engross screening of whole crossing block, or a set of commonly used parents, thus bringing into being an index of useful PTs which have to imperatively establish their heritability and genetic correlation with yield in target environments that can be used advantageously in designing crosses, which bring together desirable traits through increasing transgressive segregation events.9,10
It is vital that the application of the trait as a selection criterion be definite when significant genetic diversity for a physiological trait in a germplasm collection for the given species is established. Subsequently, breeding strategies are effective only when these traits are rightly defined in terms of the stage of crop development so as to using specific attributes of the target environment and their potential contribution to yield.7
Adv Plants Agric Res. 2016;3(6):193‒206. 193©2016 Nishant et al. This is an open access article distributed under the terms of the Creative Commons Attribution License, which permits unrestricted use, distribution, and build upon your work non-commercially.
Molecular mapping and breeding of physiological traits
Volume 3 Issue 6 - 2016
Nishant Bhanu A,1 Singh MN,1 Srivastava K,1 Hemantaranjan A2 1Department of Genetics & Plant Breeding, Institute of Agricultural Sciences, India2Department of Plant Physiology, Banaras Hindu University, India
Correspondence: Nishant Bhanu, Department of Genetics & Plant Breeding, Institute of Agricultural Sciences, India, Email [email protected]
Received: April 20, 2016 | Published: June 01, 2016
Advances in Plants & Agriculture Research
Research Article Open Access
IntroductionNumerous significant traits controlled by several genes associated
with a particular quantitative trait are known as quantitative trait loci (QTLs). Major advances in the characterization of quantitative traits to select for QTLs was amplification of DNA (or molecular) markers that will enable plant breeders and researchers in increasing the competence of worldwide food production. Knowledge through advances made in QTL analysis and the application of markers in marker–assisted selection needs to be exploited by conventional breeders, physiologists, molecular biologists and so on. RFLP markers execute demands of breeding programmes for crop improvement, as such markers are versatile tools in various disciplines of plant sciences encompassing generation of large number of molecular–genetic data, development of impressive methodological skills in molecular
Molecular mapping and breeding of physiological traits 194Copyright:
©2016 Nishant et al.
Citation: Nishant BA, Singh MN, Srivastava K, et al. Molecular mapping and breeding of physiological traits. Adv Plants Agric Res. 2016;3(6):193‒206. DOI: 10.15406/apar.2016.03.00120
Molecular markers for physiological traitsMendel’s classical studies on garden peas led the foundation of
the plant genetics. After this the researchers started identifying, categorizing and mapping single gene markers in different plant species. Based on the visual observation of morphological features, the markers on first genetic map for phenotypic traits were scored in the fruit flies. The morphological markers have been found in nature or as the result of mutagenesis experiments. These are highly influenced by environmental factors. Besides this, based on the proteins produced by gene expression are also employed that comes under the category of biochemical markers. These proteins are generally isozymes i.e. isomorphs of an enzyme that catalyzes the same reaction. Discrete bands of isozymes can be isolated and recognized by electrophoresis and staining. They are the products of various alleles of one or several genes. As isozymes are coded by the genes, the resulting isozyme banding patterns are used to infer genetic relationships based on interpretations of banding polymorphisms.11 However, being post transcriptional markers, expression of isozymes is influenced by environmental changes causing polymorphisms that might not reflect real variances at the molecular level. Development of molecular markers in the 1980s proved to be a major breakthrough in the field of plant breeding as it facilitated the selection and characterization of QTLs. Molecular markers assists the construction of linkage maps which represents the position of genes within a linkage group. This dissolved the problem of creation of multimarker lines for contruction of linkage map. Using QTL analysis, linkage maps can be exploited for detection of chromosomal regions governing traits controlled by either oligogenes or polygenes. In addition, the efficiency and precision of conventional breeding can be enhanced through DNA markers which have the potential to be used as molecular tool for marker–assisted selection (MAS) in plant breeding.12 MAS permits for the selection of genes that control traits of interest using the presence/absence of a marker. Combined with traditional phenotypic selection techniques, MAS has become an efficient, effective, reliable and cost–effective tool compared to the more conventional plant breeding methodology. The use of DNA markers in plant breeding as marker–
assisted selection has unlocked a new realm in agriculture and is a component of the new discipline called ‘molecular breeding’.13
Different types of molecular markers, with differences in their principles, methodologies, and applications exists which requires careful consideration.1 With the advancement in the sequencing techniques making more DNA sequence data available, molecular genetics and genomics approaches focussing on cross–referencing genes and genomes using sequence and map–based tools will offer great promise to plant breeders. Generally a marker taken into consideration must be polymorphic. It must exist in different forms so that clear cut distinction between the chromosome carrying the mutant gene and the one carrying normal gene by the form of marker it also carries can be accomplished. This polymorphism in the marker can be detected by observing the difference in the nucleotide sequence of DNA (by Molecular markers).
Molecular markersMolecular markers or DNA markers refers to
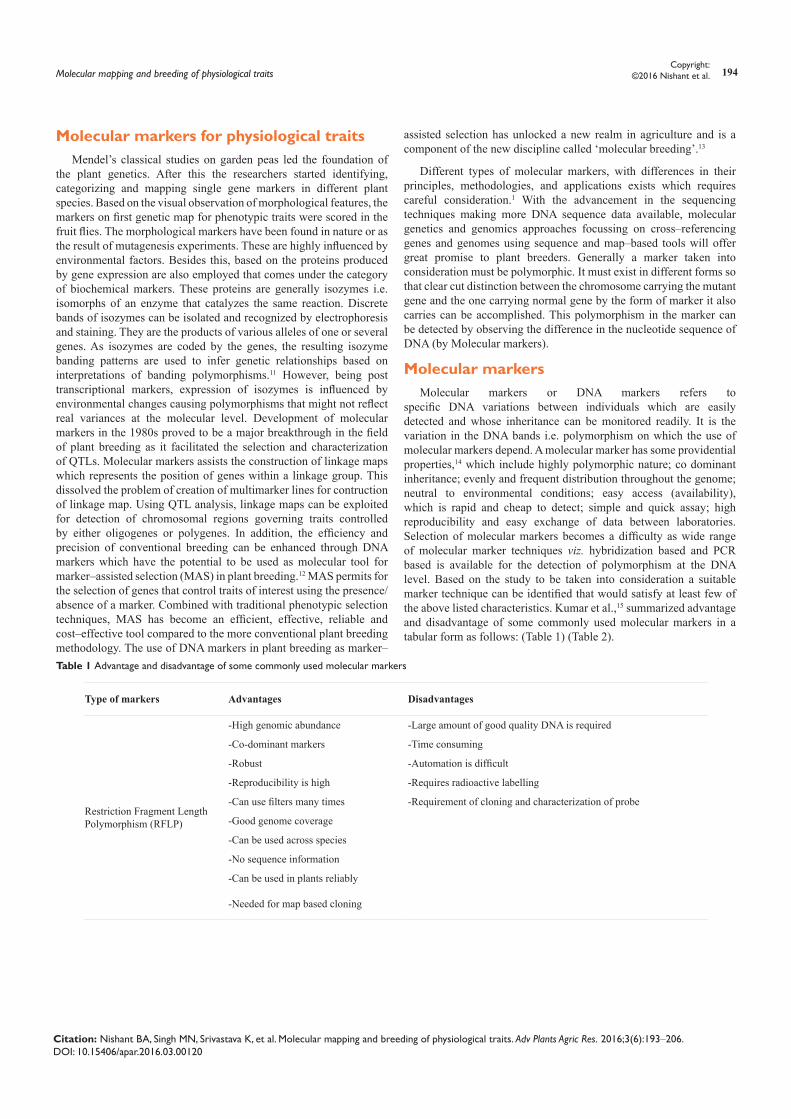
specific DNA variations between individuals which are easily detected and whose inheritance can be monitored readily. It is the variation in the DNA bands i.e. polymorphism on which the use of molecular markers depend. A molecular marker has some providential properties,14 which include highly polymorphic nature; co dominant inheritance; evenly and frequent distribution throughout the genome; neutral to environmental conditions; easy access (availability), which is rapid and cheap to detect; simple and quick assay; high reproducibility and easy exchange of data between laboratories. Selection of molecular markers becomes a difficulty as wide range of molecular marker techniques viz. hybridization based and PCR based is available for the detection of polymorphism at the DNA level. Based on the study to be taken into consideration a suitable marker technique can be identified that would satisfy at least few of the above listed characteristics. Kumar et al.,15 summarized advantage and disadvantage of some commonly used molecular markers in a tabular form as follows: (Table 1) (Table 2).
Table 1 Advantage and disadvantage of some commonly used molecular markers
Type of markers Advantages Disadvantages
Restriction Fragment Length Polymorphism (RFLP)
-High genomic abundance -Large amount of good quality DNA is required
-Co-dominant markers -Time consuming
-Robust -Automation is difficult
-Reproducibility is high -Requires radioactive labelling
-Can use filters many times -Requirement of cloning and characterization of probe
-Good genome coverage
-Can be used across species
-No sequence information
-Can be used in plants reliably
-Needed for map based cloning
Molecular mapping and breeding of physiological traits 195Copyright:
©2016 Nishant et al.
Citation: Nishant BA, Singh MN, Srivastava K, et al. Molecular mapping and breeding of physiological traits. Adv Plants Agric Res. 2016;3(6):193‒206. DOI: 10.15406/apar.2016.03.00120
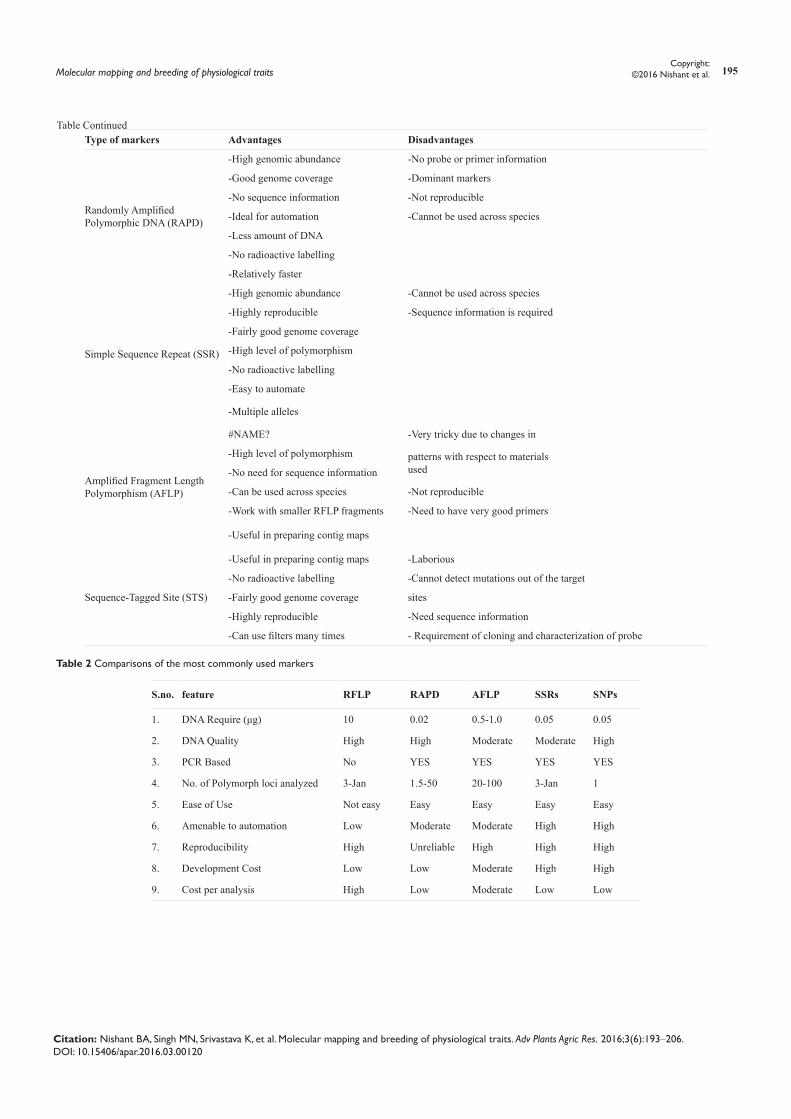
Type of markers Advantages Disadvantages
Randomly Amplified Polymorphic DNA (RAPD)
-High genomic abundance -No probe or primer information
-Good genome coverage -Dominant markers
-No sequence information -Not reproducible
-Ideal for automation -Cannot be used across species
-Less amount of DNA
-No radioactive labelling
-Relatively faster
Simple Sequence Repeat (SSR)
-High genomic abundance -Cannot be used across species
-Highly reproducible -Sequence information is required
-Fairly good genome coverage
-High level of polymorphism
-No radioactive labelling
-Easy to automate
-Multiple alleles
Amplified Fragment Length Polymorphism (AFLP)
#NAME? -Very tricky due to changes in
-High level of polymorphism patterns with respect to materials used -No need for sequence information
-Can be used across species -Not reproducible
-Work with smaller RFLP fragments -Need to have very good primers
-Useful in preparing contig maps
Sequence-Tagged Site (STS)
-Useful in preparing contig maps -Laborious
-No radioactive labelling -Cannot detect mutations out of the target
-Fairly good genome coverage sites
-Highly reproducible -Need sequence information
-Can use filters many times - Requirement of cloning and characterization of probe
Table 2 Comparisons of the most commonly used markers
S.no. feature RFLP RAPD AFLP SSRs SNPs
1. DNA Require (μg) 10 0.02 0.5-1.0 0.05 0.05
2. DNA Quality High High Moderate Moderate High
3. PCR Based No YES YES YES YES
4. No. of Polymorph loci analyzed 3-Jan 1.5-50 20-100 3-Jan 1
5. Ease of Use Not easy Easy Easy Easy Easy
6. Amenable to automation Low Moderate Moderate High High
7. Reproducibility High Unreliable High High High
8. Development Cost Low Low Moderate High High
9. Cost per analysis High Low Moderate Low Low
Table Continued
Molecular mapping and breeding of physiological traits 196Copyright:
©2016 Nishant et al.
Citation: Nishant BA, Singh MN, Srivastava K, et al. Molecular mapping and breeding of physiological traits. Adv Plants Agric Res. 2016;3(6):193‒206. DOI: 10.15406/apar.2016.03.00120
In addition, Kumar et al.,15 made comparisons of the most commonly used markers as given below:
Identification of DNA polymorphism between different groups through molecular markers has become worthwhile. These polymorphisms either being a single nucleotide changes, small or large insertions and deletions or length variation in repeat sequences provides significant information of the locus in the genome associated with a particular phenotypic character. The linkage map prepared can be utilized to relate the marker loci to a particular plant phenotypic data obtained from field trials and laboratory or glasshouse experiments.16 Each marker loci is genetically characterized in a segregating population and recombination frequency among alleles at each pair of loci is determined using concept of classical linkage and markers are arranged in linear order in linkage map. The distance between loci is expressed as map units given in centiMorgans (cM) where one map unit is equal to 1% recombination. Several computer programs viz. MAPMAKER, THREad mapper, QTL IciMapping etc. are available which generates a map once markers have been applied to a segregating population. Creation of linkage map allows developing markers which can efficiently mark the polygenic traits and in addition assists in identifying the genes associated with the traits which will enhance the speed and precision of crop improvement in the coming days.
QTL detection for physiological traitsComprehensively, genetic level based selection where markers
linked to the gene(s) or quantitative trait loci (QTLs) underlying the trait screened is the precise approach of selection. For the plant breeders to have a better understanding of the genetic correlation among important traits, QTL mapping of physiological traits will be very valuable. As determining physiological traits on routine basis is time consuming as well as expensive. In such case, QTL mapping assists as a potential approach to facilitate efficient incremental improvement of specific individual target traits. DNA markers closely linked to QTL responsible for the expression of a physiological trait once identified the identified loci can be successfully used to enhance the genetic advance through marker assisted selection. For dissection of genetic control of a number of traits QTL mapping has become a standard protocol. Moreover, with the availability of wide range of markers and powerful statistical analysis tools the application of QTL mapping has been facilitated in identifying genes, alleles and physiological processes that are biologically vital. QTL analysis is based on the principle of detection of association between phenotype and the genotype of markers. In this, first of all the mapping population is categorized into different genotypic groups on the basis of presence or absence of a particular marker locus and then significant difference between groups with respect to traits under consideration is determined.17 If significant difference between phenotypic means of the genotypic groups exists it designates that the marker loci is linked to the QTL that governs or influences the trait.
Steps involved in QTL mapping are:
i. development of appropriate mapping populations segregating for trait of interest [F2 or Fx derived families, backcross (BC), double haploids (DH), recombinant inbred lines (RILs) and near isogenic lines (NILs)],
ii. precise phenotyping for related traits (morphological characters, agronomic traits, disease and pest scores, drought resistance, etc.),
iii. deciding the type of marker(s) and identification of polymorphism,
iv. genotyping of the mapping populations with polymorphic markers,
v. construction of genetic maps using statistical programs and
vi. QTL mapping using both genotypic and phenotypic data.18,19
Single–marker analysis, simple interval mapping and composite interval mapping are the three widely–used methods for detecting QTLs.17,20 Single–marker analysis is the detection of QTLs associated with single markers. This includes statistical methods like t–tests, analysis of variance (ANOVA) and linear regression for the analysis. Among these, linear regression is the most common used one because in this the coefficient of determination (R2) from the marker explains the phenotypic variation arising from the QTL linked to the marker. Whereas, simple interval mapping (SIM) instead of analyzing single markers utilizes linkage maps taking up one marker interval at a time and analyses intervals between adjacent pairs of linked markers along chromosomes simultaneously.21 SIM has become the standard method for mapping QTL as use of linked markers for analysis compensates for recombination between the markers and the QTL and has been put into practice in several freely distributed software packages.20,21 Once the candidate gene or the markers associated with the trait of interest has been identified the next step is their utilization in the breeding programme. Here, Marker assisted backcrossing (MABC), marker assisted recurrent selection (MARS) and genome wide selection (GWS) is few important approaches which can be taken up. MABC is the process in which the QTLs are introgressed into the recipient parent (breeding lines) without linkage drags i.e. transfer of any undesirable genes from donors.22 However, MARS that engross the use of F2 base population involves intermating of selected individuals in each selection cycle can be efficiently used in self pollinated crops.23–25 In addition, MARS can also be used for Multiple QTLs controlling the expression of a complex trait which is a constraint in case of MABC.
Often, from the perspective of a plant breeder, grower or an end user the most important trait is the yield. However, yield taken as a ‘single’ trait is actually the most complex trait which is the end result of the direct and indirect effect of many physiological processes interacting to different levels contributing to the final biomass of the crop. Thus, a better understanding of physiological processes individually along with their interaction turning out in a handy end product is the prime objective. Here QTL mapping can play a major part both at the basic research as well as in applied breeding programs to boost the crop variety and productivity. The most fundamental of plant processes such as photosynthesis, through growth and development along with the secondary functions such as response to stress, all have important implications for crop yield. Through a number of different physiological processes which have been studied at the molecular level to underline the potential for marker–assisted breeding even for complex traits, examples of how QTL mapping can and is being applied to increase understanding of plant physiology and will subsequently impact on plant breeding will be demonstrated. This section will cover the aspects of photosynthesis, nutrient absorption, flowering, drought tolerance and water use efficiency.
Molecular mapping and breeding of physiological traits 197Copyright:
©2016 Nishant et al.
Citation: Nishant BA, Singh MN, Srivastava K, et al. Molecular mapping and breeding of physiological traits. Adv Plants Agric Res. 2016;3(6):193‒206. DOI: 10.15406/apar.2016.03.00120
Mapping QTLs relevant to photosynthetic potential
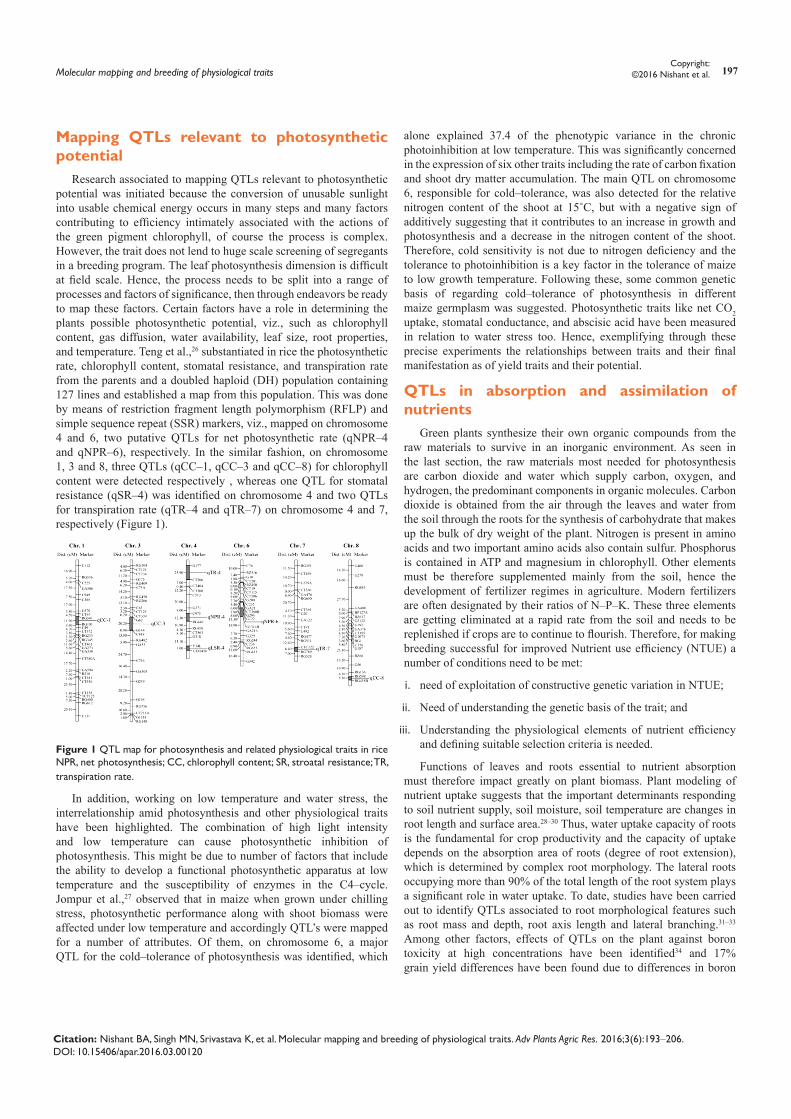
Research associated to mapping QTLs relevant to photosynthetic potential was initiated because the conversion of unusable sunlight into usable chemical energy occurs in many steps and many factors contributing to efficiency intimately associated with the actions of the green pigment chlorophyll, of course the process is complex. However, the trait does not lend to huge scale screening of segregants in a breeding program. The leaf photosynthesis dimension is difficult at field scale. Hence, the process needs to be split into a range of processes and factors of significance, then through endeavors be ready to map these factors. Certain factors have a role in determining the plants possible photosynthetic potential, viz., such as chlorophyll content, gas diffusion, water availability, leaf size, root properties, and temperature. Teng et al.,26 substantiated in rice the photosynthetic rate, chlorophyll content, stomatal resistance, and transpiration rate from the parents and a doubled haploid (DH) population containing 127 lines and established a map from this population. This was done by means of restriction fragment length polymorphism (RFLP) and simple sequence repeat (SSR) markers, viz., mapped on chromosome 4 and 6, two putative QTLs for net photosynthetic rate (qNPR–4 and qNPR–6), respectively. In the similar fashion, on chromosome 1, 3 and 8, three QTLs (qCC–1, qCC–3 and qCC–8) for chlorophyll content were detected respectively , whereas one QTL for stomatal resistance (qSR–4) was identified on chromosome 4 and two QTLs for transpiration rate (qTR–4 and qTR–7) on chromosome 4 and 7, respectively (Figure 1).
Figure 1 QTL map for photosynthesis and related physiological traits in rice NPR, net photosynthesis; CC, chlorophyll content; SR, stroatal resistance; TR, transpiration rate.
In addition, working on low temperature and water stress, the interrelationship amid photosynthesis and other physiological traits have been highlighted. The combination of high light intensity and low temperature can cause photosynthetic inhibition of photosynthesis. This might be due to number of factors that include the ability to develop a functional photosynthetic apparatus at low temperature and the susceptibility of enzymes in the C4–cycle. Jompur et al.,27 observed that in maize when grown under chilling stress, photosynthetic performance along with shoot biomass were affected under low temperature and accordingly QTL’s were mapped for a number of attributes. Of them, on chromosome 6, a major QTL for the cold–tolerance of photosynthesis was identified, which
alone explained 37.4 of the phenotypic variance in the chronic photoinhibition at low temperature. This was significantly concerned in the expression of six other traits including the rate of carbon fixation and shoot dry matter accumulation. The main QTL on chromosome 6, responsible for cold–tolerance, was also detected for the relative nitrogen content of the shoot at 15˚C, but with a negative sign of additively suggesting that it contributes to an increase in growth and photosynthesis and a decrease in the nitrogen content of the shoot. Therefore, cold sensitivity is not due to nitrogen deficiency and the tolerance to photoinhibition is a key factor in the tolerance of maize to low growth temperature. Following these, some common genetic basis of regarding cold–tolerance of photosynthesis in different maize germplasm was suggested. Photosynthetic traits like net CO2 uptake, stomatal conductance, and abscisic acid have been measured in relation to water stress too. Hence, exemplifying through these precise experiments the relationships between traits and their final manifestation as of yield traits and their potential.
QTLs in absorption and assimilation of nutrients
Green plants synthesize their own organic compounds from the raw materials to survive in an inorganic environment. As seen in the last section, the raw materials most needed for photosynthesis are carbon dioxide and water which supply carbon, oxygen, and hydrogen, the predominant components in organic molecules. Carbon dioxide is obtained from the air through the leaves and water from the soil through the roots for the synthesis of carbohydrate that makes up the bulk of dry weight of the plant. Nitrogen is present in amino acids and two important amino acids also contain sulfur. Phosphorus is contained in ATP and magnesium in chlorophyll. Other elements must be therefore supplemented mainly from the soil, hence the development of fertilizer regimes in agriculture. Modern fertilizers are often designated by their ratios of N–P–K. These three elements are getting eliminated at a rapid rate from the soil and needs to be replenished if crops are to continue to flourish. Therefore, for making breeding successful for improved Nutrient use efficiency (NTUE) a number of conditions need to be met:
i. need of exploitation of constructive genetic variation in NTUE;
ii. Need of understanding the genetic basis of the trait; and
iii. Understanding the physiological elements of nutrient efficiency and defining suitable selection criteria is needed.
Functions of leaves and roots essential to nutrient absorption must therefore impact greatly on plant biomass. Plant modeling of nutrient uptake suggests that the important determinants responding to soil nutrient supply, soil moisture, soil temperature are changes in root length and surface area.28–30 Thus, water uptake capacity of roots is the fundamental for crop productivity and the capacity of uptake depends on the absorption area of roots (degree of root extension), which is determined by complex root morphology. The lateral roots occupying more than 90% of the total length of the root system plays a significant role in water uptake. To date, studies have been carried out to identify QTLs associated to root morphological features such as root mass and depth, root axis length and lateral branching.31–33 Among other factors, effects of QTLs on the plant against boron toxicity at high concentrations have been identified34 and 17% grain yield differences have been found due to differences in boron
Molecular mapping and breeding of physiological traits 198Copyright:
©2016 Nishant et al.
Citation: Nishant BA, Singh MN, Srivastava K, et al. Molecular mapping and breeding of physiological traits. Adv Plants Agric Res. 2016;3(6):193‒206. DOI: 10.15406/apar.2016.03.00120
concentrations. An et al.,35 detected several QTLs under low and high nitrogen conditions and demonstrated that greater seedling vigor of root and shoot influences increased nitrogen uptake in wheat. A number of studies taking Common bean (Phaseolus vulgaris L.) as the most widely studied species, efforts have been done to associate the root architecture and developmental traits with QTLs for phosphorus uptake or utilization efficiency.36–44 Three QTLs contributing to phosphorus acquisition efficiency (Pup4.1, Pup7.1, and Pup11.1) in the field were found linked to some of the QTLs associated with root gravitropism,36 suggesting that root gravitropism contributes to phosphorus use efficiency (PUE). Some promising work has been done in this direction in rice to improve PUE. A QTL linked with phosphorus uptake (Pup 1) has been identified conferring significant improvements in growth and yield in upland rice under low soil phosphorus.45–47 The use efficiency of many nutrients at physiological and molecular bases are, in general, poorly inferred and often only defined in broad terms. Therefore, a great potential for significant yield improvement depends on the comprehension and optimization of physiological processes related with plant nutrient uptake. In this context, the rapid development of an array of molecular and genomic techniques which aids in understanding the genetic basis of the traits and their mechanism will surely offer an opportunity to overcome the impediments that have stalled the progress so far.
QTLs involvement in floweringDevelopment of plant is seasonal with flowering and erstwhile
developmental processes happening at particular times of the year. The reproductive success of plants depends on the critical timing of the transition to flowering, viz., photoperiodism (the response to day length) and vernalization (the response through exposure to a period of cold). Genes determine the flowering time that control vernalization response. Individual genes that have qualitative effects on these responses have been identified using molecular markers. The intricate interactions among genes of these three classes often result in continuous variation in flowering time that is usually analyzed by quantitative trait loci (QTL) techniques.48 The flowering inhibition in short day plant and stimulation of flowering in long day plants involves the operation of phytochrome. Photoperiodism is an example for physiological preconditioning. The most prominent current advances in our understanding of the genetic control of the timing of flowering have come from work on Arabidopsis. The hypothesis that the transition to flowering is under multifactorial control is duly supported by the genetic analysis of flowering time in pea, cereals, and Arabidopsis. For control of flowering time, multiple genes have been identified in different species. Equivalences between transmission of the vernalization signal and of DNA methylation patterns suggested that vernalization may result from a change in DNA methylation of specific gene(s), allowing expression of these genes which subsequently triggers flowering.49
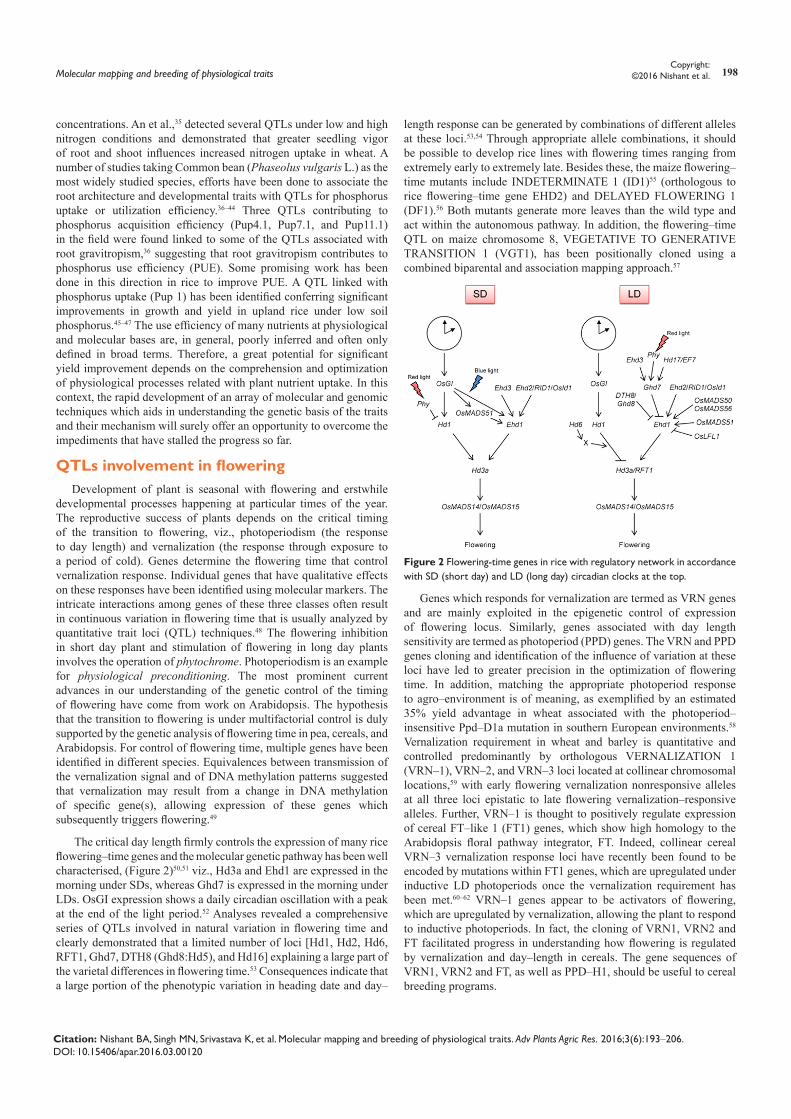
The critical day length firmly controls the expression of many rice flowering–time genes and the molecular genetic pathway has been well characterised, (Figure 2)50,51 viz., Hd3a and Ehd1 are expressed in the morning under SDs, whereas Ghd7 is expressed in the morning under LDs. OsGI expression shows a daily circadian oscillation with a peak at the end of the light period.52 Analyses revealed a comprehensive series of QTLs involved in natural variation in flowering time and clearly demonstrated that a limited number of loci [Hd1, Hd2, Hd6, RFT1, Ghd7, DTH8 (Ghd8:Hd5), and Hd16] explaining a large part of the varietal differences in flowering time.53 Consequences indicate that a large portion of the phenotypic variation in heading date and day–
length response can be generated by combinations of different alleles at these loci.53,54 Through appropriate allele combinations, it should be possible to develop rice lines with flowering times ranging from extremely early to extremely late. Besides these, the maize flowering–time mutants include INDETERMINATE 1 (ID1)55 (orthologous to rice flowering–time gene EHD2) and DELAYED FLOWERING 1 (DF1).56 Both mutants generate more leaves than the wild type and act within the autonomous pathway. In addition, the flowering–time QTL on maize chromosome 8, VEGETATIVE TO GENERATIVE TRANSITION 1 (VGT1), has been positionally cloned using a combined biparental and association mapping approach.57
Figure 2 Flowering-time genes in rice with regulatory network in accordance with SD (short day) and LD (long day) circadian clocks at the top.
Genes which responds for vernalization are termed as VRN genes and are mainly exploited in the epigenetic control of expression of flowering locus. Similarly, genes associated with day length sensitivity are termed as photoperiod (PPD) genes. The VRN and PPD genes cloning and identification of the influence of variation at these loci have led to greater precision in the optimization of flowering time. In addition, matching the appropriate photoperiod response to agro–environment is of meaning, as exemplified by an estimated 35% yield advantage in wheat associated with the photoperiod–insensitive Ppd–D1a mutation in southern European environments.58 Vernalization requirement in wheat and barley is quantitative and controlled predominantly by orthologous VERNALIZATION 1 (VRN–1), VRN–2, and VRN–3 loci located at collinear chromosomal locations,59 with early flowering vernalization nonresponsive alleles at all three loci epistatic to late flowering vernalization–responsive alleles. Further, VRN–1 is thought to positively regulate expression of cereal FT–like 1 (FT1) genes, which show high homology to the Arabidopsis floral pathway integrator, FT. Indeed, collinear cereal VRN–3 vernalization response loci have recently been found to be encoded by mutations within FT1 genes, which are upregulated under inductive LD photoperiods once the vernalization requirement has been met.60–62 VRN–1 genes appear to be activators of flowering, which are upregulated by vernalization, allowing the plant to respond to inductive photoperiods. In fact, the cloning of VRN1, VRN2 and FT facilitated progress in understanding how flowering is regulated by vernalization and day–length in cereals. The gene sequences of VRN1, VRN2 and FT, as well as PPD–H1, should be useful to cereal breeding programs.
Molecular mapping and breeding of physiological traits 199Copyright:
©2016 Nishant et al.
Citation: Nishant BA, Singh MN, Srivastava K, et al. Molecular mapping and breeding of physiological traits. Adv Plants Agric Res. 2016;3(6):193‒206. DOI: 10.15406/apar.2016.03.00120
Above and beyond, vernalization promotes spring flowering in many ecotypes of Arabidopsis. The central regulator of vernalization induced flowering in Arabidopsis is a MADS box transcription factor gene, FLOWERING LOCUS C (FLC).63,64 FLC is a floral repressor that delays both the transition to reproductive apex development and long–day promotion of flowering until plants have experienced vernalization.63,64 FLC represses transcription of two floral promoters; FT and SUPPRESSOR OF OVER–EXPRESSION OF CONSTANS 1 (SOC1), a MADS box transcription factor that promotes the transition to reproductive apex development.65,66 FLC is expressed at high levels in plants, which have not experienced vernalization,63,64 and the FLC protein binds to sequences in an intron of FT and the promoter of SOC1 to repress transcription of both these genes,67 which delays flowering. Vernalization represses transcription of FLC.63,64 The degree to which FLC is repressed is relative to the duration of cold exposure, permitting quantitative changes in flowering time in response to different lengths of vernalization. Just about the time of meiosis, repression of FLC ceases, permits the vernalization response to be reset in the next generation.64
Drought toleranceWith the advancement in the field of crop physiology, systematic
plant phenotyping and genomics a better understanding towards the gene network offering new tools for plant improvement against drought tolerance coupled with increase in yield have been developed in the crop breeders.68 The response to drought stress is a complex and polygenic trait at the molecular level. A number of genes that respond to drought stress at transcriptional level have been recognized by means of high–throughput molecular studies.69 Several QTLs for drought tolerance have been identified for major and important crop species like rice, maize, wheat, barley, sorghum, pearl millet, soybean and chickpea. Important traits for which QTLs have been identified which include:
i. Yield and yield–contributing traits under water–deficit conditions (wheat, maize, rice, soybean and pearl millet),
ii. Physiological responses including water–soluble carbohydrates, osmotic potential, osmotic adjustment, relative water content, chlorophyll content, grain carbon isotope discrimination, flag leaf rolling index, leaf osmotic potential, chlorophyll and chlorophyll fluorescence parameters to drought stress (wheat, maize and rice),
iii. Flowering time incuding anthesis to silking interval in maize,
iv. Root traits in rice, maize, wheat, chickpea and soybean,
v. Stay green traits in sorghum and
vi. Nitrogen fixation in soybean. Still, there is no documentation for the effect of QTL on the impact of drought on grain quality.
In addition, on one side where plant physiology advances our perceptiveness of the complex association of drought tolerance–related traits and consequently improving selection efficiency, molecular biology and genomics approaches on the other side discovers the candidate genes and quantitative trait loci (QTLs) associated with these traits. Varshney et al.,70 advocated that although QTLs can be organized in crop improvement from end to end molecular breeding, candidate genes are the prime targets using genetic engineering for generating transgenic. Nevertheless, there is still a wider acceptance of products generated through molecular breeding70–72 and Targeted Induced Local Lesions in Genome (TILLING)73 than the application of
genetic engineering approach because of negative public perceptions towards biosafety issues and the high–priced regulatory process.
In rice, genes for protection of plants from desiccation through stress perception, signal transduction, transcriptional regulatory networks in cellular responses to dehydration have been identified.74 Several major QTLs with large and reliable effects on grain yield under drought stress have been identified at IRRI. However, identification of major QTLs for grain yield under drought stress and their successful introgression in drought susceptible varieties of rice can prove to be a successful marker assisted breeding method to overcome the challenges of drought stress. This can be supported by the findings of Zou et al.,75 who reported that the identified major QTLs were effective across water regimes and are appropriate for development of varieties combating losses due to different levels of water stress. Bernier et al.,76 reported a QTL, qDTY12.1 on chromosome 12 in a Vandana/Way Rarem population which improves the grain yield under severe drought stress mainly through a slight improvement (7%) in plant water uptake under water scarcity. Similarly, Venuprasad et al. in 2009 identified two major–effect QTLs, qDTY3.1 and qDTY2.1 in an Apo/2*Swarna population which had a large effect on grain yield under severe lowland drought stress and aerobic environments. The major QTLs associated with drought tolerance76,77 are being transferred using marker assisted backcrossing into a few Sub1 varieties that are popular for both drought and submergence prone areas, such as Swarna–Sub1 and IR64–Sub1. Further, a consistent major–effect QTL for grain yield, qDTY1.1, was identified.78,79 Recently, in Adaysel/IR64–derived populations four major–effect QTLs, qDTY2.2, qDTY4.1, qDTY9.1, and qDTY10.1 have been identified.80 In addition to this, 23 QTLs linked to plant phenology and production traits under stress using meta–analysis, have also been identified.81 SNAC1 gene, under drought condition is induced in guard cells mainly which encodes a NAM, ATAF and CUC (NAC) transcription factor with transactivation activity.82–84 Over expression of stress–responsive rice SNAC genes such as SNAC1, OsNAC6/SNAC2 and OsNAC5 improves drought tolerance. Significant level of improvement for drought tolerance in rice was observed when there was an over–expression of TFs like AREB185 and DREB/CBF.85–87
Thus, identification of QTLs with major effect independent of genetic background not affected by genotype–environment interaction and devising an efficient and effective approach of breeding for the introgression of the major QTLs is the prerequisite.88 In this regard, Malosetti et al.,89 suggested multitrait multi–environment (MTME) QTL models which can be helpful in identifying the genome regions accountable for genetic correlations and how these genetic correlations are influenced by environmental conditions.
Besides these, for accumulating complementary physiological traits in selected progeny, the conceptual models of drought–adaptive traits for strategic trait–based crossing have been found helpful. The significant steps to assess the variation leading to increase in genetic gain include:
i. Classification of crossing block lines for stress–adaptive mechanisms,
ii. Strategy based crossing among parents with diverse but potentially complementary physiological trait expression, which ascertains cumulative gene action in selected progeny, and
iii. Early generation selection (EGS) of bulks for canopy temperature (CT).90,91
Molecular mapping and breeding of physiological traits 200Copyright:
©2016 Nishant et al.
Citation: Nishant BA, Singh MN, Srivastava K, et al. Molecular mapping and breeding of physiological traits. Adv Plants Agric Res. 2016;3(6):193‒206. DOI: 10.15406/apar.2016.03.00120
iv. Morphological traits viz., maintenance of turgor, leaf rolling initiation, cuticular wax, root characteristics like deep and course root with greater xylem vessel radii and lower axial resistance to water flux can be used as measures for scoring drought tolerance.
Water Use efficiencyMounting demand of food supply and risk of frequent drought
due to climate change coupled with diminishing fresh water supplies has drawn the attention of researchers to enhance “agricultural water productivity” through agronomic and genetic means.90,92,93 Therefore, better understanding of water use efficiency (WUE), a major challenge to global agriculture is of immense need.94 Till date, very few studies have been conducted to measure WUE as WUE is a complex quantitative trait. Presence of genetic variation within species and among species encouraged plant breeders to develop selection criteria for improving WUE.95–97 On the other hand, it was also observed that traits responding to high WUE are often associated with low yield potential.97,98 For this reason, till date, very few studies have been conducted to measure WUE and being a complex quantitative trait, its study becomes more tiresome. Many scientists have suggested that direct measurement of WUE at plant level is the most accurate method for evaluating WUE as it has the advantage of monitoring the complete growth cycle along with significant indexes like biomass and yield.99–101 Several plant characters have been found that influence WUE. Physical attributes of plant influencing WUE comprise canopy size and architecture (influences evapotranspiration, leaf transpiration and photosynthesis); leaf size and orientation (heat load and radiation interception); leaf morphology and anatomy (stomatal conductance, water holding capacity) and root anatomy and architecture (water transport efficiency). Apart from this, biochemicals and enzymes like ABA, an important stress hormone also plays a role in controlling loss of water. Among physical attributes, leaf characteristics are the probable supreme factors contributing for transpiration efficiency (TE). Expression of KNOX 1 gene present in most of the eudicots controls the variation in leaf shape complexity.102,103 Another trait, pubescence can also be helpful in case of increased resistance to water vapour diffusion. For this a single dominant gene SPUB has been identified in Brachypodium distachyon, whose expression can be manipulated and utilized in crops like wheat and barley.104
In the last decade, the research has progressed focussing on finding the genes playing a significant role in influencing WUE and genes mainly involved in signalling, water transport or transcription of processes that affects transpiration efficiency and have been identified. The major advancement in manipulating the WUE became possible when a gene ERECTA, a leucine–rich repeat receptor likes kinase (LRR–RLK) was identified in Arabdiopsis thaliana that regulates the coordination between photosynthesis and transpiration.105 Several transcription factors which control the expression of many genes influencing stomatal density and ABA signaling have also been documented. GTL 1 was found to be associated with stomatal development and overexpression of HARDY, an AP2–ERF–like transcription factor induced thicker leave in Arabdiopsis thaliana.106,107 In addition to this, DREB 1 associated with increased antioxidant activities during drought response108 has been expressed in groundnut97,109 and ABP 9 which takes part in ABA–dependent signaling pathway has been exploited to isolate drought and high temperature tolerant transgenic Arabdiopsis.110
Moreover, aquaporins, a membranous channel proteins serving as channel in transfer of water plays crucial role in the control of water
content of cells. Overexpression of a tobacco aquaporin NtAQP1 in tomato has been found which enhanced the transpiration efficiency without any yield penalty (Sade et al. 2010). Adding to this, a few regulatory genes that contribute both directly and indirectly for WUE regulating transpiration efficiency have also been identified. ESKIMO 1 gene which encodes a protein of unknown function is associated with the regulation of processes responding to osmotic, salt and ABA treatments and has been found beneficial in maintaining water balance.111 ABA–inducible HVA1 gene of barley is another gene associated with ABA signaling has shown positive effect for transpiration efficiency.112 This HVA 1 has been utilized in production of transgenic wheat having larger root system and improved transpiration efficiency.113 Thus, genetic variation existing for traits having direct effect on WUE should be exploited and exhaustive research to determine the traits and genes influencing WUE both under well irrigated as well as water limited conditions is needed.
Heat tolerant related morpho–physiological traits
High temperature is the major factor that limits growth and development in transitional and warm climatic regions. High summer temperature ranging from 35°C to 40°C could restrain growth, inhibit photosynthesis, and several physio–morphological features, which might be much more detrimental a stress in the future, as the global temperature is rising on an average by 1–4.5°C over the next 50years. The development of improved heat tolerant cultivars is now necessity under the crucial circumstances for mitigation of heat stress damage. Consequently, genetic variability could be evaluated by both phenotypic characters like morpho–agronomic traits, physiological traits besides molecular data. Phenotypic characters are useful tools for a preliminary assessment because they could rapidly insight into the range of diversity.114 Despite these, molecular markers significantly reveal natural germplasm diversity of crops. Further, the markers could directly characterize the genome of organism. The microsatellites or simple sequence repeats (SSRs) are now favoured at length for diversity analysis due to their simplicity, repeatability, and high polymorphism levels115–120 among the various PCR–based markers available for genetic characterization. Molecular markers detected the entire genome as a substitute of only the regions responsible for the manifestation of the traits of interest.121 Therefore, to classify plant genotypes in evaluation and utilization of genetic resources, genetic diversity and pre–breeding programs, molecular markers would be integrated with phenotypic characters.122 Evaluation of genetic variation by the morpho–physiological characterizations in response to heat stress and by comparing and integrating the matrices of the heat tolerant–related morpho–physiological data and molecular data are thus initiated to measure genetic diversity of plants. The heat tolerant–related morpho–physiological traits are growth rate (GR), evapotranspiration rate (ET), survival rate (SR), and leaf chlorophyll content (CHL) followed by DNA isolation and SSR analysis.123 The Power Marker program, which is a comprehensive set of statistical methods for genetic marker data analysis, is used to measure polymorphic information content (PIC) and gene diversity.124
Even though the QTL approaches have not been used in breeding for heat tolerance on a large basis, some QTLs have been identified in crop species that may be applicable. Frova and Sari–Gorla (1994) identified QTLs controlling pollen germination and pollen tube growth in maize and Yang et al. 2002 identified QTLs related to grain–filling duration on the short arms of chromosomes 1B and 5A in wheat.
Molecular mapping and breeding of physiological traits 201Copyright:
©2016 Nishant et al.
Citation: Nishant BA, Singh MN, Srivastava K, et al. Molecular mapping and breeding of physiological traits. Adv Plants Agric Res. 2016;3(6):193‒206. DOI: 10.15406/apar.2016.03.00120
Recent studies have shown that heat tolerance is under relatively simple control125–128 and hence few QTL analyses have been completed and molecular markers have yet to be developed for marker–assisted selection (MAS). Using Genotype–by–Sequencing (GBS) approach SNP markers can be developed which can used for mapping traits in diverse species. Utilizing GBS approach, one of the first linkage maps in wheat using genotype by sequencing SNP (GBS–SNP) markers to extreme response to post anthesis heat stress conditions comprising of 972 molecular markers (538 Bin, 258 AFLPs, 175 SSRs, and an EST) has been reported. Five QTL region identified through composite interval mapping showed significant association with response to heat stress. Regions of 7A, 2B and 1D chromosomes were found associated with plasma membrane damage; 6A, 7A, 1B with Spad chlorophyll content; and 6A, 7A and 1D with thylakoid membrane damage.129 The identified QTLs can be used for marker assisted breeding program in wheat for improved heat tolerance. In rice, QTL qHTSF4.1 showing consistent performance across different genetic backgrounds has been identified which could be used as an important source for enhancing heat tolerance in rice at flowering stage.130
Certain techniques for identification of putative molecular markers associated with root traits
Drought–adapted plants are often characterized by deep and vigorous root systems, since root associated traits play a crucial role in maintaining canopy hydraulic conductance with high carbon assimilation in drought.131,132 Such studies provide more detailed information of root and associated physiological traits relationships under drought and identification of markers linked to such traits with the limited polymorphic markers by employing Single Marker Analysis (SMA). QTL maps could be used for long–term, drought breeding. Some of the techniques have been detailed to identify the markers linked to root and associated physiological traits.
Phenotypic analysisThe moisture regime of 70% field capacity (FC) is imposed for
seedlings establishment in carbonized rubber containers. Gravimetric approach is followed to maintain 70% FC, where potted plants were daily weighed to add water which is evapotranspired.133 The observations are recorded during treatment period, cumulative water is added, evaporation, evapotranspiration are recorded. After the treatment period, root traits such as root length (cm), number of secondary roots, root dry weight (g/plant), shoot dry weight (g/plant), and root to shoot ratio are recorded. Besides, morphological, gravimetric, and gas exchange parameters were also recoded.134
Genomic DNA extractionLeaves are frozen in liquid nitrogen and stored at −80°C. DNA
is extracted from frozen leaves using cetyltrimethyl ammonium bromide (CTAB) method.135 For the CTAB technique, 900µL of CTAB extraction buffer is added to lyophilized leaf tissue in 2mL Eppendorf tubes and then lightly vortexed. The tubes are placed in hot water bath (65°C) for 45min and mixed with 400µL of chloroform: isoamylalcohol (24:1) and centrifuged for 15min.The aqueous layer is collected, and 800µL of isopropanol is added to precipitate the nucleic acids. Nucleic acid pellets are washed with 400µL of 70% ethanol, dried, and resuspended in 100 µL of Tris–EDTA buffer (10mM Tris with pH 7.5 and 0.5mM EDTA).
Polymerase Chain Reaction (PCR)RAPD (Random Amplified Polymorphic DNA, Operon
Technologies) primers are used to genotype mapping population. Polymerase chain reaction is carried out in 15µL reaction containing 1x buffer, 2mM dNTPs, 2.5mM MgCl2, 5µM primer, and 1U Taq DNA polymerase (NEB). Amplification is performed with the following thermal cycle profile:940C/4min hot start denaturation, followed by 35 cycles of 940C for 1min, primer annealing at 380C for 1min, extension at 720C for 2min, and a final extension at 720C for 8min. The PCR is performed using Eppendorf thermocycler (Eppendorf, Hamburg, Germany). The PCR products are run on 1.5% agarose gel at 90 volts for 1h 30min and amplified fragments are documented using Hero Lab Gel Documentation system (Inkarp). SSR (simple sequence repeats) primers for polymerase chain reaction are synthesized based on the information available in plant genome database. PCR amplification is carried out with 15µL reaction mixture having 50ng DNA, 1x PCR buffer, 100µM dNTPs, 250µM primers, and 1 unit Taq polymerase enzyme (NEB). Amplification is performed with the following thermal cycle profile: 950C for 5min, followed by 35 cycles of polymerization reaction, each consisting of denaturation at 940C for 15s, annealing at 600C for 45s, and an extension step at 720C for 1min. A final extension step is run for 5min at 720C. The PCR is performed using Eppendorf thermocycler (Eppendorf, Hamburg, Germany). The PCR products are run on 6% polyacrylamide denaturing gels. Amplified fragments are detected using a silver–staining procedure (Promega, Madison, WI, USA).
Study of parental polymorphismThe contrasting parents for root traits are screened with 320 RAPD
and 55 SSR markers. The polymorphic RAPD bands are visually scored for the presence or absence and in SSR analysis the segregating band from the female parent, male parent and heterozygous individuals of F1 mapping population. The binary data is used for further statistical analysis. Based on the segregation of RAPD markers in the mapping population, the putative genotypic interpretation of the parents for the marker locus is made and the Chi–square test is performed (http://www.physics.csbsju.edu/stats/chi–square form.html).
Association of identified polymorphic markers with physiological traits
Single point analysis17,136 for detecting the association of molecular markers with complex physiological and morphological traits is done using SAS software. To find the amount of variability explained by these markers, regression (𝑅2) values are worked out by one–way analysis of variance (ANOVA), by general linear model (GLM) procedure. In this analysis, different traits are treated as dependent variable and the various molecular markers as independent variables. A total of 30 different physiological and morphological traits are used to associate with the 85 polymorphic molecular markers.137
ConclusionThere are dissimilar types of markers, viz., morphological,
biochemical and DNA. The molecular markers utilizations are based on DNA polymorphism. These DNA based markers are differentiated into hybridization based (RFLP) and PCR based markers (RAPD, AFLP, SSR, SNP, EST etc.) and amongst others, the microsatellite DNA marker has been now most widely used due to its easy use by simple PCR. Molecular markers in preponderance have been developed either from genomic DNA libraries (e.g. RFLPs and
Molecular mapping and breeding of physiological traits 202Copyright:
©2016 Nishant et al.
Citation: Nishant BA, Singh MN, Srivastava K, et al. Molecular mapping and breeding of physiological traits. Adv Plants Agric Res. 2016;3(6):193‒206. DOI: 10.15406/apar.2016.03.00120
SSRs) or from random PCR amplification of genomic DNA (e.g. RAPDs) or both (e.g. AFLPs) and can prove to be very practical for a multiplicity of purposes pertinent to crop improvement. In plant breeding programme, phenotypic and molecular markers can prove to be equally important. Crop models require detailed information which takes into account genetic relationships among traits and QTLs. Physiological models are needed to be created to define new ideotypes and to draw breeders’ attention to appropriate targets for selection. As abiotic stress tolerance is a multi–genic trait, the identification of robust marker gene(s) conferring the traits related to enhanced tolerance might prove to be elusive. The focus of research should be given on dissecting traits that enhance adaptation to stress conditions. QTL mapping or gene discovery through linkage and association mapping, QTL cloning, candidate gene identification, functional genomics along with transcriptomics, can be used to understand crop responses to different physiological traits. Dissecting complex phenotypes into their constituting QTLs will offer a more direct access to hit valuable genetic diversity regulating the adaptive response to stress conditions (drought, salinity etc.). Candidate genes can be identified through positioning consensus QTLs with more precision through meta–QTL analysis.
Since genetic variations exist in crop plants for most of the respective traits, more research is needed to determine their relative influence on TE under well–watered as well as water–limited conditions. Genetic variation in photosynthetic efficiency and transpiration will drive research to identify mechanisms and genes controlling WUE expecting rapidity in breeding efforts. Moreover, research is needed to demonstrate that improvements in TE will improve yields in different environments. This also necessitates studies crop–wise for identifying genetic material with high water use efficiency; developing diagnostic tools for more efficient incorporation of these traits into sorghum hybrids targeted for water–limited cropping systems and taking measurements of photosynthetic and transpiration rate (gas–exchange) under dryland environment. All the more, there is a wider acceptance of products generated through molecular breeding and Targeted Induced Local Lesions in Genome (TILLING) than the application of genetic engineering approach because of the high–priced regulatory process and negative public perceptions of bio safety limit.
QTLs are now known to involve in natural variation in flowering time and clearly demonstrated that a limited number of loci [Hd1, Hd2, Hd6, RFT1, Ghd7, DTH8 (Ghd8:Hd5), and Hd16] explaining a large part of the varietal differences in flowering time.53 Consequences indicate that a large portion of the phenotypic variation in heading date and day–length response can be generated by combinations of different alleles at these loci. The identification and introgression of major–effect QTLs for grain yield under reproductive–stage drought stress in drought–susceptible rice varieties have been suggested as an appropriate MAB strategy. Drought–adaptive traits for strategic trait–based crossing have been found helpful for accumulating complementary PTs in selected progeny. However, the challenge is to identify QTLs of major effect that are independent of genetic background, not affected by the genotype–by–environment interaction, and to devise more effective breeding approaches for the application of the resultant markers.
It is highly suggestible to measure water use or ET for the whole growing season. One of the problems associated with the measurement
of WUE in the field is that water use or ET includes water loss by soil evaporation as well as transpiration by the crop so that changes in WUE may reflect changes in soil evaporation rather than changes in plant production/transpiration. Pubescence as a trait may be beneficial in the drier climates expected for the future because greater atmospheric CO2 due to climate change will increase the gradient for CO2 diffusion into the leaf. Conversely, the development of improved heat tolerant cultivars would be a key way in alleviation of heat stress damage. In breeding protocols, availability of information about genetic diversity among parental materials with relevant selective traits would improve the development of high stress tolerant cultivars. This also calls for identifying heat tolerance and sensitive accessions with distant groups for breeding prominent heat tolerant cultivars.138–142
Deep and vigorous root systems are often characterized in drought–adapted plants, since root associated traits play a crucial role in maintaining canopy hydraulic conductance with high carbon assimilation in drought. Hence, certain techniques foridentification of putative molecular markers associated with root traits are also important, viz., phenotypic analysis, genomic DNA extraction, polymerase chain reaction (PCR), study of parental polymorphism, association of identified polymorphic markers with physiological traits and so on. Therefore, specific types of markers make their importance in understanding the genomic variability and the diversity between the same as well as different species of the plants. Genetic mapping through molecular markers is necessary not only for the reliable detection, mapping and estimation of gene effects of important agronomic traits, but also for further research on the structure, organization, evolution and function of the plant genome.
AcknowledgementsNone.
Conflict of interestThe author declares no conflict of interest.
References1. Mishra KK, Fougat RS, Ballani A, et al. Potential and application of
molecular markers techniques for plant genome analysis. Int J Pure App Biosci. 2014;2(1):169–188.
2. Toker C, Canci H, Yildirim T. Evaluation of perennial wild Cicer species for drought resistance. Genet Resour Crop Evol. 2007;54(8):1781–1786.
3. Collins NC, Tardieu F, Tuberosa R. Quantitative trait loci and crop performance under abiotic stress:Where do we stand? Plant Physiol. 2008;147(2):469–486.
4. Reynolds MP, Ortiz R. Adapting crops to climate change: a summary. In: Reynolds MP editor. Climate change and crop production, UK: CAB international; 2010. p 1–8.
5. Duvick DN. The contribution of breeding to yield advances in maize (Zea mays L.). Advances in Agronomy. 2005;86:83–145.
6. Tardieu F and Tuberosa R. Dissection and modelling of abiotic stress tolerance in plants. Curr Opin Plant Biol. 2010;13(2):206–212.
7. Reynolds MP, Trethowan RM. Physiological interventions in breeding for adaptation to abiotic stress. In: Spiertz JHJ, et al. editors. Scale and complexity in plant systems research, gene–plant–crop relations. Wageningen UR frontis series; 2007. p. 129–146.
Molecular mapping and breeding of physiological traits 203Copyright:
©2016 Nishant et al.
Citation: Nishant BA, Singh MN, Srivastava K, et al. Molecular mapping and breeding of physiological traits. Adv Plants Agric Res. 2016;3(6):193‒206. DOI: 10.15406/apar.2016.03.00120
8. Metzker M. Sequencing technologies–the next generation. Nat Rev Genet. 2010;11(1):31–46.
9. Reynolds MP. Physiological approaches to wheat breeding. In: Curtis BC, et al. editors. Bread wheat. FAO Plant production and protection series; 2002. 30 p.
10. Mir RR, Zaman–Allah M, Sreenivasulu N, et al. Integrated genomics, physiology and breeding approaches for improving drought tolerance in crops. Theor Appl Genet. 2012;125(4):625–645.
11. Heinz DJ. Sugarcane improvement through breeding. Amsterdam, USA: Elsevier; 1987.
12. Ribaut JM, Hoisington D. Marker–assisted selection:New tools and strategies. Trends Plant Sci. 1998;3(6):236–239.
13. Rafalski J, Tingey S. Genetic diagnostics in Plant Breed:RAPDs, microsatellites and machines. Trends Genet. 1993;9(8):275–280.
14. Joshi SP, Prabhakar K, Ranjekar PK, et al. Molecular markers in plant genome analysis. 2011. p 1–19.
15. Kumar P, Gupta VK, Misra AK, et al. Potential of Molecular Markers in Plant Biotechnology. Plant Omics Journal. 2009;2(4):141–162.
16. Graham J, Smith K, Tierney I, et al. Mapping gene H and association with resistance to cane botrytis and spur blight, rust and cane spot. Theor Appl Genet. 2006;112(5):818–831.
17. Tanksley SD. Mapping polygenes. Annu Rev Genet. 1993;27:205–233.
18. Semagn K, Bjørnstad Å, Xu Y. The genetic dissection of quantitative traits in crops. Electronic Journal of Biotechnology. 2010;13(5).
19. Chamarthi SK, Kumar A, Vuong T, et al. Trait mapping and molecular Breeding in legumes: concepts and examples in soybean, common bean and chickpea. In: Pratap A, editors. Biology and breeding of food legumes. Oxfordshire, UK: CABI International; 2011.
20. Liu B. Statistical Genomics: Linkage. Mapping and QTL Analysis CRC Press, Boca Raton; 1998. 648 p.
21. Lander E, Botstein D. Mapping Mendelian factors underlying quantitative traits using RFLP linkage maps. Genetics. 1989;121(1):185–199.
22. Gupta PK, Kumar J, Mir RR, et al. Marker assisted selection as a component of conventional plant breeding. Plant Breed Rev. 2010;33:145–217.
23. Eathington SR, Crosbie TM, Edwards MD, et al. Molecular markers in a commercial breeding program. Crop Sci. 2007;47:S154–S163.
24. Ribaut JM, Ragot M. Marker–assisted selection to improve drought adaptation in maize:the backcross approach, perspectives, limitations, and alternatives. J Exp Bot. 2007;58(8):351–360.
25. Bernardo R. Molecular markers and selection for complex traits in plants:learning from the last 20years. Crop Sci. 2008;48:1649–1664.
26. Teng S, Qian Q, Zeng D, et al. QTL analysis of leaf photosynthetic rate and related physiological traits in rice (Oryza sativaL.). Euphytica. 2004;135(1):1–7.
27. Jompur C, Fracheboud Y, Stamp P, et al. Mapping of quantitative trait loci associated with chilling tolerance in maize (Zea mays L.) seedlings grown under field conditions. J Exp Bot. 2005;56(414):1153–1163.
28. Barber SA, Mackay AD. Sensitivity analysis of the parameters of a mechanistic mathematical model affected by changing soil moisture. Agron J. 1985;77(4):528–531.
29. Mackay AD, Barber SA. Soil moisture effect on potassium uptake by corn. Agron J. 1985;77(2):524–527.
30. Brouder SM, Volenec JJ. Impact of climate change on crop nutrient and water use efficiencies. Physiol Plant. 2008;133:705–724.
31. Yadav R, Courtois B, Huang N, et al. Mapping genes controlling root morphology and root distribution in a doubled–haploid population of rice. Theor Appl Genet. 1997;94(5):619–632.
32. Shen L, Courtois B, McNally KL, et al. Evaluation of near isogenic lines of rice introgressed with QTLs for root depth through marker assisted selection. Theor Appl Genet. 2001;103:75–83.
33. Horii H, Nemoto K, Miyamoto N, et al. Quantitative trait loci for adventitious and lateral roots in rice. Plant Breed. 2006;125(2):198–200.
34. Jefferies SP, Pallotta MA, Paull JG, et al. Mapping and validation of chromosome regions conferring boron toxicity tolerance in wheat (Triticum aestivum). Theor Appl Genet. 2000;101(5):767–777.
35. An D, Su J, Liu Q, et al. Mapping QTLs for nitrogen uptake in relation to the early growth of wheat (Triticum aestivum L.). Plant Soil. 2006;284(1):73–84.
36. Liao H, Yan X, Rubio G, et al. Genetic mapping of basal root gravitropism and phosphorus acquisition efficiency in common bean. Funct Plant Biol. 2004;31:959–970.
37. Beebe SE, Rojas–Pierce M, Yan X, et al. Quantitative trait loci for root architecture traits correlated with phosphorus acquisition in common bean. Crop Sci. 2006;46:413–423.
38. Ochoa IE, Blair MW, Lynch JP. QTL analysis of adventitious root formation in common bean under contrasting phosphorus availability. Crop Sci. 2006;46(4):1609–1621.
39. Cichy KA, Blair MW, Galeano Mendoza CH, et al. QTL analysis or root architecture traits and low phosphorus tolerance in an Andean bean population. Crop Sci. 2009;49:49–68.
40. Hammond JP, Broadley MR, White PJ, et al. Shoot yield drives phosphorus use efficiency in Brassica oleracea and correlates with root architecture traits. J Exp Bot. 2009;60(7):1953–1968.
41. Zhang D, Cheng H, Geng L, et al. Detection of quantitative trait loci for phosphorus deficiency tolerance at soybean seedling stage. Euphytica. 2009;167(3):313–322.
42. Liang Q, Cheng X, Mei M, et al. QTL analysis of root traits as related to phosphorus efficiency in soybean. Ann Bot. 2010;106(1):223–234.
43. Yang M, Ding G, Shi L, et al. Quantitative trait loci for root morphology in response to low phosphorus stress in Brassica napus. Theor Appl Genet. 2010;121(1):181–193.
44. Yang M, Ding G, Shi L, et al. Detection of QTL for phosphorus efficiency at vegetative stage in Brassica napus. Plant Soil. 2011;339(1):97–111.
45. Wissuwa M, Yano M, Ae N. Mapping of QTLs for phosphorus–deficiency tolerance in rice (Oryza sativa L.). Theor Appl Genet. 1998;97(5):777–783.
46. Chin JH, Gamuyao R, Dalid C, et al. Developing rice with high yield under phosphorus deficiency:Pup1 sequence to application. Plant Physiol. 2011;156(3):1202–1216.
47. Chin JH, Lu XC, Haefele SM, et al. Development and application of gene–based markers for the major rice QTL Phosphorus uptake 1. Theor Appl Genet. 2010;120(6):1073–1086.
48. Laurie DA, Pratchett N, Bezant JH, et al. RFLP mapping of five major genes and eight quantitative trait loci controlling flowering time in a winter × spring barley (Hordeum vulgare L.) cross. Genome. 1995;38(3):575–585.
Molecular mapping and breeding of physiological traits 204Copyright:
©2016 Nishant et al.
Citation: Nishant BA, Singh MN, Srivastava K, et al. Molecular mapping and breeding of physiological traits. Adv Plants Agric Res. 2016;3(6):193‒206. DOI: 10.15406/apar.2016.03.00120
49. Burn JE, Bagnall DJ, Metzger JM, et al. DNA methylation, vernalization, and the initiation of flowering. Proc Natl Acad Sci U S A. 1993;90(1):287–291.
50. Izawa T. Adaptation of flowering–time by natural and artificial selection in Arabidopsis and rice. J Exp Bot. 2007;58(12):3091–3097.
51. Tsuji H, Taoka KI, Shimamoto K. Regulation of flowering in rice:two florigen genes, a complex gene network, and natural variation. Curr Opin Plant Biol. 2011;14(1):45–52.
52. Hayama R, Izawa T, Shimamoto K. Isolation of rice genes possibly involved in the photoperiodic control of flowering by a fluorescent differential display method. Plant Cell Physiol. 2002;43(5):494–504.
53. Ebana K, Shibaya T, Wu J, et al. Uncovering of major genetic factors generating naturally occurring variation in heading date among Asian rice cultivars. Theor Appl Genet. 2011;122(6):1199–1210.
54. Shibaya T, Nonoue Y, Ono N, et al. Genetic interactions involved in the inhibition of heading by heading date QTL, Hd2 in rice under long–day conditions. Theor Appl Genet. 2011;123(7):1133–1143.
55. Colasanti J, Yuan Z, Sundaresan V. The indeterminate gene encodes a zinc finger protein and regulates a leaf–generated signal required for the transition to flowering in maize. Cell. 1998;93(4):593–603.
56. Muszynski MG, Dam T, Li B, et al. Delayed flowering 1 encodes a basic leucine zipper protein that mediates floral inductive signals at the shoot apex in maize. Plant Physiol. 2006;142(4):1523–1536.
57. Salvi S, Sponza G, Morgante M, et al. The molecular basis of vernalization: the central role of FLOWERING LOCUS C (FLC). Proc Natl Acad Sci USA. 2000;97(7):3753–3758.
58. Worland AJ. The influence of flowering time genes on environmental adaptability in European wheat. Euphytica. 1996;9(1):49–57.
59. Cockram J, Jones H, Leigh FJ, et al. Control of flowering time in temperate cereals:genes, domestication, and sustainable productivity. J Exp Bot. 2007;58(6):1231–1244.
60. Turner A, Beales J, Faure S, et al. The pseudo–response regulator Ppd–H1 provides adaptation to photoperiod in barley. Science. 2005;310:1031–1034.
61. Yan L, Fu D, Li C, et al. The wheat and barley vernalization gene VRN3 is an orthologue of FT. Proc Natl Acad Sci USA. 2006;103(51):19581–19586.
62. Hemming MN, Peacock WJ, Dennis ES, et al. Low–temperature and day length cues are integrated to regulate FLOWERING LOCUS T, in barley. Plant Physiol. 2008;147(1):355–366.
63. Michaels SD, Amasino RM. FLOWERING LOCUS C encodes a novel MADS domain protein that acts as a repressor of flowering. Plant Cell. 1999;11(15):949–956.
64. Sheldon CC, Burn JE, Perez PP, et al. The FLF MADS Box Gene. A repressor of flowering in Arabidopsis regulated by vernalization and methylation. Plant Cell. 1999;11(3):445–458.
65. Lee H, Suh SS, Park E, et al. The AGAMOUS–LIKE 20 MADS domain protein integrates floral inductive pathways in Arabidopsis. Genes Dev. 2000;14(18):2366–2376.
66. Michaels SD, Himelblau E, Kim SY, et al. Integration of flowering signals in winter–annual Arabidopsis. Plant Physiol. 2005;137(1):149–156.
67. Helliwell CA, Wood CC, Robertson M, et al. The Arabidopsis FLC protein interacts directly in vivo with SOC1 and FT chromatin and is part of a high–molecular weight protein complex. Plant J. 2006;46(2):183–192.
68. Tuberosa R, Salvi S. Genomics approaches to improve drought tolerance in crops. Trends in Plant Science. 2006;11(8):405–412.
69. Shinozaki K, Yamaguchi–Shinozaki K. Gene networks involved in drought stress response and tolerance. J Exp Bot. 2007;58(2):221–227.
70. Varshney RK, Bansal KC, Aggarwal PK, et al. Agricultural biotechnology for crop improvement in a variable climate:hope or hype? Trends Plant Sci. 2011;16(7):363–371.
71. Vogel B. Marker–assisted selection:a non–invasive biotechnology alternative to genetic engineering of plant varieties. In: Erwood S, et al. editors. Smart breeding. Greenpeace International, The Netherlands; 2009. p. 4–25.
72. Farre G, Ramessar K, Twyman RM, et al. The humanitarian impact of plant biotechnology:recent breakthroughs vs bottlenecks for adoption. Curr Opin Plant Biol. 2010;13(2):219–225.
73. Barkley NA, Wang ML. Application of TILLING and EcoTILLING as reverse genetic approaches to elucidate the function of genes in plants and animals. Curr Genomics. 2008;9(4):212–226.
74. Wang FZ, Wang QB, Kwon SY, et al. Enhanced drought tolerance of transgenic rice plants expressing a pea manganese superoxide dismutase. J Plant Physiol. 2005;162(4):465–472.
75. Kamoshita A, Babu RC, Boopathi NM, et al. Phenotypic and genotypic analysis of drought–resistance traits for development of rice cultivars adapted to rain fed environments. Field Crop Res. 2008;109(1–3):1–23.
76. Bernier J, Kumar A, Venuprasad R, et al. A large–effect QTL for grain yield under reproductive–stage drought stress in upland rice. Crop Sci. 2007;47(2):507–516.
77. Venuprasad R, Dalid CO, Del Valle M, et al. Identification and characterization of large effect quantitative trait loci for grain yield under lowland drought stress in rice using bulk–segregant analysis. Theor Appl Genet. 2009;120:177–190.
78. Ghimire KH, Quiatchon LA, Vikram P, et al. A large–effect drought grain yield QTL from Indian landrace in background of rice mega–varieties. Field Crop Res. 2011;131:88–96.
79. Vikram P, Swamy BPM, Dixit S, et al. qDTY1.1, a major QTL for rice grain yield under reproductive–stage drought stress with a consistent effect in multiple elite genetic backgrounds. BMC Genet. 2011;12:89.
80. Swamy BPM, Ahmed HU, Henry A, et al. Genetic, physiological, and gene expression analyses reveal multiple QTL enhance the yield of rice mega–variety IR64 under drought. PLOS One. 2013;8(5):e62795.
81. Sellamuthu R, Liu GF, Chandra Babu R, et al. Genetic analysis and validation of quantitative trait loci associated with reproductive–growth traits and grain yield under drought stress in a doubled haploid line population of rice (Oryza sativa L.). Field Crops Research. 2011;124(1):46–58.
82. Hu HH, Dai MQ, Yao JL, et al. Overexpressing a NAM, ATAF, and CUC (NAC) transcription factor enhances drought resistance and salt tolerance in rice. Proc Natl Acad Sci USA. 2006;103(35):12987–12992.
83. Takahashi T, Kakehi JI. Polyamines:Ubiquitous polycations with unique roles in growth and stress responses. Ann Bot. 2010;105(1):1–6.
84. Nakashima K, Yamaguchi–Shinozaki K, Shinozaki K. The transcriptional regulatory network in the drought response and its crosstalk in abiotic stress responses including drought, cold, and heat. Front Plant Sci. 2014;5:170.
85. Oh SJ, Song SI, Kim YS, et al. Arabidopsis CBF3/DREB1A and ABF3 in transgenic rice increased tolerance to abiotic stress without stunting growth. Plant Physiol. 2005;138(1):341–351.
86. Ito Y, Katsura K, Maruyama K, et al. Functional analysis of rice DREB1/CBF–type transcription factors involved in cold–responsive gene expression in transgenic rice. Plant Cell Physiol. 2006;47(1):141–153.
87. Datta K, Baisakh N, Ganguly M, et al. Overexpression of Arabidopsis
Molecular mapping and breeding of physiological traits 205Copyright:
©2016 Nishant et al.
Citation: Nishant BA, Singh MN, Srivastava K, et al. Molecular mapping and breeding of physiological traits. Adv Plants Agric Res. 2016;3(6):193‒206. DOI: 10.15406/apar.2016.03.00120
and rice stress genes inducible transcription factor confers drought and salinity tolerance to rice. Plant Biotechnol J. 2012;10(5):579–586.
88. Ortiz R, Iwanaga M, Reynolds MP, et al. Overview on crop genetic engineering for drought–prone environments. J Semi–Arid Trop Agric Res. 2007;4(1):1–30.
89. Malosetti M, Ribaut JM, Vargas M, et al. Multitrait multienvironment QTL modelling for drought–stress adaptation in maize. In:Spiertz JHC, et al. editors. Scale and complexity in plant systems research: gene–plant–crop relations. Dordrecht, Netherlands: Springer; 2007. p. 25–36.
90. Reynolds MP, Trethowan RM. Physiological interventions in breeding for adaptation to abiotic stress. In: Spiertz JHJ, et al. editors. Scale and complexity in plant systems research, gene–plant–crop relations. Wageningen UR frontis series; 2007. p. 129–146.
91. Reynolds MP, Manes Y, Izanloo A, et al. Phenotyping approaches for physiological breeding and gene discovery in wheat. Ann Appl Biol. 2009;155(3):309–320.
92. Araus JL, Slafer GA, Royo C, et al. Breeding for yield potential and stress adaptation in cereals. Crit Rev Plant Sci. 2008;27:377–412.
93. Passioura JB, Angus JF. Improving productivity of crops in water–limited environments. Advances in Agronomy. 2010;106:37–75.
94. Howell TA. Enhancing water use efficiency in irrigated agriculture. Agron J. 2001;93(2):281–289.
95. Barbour M, Warren C, Farquhar G, et al. Variability in mesophyll conductance between barley genotypes, and effects on transpiration efficiency and carbon isotope discrimination. Plant Cell Environ. 2010;33(7):1176–1185.
96. Galme s J, Conesa MA, Ochogavı a JM, et al. Physiological and morphological adaptations in relation to water use efficiency in Mediterranean accessions of Solanum lycopersicum. Plant Cell Environ. 2010;34(2):245–260.
97. Blum A. Drought resistance, water–use efficiency, and yield potential–are they compatible, dissonant, or mutually exclusive? Aust J Agric Res. 2005;56:1159–1168.
98. Blum A. Effective use of water (EUW) and not water–use efficiency (WUE) is the target of crop yield improvement under drought stress. Field Crops Res. 2009;112(2–3):119–123.
99. Impa SM, Nadaradjan SE, Boominathan P, et al. Carbon isotope discrimination accurately reflects variability in WUE measured at a whole plant level in rice. Crop Sci. 2005;45(6):2517–2522.
100. Zhao XQ, Xu JL, Zhao M, et al. QTLs affecting morph–physiological traits related to drought tolerance detected in overlapping introgression lines of rice (Oryza sativa L.). Plant Science. 2008;174(6):618–625.
101. Xu Y, This D, Pausch RC, et al. Leaf–level water use efficiency determined by carbon isotope discrimination in rice seedlings:Genetic variation associated with population structure and QTL mapping. Theor Appl Genet. 2009;118(6):1065–1081.
102. Bharathan G, Goliber TE, Moore C, et al. Homologies in leaf form inferred from KNOX1 gene expression during development. Science. 2002;296(5574):1858–1860.
103. Kimura S, Koenig D, Kang J, et al. Natural variation in leaf morphology results from mutation of a novel KNOX gene. Curr Biol. 2008;18(9):672–677.
104. Garvin DF, Gu YQ, Hasterok R, et al. Development of genetic and genomic research resources for Brachypodiumdistachyon, a new model system for grass crop research. Crop Sci. 2008;48(suppl 1):S69–S84.
105. Masle J, Farquhar GD, Gilmore SR. Method of producing plants having enhanced transpiration efficiency and plants produced there from. International application, Patent Cooperation Treaty, WO 2004/005555 A1; 2004.
106. Yoo CY, Pence HE, Jin JB, et al. The Arabidopsis GTL1 transcription factor regulates water use efficiency and drought tolerance by modulating stomatal density via transrepression of SDD1. Plant Cell. 2010;22(12):4128–4141.
107. Karaba A, Dixit S, Greco R, et al. Improvement of water use efficiency in rice by expression of HARDY, an Arabidopsis drought and salt tolerance gene. Proc Natl Acad Sci USA. 2007;104(39):15270–15275.
108. Li X, Cheng X, Liu J, et al. Heterologous expression of the Arabidopsis DREB1A/CBF3 gene enhances drought and freezing tolerance of transgenic Lolium perenne plants. Plant Biotechnol Rep. 2011;5(1):61–69.
109. Bhatnagar–Mathur P, Devi MH, Reddy DS, et al. Stress–inducible expression of AtDREB1A in transgenic peanut (Arachis hypogaea L.) increases transpiration efficiency under water–limiting conditions. Plant Cell Rep. 2007;26(12):2071–2082.
110. Zhang X, Wollenweber B, Jiang D, et al. Water deficits and heat shock effects on photosynthesis of a transgenic Arabidopsis thaliana constitutively expressing ABP9, a bZIP transcription factor. J Exp Bot. 2008;59(4):839–848.
111. Lugan R, Niogret MF, Kervazo L, et al. Metabolome and water status phenotyping of Arabidopsis under abiotic stress cues reveals new insight into ESK1 function. Plant Cell Environ. 2009;32(2):95–108.
112. Sivamani E, Bahieldin A, Wraith JM, et al. Improved biomass productivity and water use efficiency under water deficit conditions in transgenic wheat constitutively expressing the barley HVA1 gene. Plant Sci. 2000;155(1):1–9.
113. Bahieldin A, Hesham HT, Eissa HF, et al. Field evaluation of transgenic wheat plants stably expressing the HVA1 gene for drought tolerance. Physiol Plant. 2005;123:421–427.
114. Smith JSC, Smith OS. Fingerprinting crop varieties. Adv Agron. 1992;47:85–140.
115. Hand ML, Cogan NOI, Forster JW. Molecular characterisation and interpretation of genetic diversity within globally distributed germplasm collections of tall fescue (Festuca arundinacea Schreb.) and meadow fescue (F. pratensis Huds.). Theor Appl Genet. 2012;124(6):1127–1137.
116. Lauvergeat V, Barre P, Bonnet M. Sixty simple sequence repeat markers for use in the Festuca–Lolium complex of grasses. Mol Ecol Notes. 2005;5(2):401–405.
117. Momotaz A, Forster W, Yamada T. Identification of cultivars and accessions of Lolium, Festuca and Festulolium hybrids through the detection of simple sequence repeat polymorphism. Plant Breed. 2004;123(4):370–376.
118. Saha M, Cooper J, Mian M, et al. Tall fescue genomic SSR markers:development and transferability across multiple grass species. Theor Appl Genet. 2006;113(8):1449–1458.
119. Saha MC, Mian MAR, Eujayl I. Tall fescue EST–SSR markers with transferability across several grass species. Theor Appl Genet. 2004;109(4):783–791.
120. Tehrani MS, Mardi M, Sahebi J. Genetic diversity and structure among Iranian tall fescue populations based on genomic–SSR and EST–SSR marker analysis. Plant Syst Evol. 2009;282(1):57–70.
Molecular mapping and breeding of physiological traits 206Copyright:
©2016 Nishant et al.
Citation: Nishant BA, Singh MN, Srivastava K, et al. Molecular mapping and breeding of physiological traits. Adv Plants Agric Res. 2016;3(6):193‒206. DOI: 10.15406/apar.2016.03.00120
121. Franco J, Crossa J, Warburton ML, et al. Sampling strategies for conserving maize diversity when forming core subsets using genetic markers. Crop Sci. 2006;46(2):854–864.
122. Franco J, Crossa J, Ribaut JM, et al. A method for combining molecular markers and phenotypic attributes for classifying plant genotypes. Theor Appl Genet. 2001;103(6):944–952.
123. Saha MC, Mian R, Zwonitzer JC. An SSR–and AFLP–based genetic linkage map of tall fescue (Festuca arundinacea Schreb.). Theor Appl Genet. 2005;110(2):323–336.
124. Nei M. Molecular evolutionary genetics. New York: Columbia University Press; 1987. 512 p.
125. Porch TG, Dickson MH, Long MC, et al. General combining ability effects for reproductive heat tolerance in snap bean. J Agric Univ Puerto Rico. 2004;88:161–164.
126. Rainey KM, Griffiths PD. Inheritance of heat tolerance during reproductive development in snap bean (Phaseolus vulgaris L.). J Am Soc Hortic Sci. 2005;135(5):700–706.
127. Rainey KM, Griffiths PD. Diallel analysis of yield components of snap bean exposed to two temperature stress environments. Euphytica. 2005;142(1):43–53.
128. Hall AE. Breeding cowpea for future climates. In: Yadav SS, et al. editors. Crop adaptation to climate change. Chichester: Wiley–Blackwell; 2011. p. 340–355.
129. Talukder SK, Babar MA, Vijayalakshmi K, et al. Mapping QTL for the traits associated with heat tolerance in wheat (Triticum aestivum L.). BMC Genet. 2014;15:97.
130. Ye C, Tenorio FA, Argayoso MA, et al. Identifying and confirming quantitative trait loci associated with heat tolerance at flowering stage in different rice populations. BMC Genetics. 2015;16:41.
131. Sperry JS. Hydraulics of vascular water transport, in Mechanical Integration of Plant Cells and Plants, P Wojtaszek editor. volume 9 of Signaling and Communication in Plants. Berlin, Germany: Springer; 2011. p. 303–327.
132. Wasson AP, Richards RA, Chatrath R, et al. Traits and selection strategies to improve root systems and water uptake in water–limited wheat crops. J Expt Bot. 2012;63(9):3485–3498.
133. Udayakumar M, Sheshshayee MS, Nataraj KN, et al. Why has breeding for water use efficiency not been successful? An analysis and alternate approach to exploit this trait for crop improvement. Curr Sci. 1998;74(11):1000–1003.
134. Awati MG. Genetic diversity and molecular markers for root and associated physiological traits of Robusta (Coffea canephora Pierre ex. F.). Bangalore, India: University of Agricultural Sciences; 2005.
135. Williams CE, Ronald PC. PCR template–DNA isolated quickly from monocot and dicot leaves without tissue homogenization. Nucleic Acids Res. 1994;22(10):1917–1918.
136. Halward T, Stalker T, LaRue E, et al. Use of single–primer DNA amplifications in genetic studies of peanut (Arachis hypogaea L.). Plant Mol Biol. 1992;18(2):315–325.
137. SAS/STAT User’s Guide. Version 6, Cary, NC, 4th edition. USA: SAS Institute; 1989.
138. Campos H, Cooper M, Habben JE, et al. Improving drought tolerance in maize:a view from industry. Field Crops Res. 2004;90(1):19–34.
139. Frova C, Sari–Gorla M. Quantitative trait loci (QTLs) for pollen thermotolerance detetected in maize. Mol Gen Genet. 1994;245(4):424–430.
140. Hansen J, Mikiko S, Reto R, et al. Global temperature change. Proc Natl Acad Sci. 2006;103(39):14288–14293.
141. Metzker M. Sequencing technologies–the next generation. Nat Rev Genet. 2010;11(1):31–46.
142. Mir RR, Zaman–Allah M, Sreenivasulu N, et al. Integrated genomics, physiology and breeding approaches for improving drought tolerance in crops. Theor Appl Genet. 2012;125(4):625–645.