molecular markers and qtl mapping; an introduction,...
TRANSCRIPT
Molecular Markers and QTL Mapping; An Introduction, Review and
Discussion
Seth C. MurrayAssistant Professor
Quantitative Genetics and Maize Breeding
09/10/10 – TAMU Plant Breeding Roundtable
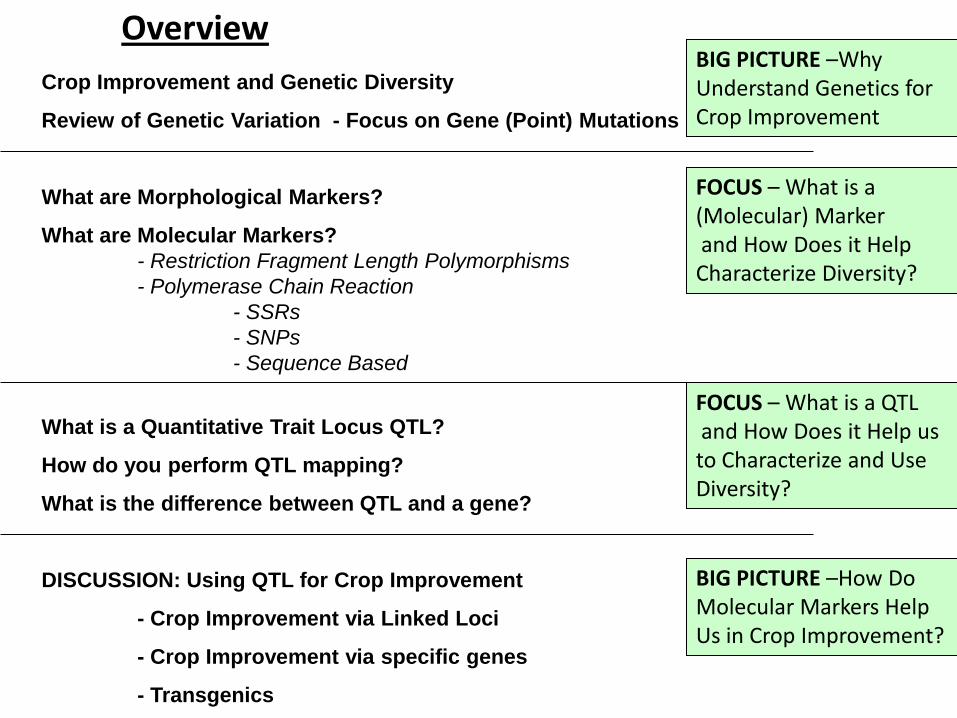
Crop Improvement and Genetic Diversity
Review of Genetic Variation - Focus on Gene (Point) Mutations
What are Morphological Markers?
What are Molecular Markers?- Restriction Fragment Length Polymorphisms- Polymerase Chain Reaction
- SSRs- SNPs - Sequence Based
What is a Quantitative Trait Locus QTL?
How do you perform QTL mapping?
What is the difference between QTL and a gene?
DISCUSSION: Using QTL for Crop Improvement
- Crop Improvement via Linked Loci
- Crop Improvement via specific genes
- Transgenics
BIG PICTURE –Why Understand Genetics for Crop Improvement
FOCUS – What is a (Molecular) Markerand How Does it Help Characterize Diversity?
BIG PICTURE –How Do Molecular Markers Help Us in Crop Improvement?
Overview
FOCUS – What is a QTLand How Does it Help us to Characterize and Use Diversity?

Where Does Genetic Variation Come From?
1. Polyploidy (changes in number of chromosomes)
2. Gene or point mutations3. Recombination4. Changes in chromosome
structure5. Transposition: mobile
genetic elements
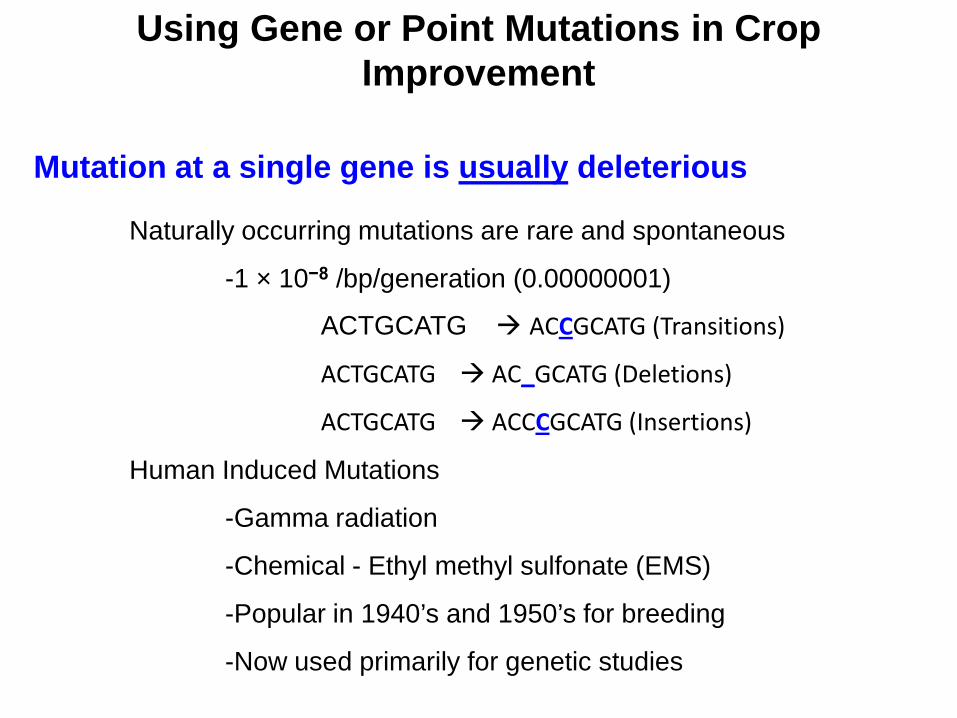
Using Gene or Point Mutations in Crop Improvement
Mutation at a single gene is usually deleterious
Naturally occurring mutations are rare and spontaneous
-1 × 10⁻⁸ /bp/generation (0.00000001)
ACTGCATG ACCGCATG (Transitions)
ACTGCATG AC_GCATG (Deletions)
ACTGCATG ACCCGCATG (Insertions)
Human Induced Mutations
-Gamma radiation
-Chemical - Ethyl methyl sulfonate (EMS)
-Popular in 1940’s and 1950’s for breeding
-Now used primarily for genetic studies
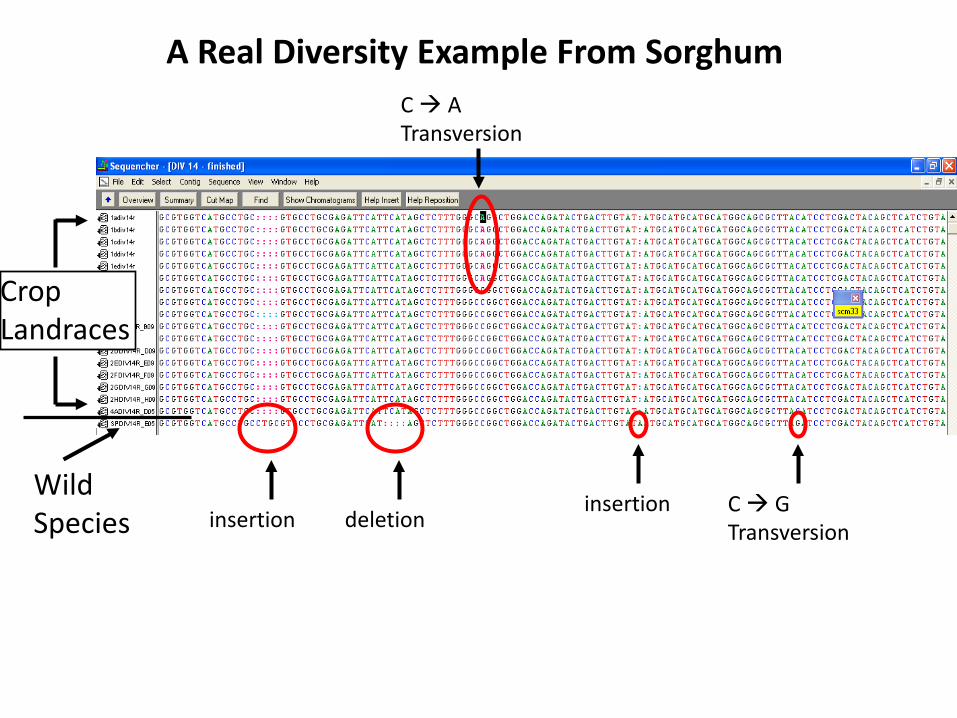
insertion deletioninsertion C G
Transversion
C A Transversion
Wild Species
Crop Landraces
A Real Diversity Example From Sorghum
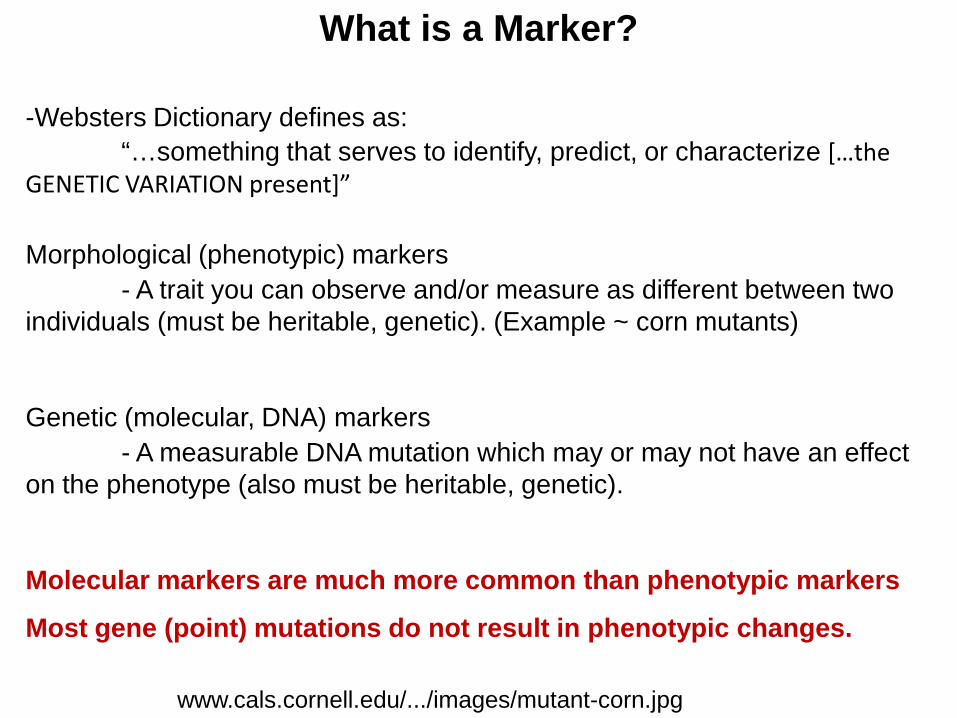
What is a Marker?
-Websters Dictionary defines as:“…something that serves to identify, predict, or characterize […the
GENETIC VARIATION present]”
Morphological (phenotypic) markers- A trait you can observe and/or measure as different between two
individuals (must be heritable, genetic). (Example ~ corn mutants)
Genetic (molecular, DNA) markers- A measurable DNA mutation which may or may not have an effect
on the phenotype (also must be heritable, genetic).
Molecular markers are much more common than phenotypic markers
Most gene (point) mutations do not result in phenotypic changes.
www.cals.cornell.edu/.../images/mutant-corn.jpg
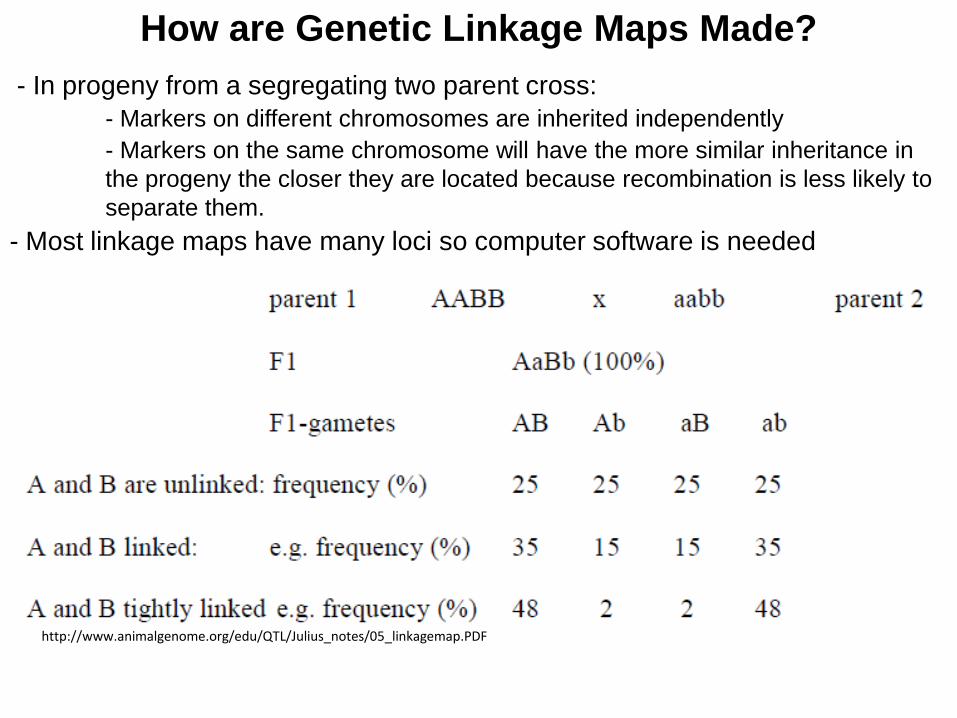
How are Genetic Linkage Maps Made?- In progeny from a segregating two parent cross:
- Markers on different chromosomes are inherited independently- Markers on the same chromosome will have the more similar inheritance in the progeny the closer they are located because recombination is less likely to separate them.
- Most linkage maps have many loci so computer software is needed
http://www.animalgenome.org/edu/QTL/Julius_notes/05_linkagemap.PDF
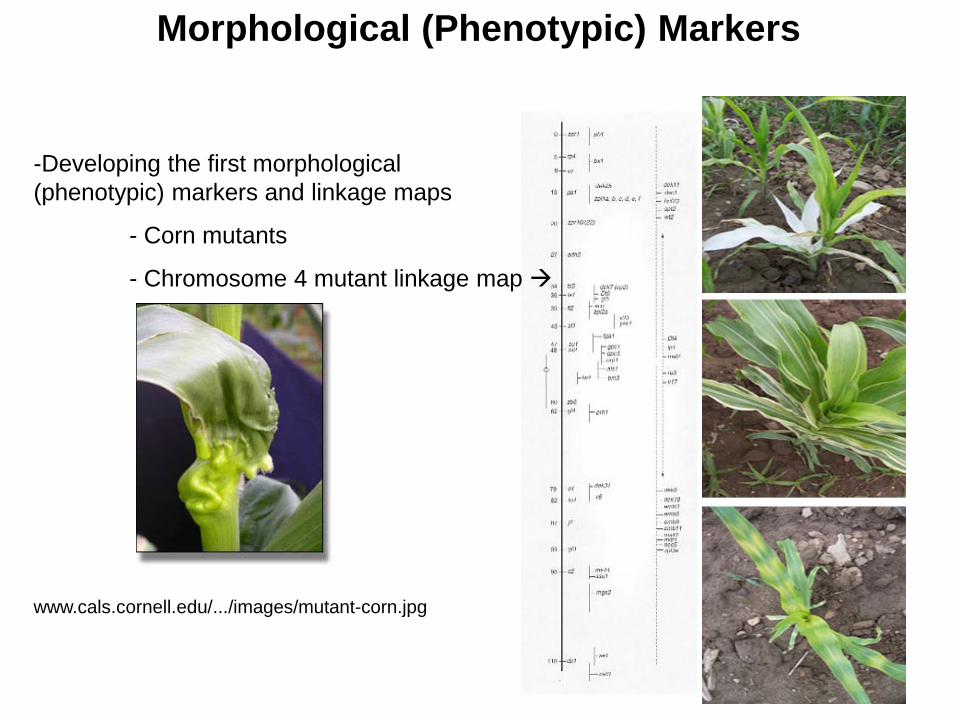
Morphological (Phenotypic) Markers
-Developing the first morphological (phenotypic) markers and linkage maps
- Corn mutants
- Chromosome 4 mutant linkage map
www.cals.cornell.edu/.../images/mutant-corn.jpg

Corn Mutant Linkage Mapping
Cornell University
Burnham
Beadle (Nobel in 1958)
Rhodes
Emerson
McClintock (Nobel Prize in 1983)
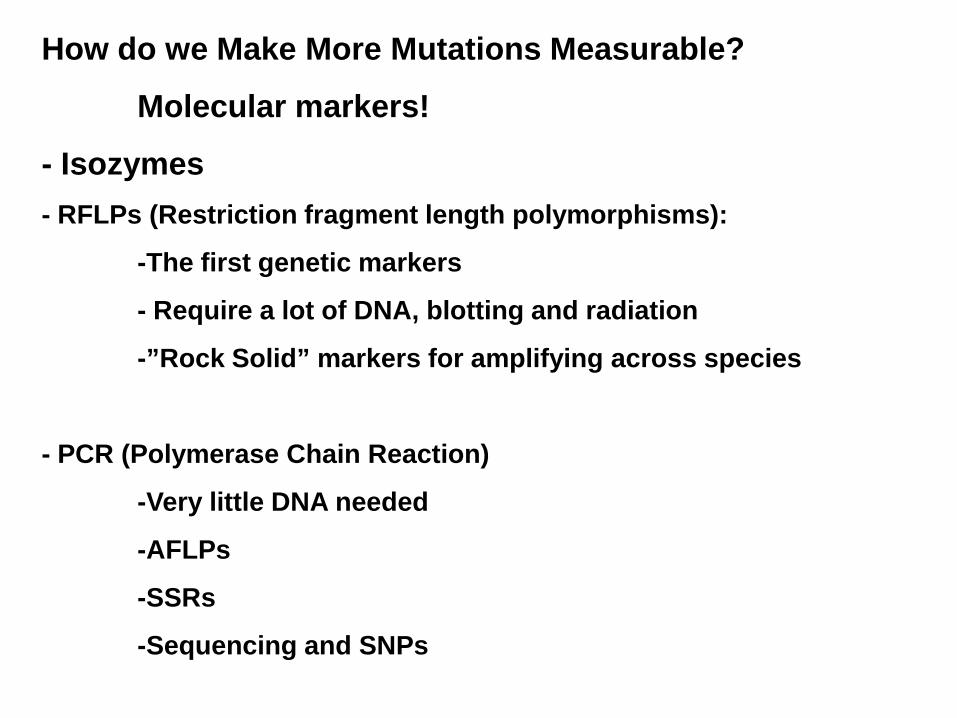
How do we Make More Mutations Measurable?
Molecular markers!
- Isozymes- RFLPs (Restriction fragment length polymorphisms):
-The first genetic markers
- Require a lot of DNA, blotting and radiation
-”Rock Solid” markers for amplifying across species
- PCR (Polymerase Chain Reaction)
-Very little DNA needed
-AFLPs
-SSRs
-Sequencing and SNPs

From Morphological Maps to Molecular Maps Example
Tomato was one of the first to use Molecular Markers (1985)
-These were integrated with known morphological markers
Morphological Markers are in RED
Molecular Markers are in BLUE
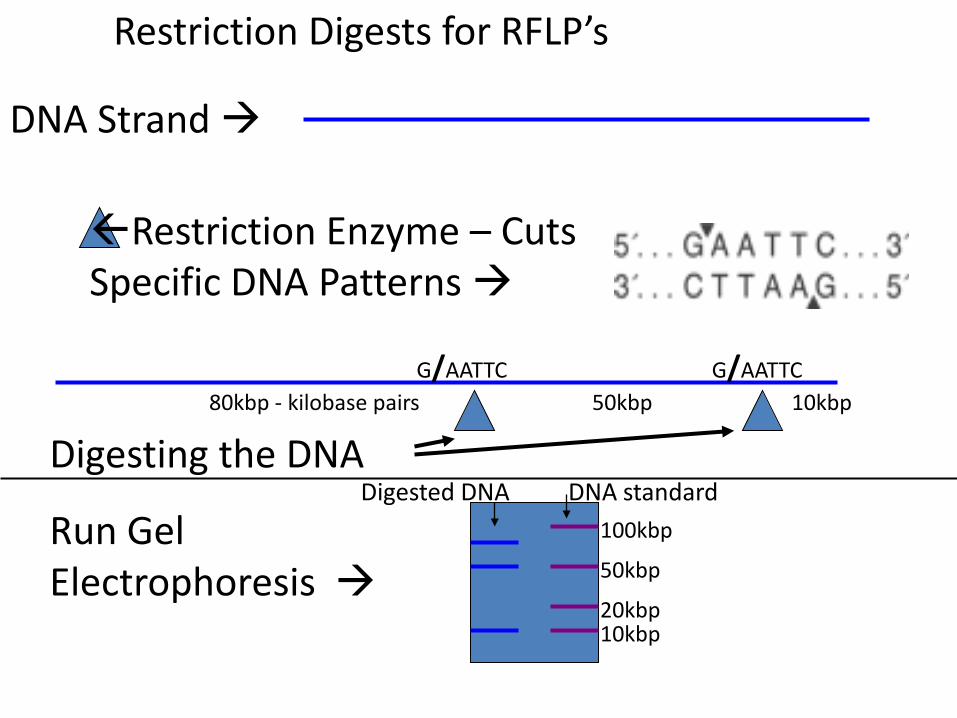
Restriction Digests for RFLP’s
DNA Strand
Restriction Enzyme – Cuts Specific DNA Patterns
100kbp
50kbp
20kbp10kbp
80kbp - kilobase pairs 50kbp 10kbpG/AATTC G/AATTC
Digesting the DNA
Run Gel Electrophoresis
DNA standardDigested DNA
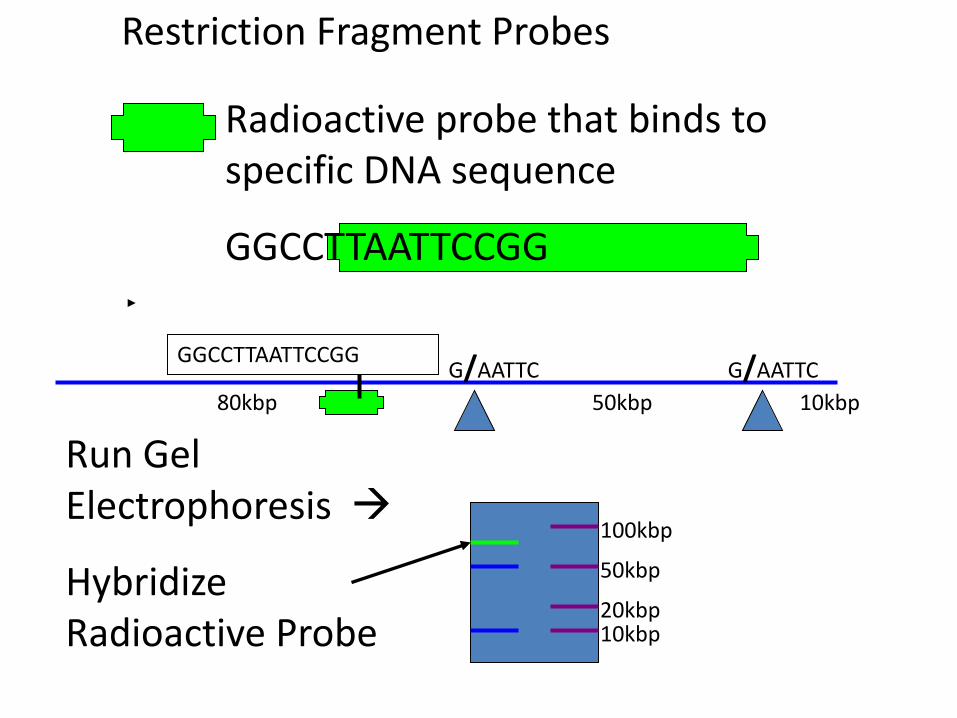
Restriction Fragment Probes
100kbp
50kbp
20kbp10kbp
80kbp 50kbp 10kbpG/AATTC G/AATTC
Radioactive probe that binds to specific DNA sequence
GGCCTTAATTCCGG
GGCCTTAATTCCGG
Run Gel Electrophoresis
Hybridize Radioactive Probe
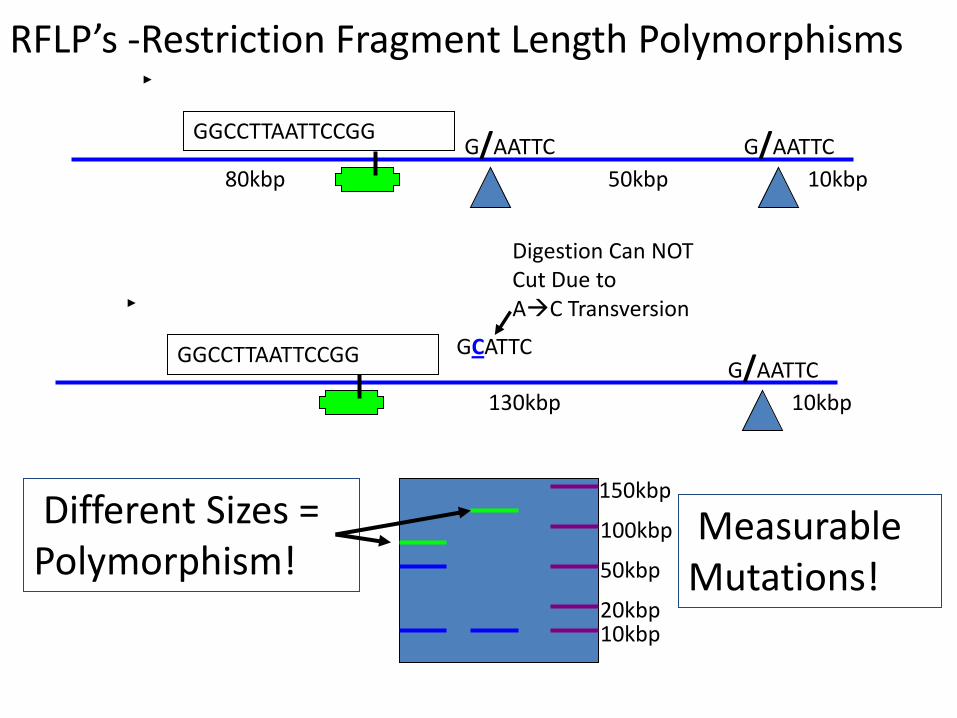
GCATTC
RFLP’s -Restriction Fragment Length Polymorphisms
100kbp
50kbp
20kbp10kbp
130kbp 10kbpG/AATTC
GGCCTTAATTCCGG
80kbp 50kbp 10kbpG/AATTC G/AATTC
GGCCTTAATTCCGG
150kbpDifferent Sizes = Polymorphism!
MeasurableMutations!
Digestion Can NOT Cut Due toAC Transversion

Polymerase Chain Reaction - PCR
Allows the selective replication and amplification of specific(targeted) DNA sequences.
PCR basics1. Know some sequence of the piece of DNA to be targeted
2. Make primers - sequences of DNA that are complementary to the DNA sequence of interest
3. Add a cocktail of -DNA template-Primers-A,C,T,G’s – The four nucleotide building blocks -Taq1 - DNA polymerase
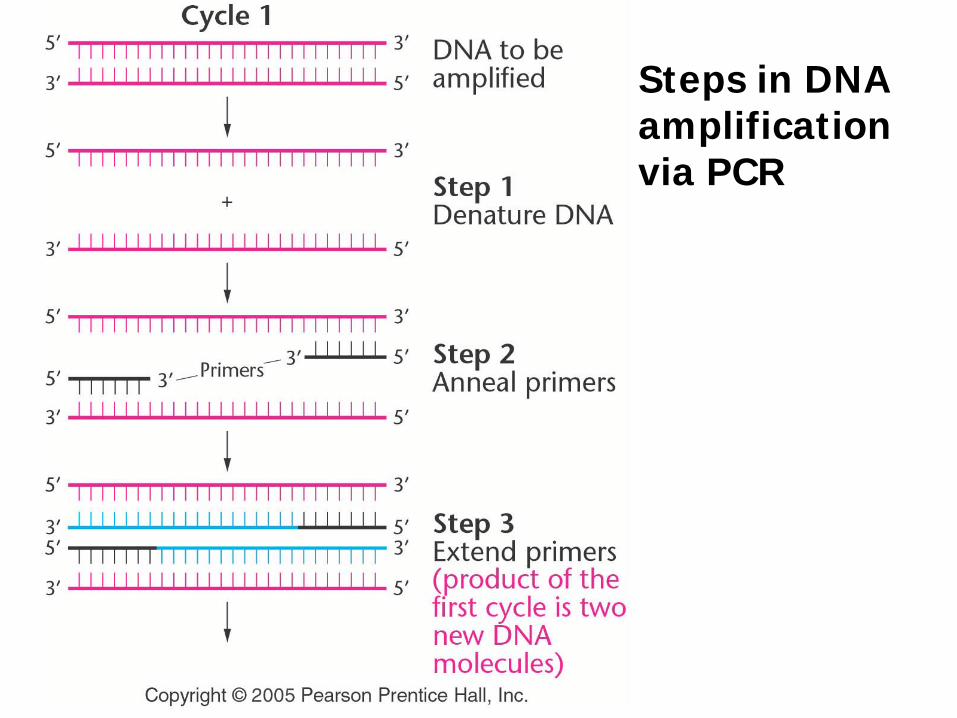
Steps in DNA amplification via PCR
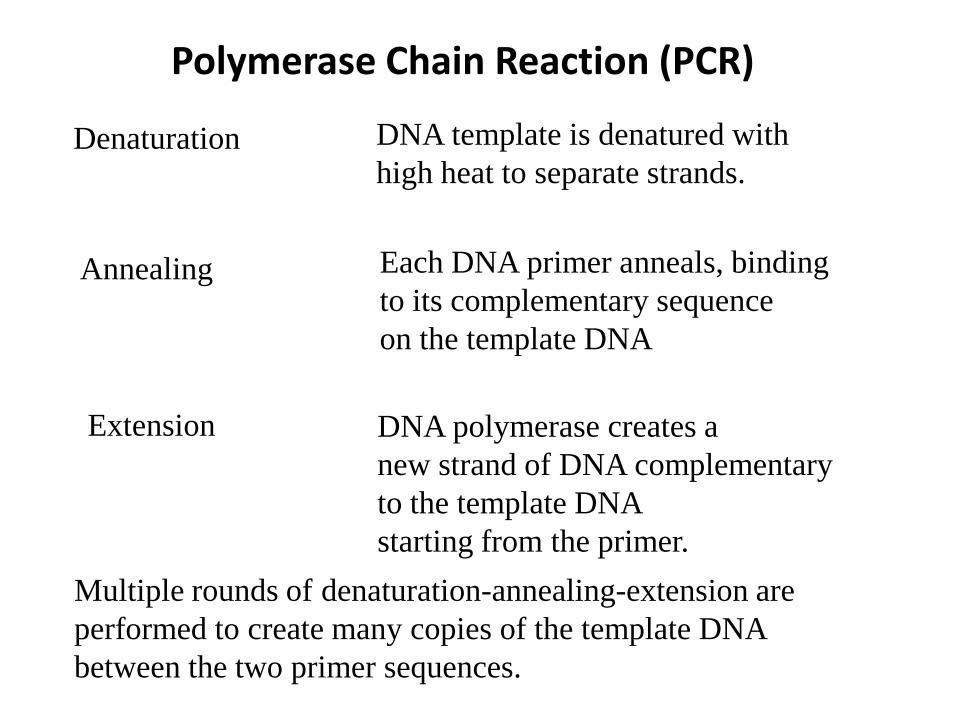
Polymerase Chain Reaction (PCR)
Denaturation
Each DNA primer anneals, bindingto its complementary sequenceon the template DNA
DNA template is denatured with high heat to separate strands.
Annealing
Extension DNA polymerase creates a new strand of DNA complementaryto the template DNA starting from the primer.
Multiple rounds of denaturation-annealing-extension areperformed to create many copies of the template DNA between the two primer sequences.

Primers must match sequences close enough to drive amplification
Depending on conditions and primers used, DNA amplified is 1 to ~6000 bp
Steps in DNA amplification via PCR
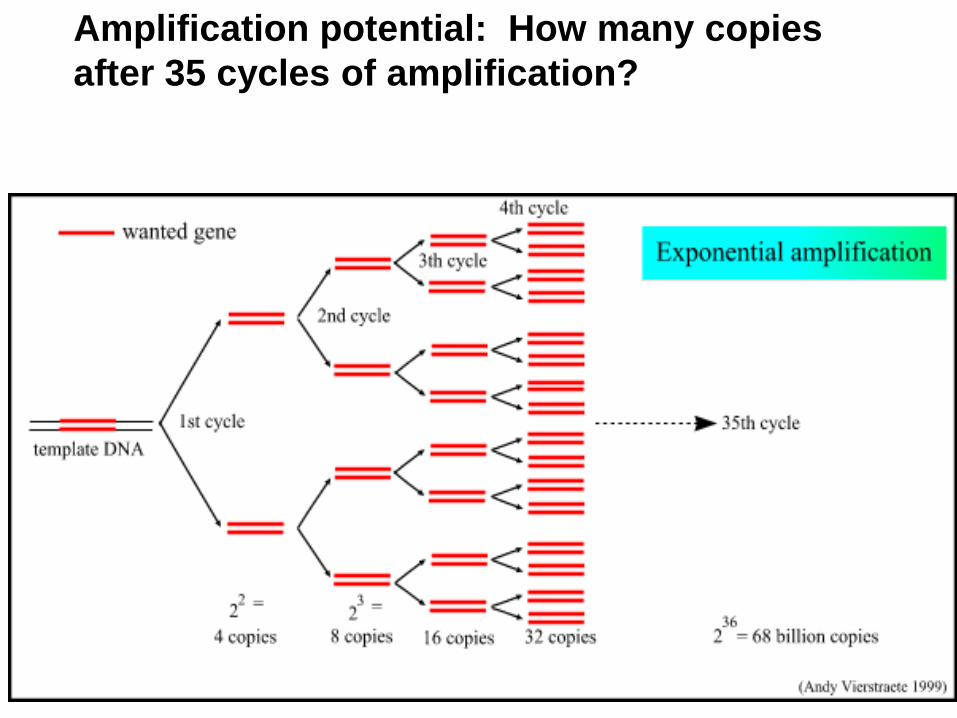
Amplification potential: How many copies after 35 cycles of amplification?
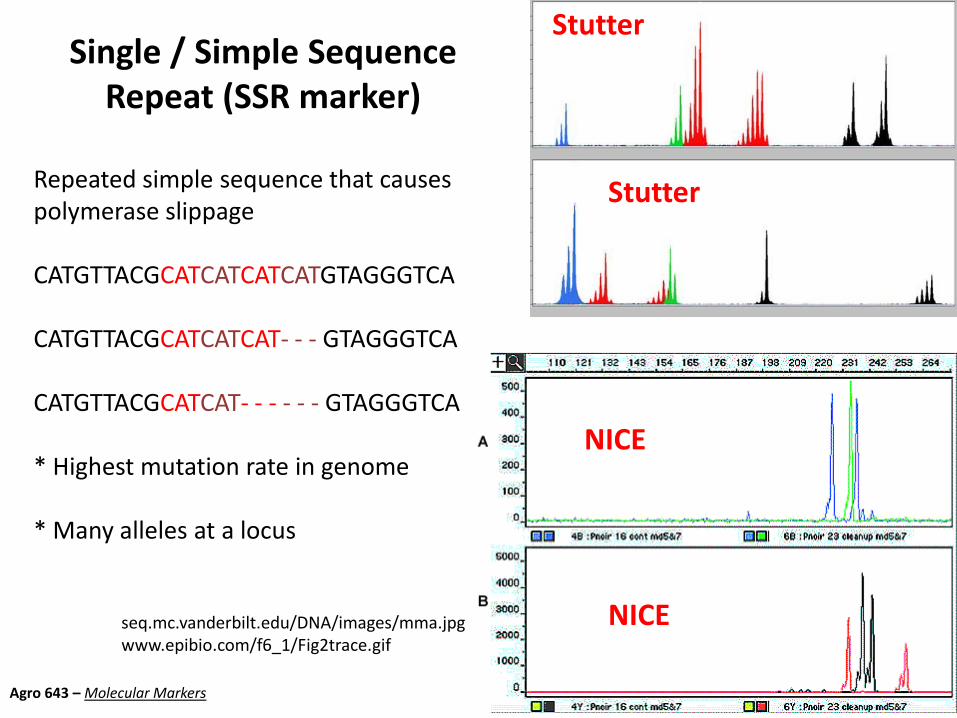
Single / Simple Sequence Repeat (SSR marker)
Repeated simple sequence that causes polymerase slippage
CATGTTACGCATCATCATCATGTAGGGTCA
CATGTTACGCATCATCAT- - - GTAGGGTCA
CATGTTACGCATCAT- - - - - - GTAGGGTCA
* Highest mutation rate in genome
* Many alleles at a locus
seq.mc.vanderbilt.edu/DNA/images/mma.jpgwww.epibio.com/f6_1/Fig2trace.gif
NICE
NICE
Stutter
Stutter
Agro 643 – Molecular Markers

PCR Based Molecular Markers Continued
Sequencing
-Get the actual DNA sequence or code between two primers
SNPs (Single Nucleotide Polymorphisms)
-Newest, most popular marker
-Detects a single base pair (bp) mutation only
-Must find the polymorphism first by sequencing
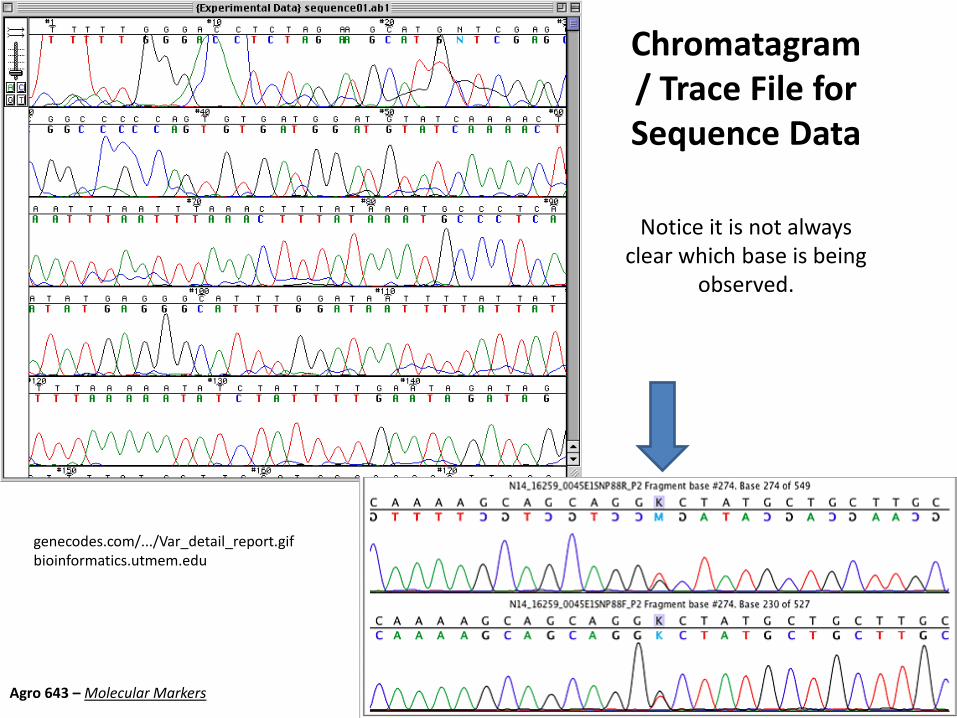
Chromatagram/ Trace File for Sequence Data
Notice it is not always clear which base is being
observed.
genecodes.com/.../Var_detail_report.gifbioinformatics.utmem.edu
Agro 643 – Molecular Markers
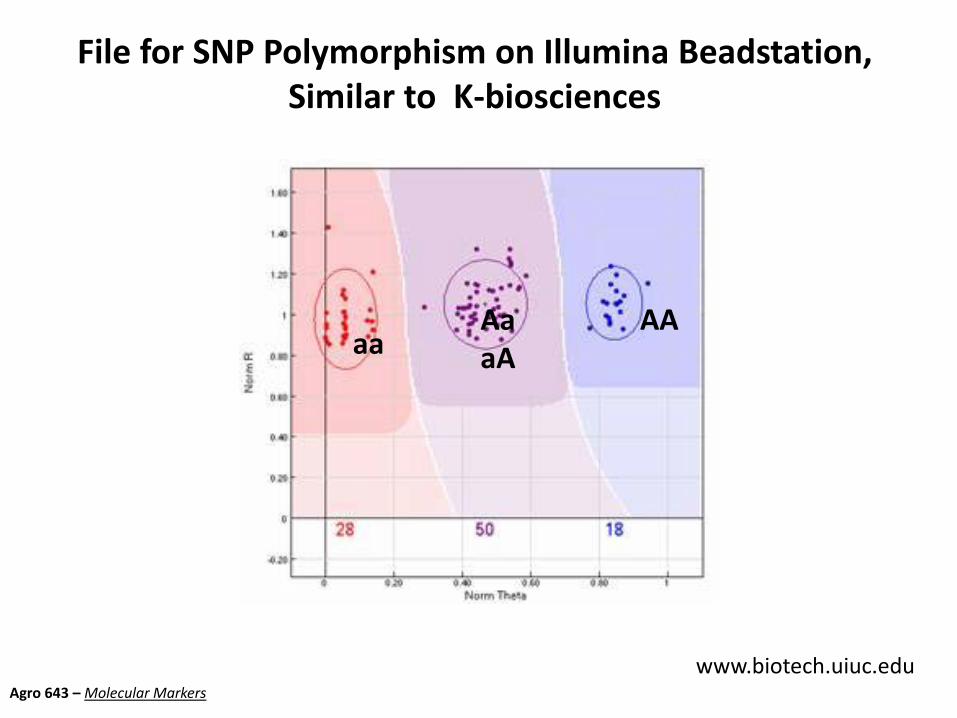
File for SNP Polymorphism on Illumina Beadstation, Similar to K-biosciences
www.biotech.uiuc.edu
aaAAAa
aA
Agro 643 – Molecular Markers

Agro 643 – MAS and Genomic Selection – Genotyping Platforms
Kbiosciences systems
http://www.kbioscience.co.uk/
pipeline

Agro 643 – MAS and Genomic Selection – Genotyping Platforms
Illumina Makes Sense for Mapping But NOT for MAS
http://www.genomecenter.ucdavis.edu/dna_technologies/prices.html
Illumina Golden Gate Genotyping UC Recharge RateNon-Profit Recharge
RateIndustry Recharge Rate
Bead Array 96 SNPs (per sample) 42 63 75
Bead Array 384 SNPs (per sample) 51 77 92
Bead Array 768 SNPs (per sample) 63 95 113
Bead Array 1536 SNPs (per sample) 78 118 141
BeadXpress 96 SNPs (per sample) 17 25 30
BeadXpress 384 SNPs (per sample) 37 55 66
1536 SNP bead chip, 16 samples 1810 2751 3285
1536 SNP bead chip, 32 samples 3170 4818 5753
Agro 643 – MAS and Genomic Selection – Genotyping Platforms
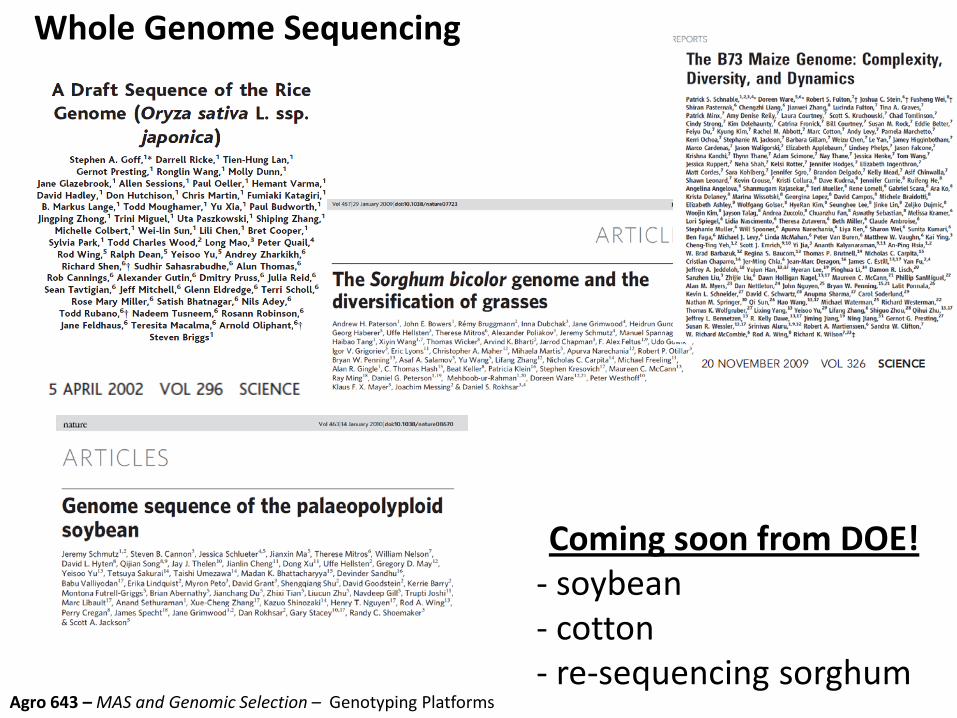
Whole Genome Sequencing
Coming soon from DOE!- soybean- cotton- re-sequencing sorghum
Agro 643 – MAS and Genomic Selection – Genotyping Platforms
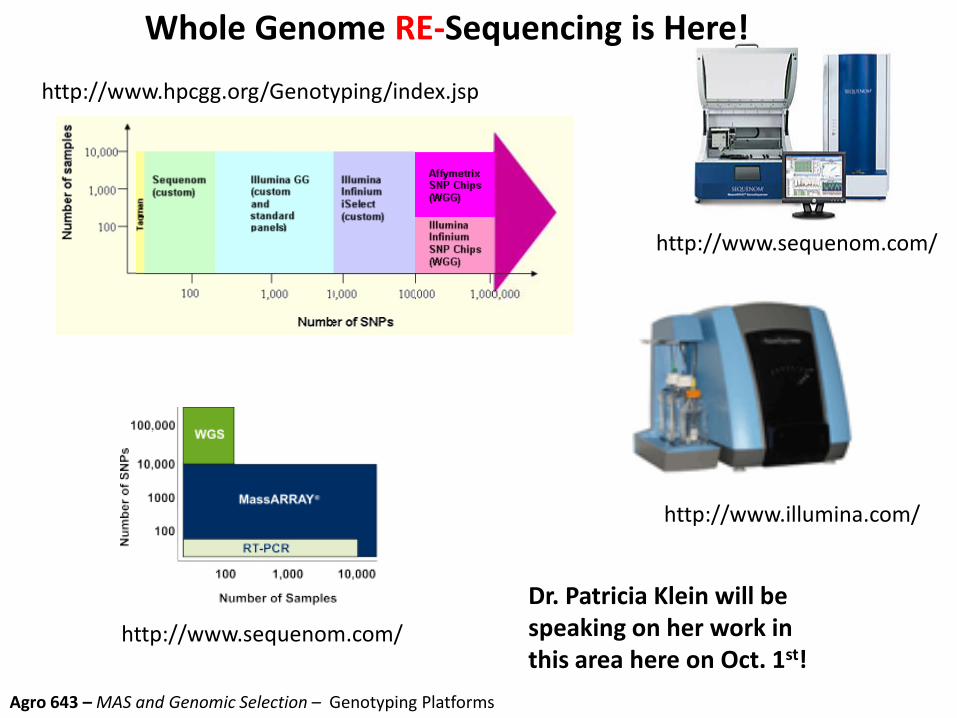
Whole Genome RE-Sequencing is Here!
http://www.hpcgg.org/Genotyping/index.jsp
http://www.sequenom.com/
http://www.illumina.com/
http://www.sequenom.com/
Dr. Patricia Klein will be speaking on her work in this area here on Oct. 1st!

What are Molecular Markers Good ForGenetic Diversity Measurements
- Selecting what genotypes to use in breeding
- Narrowing germplasm searches (only if less costly then phenotyping!)
- Managing germplasm collections
Intellectual Property Protection
- Preventing others from using your proprietary technology
Food Safety
- Detecting transgenes
- Detecting pathogens
QTL Mapping
- We will discuss today
Marker-Assisted Selection
- Backcrossing in a transgene
- Maintaining or crossing in a QTL
Genomic Selection (too complex to discuss here)
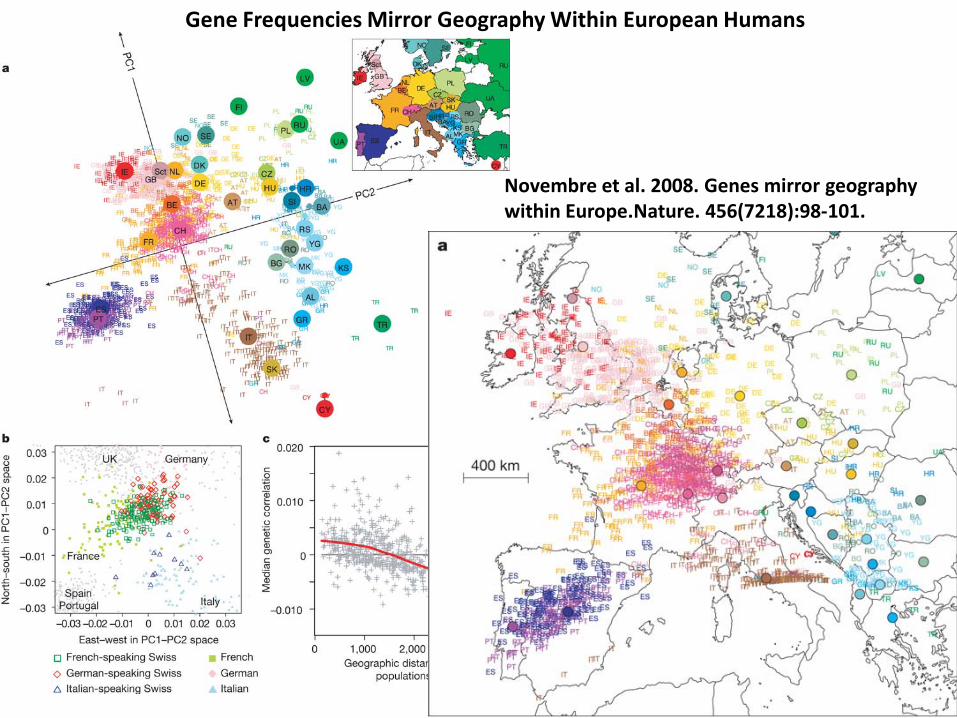
Gene Frequencies Mirror Geography Within European Humans
Novembre et al. 2008. Genes mirror geography within Europe.Nature. 456(7218):98-101.

Variance Explained = 0.36
Vari
ance
Exp
lain
ed =
0.2
1
Modern sugar and energy, MN -landraces
Historical and modern syrup
Amber

.
Markers for Predicting Diversity
Labate, J., K.R. Lamkey, M. Lee, and W.L. Woodman. 1999. Population genetics of increased hybrid performance between two maize populations under reciprocal recurrent selection. p. 127–137. In J. Coors and S. Pandey(ed.) Genetics and Exploitation of Heterosis in Crops, CIMMYT, Mexico City. 17–22 Aug. 1997. ASA, Madison, WI.
Agro 643 - Relationships and Genetic Diversity – Measurements and Visualizations of Genetic Diversity
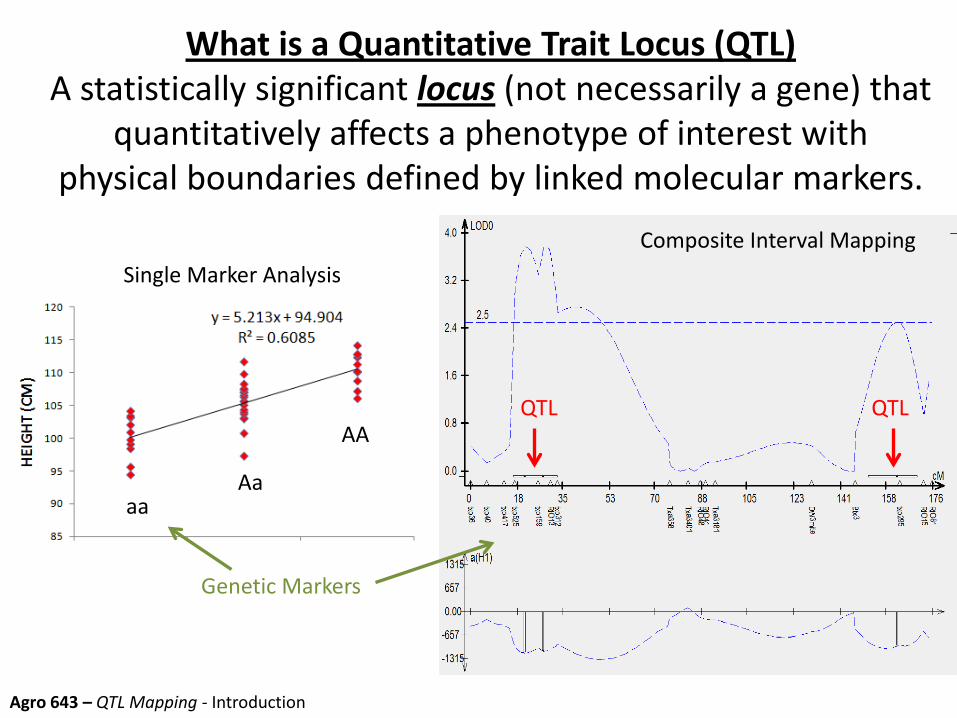
What is a Quantitative Trait Locus (QTL)A statistically significant locus (not necessarily a gene) that
quantitatively affects a phenotype of interest with physical boundaries defined by linked molecular markers.
aaAa
AA
Single Marker Analysis
QTLQTL
Composite Interval Mapping
Agro 643 – QTL Mapping - Introduction
Genetic Markers

Why do We Conduct QTL Mapping?Mapped QTL ($$$$+)
- Identify genetic control of a trait (inheritance, position, co-localization) - Identify molecular markers for Marker Assisted Selection (MAS) - Identify homology with other genes/ other species (comparative mapping) - Get hints on genome organization- Use to select ‘elite individuals’ by predicting breeding value.- Clone a QTL – can do many more things once cloned but a lot of work!
Forward Genetics:Phenotypic Variation QTL Gene Functional Polymorphism Reverse Genetics:Gene Functional Polymorphism Phenotypic Variation
Agro 643 – QTL Mapping – General
What is the plural of QTL?:Quantitative Trait Loci , but can still be called QTLs to draw attention to the fact that there is more than one.

QTL and QTL mappingWhat do we need to map QTL?- A controlled segregating population
-*Heritable variation in the population is necessary, phenotypic variation in the parents is NOT (think of transgressive segregation; parents with different genes for height can phenotypically look the same.)
- Phenotypic data- A molecular marker based linkage map- Recombination and linkage disequilibrium
What is the mapping strategy (simple overview)-Test phenotypic value difference in progeny separated by marker state for significant difference (t-test, ANOVA, regression)- A significant difference is indicative of a marker linked to a QTL- Difference between mean value of separated progeny classes is an estimate of the QTL effect. - Replicate and test across environments to:
- Minimize error variance- Identify QTL that are consistently expressed - QTL only expressed in one (rare) environment are of little use – except if preparing for a stress expected to become more common
Agro 643 – QTL Mapping - Introduction
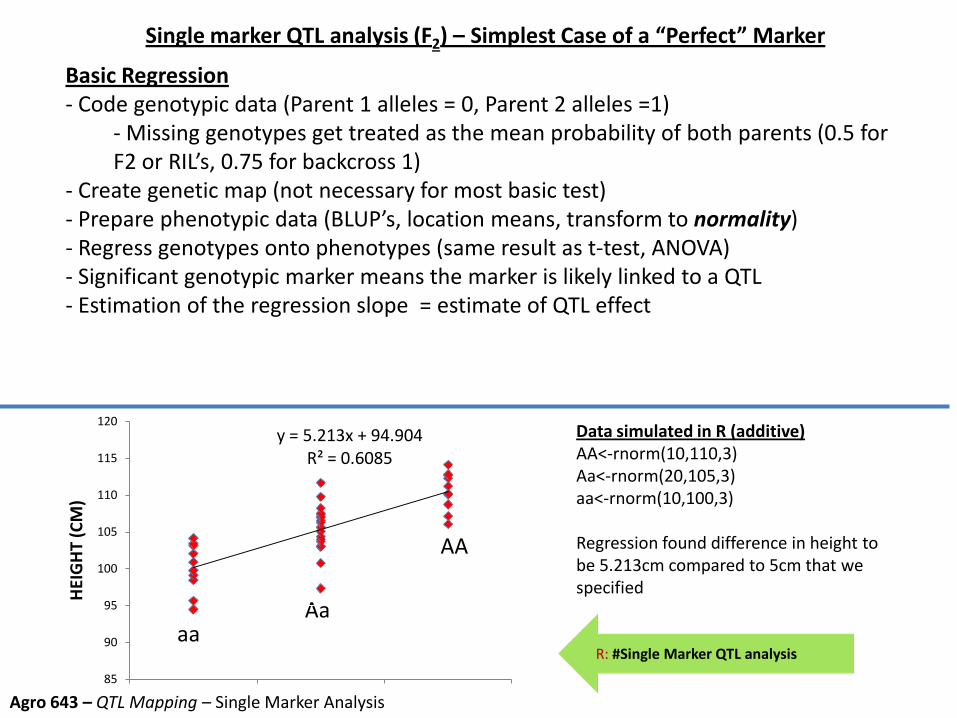
Single marker QTL analysis (F2) – Simplest Case of a “Perfect” Marker
Basic Regression- Code genotypic data (Parent 1 alleles = 0, Parent 2 alleles =1)
- Missing genotypes get treated as the mean probability of both parents (0.5 for F2 or RIL’s, 0.75 for backcross 1)
- Create genetic map (not necessary for most basic test)- Prepare phenotypic data (BLUP’s, location means, transform to normality)- Regress genotypes onto phenotypes (same result as t-test, ANOVA)- Significant genotypic marker means the marker is likely linked to a QTL- Estimation of the regression slope = estimate of QTL effect
Data simulated in R (additive)AA<-rnorm(10,110,3)Aa<-rnorm(20,105,3)aa<-rnorm(10,100,3)
Regression found difference in height to be 5.213cm compared to 5cm that we specified
aaAa
AA
y = 5.213x + 94.904R² = 0.6085
85
90
95
100
105
110
115
120
HEI
GH
T (C
M)
R: #Single Marker QTL analysis
Agro 643 – QTL Mapping – Single Marker Analysis
QTL and QTL mapping
Agro 643 - Heritability - Genetic and Environmental Variances
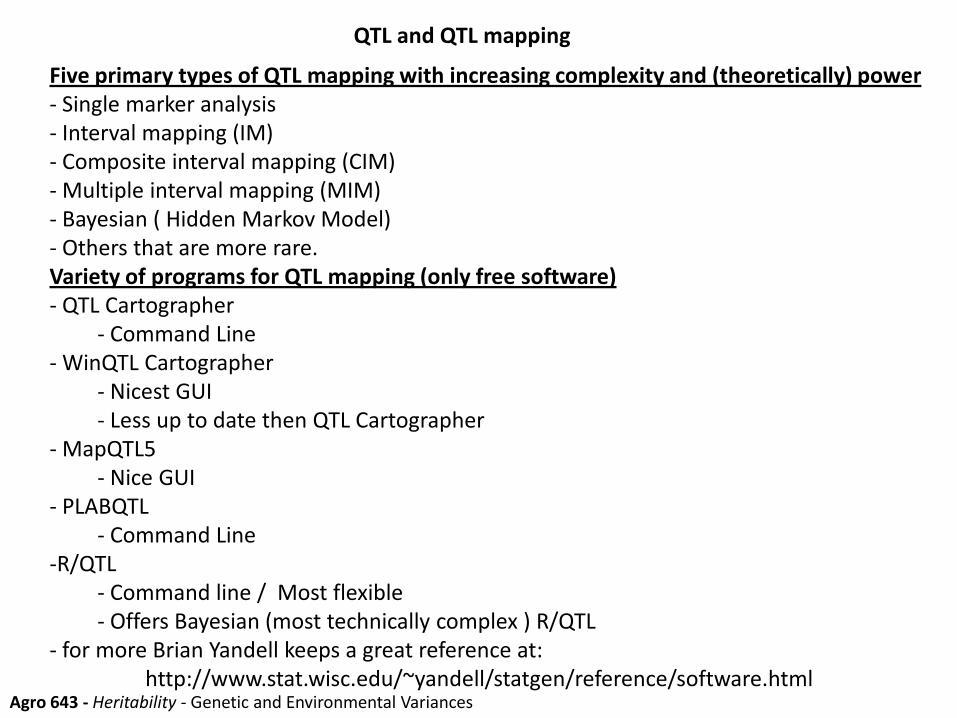
Five primary types of QTL mapping with increasing complexity and (theoretically) power- Single marker analysis- Interval mapping (IM)- Composite interval mapping (CIM)- Multiple interval mapping (MIM)- Bayesian ( Hidden Markov Model)- Others that are more rare.Variety of programs for QTL mapping (only free software)- QTL Cartographer
- Command Line- WinQTL Cartographer
- Nicest GUI- Less up to date then QTL Cartographer
- MapQTL5- Nice GUI
- PLABQTL- Command Line
-R/QTL- Command line / Most flexible- Offers Bayesian (most technically complex ) R/QTL
- for more Brian Yandell keeps a great reference at:http://www.stat.wisc.edu/~yandell/statgen/reference/software.html
Types of Populations – Inbred Derived
Agro 643 - Heritability - Genetic and Environmental Variances
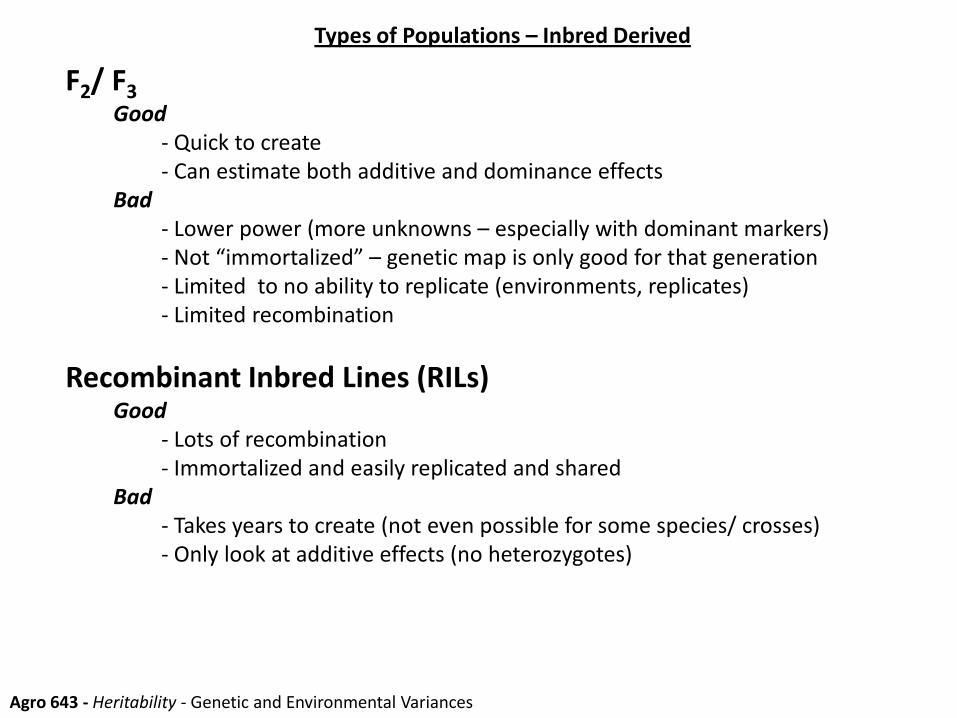
F2/ F3Good
- Quick to create- Can estimate both additive and dominance effects
Bad- Lower power (more unknowns – especially with dominant markers)- Not “immortalized” – genetic map is only good for that generation- Limited to no ability to replicate (environments, replicates)- Limited recombination
Recombinant Inbred Lines (RILs)Good
- Lots of recombination- Immortalized and easily replicated and shared
Bad- Takes years to create (not even possible for some species/ crosses)- Only look at additive effects (no heterozygotes)

Types of Populations – Inbred Derived
Agro 643 - Heritability - Genetic and Environmental Variances
Doubled HaploidGood
- Quick to create- Immortalized and easily replicated and shared
Bad- Limited recombination- Can be difficult and expensive - Can only look at additive effects (no heterozygotes)
Backcross Good
- Can be combined with trait introgression breeding - Moderate recombination
Bad- Difficult to replicate unless further inbred- Can not evaluate additive effects (no donor parent recessive homozygotes)
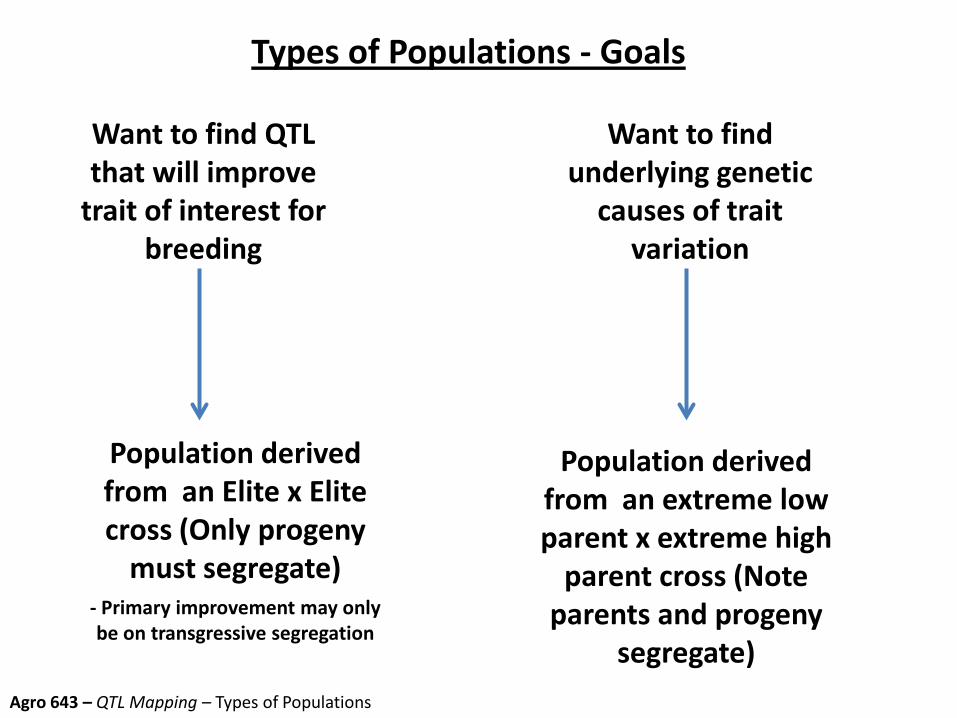
Types of Populations - Goals
Want to find QTL that will improve
trait of interest for breeding
Agro 643 – QTL Mapping – Types of Populations
Population derived from an Elite x Elite cross (Only progeny
must segregate)- Primary improvement may only be on transgressive segregation
Want to find underlying genetic
causes of trait variation
Population derived from an extreme low parent x extreme high
parent cross (Note parents and progeny
segregate)

Crude_protein_leafCrude_protein_leafCrude_protein_leaf
Lignin_leafLignin_leafLignin_leafLignin_leafLignin_leafLignin_leafLignin_leafLignin_leaf
Hemicellulose_leafHemicellulose_leafHemicellulose_leaf
Cellulose_leafCellulose_leaf
Crude_protein_stem(%solids)Crude_protein_stem(%solids)Crude_protein_stem(%solids)Crude_protein_stem(%solids)
Lignin_stem(%solids)Lignin_stem(%solids)Lignin_stem(%solids)Lignin_stem(%solids)Lignin_stem(%solids)
Hemi-cellulose_stem(%solids)Hemi-cellulose_stem(%solids)
Cellulose_stem_(%solids)
Thousand_Seed_WeightThousand_Seed_WeightThousand_Seed_WeightThousand_Seed_WeightThousand_Seed_WeightThousand_Seed_WeightThousand_Seed_WeightThousand_Seed_WeightThousand_Seed_WeightThousand_Seed_WeightThousand_Seed_WeightThousand_Seed_Weight
ADF_grainADF_grainADF_grainADF_grainADF_grain
Crude_protein_grainCrude_protein_grainCrude_protein_grainCrude_protein_grainCrude_protein_grainCrude_protein_grainCrude_protein_grainCrude_protein_grainCrude_protein_grain
Fat_grainFat_grainFat_grainFat_grainFat_grain
Starch_grainStarch_grainStarch_grainStarch_grainStarch_grainStarch_grainStarch_grain
BrixBrixBrixBrixBrixBrix
Sugar_yieldSugar_yieldSugar_yieldSugar_yieldSugar_yieldSugar_yield
Leaf_dry_matter_yieldLeaf_dry_matter_yieldLeaf_dry_matter_yieldLeaf_dry_matter_yieldLeaf_dry_matter_yieldLeaf_dry_matter_yield
Stem_structural_dry_yieldStem_structural_dry_yieldStem_structural_dry_yieldStem_structural_dry_yieldStem_structural_dry_yieldStem_structural_dry_yieldStem_structural_dry_yieldStem_structural_dry_yield
Grain_dry_matter_yieldGrain_dry_matter_yieldGrain_dry_matter_yieldGrain_dry_matter_yieldGrain_dry_matter_yieldGrain_dry_matter_yieldGrain_dry_matter_yield
Total_Biomass_dry_yieldTotal_Biomass_dry_yieldTotal_Biomass_dry_yieldTotal_Biomass_dry_yieldTotal_Biomass_dry_yieldTotal_Biomass_dry_yieldTotal_Biomass_dry_yield
Mean_stem_thickness
stand_densitystand_densitystand_densitystand_densitystand_densitystand_densitystand_densitystand_densitystand_densitystand_density
Flowering_timeFlowering_timeFlowering_timeFlowering_time
Hgt_(cm)Hgt_(cm)Hgt_(cm)Hgt_(cm)Hgt_(cm)Hgt_(cm)
QTL Mapping For Biomass in College Station, TX 2005
Height
Flower
Tiller
S diameter
Biomass
Grain
Stem
Leaf
Sugar
Brix
G starch
G fat
G protein
G fiber
G 1K Wt.
S cellulose
S h-cellu
S lignin
S protein
L Cellulose
L h-cellul
L lignin
L protein
Chr. 1 Chr. 3Chr. 2 Chr. 4 Chr. 5 Chr. 6 Chr. 7 Chr. 8 Chr. 9 Chr. 10
RioBTx623
Agro 643 – QTL Mapping – QTL Verification – Multiple Traits

Crude_protein_leafCrude_protein_leafCrude_protein_leaf
Lignin_leafLignin_leafLignin_leafLignin_leafLignin_leafLignin_leafLignin_leafLignin_leaf
Hemicellulose_leafHemicellulose_leafHemicellulose_leaf
Cellulose_leafCellulose_leaf
Crude_protein_stem(%solids)Crude_protein_stem(%solids)Crude_protein_stem(%solids)Crude_protein_stem(%solids)
Lignin_stem(%solids)Lignin_stem(%solids)Lignin_stem(%solids)Lignin_stem(%solids)Lignin_stem(%solids)
Hemi-cellulose_stem(%solids)Hemi-cellulose_stem(%solids)
Cellulose_stem_(%solids)
Thousand_Seed_WeightThousand_Seed_WeightThousand_Seed_WeightThousand_Seed_WeightThousand_Seed_WeightThousand_Seed_WeightThousand_Seed_WeightThousand_Seed_WeightThousand_Seed_WeightThousand_Seed_WeightThousand_Seed_WeightThousand_Seed_Weight
ADF_grainADF_grainADF_grainADF_grainADF_grain
Crude_protein_grainCrude_protein_grainCrude_protein_grainCrude_protein_grainCrude_protein_grainCrude_protein_grainCrude_protein_grainCrude_protein_grainCrude_protein_grain
Fat_grainFat_grainFat_grainFat_grainFat_grain
Starch_grainStarch_grainStarch_grainStarch_grainStarch_grainStarch_grainStarch_grain
BrixBrixBrixBrixBrixBrix
Sugar_yieldSugar_yieldSugar_yieldSugar_yieldSugar_yieldSugar_yield
Leaf_dry_matter_yieldLeaf_dry_matter_yieldLeaf_dry_matter_yieldLeaf_dry_matter_yieldLeaf_dry_matter_yieldLeaf_dry_matter_yield
Stem_structural_dry_yieldStem_structural_dry_yieldStem_structural_dry_yieldStem_structural_dry_yieldStem_structural_dry_yieldStem_structural_dry_yieldStem_structural_dry_yieldStem_structural_dry_yield
Grain_dry_matter_yieldGrain_dry_matter_yieldGrain_dry_matter_yieldGrain_dry_matter_yieldGrain_dry_matter_yieldGrain_dry_matter_yieldGrain_dry_matter_yield
Total_Biomass_dry_yieldTotal_Biomass_dry_yieldTotal_Biomass_dry_yieldTotal_Biomass_dry_yieldTotal_Biomass_dry_yieldTotal_Biomass_dry_yieldTotal_Biomass_dry_yield
Mean_stem_thickness
stand_densitystand_densitystand_densitystand_densitystand_densitystand_densitystand_densitystand_densitystand_densitystand_density
Flowering_timeFlowering_timeFlowering_timeFlowering_time
Hgt_(cm)Hgt_(cm)Hgt_(cm)Hgt_(cm)Hgt_(cm)Hgt_(cm)
Height
Flower
Tiller
S diameter
Biomass
Grain
Stem
Leaf
Sugar
Brix
G starch
G fat
G protein
G fiber
G 1K Wt.
S cellulose
S h-cellu
S lignin
S protein
L Cellulose
L h-cellul
L lignin
L protein
Chr. 1 Chr. 3Chr. 2 Chr. 4 Chr. 5 Chr. 6 Chr. 7 Chr. 8 Chr. 9 Chr. 10
RioBTx623
Agro 643 – QTL Mapping – QTL Verification – Multiple Traits
QTL Mapping For Biomass in Stem and Leaf Tissue in College Station, TX 2005

Crude_protein_leafCrude_protein_leafCrude_protein_leaf
Lignin_leafLignin_leafLignin_leafLignin_leafLignin_leafLignin_leafLignin_leafLignin_leaf
Hemicellulose_leafHemicellulose_leafHemicellulose_leaf
Cellulose_leafCellulose_leaf
Crude_protein_stem(%solids)Crude_protein_stem(%solids)Crude_protein_stem(%solids)Crude_protein_stem(%solids)
Lignin_stem(%solids)Lignin_stem(%solids)Lignin_stem(%solids)Lignin_stem(%solids)Lignin_stem(%solids)
Hemi-cellulose_stem(%solids)Hemi-cellulose_stem(%solids)
Cellulose_stem_(%solids)
Thousand_Seed_WeightThousand_Seed_WeightThousand_Seed_WeightThousand_Seed_WeightThousand_Seed_WeightThousand_Seed_WeightThousand_Seed_WeightThousand_Seed_WeightThousand_Seed_WeightThousand_Seed_WeightThousand_Seed_WeightThousand_Seed_Weight
ADF_grainADF_grainADF_grainADF_grainADF_grain
Crude_protein_grainCrude_protein_grainCrude_protein_grainCrude_protein_grainCrude_protein_grainCrude_protein_grainCrude_protein_grainCrude_protein_grainCrude_protein_grain
Fat_grainFat_grainFat_grainFat_grainFat_grain
Starch_grainStarch_grainStarch_grainStarch_grainStarch_grainStarch_grainStarch_grain
BrixBrixBrixBrixBrixBrix
Sugar_yieldSugar_yieldSugar_yieldSugar_yieldSugar_yieldSugar_yield
Leaf_dry_matter_yieldLeaf_dry_matter_yieldLeaf_dry_matter_yieldLeaf_dry_matter_yieldLeaf_dry_matter_yieldLeaf_dry_matter_yield
Stem_structural_dry_yieldStem_structural_dry_yieldStem_structural_dry_yieldStem_structural_dry_yieldStem_structural_dry_yieldStem_structural_dry_yieldStem_structural_dry_yieldStem_structural_dry_yield
Grain_dry_matter_yieldGrain_dry_matter_yieldGrain_dry_matter_yieldGrain_dry_matter_yieldGrain_dry_matter_yieldGrain_dry_matter_yieldGrain_dry_matter_yield
Total_Biomass_dry_yieldTotal_Biomass_dry_yieldTotal_Biomass_dry_yieldTotal_Biomass_dry_yieldTotal_Biomass_dry_yieldTotal_Biomass_dry_yieldTotal_Biomass_dry_yield
Mean_stem_thickness
stand_densitystand_densitystand_densitystand_densitystand_densitystand_densitystand_densitystand_densitystand_densitystand_density
Flowering_timeFlowering_timeFlowering_timeFlowering_time
Hgt_(cm)Hgt_(cm)Hgt_(cm)Hgt_(cm)Hgt_(cm)Hgt_(cm)
Height
Flower
Tiller
S diameter
Biomass
Grain
Stem
Leaf
Sugar
Brix
G starch
G fat
G protein
G fiber
G 1K Wt.
S cellulose
S h-cellu
S lignin
S protein
L Cellulose
L h-cellul
L lignin
L protein
Chr. 1 Chr. 3Chr. 2 Chr. 4 Chr. 5 Chr. 6 Chr. 7 Chr. 8 Chr. 9 Chr. 10
RioBTx623
Agro 643 – QTL Mapping – QTL Verification – Multiple Traits
QTL Mapping For Multiple Traits in College Station, TX 2005
Crude_protein_leafCrude_protein_leafCrude_protein_leaf
Lignin_leafLignin_leafLignin_leafLignin_leafLignin_leafLignin_leafLignin_leafLignin_leaf
Hemicellulose_leafHemicellulose_leafHemicellulose_leaf
Cellulose_leafCellulose_leaf
Crude_protein_stem(%solids)Crude_protein_stem(%solids)Crude_protein_stem(%solids)Crude_protein_stem(%solids)
Lignin_stem(%solids)Lignin_stem(%solids)Lignin_stem(%solids)Lignin_stem(%solids)Lignin_stem(%solids)
Hemi-cellulose_stem(%solids)Hemi-cellulose_stem(%solids)
Cellulose_stem_(%solids)
Thousand_Seed_WeightThousand_Seed_WeightThousand_Seed_WeightThousand_Seed_WeightThousand_Seed_WeightThousand_Seed_WeightThousand_Seed_WeightThousand_Seed_WeightThousand_Seed_WeightThousand_Seed_WeightThousand_Seed_WeightThousand_Seed_Weight
ADF_grainADF_grainADF_grainADF_grainADF_grain
Crude_protein_grainCrude_protein_grainCrude_protein_grainCrude_protein_grainCrude_protein_grainCrude_protein_grainCrude_protein_grainCrude_protein_grainCrude_protein_grain
Fat_grainFat_grainFat_grainFat_grainFat_grain
Starch_grainStarch_grainStarch_grainStarch_grainStarch_grainStarch_grainStarch_grain
BrixBrixBrixBrixBrixBrix
Sugar_yieldSugar_yieldSugar_yieldSugar_yieldSugar_yieldSugar_yield
Leaf_dry_matter_yieldLeaf_dry_matter_yieldLeaf_dry_matter_yieldLeaf_dry_matter_yieldLeaf_dry_matter_yieldLeaf_dry_matter_yield
Stem_structural_dry_yieldStem_structural_dry_yieldStem_structural_dry_yieldStem_structural_dry_yieldStem_structural_dry_yieldStem_structural_dry_yieldStem_structural_dry_yieldStem_structural_dry_yield
Grain_dry_matter_yieldGrain_dry_matter_yieldGrain_dry_matter_yieldGrain_dry_matter_yieldGrain_dry_matter_yieldGrain_dry_matter_yieldGrain_dry_matter_yield
Total_Biomass_dry_yieldTotal_Biomass_dry_yieldTotal_Biomass_dry_yieldTotal_Biomass_dry_yieldTotal_Biomass_dry_yieldTotal_Biomass_dry_yieldTotal_Biomass_dry_yield
Mean_stem_thickness
stand_densitystand_densitystand_densitystand_densitystand_densitystand_densitystand_densitystand_densitystand_densitystand_density
Flowering_timeFlowering_timeFlowering_timeFlowering_time
Hgt_(cm)Hgt_(cm)Hgt_(cm)Hgt_(cm)Hgt_(cm)Hgt_(cm)
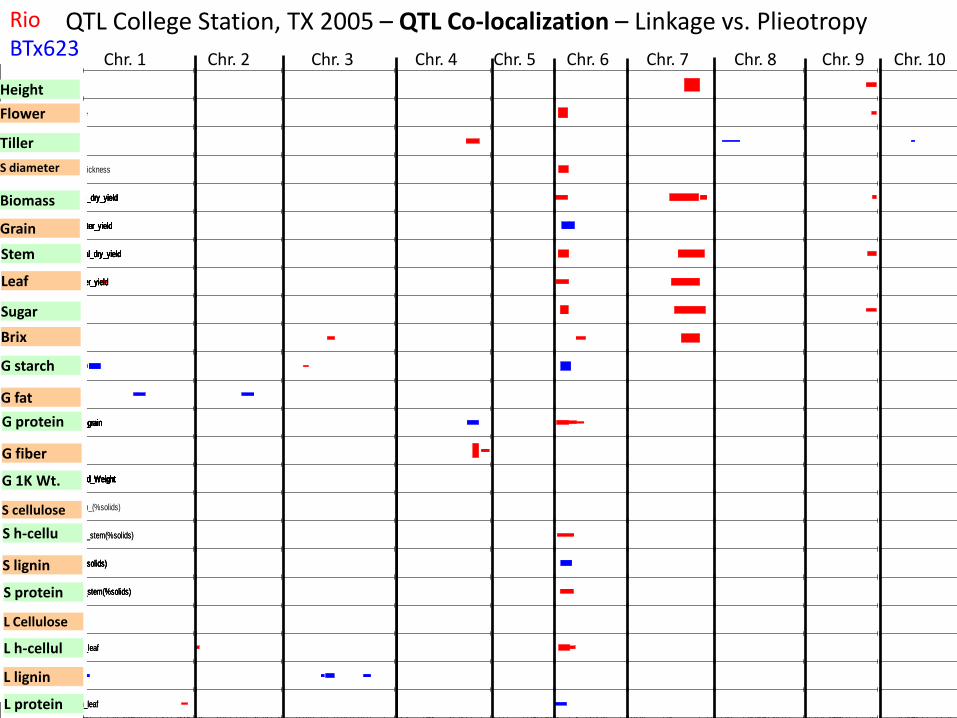
QTL College Station, TX 2005 – QTL Co-localization – Linkage vs. Plieotropy
Height
Flower
Tiller
S diameter
Biomass
Grain
Stem
Leaf
Sugar
Brix
G starch
G fat
G protein
G fiber
G 1K Wt.
S cellulose
S h-cellu
S lignin
S protein
L Cellulose
L h-cellul
L lignin
L protein
Chr. 1 Chr. 3Chr. 2 Chr. 4 Chr. 5 Chr. 6 Chr. 7 Chr. 8 Chr. 9 Chr. 10
RioBTx623

QTL Meta-analysisUsing 50 separate disease resistance QTL studies in maize to understand broad spectrum quantitative disease resistance
Wisser RJ, Balint-Kurti PJ, Nelson RJ (2006) The genetic architecture of disease resistance in maize: a synthesis of published studies. Phytopathology96:120–129
Agro 643 – Epistasis – HIFS
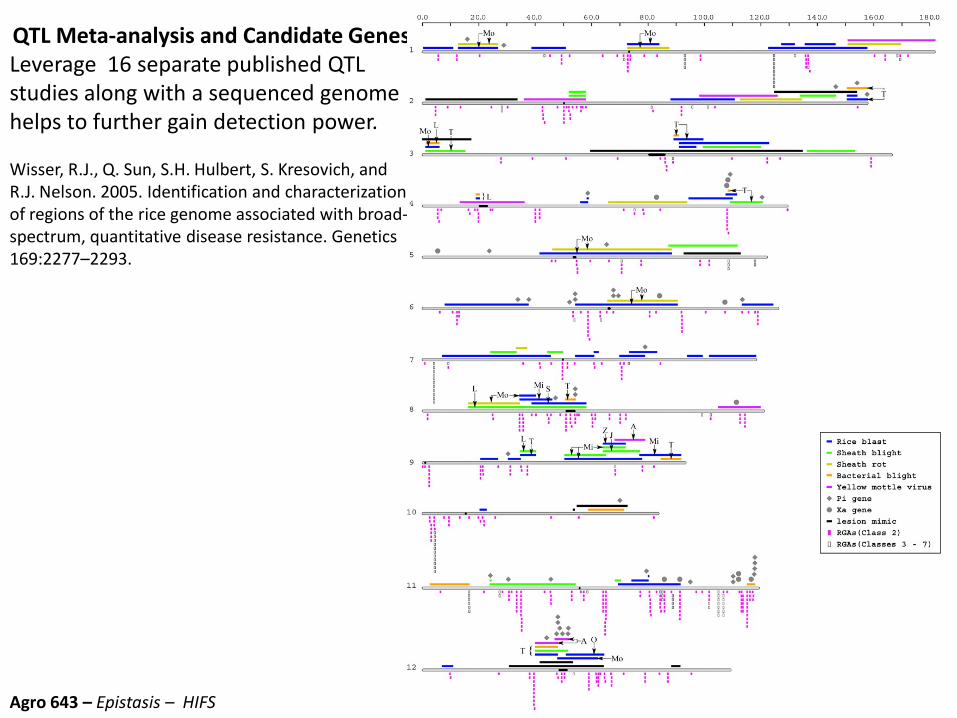
QTL Meta-analysis and Candidate GenesLeverage 16 separate published QTL studies along with a sequenced genome helps to further gain detection power.
Wisser, R.J., Q. Sun, S.H. Hulbert, S. Kresovich, and R.J. Nelson. 2005. Identification and characterization of regions of the rice genome associated with broad-spectrum, quantitative disease resistance. Genetics 169:2277–2293.
Agro 643 – Epistasis – HIFS

Power of QTL detection is directly related to heritability
Bernardo, 2004
Power (%)
0
10
20
30
40
50
60
70
80
90
100
Heritability
0.4 0.5 0.6 0.7 0.8 0.9 1.0
N = 600
N = 300
N = 100
Utz and Melchinger, 1994
Agro 643 – QTL Mapping – Sample Size and Power
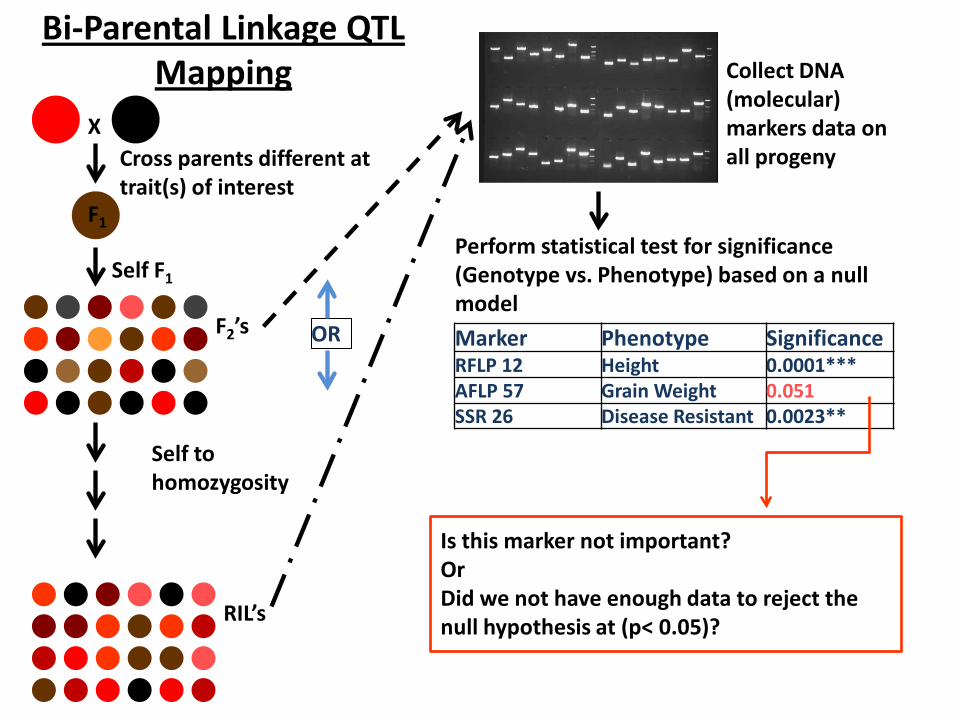
XCross parents different at trait(s) of interest
Self F1
F2’s
F1
Self to homozygosity
RIL’s
Collect DNA (molecular) markers data on all progeny
Marker Phenotype SignificanceRFLP 12 Height 0.0001***AFLP 57 Grain Weight 0.051SSR 26 Disease Resistant 0.0023**
OR
Perform statistical test for significance (Genotype vs. Phenotype) based on a null model
Is this marker not important? OrDid we not have enough data to reject the null hypothesis at (p< 0.05)?
Bi-Parental Linkage QTL Mapping
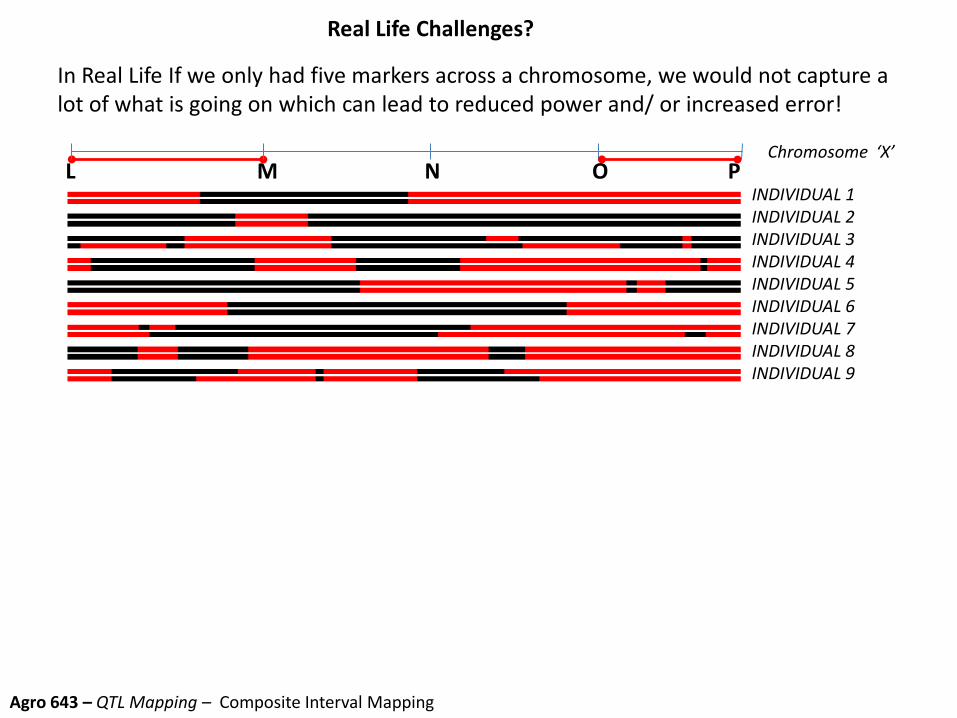
In Real Life If we only had five markers across a chromosome, we would not capture a lot of what is going on which can lead to reduced power and/ or increased error!
M N PChromosome ‘X’
Real Life Challenges?
Agro 643 – QTL Mapping – Composite Interval Mapping
L OINDIVIDUAL 1INDIVIDUAL 2INDIVIDUAL 3INDIVIDUAL 4INDIVIDUAL 5INDIVIDUAL 6INDIVIDUAL 7INDIVIDUAL 8INDIVIDUAL 9
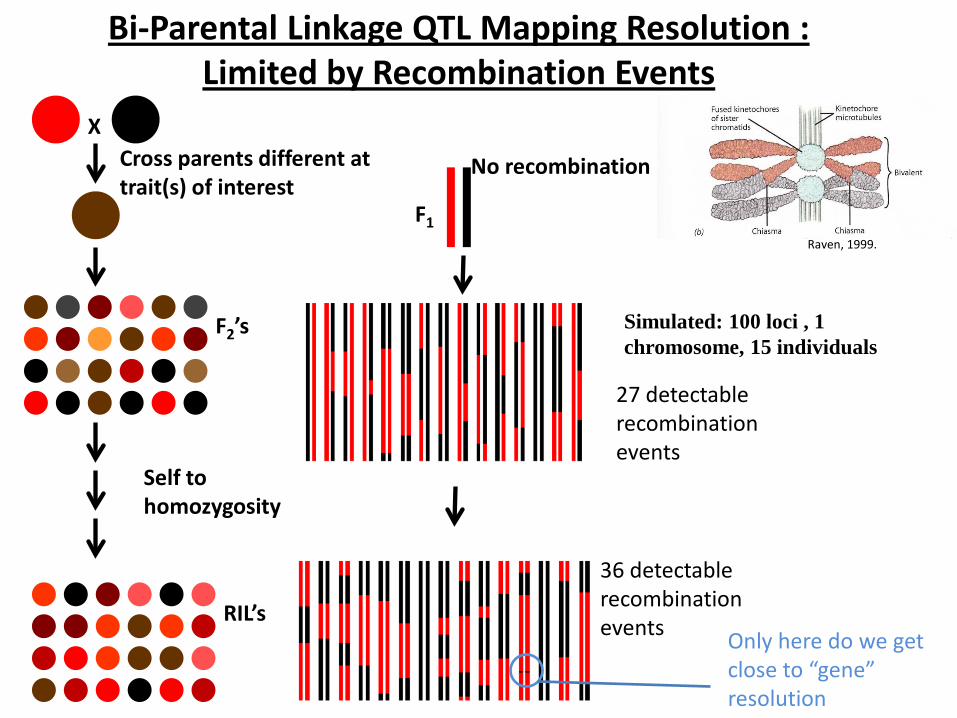
XCross parents different at trait(s) of interest
No recombination
F2’s
F1
Self to homozygosity
RIL’s
Bi-Parental Linkage QTL Mapping Resolution : Limited by Recombination Events
36 detectable recombinationevents
27 detectable recombinationevents
Simulated: 100 loci , 1 chromosome, 15 individuals
Only here do we get close to “gene” resolution
Raven, 1999.

Sample Size and Power
Agro 643 – QTL Mapping – Sample Size and Power
Before asking the questions of what sample size we should use and how much detection power we expect to have, we should note the factors that influence this.1) What is the experimental goal?
2) What is the heritability of a trait?
3) How many QTL are involved?The more QTL to detect, the more individuals and markers you will need
4) How large of a QTL effect do you want to be able to find?To detect smaller and smaller QTL effects we need an exponentially larger
population because of the associated error
5) What are the effects of the trait?Dominant, additive, over-dominant, this will effect the population you use and
hence the sample size.
6) Is there any reason to believe there is epistasis?Yes! Do you want to detect it – probably do not have the resources too.
7) Is there any reason for using a smaller than optimum sample size?Yes! Time to create population, money to genotype and phenotype population

Many QTL Can Be / Are False!
Agro 643 – QTL Mapping – General
Bernardo, R. 2004. What proportion of declared QTL in plants are false? Theor. Appl. Genet. 109:419–424.
Null hypothesis
is True
Null hypothesis
is FalseReject the
Null Hypothesis
Type 1 Error!α
Fail to Reject the
Null Hypothesis
Type 2 Error!β
Note that this was a simulation of an F2 population (1 environment) with 150 individuals, 100 markers, multiple regression for detection, no permutation test and α=0.05.
When the author changed any of these things the results were not so dire.
Type III error: provides the right answer to the wrong question (discrepancy between the research focus and the research question )
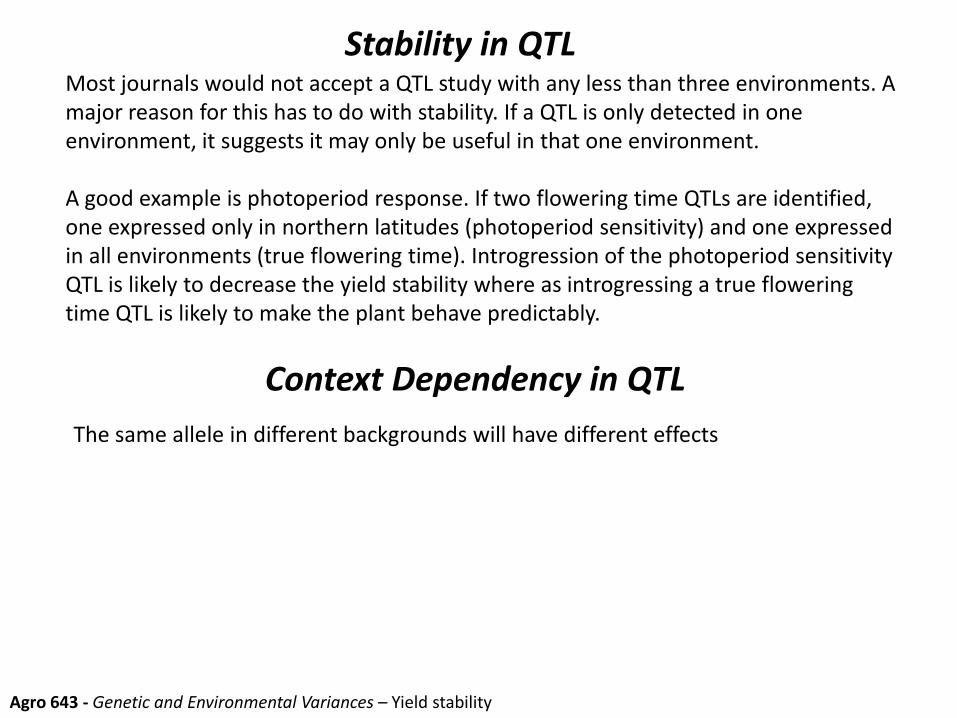
Stability in QTLMost journals would not accept a QTL study with any less than three environments. A major reason for this has to do with stability. If a QTL is only detected in one environment, it suggests it may only be useful in that one environment.
A good example is photoperiod response. If two flowering time QTLs are identified, one expressed only in northern latitudes (photoperiod sensitivity) and one expressed in all environments (true flowering time). Introgression of the photoperiod sensitivity QTL is likely to decrease the yield stability where as introgressing a true flowering time QTL is likely to make the plant behave predictably.
Agro 643 - Genetic and Environmental Variances – Yield stability
Context Dependency in QTLThe same allele in different backgrounds will have different effects

QTL Verification
QTL VerificationLocus effect quantification – How large is the difference between alleles?Plieotropy – Would unmeasured traits be affected? Are there negative effects?QTL x Environment Interaction – Is there a year or environment effect? How large?QTL x QTL interaction – Is there epistasis that may make some QTL more or less valuableUnderlying gene(s) – Can we, do we want to identify these?
Approaches for VerificationCompare multiple traitsCompare in multiple environmentsDevelop and use independent populationsFine Mapping (discussed later)Create Near Isogenic Lines (discussed later)Association mapping verification (discussed later)Cloning & Transformation (discussed later)
Agro 643 – QTL Mapping – QTL Verification

QTL Cloning Using Fine MappingGo from a statistically identifiable region to a functional polymorphism that can be tested directly.
Identified QTLMARKER A
MARKER B
Backcross NIL’sHeterogeneous Inbred Families (HIFs)
NIL looks just like recurrent parent except with substitution at gene
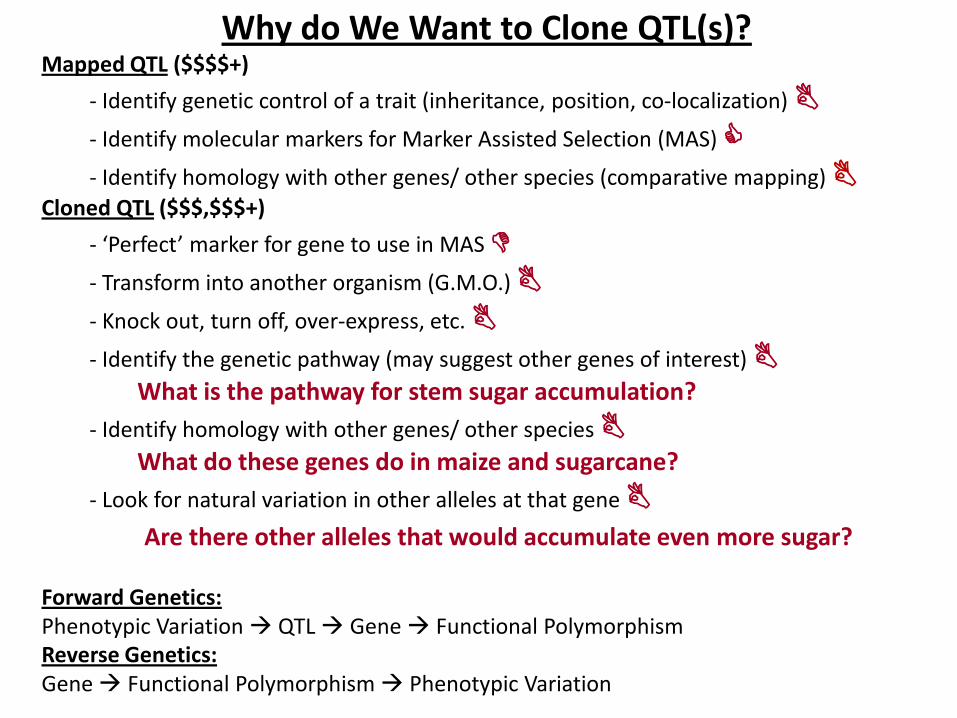
Why do We Want to Clone QTL(s)?Mapped QTL ($$$$+)
- Identify genetic control of a trait (inheritance, position, co-localization) - Identify molecular markers for Marker Assisted Selection (MAS) - Identify homology with other genes/ other species (comparative mapping)
Cloned QTL ($$$,$$$+)
- ‘Perfect’ marker for gene to use in MAS - Transform into another organism (G.M.O.) - Knock out, turn off, over-express, etc. - Identify the genetic pathway (may suggest other genes of interest)
What is the pathway for stem sugar accumulation?- Identify homology with other genes/ other species
What do these genes do in maize and sugarcane?- Look for natural variation in other alleles at that gene
Are there other alleles that would accumulate even more sugar?
Forward Genetics:Phenotypic Variation QTL Gene Functional Polymorphism Reverse Genetics:Gene Functional Polymorphism Phenotypic Variation

CloningCrop Improvement Genes
Cloning the gene is when we know the DNA sequence of the gene CAUSING the morphological (phenotypic) difference.
We do this by finding and mapping molecular markers closer and closer to our morphological marker.
This lets us do many neat things for both crop improvement and evolution studies but is A LOT of work!
Example:Cloning the First Domestication Gene
- Tomato fw2.2
Doebley JF, Gaut BS, Smith BD (2006) The molecular genetics of crop domestication. Cell. 29;127(7): 1309-21
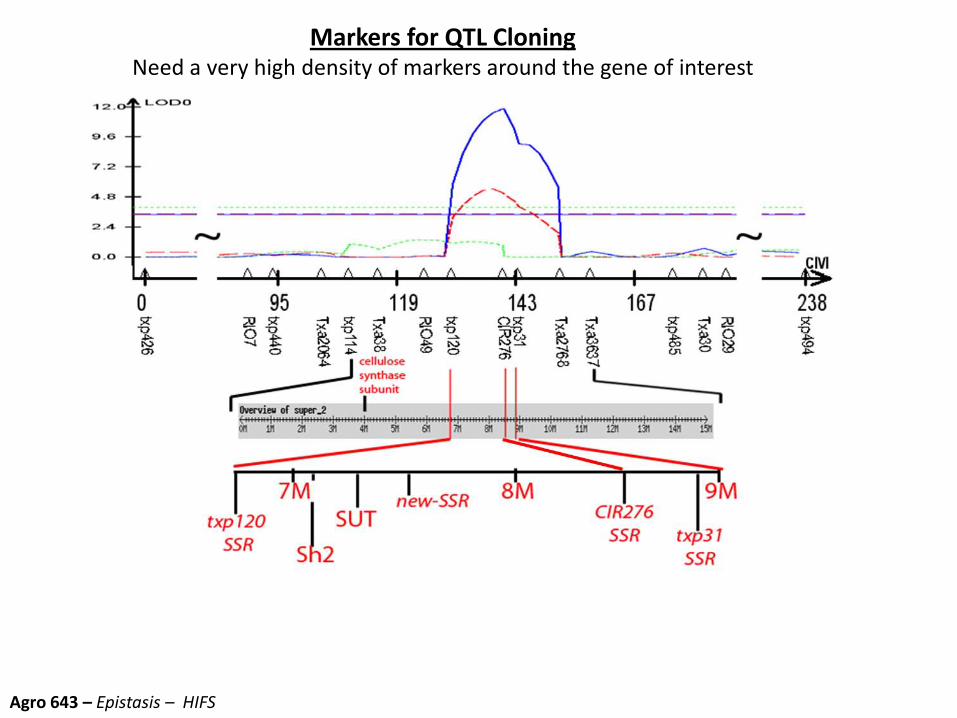
Markers for QTL Cloning Need a very high density of markers around the gene of interest
Agro 643 – Epistasis – HIFS

QTL Cloning Using Fine Mapping
Li, J., M. Thomson, and S.R. McCouch. 2004. Fine mapping of a grain-weight quantitative trait locus in the pericentromeric region of rice chromosome 3. Genetics 168:2187–2195.
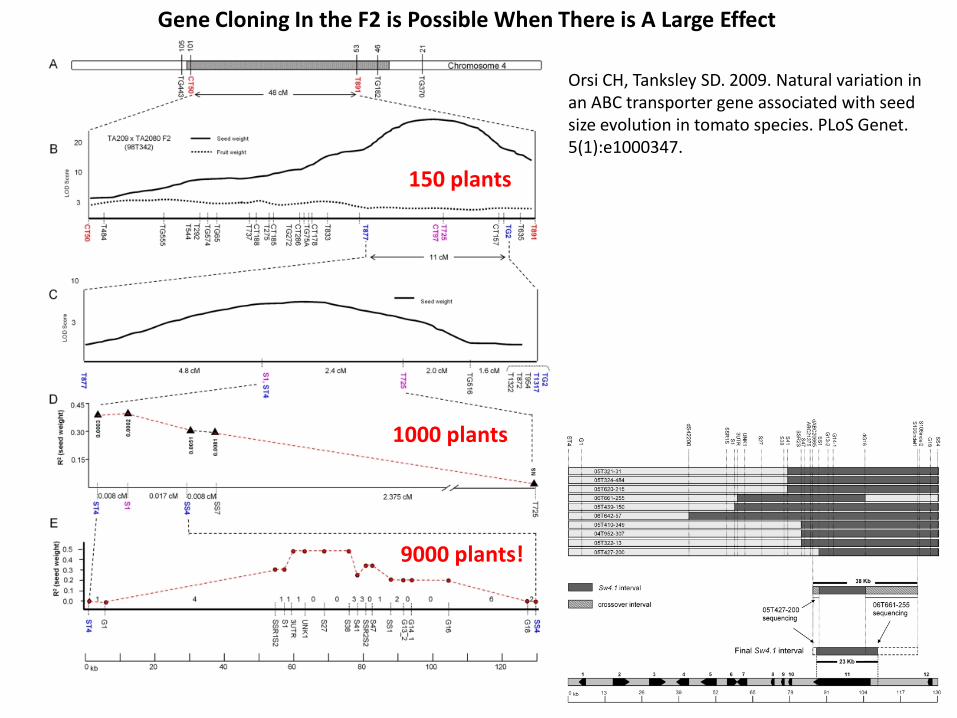
Gene Cloning In the F2 is Possible When There is A Large Effect
150 plants
1000 plants
9000 plants!
Orsi CH, Tanksley SD. 2009. Natural variation in an ABC transporter gene associated with seed size evolution in tomato species. PLoS Genet. 5(1):e1000347.

Dissecting a QTL Yielded Two Genes With Opposite Effects
Thomson, M. J., J. D. Edwards, E. M. Septiningsih, S. E. Harrington and S. R. McCouch, 2006 Substitution mapping of dth1.1, a flowering-time quantitative trait locus (QTL) associated with transgressivevariation in rice, reveals multiple Sub-QTL. Genetics 172: 2501–2514.

Dissecting A Quantitative Trait:Time Versus Resolution
Resolution in bp
1x1071
Rese
arch
Tim
e in
Yea
rs
5
1Associations
1x10⁴
F2 QTL Mapping
NILs Positional Cloning
RI QTL Mapping
Stolen from Dr. Edward Buckler – USDA-ARS

Resolution Versus Allelic Range
Resolution in bp
1x1071
Alle
les
Eval
uate
d
>40
1
Associations In Diverse Germplasm
1x10⁴
NIL
Pedigree
F2 or RIL Mapping
Positional Cloning
Associations In Narrow Germplasm
Stolen from Dr. Edward Buckler – USDA-ARS

Improving A Quantitative Trait:Cost vs. Usefullness
Usefulness to Crop Improvementmoreless
Cost
s Fo
r a
Use
ful S
tudy
more
less
Associations
NILs
RIL QTL Mapping
Not Stolen
F2 QTL Mapping Genomic Selection
Selection Mapping
HIFs

Copyright © 2008 by the Genetics Society of AmericaYu, J. et al. Genetics 2008;178:539-551
FIGURE 1. Diagram of genome reshuffling between 25 diverse founders and the common parent and the resulting 5000 immortal genotypes
Nested Association Mapping (NAM)Combines association mapping with Bi-parental linkage mapping

An aside into segregation distortion con’t
Agro 643 - Relationships and Genetic Diversity – Inbreeding Coefficient
Agro 643 – MAS and Genomic Selection – Genotyping Platforms
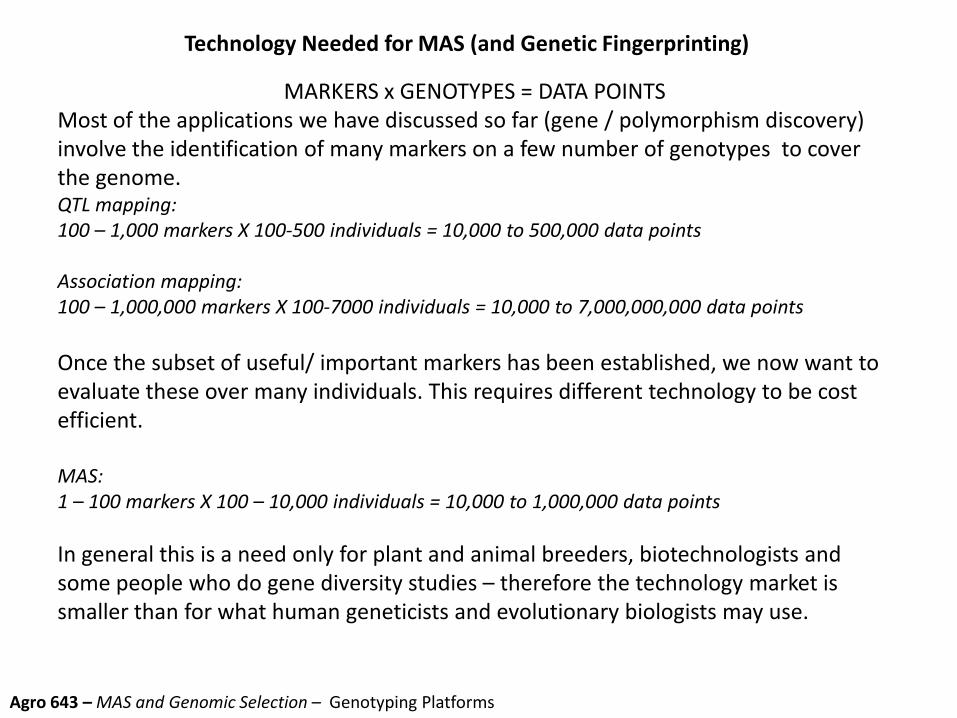
Technology Needed for MAS (and Genetic Fingerprinting)
MARKERS x GENOTYPES = DATA POINTSMost of the applications we have discussed so far (gene / polymorphism discovery) involve the identification of many markers on a few number of genotypes to cover the genome. QTL mapping:100 – 1,000 markers X 100-500 individuals = 10,000 to 500,000 data points
Association mapping:100 – 1,000,000 markers X 100-7000 individuals = 10,000 to 7,000,000,000 data points
Once the subset of useful/ important markers has been established, we now want to evaluate these over many individuals. This requires different technology to be cost efficient.
MAS:1 – 100 markers X 100 – 10,000 individuals = 10,000 to 1,000,000 data points
In general this is a need only for plant and animal breeders, biotechnologists and some people who do gene diversity studies – therefore the technology market is smaller than for what human geneticists and evolutionary biologists may use.
Transition To Use (Linked) Markers to Select for Crop Improvement Traits
Once we find a marker linked to our trait of interest (exp. disease resistance) we can use this marker to make selections rather then screen all of the plants for disease resistance.
This is called Marker Assisted Selection
!!! NOTE: This marker is unlikely to be the point mutation or the gene that gives the disease resistance. It is only LINKED to the disease resistance gene of interest.
Thus: WE DO NOT KNOW WHICH GENE CAUSES THE DISEASE RESISTANCE WITH THE MARKER, BUT WE CAN MAKE SELECTIONS FOR DISEASE RESISTANT PLANTS BASED ON THE MARKER.