monitoring at the lorraine mine site: a follow up on the remediation
TRANSCRIPT
Presented at the 2001 National Association of Abandoned Mine Land Programs Annual Conference, August 19-22, Athens, Ohio
Monitoring at the Lorraine Mine Site: A Follow-Up on the Remediation Plan
Anne-Marie Dagenais*, Michel Aubertin (*also URSTM, Rouyn-Noranda (Qué)) Dept. CGM, École Polytechnique, CP 6079 Centre-Ville, Montréal (Qué) H3C 3A7
Bruno Bussière
UQAT-URSTM 445, boul. De L’Université, Rouyn-Noranda (Qué) J9X 5E4
Louis Bernier Géoberex Recherche, 236, 24e Avenue Ile Perrot (Qué) J7V 4M9
Johanne Cyr
MRN, 5700, 4e Avenue Ouest (A-213), Charlesbourg (Qué) G1H 6R1
ABSTRACT The Lorraine mine site, located in the Témiscamingue region, Québec, Canada, was operated from 1964 to 1968, generating approximately 600,000 tons of tailings disposed in a pond area making 15.5 hectares. These tailings, exposed to atmospheric conditions for 30 years, have oxidized and are generating acid seepage. In 1998, the Québec Ministry of Natural Resources (MRN), who owns the site, decided to do rehabilitation work to limit the environmental impact from acid mine drainage. A five steps remediation program was commissioned in 1998 and consisted of: 1) remodeling the tailings area, 2) construction of a layered cover with capillary barrier effects (CCBE) over the reactive tailings, 3) construction of limestone drains at the final effluent, 4) soil quality improvement outside tailings area, and 5) implementation of a monitoring program. The purpose of the CCBE, which constitute the main expenditure, is to limit the infiltration of oxygen and water to the reactive mine tailings. After construction of the cover, instruments were installed on site to monitor the CCBE performance and assess the evolution of water quality. The authors present in this paper the results from two years of monitoring at this site. INTRODUCTION Many old mine sites across Canada have been abandoned without implementation of a proper closure plan over the years and some of them have become a source of environmental concerns. Such was the case with the Lorraine mine site, which is located in the Gaboury township, in the Temiscamingue region, Québec, Canada. The closest town is Latulippe, approximately 15 km away by route 382. Figure 1 shows the site location. The main ore minerals mined from 1964 to 1968 were chalcopyrite and pentlandite. About 600 000 tons of ore was treated at the mill, generating approximately the same amount of tailings (Lavergne, 1985). The tailings thickness ranges from a few centimeters up to 6 meters in the pond area which covers approximately 15.5

Figure 1: Lorraine mine site location (Fontaine, 1999).
hectares. There was little work done for closure at the end of the operation and the abandoned tailings were left exposed for 30 years. The tailings were deposited in a shallow valley that drains to the south into nearby Lett creek. There are hills to the north and east of the tailings pond and the original surface slopes gently to the south. The soil above the rock is primarily a glacio-fluvial till, less than 2 m thick. Results of slug tests conducted in both on and off site observation wells gave a saturated hydraulic conductivity for the soil of 4.3x10⁻⁷ cm/s to 2x10⁻⁶ cm/s and of about 10-6 cm/s for the tailings (Entraco, 1996). The deposition of tailings and the construction of the retention dams to the south modified the groundwater flow pattern. The water table emerges at the northern edge of the site where the tailings are usually underwater. The ground (tailings) is unsaturated near the surface in the central and the southern zone of the site. Figure 2 shows a plan view of the Lorraine site before reclamation work started. In 1994 the ministry of natural resources did an environmental impact study. Although there was little impact from acid mine drainage (AMD), the site was generating acid seepage on the down slopes of the south dam (Entraco, 1996). The tailings in the vadose zone, on the southern part of the site, were the main source of acid water. Seepage from the south dam had pH values ranging from 2.2 to 2.6. Chemical analysis of the seepage was characteristic of AMD, with elevated concentrations (mg/L) of sulphates (3,730-9,190) and metals (Cu = 0.135-0.804; Fe = 838-3,200; Ni = 0.21-9.5; Zn = 0.19-1.0). The thickness of the oxidized zone varies from 0.15 m to 1.2 m and a hardpan layer of jarosite and gypsum is sometime observed beneath it (Aubertin, 1996).
2

Lett creek
Mine buildingsLeachate
contaminated zone
Dikes
0 150 m10050
Scale
Hill
Submerged tailings
Free watersurface
Free watersurface
Free watersurface
Hill
Unsaturated tailings
Figure 2: Plan view of Lorraine mine site before reclamation (Nastev and Aubertin, 2000).
Mineralogical analyses of fresh and oxidized tailings were done by Bernier (1996) using X-ray diffraction, microscopic observation and electron microprobe analysis. Acid base accounting (ABA) analysis was also carried out on fresh samples. The ABA tests gave a NP of 49 kg CaCO3 eq/t and an AP of 223 kg CaCO3 eq/t. The tailings are thus acid generating having a negative net neutralization potential of –174 kg CaCO3 eq/t. The low neutralization potential is due to a lack of reactive carbonate minerals and the abundance of less reactive silicate minerals in the tailings. Following the environmental impact study and tailings characterization, the Québec Ministry of Natural Resources decided in 1997 to proceed with a reclamation program. Studies of various cover scenarios (water cover, organic cover, compacted clay cover) demonstrated the feasibility of using a cover with capillary barrier effects (CCBE) to limit the influx of oxygen to the reactive tailings (Aubertin, 1996). Numerical analyses were performed to address specific questions related to the final design of the cover; the details can be found in Nastev (1998) and Nastev and Aubertin (2000). The rehabilitation program included remodeling the tailings area, construction of a CCBE over the reactive tailings, construction of limestone drains at the final effluent, soil quality improvement outside tailings area, and implementation of a monitoring program. The construction started in summer of 1998 and was completed in the spring of 1999, under the supervision of Dessau-Soprin (Fontaine, 1999). A large part of the work was done in the wintertime, when the ground was frozen, so that the heavy equipment could travel on the
3
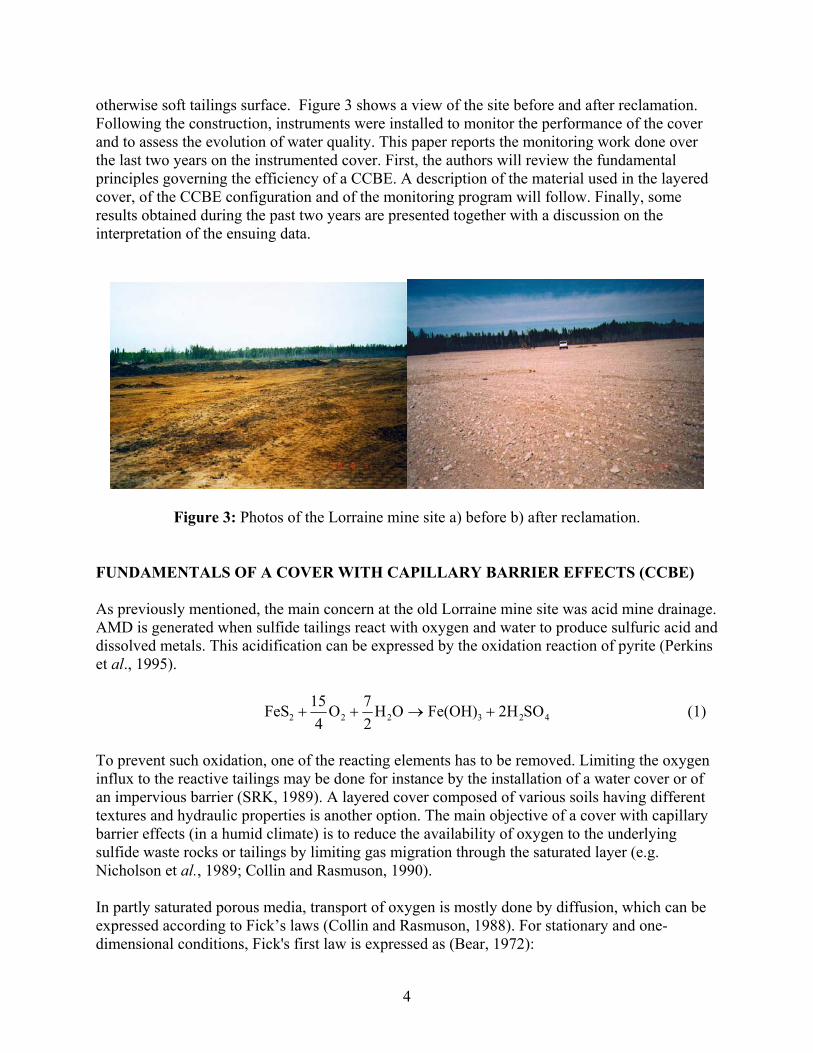
otherwise soft tailings surface. Figure 3 shows a view of the site before and after reclamation. Following the construction, instruments were installed to monitor the performance of the cover and to assess the evolution of water quality. This paper reports the monitoring work done over the last two years on the instrumented cover. First, the authors will review the fundamental principles governing the efficiency of a CCBE. A description of the material used in the layered cover, of the CCBE configuration and of the monitoring program will follow. Finally, some results obtained during the past two years are presented together with a discussion on the interpretation of the ensuing data.
Figure 3: Photos of the Lorraine mine site a) before b) after reclamation. FUNDAMENTALS OF A COVER WITH CAPILLARY BARRIER EFFECTS (CCBE) As previously mentioned, the main concern at the old Lorraine mine site was acid mine drainage. AMD is generated when sulfide tailings react with oxygen and water to produce sulfuric acid and dissolved metals. This acidification can be expressed by the oxidation reaction of pyrite (Perkins et al., 1995).
423222 SO2HFe(OH)OH27O
415FeS +→++ (1)
To prevent such oxidation, one of the reacting elements has to be removed. Limiting the oxygen influx to the reactive tailings may be done for instance by the installation of a water cover or of an impervious barrier (SRK, 1989). A layered cover composed of various soils having different textures and hydraulic properties is another option. The main objective of a cover with capillary barrier effects (in a humid climate) is to reduce the availability of oxygen to the underlying sulfide waste rocks or tailings by limiting gas migration through the saturated layer (e.g. Nicholson et al., 1989; Collin and Rasmuson, 1990). In partly saturated porous media, transport of oxygen is mostly done by diffusion, which can be expressed according to Fick’s laws (Collin and Rasmuson, 1988). For stationary and one-dimensional conditions, Fick's first law is expressed as (Bear, 1972):
4

( ) ( )ztCDtF eg ∂
∂−= (2)
where Fg(t) is the diffusive flux of gas (g/m2s), C(t) is the gas concentration (g/m3) in the gaseous phase at time t (s), z is the depth (m), and De is the effective diffusion coefficient (m2/s). The negative sign indicates that the element diffuses from a high concentration region to a low concentration region. The coefficient De is a material property that represents the ease with which a gas can flow through this material. Studies have shown that the effective diffusion coefficient can be related to the soil porosity n and it's degree of saturation Sr (Millington and Shearer, 1971; Collin and Rasmuson, 1988). Figure 4 shows the Collin and Rasmuson (1988) model (De versus Sr) and experimental values obtained on various materials at slightly different porosities (taken from Aubertin et al, 1999a; 2000). The Collin and Rasmuson (1988) model takes into account diffusion in gaseous phase and in aqueous phase. This model can be written as: (3) [ ] y2
r2
row
x2r
2r
oae )nS(SHD)S1(n)S1(DD +−−=
where is the oxygen diffusion coefficient in air (1,8x10o
aD -5 m2/s), is the oxygen diffusion coefficient in water (2,5x10
owD
-9 m2/s), H is the Henry equilibrium constant (0,03 for oxygen at 20°C) and x and y are fitted parameters. Previous work has shown that the effective diffusion coefficient through a fine grained saturated soil can be lower than that of water (Collin and Rasmuson, 1990; Yanful 1993; Aubertin et al., 1995; 1997a; 1999a; Aachib, 1997). If a material is dry, the gas flux passes almost entirely in the gaseous phase. As the soil water content rises above 85% to 90%, the gaseous phase becomes discontinuous and the element must diffuse in the aqueous phase. In Figure 4, one can observe a difference of approximately four orders of magnitude between diffusion in gaseous phase (for dry state) and in aqueous phase (for saturated state). Since the flux is proportional to De, a low effective diffusion coefficient leads to a low gas flux. For a soil near saturation, the value of De will be in the order of 10-9 m2/s.
Figure 4: Relation between De and Sr using the Collin and Rasmuson model (1988), with
experimental data taken from Aubertin et al (1999a, 2000).
5

To maintain a high degree of saturation in a cover layer, one can use the capillary barrier effect that appears when a fine grained soil is placed over a coarse grained soil (Nicholson et al., 1989; 1991; Aubertin et al.,1995; 1996a; 1997a). Figure 5 shows a section through a typical cover with capillary barrier effects. This cover has five layers, which is the current trend, but in practice the number of layers could vary from 1 to 10 (depending on the specific purposes and exposure conditions of the cover). In such a system, each layer has one or more functions to perform (e.g. Aubertin et al, 1995; Aachib, 1997).
Surface layer
Protection layer
Drainage layer
Moisture retaining layer
Support layer
Tailings
Figure 5. Typical configuration of a CCBE used to limit the production of AMD (Aubertin et al 1995)
This layered cover uses contrast in hydraulic properties between two materials to restrict vertical water flow at their interface (Rasmuson and Erikson, 1986). For example, if we superpose a fine soil over a coarse soil which have the properties shown in Figure 6, the unsaturated hydraulic conductivity for the coarse material can become lower than the one for the fine grained soil at a given suction (negative water pressure above the water table). When suction ψ is increased, the coarse material drains rapidly until it reaches its residual water content, while the fine material can remain close to saturation. The unsaturated hydraulic conductivity of the easily drained coarse grained soil can then decrease below that of the fine grained soil. This restricts the downward flow of water, and in turn, helps to maintain a high degree of saturation in the fine soil layer. A more detailed description of capillary barrier effects can be found in Morel-Seytoux (1992), Aubertin et al. (1995, 1996a), Aachib (1997) and Bussière et al. (1997). In the case of a layered cover such as shown in Figure 5, capillary barrier effects are present on both sides of the fine grained layer which should remains near saturation at all times. The coarse grained soil placed over the fine grained soil limits upward capillary rise and can also prevent evaporation from affecting the fine soil. The coarse soil placed underneath the fine soil acts like an impervious barrier (because of its low unsaturated hydraulic conductivity) which prevents
6
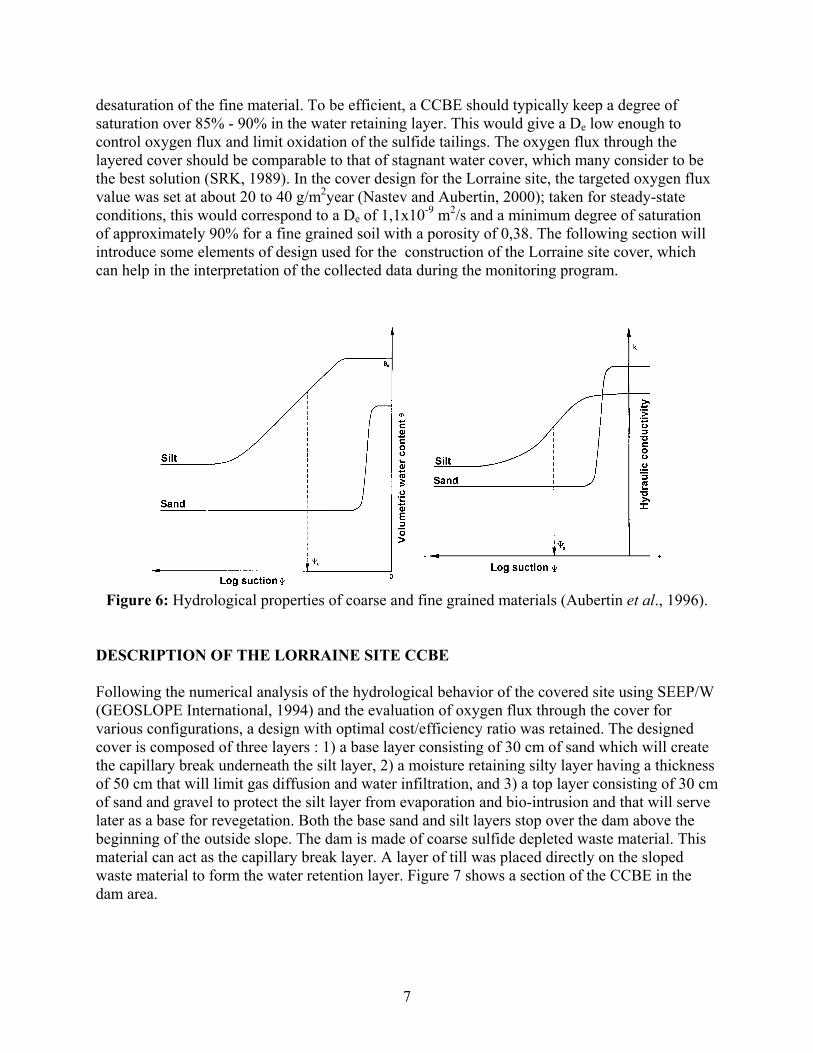
desaturation of the fine material. To be efficient, a CCBE should typically keep a degree of saturation over 85% - 90% in the water retaining layer. This would give a De low enough to control oxygen flux and limit oxidation of the sulfide tailings. The oxygen flux through the layered cover should be comparable to that of stagnant water cover, which many consider to be the best solution (SRK, 1989). In the cover design for the Lorraine site, the targeted oxygen flux value was set at about 20 to 40 g/m2year (Nastev and Aubertin, 2000); taken for steady-state conditions, this would correspond to a De of 1,1x10⁻⁹ m2/s and a minimum degree of saturation of approximately 90% for a fine grained soil with a porosity of 0,38. The following section will introduce some elements of design used for the construction of the Lorraine site cover, which can help in the interpretation of the collected data during the monitoring program.
Figure 6: Hydrological properties of coarse and fine grained materials (Aubertin et al., 1996).
DESCRIPTION OF THE LORRAINE SITE CCBE Following the numerical analysis of the hydrological behavior of the covered site using SEEP/W (GEOSLOPE International, 1994) and the evaluation of oxygen flux through the cover for various configurations, a design with optimal cost/efficiency ratio was retained. The designed cover is composed of three layers : 1) a base layer consisting of 30 cm of sand which will create the capillary break underneath the silt layer, 2) a moisture retaining silty layer having a thickness of 50 cm that will limit gas diffusion and water infiltration, and 3) a top layer consisting of 30 cm of sand and gravel to protect the silt layer from evaporation and bio-intrusion and that will serve later as a base for revegetation. Both the base sand and silt layers stop over the dam above the beginning of the outside slope. The dam is made of coarse sulfide depleted waste material. This material can act as the capillary break layer. A layer of till was placed directly on the sloped waste material to form the water retention layer. Figure 7 shows a section of the CCBE in the dam area.
7

Figure 7: Cross section of the Lorraine CCBE adjacent to the dam (Fontaine, 1999). The different materials used to build the cover have been tested in the laboratory. Table 1 presents the properties for the sand used in both bottom and top granular layers and those of the silt used as the moisture retention layer. According to the USCS classification (Bowles, 1984), the material in the moisture-retaining layer is a non plastic inorganic silt (ML) and the granular material is a uniform sand (SP). Laboratory compaction tests gave a mean optimum dry density of 1826 kg/m3 for the silt and 1778 kg/m3 for the sand; the mean optimum water content is 14.6% for the silt and 16% for the sand. The controlling criterion for construction of the CCBE was to obtain 90% of the optimum dry density (for the silt layer). Criteria were also set for the grain size of materials used in the different layers. For example, 70 to 100 % of the soil composing the water retention layer had to pass the number 200 sieve, and 100 % of that soil had to pass the number 4 sieve. Suction tests done on the silt material gave an air entry value (AEV) ranging from 2,9 to 5 m of water for a void ratio between 0,62 and 0,85. The AEV is the pressure at which a material begins to desaturate.
Table 1. Properties of materials used in the CCBE from preconstruction laboratory tests.
Properties Silt Sand
D10 (mm) 0,001 to 0,0021 0,06 to 0,15 Cu 5,1 to 7,1 2,5 to 3,33 Gs 2,76 2,70 ρdmax (kg/m3) 1 724 to 1 928 1 778 wopt (%) 10,6 to 18,5 16 Hydraulic conductivity (cm/s) 2,15x10⁻⁶ to 1,06x10⁻⁵
(e from 0,619 to 0,923) 7,238x10-3 (e = 0,625)
Suction at 90% saturation (m of water) (≈ AEV)
2,9 to 5 (e from 0,617 to 0,85)
0,245 (e = 0,62)
Effective diffusion coefficient (m2/s)
3,07x10⁻⁹
(Sr = 91, e = 0,637) -
8
0 0.1 0.2 0.3 0.4 0.5
Volumetric water content
Sand
SiltTailings
a)
0.1
1
10
100
1000
Suct
ion
(kPa
)
Tailings
-12 -10 -8 -6 -4 -2
Hydraulic conductivity (m/s)
Sand
Silt
b)
0.1
1
10
100
1000
Suct
ion
(kPa
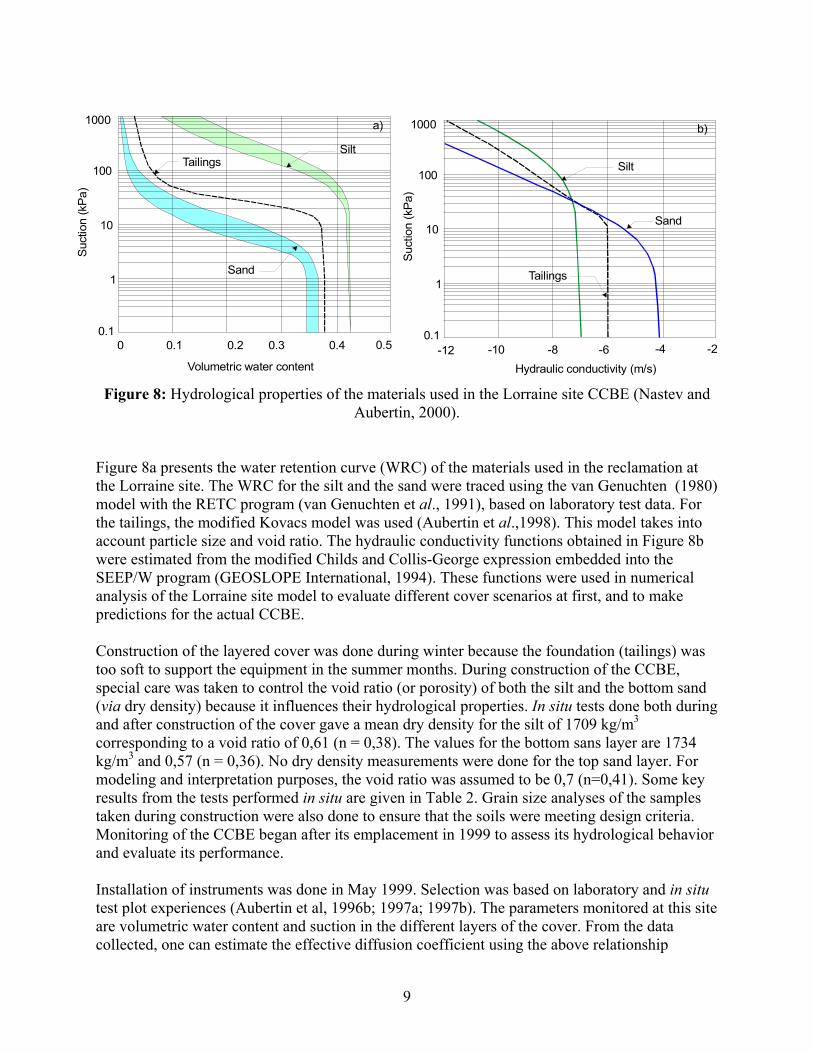
)Figure 8: Hydrological properties of the materials used in the Lorraine site CCBE (Nastev and
Aubertin, 2000). Figure 8a presents the water retention curve (WRC) of the materials used in the reclamation at the Lorraine site. The WRC for the silt and the sand were traced using the van Genuchten (1980) model with the RETC program (van Genuchten et al., 1991), based on laboratory test data. For the tailings, the modified Kovacs model was used (Aubertin et al.,1998). This model takes into account particle size and void ratio. The hydraulic conductivity functions obtained in Figure 8b were estimated from the modified Childs and Collis-George expression embedded into the SEEP/W program (GEOSLOPE International, 1994). These functions were used in numerical analysis of the Lorraine site model to evaluate different cover scenarios at first, and to make predictions for the actual CCBE. Construction of the layered cover was done during winter because the foundation (tailings) was too soft to support the equipment in the summer months. During construction of the CCBE, special care was taken to control the void ratio (or porosity) of both the silt and the bottom sand (via dry density) because it influences their hydrological properties. In situ tests done both during and after construction of the cover gave a mean dry density for the silt of 1709 kg/m3 corresponding to a void ratio of 0,61 (n = 0,38). The values for the bottom sans layer are 1734 kg/m3 and 0,57 (n = 0,36). No dry density measurements were done for the top sand layer. For modeling and interpretation purposes, the void ratio was assumed to be 0,7 (n=0,41). Some key results from the tests performed in situ are given in Table 2. Grain size analyses of the samples taken during construction were also done to ensure that the soils were meeting design criteria. Monitoring of the CCBE began after its emplacement in 1999 to assess its hydrological behavior and evaluate its performance. Installation of instruments was done in May 1999. Selection was based on laboratory and in situ test plot experiences (Aubertin et al, 1996b; 1997a; 1997b). The parameters monitored at this site are volumetric water content and suction in the different layers of the cover. From the data collected, one can estimate the effective diffusion coefficient using the above relationship
9

Table 2. Dry density of bottom sand and silt layers in the CCBE
Sector Compaction degree ρd e
Sector A – silt 93% 1,672 0,64 Sector B – silt 89% 1,623 0,69 Sector C – silt 87% 1,549 0,77 Station B-5 – silt 92% 1,762 0,55 Station A-4 – silt 95% 1,821 0,50 Station B-7 – silt 92% 1,771 0,54 Between observation well 3 and 4 – silt
92% 1,767 0,55
Sector A – sand 96% 1,824 0,49 Sector B – sand 90% 1,688 0,61 Sector C – sand 88% 1,690 0,61
between the material De, porosity and water content. Installation of observation wells on site provide information on the evolution of the piezometric surface position, and allow sampling of interstitial water in tailings and of water at the entry of the limestone drains. The performance of the limestone drains will not be discussed here, but information on this aspect can be found in Aubertin et al. (1999b) and Bernier et al. (2000). Figure 9 shows a plan view of the cover with all of the instrumented stations and a section through the cover with the different instruments. In total, twenty monitoring stations having a fifty meter spacing were installed along three lines crossing the tailings pond area. Line A runs east west, line B runs north south and line C covers a humid area where the water level is usually fairly high. Each station includes four TDR probes to measure volumetric water content and four Watermark ceramic probes to measure suction. A set of each instrument was placed horizontally in the sand layers and 2 sets in the silt layer. After one winter, almost all stations were still operating well. As for the observation wells, one of them (PO-6), located near the south dam (where water level is low), samples pore water near the piezometric surface which is considered representative of the oxidation conditions prevailing in the vadose zone. Data collected for the past two years is presented in the next section. RESULTS AND INTERPRETATION The results obtained during the monitoring program allow an evaluation of the cover performance reducing of oxygen flux to the sulfide tailings, and it’s efficiency in inhibiting acid mine drainage. Monthly field measurements have been taken for the last 2 years. During the winter, water freezes in the soil and there is no oxygen diffusion or tailings oxidation. The snowmelt following the winter permits the silt layer to fully recharge with water. Readings taken during the summer of 2000 are thus more representative of the expected hydrological behavior of the cover. During the summer of 1999, following the layered cover’s construction, the silt layer had not yet been saturated and was still recharging with water. Nonetheless, data from TDR and Watermark probes for both years are presented, followed by results obtained from the
10

Figure 9: Plan view after reclamation of the Lorraine site showing the location of the
instruments. observation well PO-6. Then a preliminary interpretation of the data is given with an evaluation of the cover performance. Hydrological behavior As previously mentioned, the main objective of the Lorraine site CCBE is to limit the oxygen diffusion flux to the reactive tailings by maintaining the fine grained soil layer close to saturation. High water content in the retention layer is achieved by using capillary barrier effects. To create this effect, the sand underneath the silt has to easily drain itself, which will lower its hydraulic conductivity and restrict water flow at the silt – sand interface. In this case, what should be observed in the field is a low water content in both sand layers and a high water content in the silt layer (for a cover well above the water table). When the sand drains, the suctions should correspond to the material residual water content. As for the silt, the suction measured shouldn’t exceed its air entry value. In the northern part of the cover, the water level has remained very high for the two years of monitoring. It has even occasionally risen to the base of the silt layer. Because of the high water level, water content in the bottom sand layer is high and the capillary barrier effects are more or less present. This type of behavior is observed at stations A-1 to A-5, B-1 to B-4 and C-1 to C-3.
11

This however does not reduce the cover efficiency as the silt layer remains close to saturation by retaining capillary water taken directly from the phreatic zone. Figure 10 shows values of saturation (obtained by multiplying volumetric water content measured on the field by the field porosity for each layer) and suction through time for station A-4. Measurements taken at this station are representative of what is observed in the CCBE’s northern section, for the years 1999 and 2000. Suctions measured in this area are low, except for the upper sand layer where they attained 16 kPa in august 1999, due to evaporation during a dry spell. The degree of saturation corresponding to these readings range from 75 to 90% for the lower sand layer and exceeds 90% for the silt layer. In the upper sand layer, saturation varies between 20 to 40%. The high degree of saturation observed in the silt and in the lower sand layer efficiently reduces the influx of oxygen to the tailings and controls oxidation.
S tation A-40
0,2
0,4
0,6
0,8
10 0,2 0,4 0,6 0,8 1
de gre e of saturation
dept
h (m
)
5-May-99 9-Jun-99 6-Jul-99 11-Aug-99 30-Aug-9913-Sep-99 4-Oct-99 2-May-00 12-Jun-00 3-Jul-001-Aug-00 26-Sep-00 25-Oct-00
Upper sand
Silt
Lower sand
S tation A-4
0
0,2
0,4
0,6
0,8
10 5 10 15 20
suction (kPa)
dept
h (m
)
5-May-99 9-Jun-99 6-Jul-99 11-Aug-9930-Aug-99 13-Sep-99 4-Oct-99 12-Jun-003-Jul-00 1-Aug-00 26-Sep-00 25-Oct-00
Upper sand
Silt
Lower sand
Figure 10: Saturation and suction profiles for station A-4.
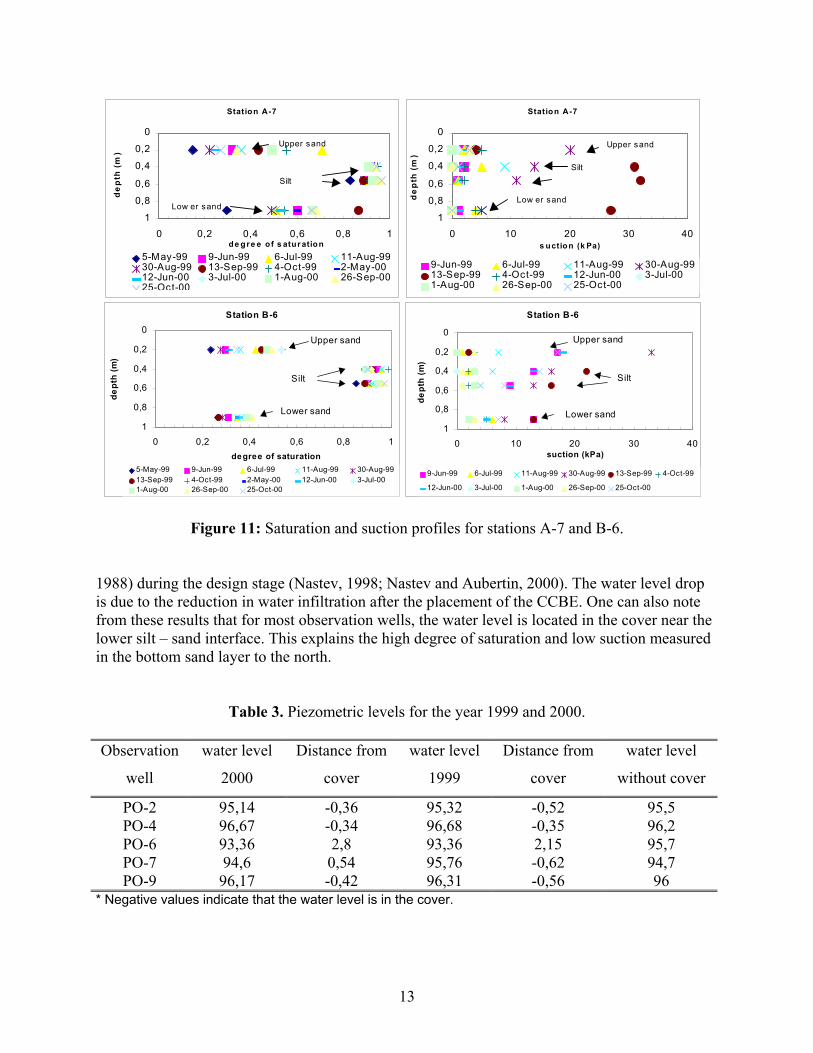
Stations A-7 and B-6 in Figure 11 are representative of measurements taken at locations in the cover where the capillary barrier effects are active. At these stations, the water level is below the cover, in the tailings. The figure shows that suction values measured in both sand layers are high enough for this material to drain. The degree of saturation in the bottom sand layer is between 20 to 40%. The sand hydraulic conductivity corresponding to this water content is low and restricts downward flow from the silt above. The figure shows that the degree of saturation of the silt remains over 90% even when relatively high suctions are measured in it; this is because suction usually remains below the AEV of the silt. The high degree of saturation in the silt layer effectively limits oxygen flux to the tailings. Hence, the hydrological behavior deduced from the monitoring confirms that the capillary barrier effects are present and working as designed. Water quality Water samples collected in the observation wells both on and off the site gave information on the evolution of water quality. Piezometric levels were also recorded and are reported in Table 3. Values for the last two years can be compared to those taken before the reclamation work. From the yearly mean values, one can see a slowly dropping trend in water level. This trend was anticipated by the numerical analysis performed with MODFLOW (McDonald and Harbaugh,
12
Station A-7
0
0,2
0,4
0,6
0,8
10 0,2 0,4 0,6 0,8 1
de gre e of s atur ation
dep
th (m
)
5-May-99 9-Jun-99 6-Jul-99 11-Aug-9930-Aug-99 13-Sep-99 4-Oct-99 2-May-0012-Jun-00 3-Jul-00 1-Aug-00 26-Sep-0025-Oct-00
Silt
Upper sand
Low er sand
Station A-7
0
0,2
0,4
0,6
0,8
10 10 20 30 4
s uction (k Pa)
dep
th (m
)
9-Jun-99 6-Jul-99 11-Aug-99 30-Aug-9913-Sep-99 4-Oct-99 12-Jun-00 3-Jul-001-Aug-00 26-Sep-00 25-Oct-00
Silt
Upper sand
Low er sand
0
Station B-60
0,2
0,4
0,6
0,8
10 0,2 0,4 0,6 0,8 1
degree of saturation
dept
h (m
)
5-May-99 9-Jun-99 6-Jul-99 11-Aug-99 30-Aug-9913-Sep-99 4-Oct-99 2-May-00 12-Jun-00 3-Jul-001-Aug-00 26-Sep-00 25-Oct-00
Lower sand
Silt
Upper sand
Station B-6
0
0,2
0,4
0,6
0,8
10 10 20 30 4
suction (kPa)
dept
h (m
)
9-Jun-99 6-Jul-99 11-Aug-99 30-Aug-99 13-Sep-99 4-Oct-99
12-Jun-00 3-Jul-00 1-Aug-00 26-Sep-00 25-Oct-00
Upper sand
Silt
Lower sand
0
Figure 11: Saturation and suction profiles for stations A-7 and B-6.
1988) during the design stage (Nastev, 1998; Nastev and Aubertin, 2000). The water level drop is due to the reduction in water infiltration after the placement of the CCBE. One can also note from these results that for most observation wells, the water level is located in the cover near the lower silt – sand interface. This explains the high degree of saturation and low suction measured in the bottom sand layer to the north.
Table 3. Piezometric levels for the year 1999 and 2000.
Observation
well
water level
2000
Distance from
cover
water level
1999
Distance from
cover
water level
without cover
PO-2 95,14 -0,36 95,32 -0,52 95,5 PO-4 96,67 -0,34 96,68 -0,35 96,2 PO-6 93,36 2,8 93,36 2,15 95,7 PO-7 94,6 0,54 95,76 -0,62 94,7 PO-9 96,17 -0,42 96,31 -0,56 96
* Negative values indicate that the water level is in the cover.
13

0
1
2
3
4
5
6
03-99 08-99 12-99 04-00 08-00 12-00
date
pH
0100020003000400050006000700080009000
03-99 08-99 12-99 04-00 08-00 12-00
date
cond
uctiv
ity (u
S/cm
)0
5000
10000
15000
20000
25000
03-99 08-99 12-99 04-00 08-00 12-00
date
SO42-
(mg/
L)
0
5001000
15002000
2500
30003500
4000
03-99 08-99 12-99 04-00 08-00 12-00
date
Fe (m
g/L)
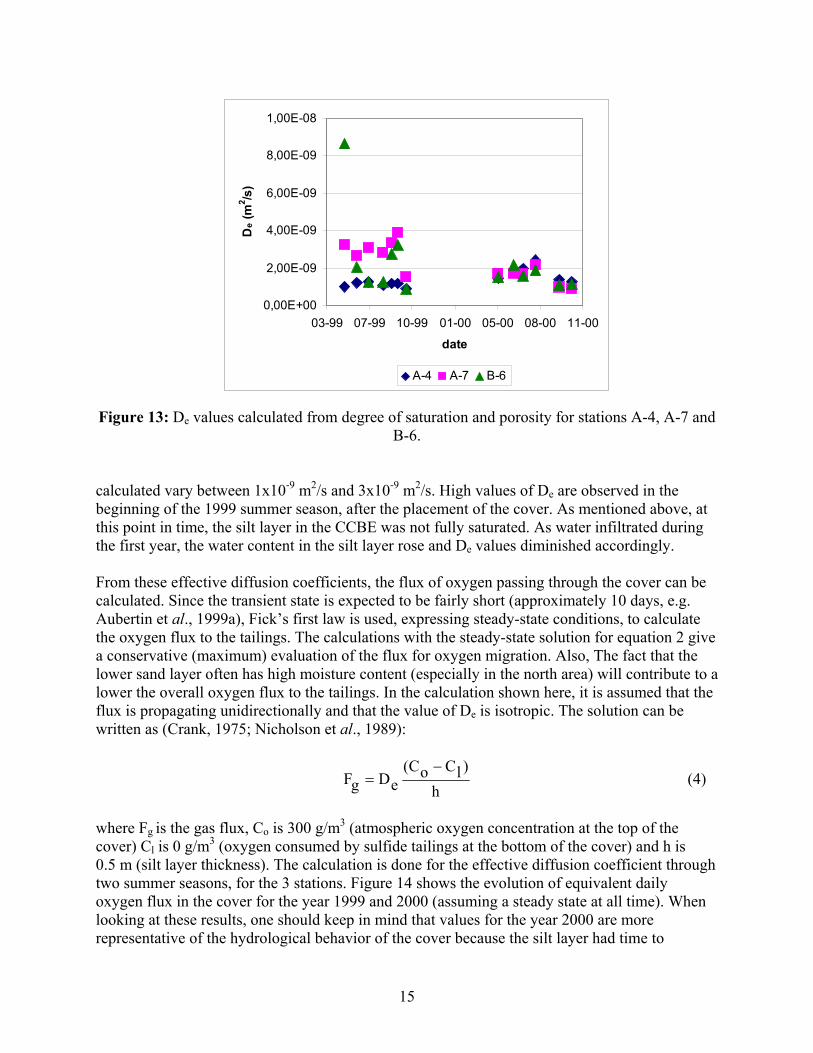
Figure 12: Evolution of pH, conductivity, sulfates and iron at observation well PO-6. As mentioned before, one of the observation well PO-6 provide representative results for the evolution of AMD characteristics at the Lorraine site. Figure 12 shows the evolution of the parameters related to sulfide oxidation. Since the installation of the cover, water pH has been slowly rising, from 3 to 5. This trend is more noticeable for the year 2000. A small drop was observed in electric conductivity measurements, which relates to a decrease in secondary minerals dissolution. This is confirmed by lower measurements of sulfate and iron concentrations in sampled water. These trends seem to indicate a diminution in the rate of oxidation caused by the limited availability of oxygen. At this time, the tailings pore water still contains relatively high dissolved metals content and is treated by the limestone drains at the base of the dams (e.g. Aubertin et al., 1999b; Bernier et al., 2000). Estimates of oxygen fluxes The effective diffusion coefficient of a material can be estimated on the basis of its degree of saturation and porosity, by using semi-empirical models like that of Collin and Rasmuson (1988). This type of calculation was done with the data from the Lorraine site. Here, one can consider only the values for the silt assuming that diffusion in the drained sand layers is not impeded by the low water content (a conservative assumption). Since the silt layer contains two TDR probes, the effective diffusion coefficient for a given station is taken as the harmonic mean of the De calculated for each TDR reading at this station (Aubertin et al., 2000). Figure 13 shows the variation in De values calculated through time for stations A-4, A-7 and B-6. The values
14
0,00E+00
2,00E-09
4,00E-09
6,00E-09
8,00E-09
1,00E-08
03-99 07-99 10-99 01-00 05-00 08-00 11-00
date
De (
m2 /s
)
A-4 A-7 B-6
Figure 13: De values calculated from degree of saturation and porosity for stations A-4, A-7 and
B-6. calculated vary between 1x10⁻⁹ m2/s and 3x10⁻⁹ m2/s. High values of De are observed in the beginning of the 1999 summer season, after the placement of the cover. As mentioned above, at this point in time, the silt layer in the CCBE was not fully saturated. As water infiltrated during the first year, the water content in the silt layer rose and De values diminished accordingly. From these effective diffusion coefficients, the flux of oxygen passing through the cover can be calculated. Since the transient state is expected to be fairly short (approximately 10 days, e.g. Aubertin et al., 1999a), Fick’s first law is used, expressing steady-state conditions, to calculate the oxygen flux to the tailings. The calculations with the steady-state solution for equation 2 give a conservative (maximum) evaluation of the flux for oxygen migration. Also, The fact that the lower sand layer often has high moisture content (especially in the north area) will contribute to a lower the overall oxygen flux to the tailings. In the calculation shown here, it is assumed that the flux is propagating unidirectionally and that the value of De is isotropic. The solution can be written as (Crank, 1975; Nicholson et al., 1989):
h
)lCoC(eDgF
−= (4)
where Fg is the gas flux, Co is 300 g/m3 (atmospheric oxygen concentration at the top of the cover) Cl is 0 g/m3 (oxygen consumed by sulfide tailings at the bottom of the cover) and h is 0.5 m (silt layer thickness). The calculation is done for the effective diffusion coefficient through two summer seasons, for the 3 stations. Figure 14 shows the evolution of equivalent daily oxygen flux in the cover for the year 1999 and 2000 (assuming a steady state at all time). When looking at these results, one should keep in mind that values for the year 2000 are more representative of the hydrological behavior of the cover because the silt layer had time to
15

0
0,1
0,2
0,3
0,4
0,5
03-99 10-99 05-00 11-00
Date
Flux
(g/m
2 day)
A-4 A-7 B-6 design flux
Figure 14: Estimated maximum daily oxygen flux through the CCBE at stations A-4, A-7 and
B-6. recharge with water from precipitation infiltration and annual snowmelt. Figure 14 shows a diminution in oxygen flux for the year 2000. As the cover replenished with water the second year, the coefficient De was reduced, which in turn lowered the oxygen flux through the cover. Calculated flux (maximum values) for the second year varies in the targeted range of 20 to 40 g/m2year (or about 1 mol/m2year), used for the CCBE design. The total gas flux for stations A-4, A-7 and B-6 for the year 2000 (calculated from April 1st to the end of October) are ranging from 15.5 to 17.5 g/m2year, which is below the design criterion. These values show the ability of the cover to efficiently limit oxygen diffusion. CONCLUSION The old Lorraine mine site was the subject of reclamation work in 1998-1999. The course of action chosen after studying different cover scenarios was the construction of a cover with capillary barrier effects (CCBE). This type of cover limits oxygen diffusion and water infiltration to the tailings by maintaining a fine grained layer, placed between 2 coarse material layers, near saturation using capillary barrier effects. A numerical analyses based on hydrogeological properties of borrowed soils was helpful in selecting the final design which consists of a 30 cm base layer made of sand, overlaid by a 50 cm silt layer acting as the moisture retention layer. The latter is covered by a 30 cm sand drainage layer that also prevents evaporation in the silt layer. After construction, the cover was instrumented to assess its hydrological behavior. Observation wells were installed to monitor the evolution of water quality and water level. The results show that where needed in the southern part of the CCBE, the capillary barrier effects are present in the cover. Measurements taken with the TDR probes show that the lower and upper sand layers can easily drain (when the water table is low) and that the silt can maintain a high degree of
16
saturation at all time. The suction transmitted from the sand to the silt is lower than the silt pressure at the onset of desaturation (AEV). These high measured water content values indicate that the oxygen diffusion occurring in the aqueous and in the gaseous phases will be impeded. Calculating the effective diffusion coefficient of the silt using a relation between De, porosity and water content, values between 1x10⁻⁹ m2/s and 3x10⁻⁹ m2/s were obtained for most stations on the site. These low values confirm the ability of the cover to limit gas migration since the oxygen flux is proportional to De. Estimates of the oxygen flux using a steady-state solution to Fick’s first law show that the values calculated for the whole 2000 year vary between 15.5 and 17.5 g/m2year (stations A-4, A-7 and B-6), which is below the 20 g/m2year value initially set as the design objective. Monitoring of the water quality apparently concurs with the reduction of the oxidation rate by limiting the availability of oxygen and AMD generation from reactive tailings oxidation. ACKOWLEDGEMENTS The authors would like to thank Claude Dufour and Louis Bienvenu of the MRN for their contribution to the project and Antonio Gatien, Hugues Bordeleau and Darcy Jolette for the laboratory and fieldwork. COREM performed the water analysis. REFERENCES AACHIB, M. (1997). Étude en laboratoire de la performance des barrières de recouvrement
constituées de rejets miniers pour limiter le DMA. Thèse de doctorat, École Polytechnique de Montéal, Montréal, Québec.
AUBERTIN, M. (1996). Recouvrement multicouche pour le parc à résidus du site minier Lorraine. Rapport soumis au MRNQ (SDM-R-96-23). 30 p.
AUBERTIN, M., AACHIB, M., AUTHIER, K. 2000. Evaluation of diffusive gas flux through covers with a GCL. Geotextiles and Geomembranes, vol. 18, p. 215-233.
AUBERTIN, M., AACHIB, M., MONZON, M., JOANES, A.-M., BUSSIÈRE, B., CHAPUIS, R.P. (1997a). Étude de laboratoire sur l'efficacité des barrières de recouvrement construites à partir de résidus miniers. Projet CDT 1899-3. Projet NEDEM/MEND 2.22.2b, Canmet, Ottawa.
AUBERTIN, M., AUTHIER, K., JOANES, A.-M., MONZON, M., AACHIB, M. (1999a). Gas diffusion through a GCL. Geosynthtics ’99 Conference Proceedings, Boston (CD-Rom).
AUBERTIN, M., BUSSIÈRE, B., AACHIB, M., CHAPUIS, R.P. (1996a). Une modélisation numérique des écoulements non saturés dans des couvertures multicouches en sols. Hydrogéologie, vol. 1, p. 3-13.
AUBERTIN, M., BUSSIÈRE, B., BARBERA, J.-M., CHAPUIS, R.P., MONZON, M., AACHIB, M. (1997b). Construction and instrumentation of in situ test plots to evaluate covers built with clean tailings. Proc. of the 4th ICARD, Vancouver, vol. 2, p. 715-730.
AUBERTIN, M., BUSSIÈRE, B., JOANES, A.-M., MONZON, M., GAGNON, D., BARBERA, J.-M., BÉDARD, C., CHAPUIS, R.P., BERNIER, L. (1996b). Projet sur les barrières sèches construites à partir de résidus miniers, Phase II: essais en place. Rapport final soumis au MRN, Projet P1899, C.D.T., École Polytechnique, MEND Report 2.22.2c.
17

AUBERTIN, M., CHAPUIS, R.P., AACHIB, M., BUSSIÈRE, B., RICARD, J.-F. AND TREMBLAY, L. (1995). Évaluation en laboratoire de barrières sèches construites à partir de résidus miniers, École Polytechnique MEND Report 2.22.2a. CANMET, Ottawa.
AUBERTIN, M. DAGENAIS, A.M., BUSSIÈRE, B., BERNIER, L. (1999b). Suivi du comportement de la couverture multicouche et des drains calcaires au site Minier Lorraine. Rapports d’avancement. Projet CDT2427.
AUBERTIN, M., RICARD, J.-F., CHAPUIS, R.P. (1998). A predictive model for the water retention curve: application to tailings from hard rock mines. Can. Geotech. J., 35,p. 55-69.
BEAR, J. (1972). Dynamics of fluids in porous media. Dover Publication, N.Y. BERNIER, L. (1996). Rapport d’analyses minéralogiques sur 7 échantillons de résidus miniers,
Mine Lorraine, Témiscamingue, Québec. Géoberex Recherche, 14 p. BERNIER, L., AUBERTIN, M., DAGENAIS, M., BUSSIÈRE, B., BIENVENU, L., CYR, J. (2000).
Limestone drain design criteria in AMD passive treatment : theory, practice and hydrogeochemistry monitoring at Lorraine Mine Site, Temiscamingue. MineSpace 2001, 103rd Annual General Meeting of the Canadian Institute of Mining, Metallurgy and Petroleum, Québec City, Québec, April 29 to May 3, 2001.
BOWLES, J.E. (1984). Physical and geotechnical properties of soils. McGraw Hill. BUSSIÈRE, B., AUBERTIN, M., CHAPUIS, R.P. (1997). Écoulement non saturé à travers les
couvertures avec effets de barrière capillaire (CEBC): Modélisation physique et numérique avec application au drainage minier acide. Report EPM/RT-97/03, École Polytechnique de Montréal.
Crank, J. 1975. The Mathematics of Diffusion. 2nd edition. Clarendon Press, Oxford, United Kingdom.
COLLIN, M., RASMUSON, A. (1990). Mathematical modelling of water and oxygen transport in layered soil covers for deposits of pyritic mine tailings. p. 311-333. In Acid mine drainage:designing for closure. GAC-MAC Annual Meeting.
COLLIN, M., RASMUSON, A. (1988). A comparison of gas diffusivity models for unsaturated media. Soil Sci. Soc. Am. J., vol. 52, p. 1559-1565.
ENTRACO INC. (1996). Conception d’un programme de restauration du site minier Lorraine. Rapport final. 70 p.
FONTAINE, R. (1999). Restauration du site minier Lorraine. Rapport non publié. Dessau-Soprin inc.
GEOSLOPE International (1994). SEEP/W user’s guide, version 3. LAVERGNE, C. (1985). Gîtes minéraux à tonnage évalué et production minérale du Québec.
Ministère de l’Énergie et des ressources. DV 85-08, 76 p. MCDONALD, M.G., HARBAUGH, A.W. (1988). A modular three-dimensional finite-difference
ground-water flow model. U.S.G.S., Water-Resources Investigations. MILLINGTON, R.J., SHEARER, R.C. (1971). Diffusion in aggregated porous media. Soil Science,
vol. 111, p. 372-378. MOREL-SEYTOUX, H.J. (1992). The capillary barrier effect at the interface of two soil layers
with some contrast in properties. HYDROWAR Report 92.4, Hydrology Days Publications, 57 Shelby Lane, Atherton, CA 94027-3926.
NASTEV, M. (1998). Restauration du site minier Lorraine, rapport technique de conception du recouvrement final. Soprin ADS, Montréal, Québec.
18

NASTEV, M., AUBERTIN M., (2000). Hydrogeological modelling for the reclamation work at the Lorraine mine site Québec. Proc. 1st Joint IAH-CNC-CGS Groundwater Specialty Conference, Montreal, p. 311-318.
NICHOLSON, R. V., GILLHAM, R. W., CHERRY, J. A., REARDON, E. J. (1989). Reduction of acid generation in mine tailings through the use of moisture-retaining cover layers as oxygen barriers. Canadian Geotechnical Journal, vol. 26: 1-8.
NICHOLSON, R.V., AKINDUNNI, F.F., SYDOR, R.C., GILLHAM, R.W. (1991). Saturated tailings covers above the water table: the physics and criteria for design. Proc., 2nd Int. Conf. On the Abatement of Acidic Drainage, Montréal, Canada, 16-18 sept., p. 444-460.
PERKINS, E.H., NESBITT, H.W., GUNTER, W.D., ST-ARNAULD, L.C., MYCROFT, J.R. (1995). Critical review of geotechnical processes and geochemical models adaptable for prediction of acidic drainage from waste rock. MEND report 1.42.1, 120 p.
RASMUSSON, A., ERIKSON, J.C. (1986). Capillary barriers in covers for mine tailings dumps. Report 3307, The National Swedish Environmental Protection Board.
SRK (1989). Draft Acid Rock Drainage Technical Guide. BCAMD Task Force vol. 1. YANFUL, E.K. (1993). Oxygen diffusion trough soil covers on sulphidic mine tailings. Journal of
Geotechnical Engineering, vol. 119, p.1207-1228. VAN GENUCHTEN, M. TH. (1980). A closed-form equation for predicting the hydraulic
conductivity of unsaturated soils. Soil Sci. Soc. America J., vol. 44, p. 892-898. VAN GENUCHTEN, M. TH., LEIJ, F.J., YATES S.R. (1991). The RETC code for quantifying the
hydraulic functions of unsaturated soils. U.S. Department of Agriculture, Agricultural Research Service, Rapport EPA/600/2-91/065.
19