monitoring of metabolites and by-products in a down-scaled...
TRANSCRIPT

Institutionen för fysik, kemi och biologi Teknisk Biologi - Industriell bioteknik och produktion
LITH - IFM -A -EX - - 13/2756 - - SE
Monitoring of metabolites and by-products in a
down-scaled industrial lager beer fermentation
Fredrik Sjöström
Supervisor: Robert Gustavsson
Examiner: Carl-Fredrik Mandenius

Abstract
The sugar composition of the wort and how these sugars are utilised by the yeast affects the
organoleptic properties of the beer. To monitor the saccharides in the wort before
inoculation and during fermentation is important in modern brewing industry. Reducing the
duration of the brewing process is valuable and can be achieved by reducing the
fermentation time by an increase in temperature. However, this must be done without
changing the quality and characteristics of the end product, another incitement for proper
monitoring of the wort. During fermentation, brewer´s yeast produces various by-products
that affect the flavour in beer. The temperature has been reported to affect the metabolism
of such compounds. In the present thesis work, monitoring with high performance
chromatography of individual saccharides and ethanol was performed during a down-scaled
industrial lager beer fermentation. Additionally, the effect of temperature on the
fermentation rate was investigated. To determine if the metabolism of by-products was
affected, a few higher alcohols and organic acids were monitored throughout the
fermentation. Monitoring of degrading sugars and the production of ethanol with HPLC
proved to be suitable. It is concluded that the fermentation rate is increased when the
temperature is increased, however, further studies are needed to obtain more decisive
results regarding secondary metabolite formation.

Contents
Introduction ............................................................................................................................................. 1
Aim ...................................................................................................................................................... 1
Work approach .................................................................................................................................... 1
Background .............................................................................................................................................. 2
Overview of the beer production process ........................................................................................... 2
Yeast physiology .................................................................................................................................. 3
Fermentation process of brewer’s yeast ............................................................................................. 4
Sugar consumption .............................................................................................................................. 5
By-products ......................................................................................................................................... 7
Higher alcohols ................................................................................................................................ 7
Esters ............................................................................................................................................... 8
Ketones ............................................................................................................................................ 9
Sulfur compounds ........................................................................................................................... 9
Organic acids ................................................................................................................................. 10
The production process at Åbro Bryggeri .......................................................................................... 11
Wort preparation .......................................................................................................................... 11
Precultivation procedure ............................................................................................................... 11
Fermentation ................................................................................................................................. 11
Downstream process ..................................................................................................................... 11
Materials and methods ......................................................................................................................... 12
Yeast strain and medium ................................................................................................................... 12
Preculture and yeast storage ............................................................................................................ 12
Fermentation conditions ................................................................................................................... 12
Sampling procedure .......................................................................................................................... 12
Analysis .............................................................................................................................................. 13
HPLC ............................................................................................................................................... 13
Spectrophotometer ....................................................................................................................... 13
Biomass dry matter (BDM) analysis .............................................................................................. 13
Hemacytometer ............................................................................................................................. 13
Results and discussion ........................................................................................................................... 14
Biomass analysis ................................................................................................................................ 14
Hemacytometer ............................................................................................................................. 14

BDM and spectrophotometric analysis ......................................................................................... 14
Biomass growth ............................................................................................................................. 14
Wort analysis ..................................................................................................................................... 17
Fermentation rate ............................................................................................................................. 18
Sugar consumption ............................................................................................................................ 23
Higher alcohol formation .................................................................................................................. 27
Organic acid formation ...................................................................................................................... 30
Differences between the industrial process and the lab-scale process ............................................ 34
Down-scaling ................................................................................................................................. 34
Differences in procedures and equipment .................................................................................... 34
Conclusion ............................................................................................................................................. 36
Acknowledgements ............................................................................................................................... 37
References ............................................................................................................................................. 38
Appendix .................................................................................................................................................. 1
Table 4: The analysis results of HPLC measurements of raw wort. .................................................... 1

1
Introduction
Aim The aim of this master thesis was to monitor the degradation of different sugars and the formation of ethanol in brewer’s wort during a down-scaled industrial fermentation process.
In addition, the influence of the temperature on the fermentation performance was investigated. The temperature is an important fermentation variable and there are financial gains to be made in employing a higher fermentation temperature and thereby increasing the fermentation rate. In addition, analysis of quality parameters in the form of secondary metabolites was performed to determine if a change in fermentation temperature would influence the formation of these substances.
Work approach The fermentation in this thesis work was a down-scaled version of the process used at Åbro Bryggeri. The material needed for fermentation was provided by Åbro Bryggeri, as well as the conditions used during the process. The organism used was Saccharomyces pastorianus, a bottom fermenting yeast strain and the medium was hopped brewer's wort made from malted barley.
Monitoring of sugars, ethanol, higher alcohols and organic acids was made with a high performance chromatograph (HPLC). In addition, spectrophotometric analysis and dry matter analysis of the biomass were performed.

2
Background
Overview of the beer production process Beer is made from malted cereal grain, hops, water and yeast. In some cases, unmalted grain is used, as well as other extract containing material, such as syrup or sugar (Eßlinger and
Narziß, 2011). It is a process involving several steps and a flowchart, illustrating a typical beer production process, can be observed in Figure 1.
The first step in the production of beer is malting, which is when the grain is mixed with water (steeping). The key process during malting is that germination of the cereal grain commences and, as a result, hydrolytic enzymes are produced. These enzymes are key components in making the young beer fermentable. Several factors, like germination condition and steeping technology, affects malting and therefore also the beer. Thereafter, the grain is dried, which improves storing the capacity of the malt (Eßlinger and Narziß, 2011).
The dry malt is grinded and soaked in water in a procedure called mashing. The main process to occur in the mash is the breakdown of starch into smaller components, mediated by the hydrolytic enzymes previously mentioned (Eßlinger and Narziß, 2011). The starch breaks down to different kinds of sugars; mainly maltose, glucose and maltotriose but since complete hydrolysis of the starch does not occur there will be some dextrins left in the wort that is not easily fermented by the yeast in the later stages of the process (Monošík et al., 2013). There are several enzymes involved in the process and the activities of these are influenced by parameters like the temperature, the thickness of the mash, the texture of the grist and the amount of stirring. The chemical composition of the wort can be controlled in this step, to some extent, by changing these variables (Durand et al., 2009).
After mashing, the lautering step is performed where the malt-water suspension is filtered to separate the liquid (i.e. wort) and the spent grain. The wort is later boiled with hops and cooled down to a suitable temperature for the yeast organism to be inoculated at. When yeast is added to the wort, the fermentation is initiated. The main products of fermentation are ethanol and carbon dioxide but a wide variety of secondary metabolites are formed. Among these are higher aliphatic and aromatic alcohols, esters, organic acids, ketones, aldehydes, sulfur-containing compounds and polyhydric alcohols. All of the compounds mentioned above contribute to the properties and quality of the end product (Eßlinger and
Narziß, 2011).The goal is to maximise the amount of desirable metabolites and minimise the production of biomass and the metabolites that are perceived as off-flavours. There are ways to manipulate the yeast metabolism to achieve the proper end product. Examples of factors that influence yeast metabolism are wort composition, the amount of oxygen in the wort, pitching rate (i.e. inoculation concentration), the physiological state of the yeast at the inoculation moment, wort pH and fermentation temperature (Schaechter, 2009).

3
Figure 1: A flowchart, describing the beer production process.
Yeast physiology Yeast is a eukaryotic unicellular fungus that reproduces predominantly through budding. The diversity of yeast is immense, approximately 1000 species have been isolated and characterised and still it has been estimated that only 0.22 % of the total amount of yeast species have been characterised (Schaechter, 2009).
The majority of yeast organisms are aerobes, which means that they thrive in an environment containing oxygen but they can cope in an anaerobic environment. Growth is inhibited in absence of oxygen because oxygen is needed in the synthesis of lipids and sterols inside the yeast cell. These molecules are components of the cell wall and are therefore crucial when daughter cells with new cell walls are to be produced (Schaechter,
2009), (Cheong et al., 2007).
Brewer’s yeast can be divided into two groups, based on flocculation behaviour: bottom- and top fermenting. Bottom fermenting yeast is genetically conserved and ferments at temperatures of 8-14 °C, whereas the top fermenting kind is genetically more diverse and thrives at higher fermentation temperatures of about 18-24 °C (Lodolo et al., 2008). S. pastorianus (lager yeast) is bottom fermenting and S. Cerevisiae (ale yeast) is top fermenting. Studies of yeast DNA have described S. pastorianus as a hybrid yeast species between S. Cerevisiae and S. bayanus (Nakao et al., 2009).

4
Flocculation among yeast is a reversible process that involves yeast cells bonding to each other to form clots (flocs) (Soares, 2011), (Smit et al., 1992). These flocs sink towards the bottom, in the case of lager yeast, while ale yeast rises to the surface (Verstrepen et al., 2003). This capability of the yeast organism is of great importance for the brewing industry because it facilitates the process of removing the yeast at the end of fermentation (Verstrepen et al.,
2003).
Fermentation process of brewer’s yeast This diploma work only included a small, but vital, part of the beer production process, namely primary fermentation. An important goal in the development of today's fermentation technology of lager beers is to reduce duration of this part of the beer production process. This may allow for substantial time and money-savings. It, however, must be done without lowering the quality and characteristics of the end product. There are different alternatives to increase efficiency of yeast fermentation. One example is immobilisation of the yeast cells, allowing for continuous fermentation and increased volumetric productivity. But the end result has not proven to be satisfactory. Technical issues and unbalanced flavours in the final beer have been reported (Almonacid et al., 2012). Another technique is increasing the concentration of cells used for inoculation (Verbelen et al.,
2009), which have been successful without significant impact on flavour but more studies are needed to optimise the conditions for this method.
Glucose is metabolised by yeast to pyruvate in the process called glycolysis. Pyruvate is further metabolised with respiration if oxygen is present and fermentation under anaerobic conditions. Yeasts that are fermentative, like brewer's yeast, are able to use sugars as electron donors, electron acceptors and carbon sources without presence of oxygen. During fermentation, the pyruvate molecule is decarboxylated by pyruvate decarboxylase to acetaldehyde, which is reduced to alcohol by alcohol dehydrogenase. NADH is oxidised to NAD (nicotinamide adenine dinucleotide) during this process to maintain redox balance (Schaechter, 2009).

5
Sugar consumption Monitoring the sugar composition in the fermenting wort and end product is important in modern brewing technology, mainly in the development of new sorts of beer and selection of new yeast strains and raw materials (Monošík et al., 2013).
Common sugar molecules that occur in brewer's wort are glucose, fructose, sucrose, maltose, maltotriose and dextrin. The molecular structure of these sugars can be viewed in Figure 2. As described in (Schaechter, 2009), sucrose is the first sugar to be metabolised, followed by glucose, fructose, maltose and maltotriose, in that sequential order.
Figure 2: The molecular structures of various saccharides occurring in brewer’s wort. a) glucose, b) maltose, c) fructose, d) sucrose, e) maltotriose and f) dextrin.

6
In S. cerevisiae, fructose and glucose are transported into the cell by facilitated diffusion. In addition to this, S. pastorianus has been found to express active transport proton symporters for fructose. The active transport of fructose did not seem to be expressed on cells growing on glucose, suggesting that it is repressed by glucose. Although it has been reported that fructose and glucose are consumed simultaneously, in contrast to the earlier statement from (Schaechter, 2009). Glucose induced repression seems to be the case, on the other hand, with clearly less preferred carbon sources such as maltose (de Sousa et al., 2004). When glucose is present in the fermentation medium, several genes that are involved in utilisation of other carbon sources are repressed. (griffin)
One of the most rate limiting steps in wort fermentation is the transport of the disaccharide maltose and the trisaccharide maltotriose across the plasma membrane. The systems described so far are based on active transport, facilitated by H+-symporters, driven by the difference in electrochemical potential across the cell membrane (Vidgren et al., 2010), (Cousseau et al., 2013). Once inside the yeast cell, maltose and maltotriose are hydrolysed by α-glucosidases (maltases) in the cytoplasm. It has been reported that maltose and maltotriose are transported by different permeases but hydrolysis inside the cell can be accomplished by the same enzyme (Cousseau et al., 2013).

7
By-products
Higher alcohols
Higher alcohols generally occur in the highest concentrations of all of the secondary metabolites in beer fermentation. Important alcohols for the aroma are propanol (solvent-like), isobutanol (alcoholic), isoamyl alcohol (fruity, sweet) and 2-phenyl ethanol (floral, rose) (Saerens et al., 2008). See Figure 3 for the molecular structure of these molecules.
It is through decarboxylation of α-keto-acids, to form aldehydes, and subsequent reduction of the aldehyde, that higher alcohols are synthesised. There are two major pathways involved in the formation of α-keto-acids. The Erhlich pathway involves degradation of amino acids to their corresponding alcohol. The second one is an anabolic pathway involving the synthesis of branched amino acids from glucose (Saerens et al., 2008).
Formation of higher alcohol is coupled to amino acid metabolism, which is related to cell growth. Wort oxygenation, fermentation temperature and unsaturated fatty acids and sterols affect the biomass growth. This serves as an explanation for the fact that these factors also affect the production of higher alcohols (Saerens et al., 2008).
Figure 3: : The molecular structures of a few higher alcohols occurring in brewer’s wort. a) isoamyl alcohol, b) 2-phenyl ethanol, c) isobutanol, d) 2-propanol.

8
Esters
Volatile esters are also important by-products that affect the flavour despite their low concentrations in beer. The esters with the biggest impact on flavour are ethyl acetate (solvent-like), isoamyl acetate (banana), ethyl hexanoate, ethyl octanoate (sour apple), and phenyl ethyl acetate (roses, honey) (Saerens et al., 2008). The structure of the esters can be viewed in Figure 4.
The esters are produced by a condensation reaction of alcohol and acyl-CoA, where alcohol acetyltransferases are the enzymes acting as catalyst. The yeast strain utilised for fermentation has a significant effect on how much and what kinds of esters that are formed. But there are also external factors that show consistent behavior for many strains. High-gravity (i.e. high sugar content wort) brewing has been seen to increase the level of acetate esters, a decrease have been reported in consequence of stronger oxygenation and higher unsaturated fatty acid levels in the wort and a higher fermentation temperature seems to increase the levels of esters, except from ethyl hexanoate (Saerens et al., 2008).
Figure 4: The molecular structures of esters occurring in brewer’s wort. a) ethyl acetate, b) Isoamyl acetate, c) phenyl ethyl acetate, d) ethyl hexanoate, e) ethyl octanoate

9
Ketones
Vicinal diketones are common in beer and are considered to be off-flavours in most beer styles. The two most important diketones are diacetyl (butter, butterscotch) and 2,3-pentanedione (honey). In the case of diacetyl, it is α-acetolactate that is excreted from the yeast cell into the fermentation broth and then decarboxylated to diacetyl (Saerens et al.,
2008), (Eßlinger and Narziß, 2011). The molecular structures can be seen in Figure 5.
The diacetyl can, however, be reabsorbed and reduced to acetoin and subsequently 2,3-butanediol. These substances have higher flavour thresholds and consequently does not affect the perceived quality of the end product (Saerens et al., 2008).
Figure 5: The molecular structures of the vicinal diketones and precursors occurring in brewer’s wort. a) diacetyl or 2,3-butanedione, b) 2,3-pentanedione, c) α-acetolactate.
Sulfur compounds
Many different sulfur compounds have been detected in beer. Dimethyl sulfide has great impact on beer flavour (vegetable, cabbage) and it is the main volatile sulfur compound in beer (Stafisso et al., 2011). Hydrogen sulfide is another well-known compound in beer containing sulfur, it has an odor of rotten eggs and passes this property on to the beer (Oka
et al., 2008). The molecular structures of dimethyl sulfide and hydrogen sulfide are shown in Figure 6.
Figure 6: The molecular structures of sulfur compounds occurring in brewer’s wort. a) dimethyl sulfide, b) hydrogen sulfide

10
Organic acids
Beer is affected by organic acids in several ways. They contribute to the flavour by adding sourness, bitterness and astringent properties. Furthermore, organic acids can improve shelf life and act as a protector from microbial attack, due to pH decrease. The concentration of organic acids can be used as an indicator of fermentation performance. Lactate has been reported as an important quality factor with respect to variability in malt pH. Acetate is formed in consequence of yeast metabolism and it is an intermediate of the acetyl-CoA synthesis pathway from acetaldehyde, which is considered to be the main source of acetate formation (Yoshida and Yokoyama, 2012). The molecular structures can be seen in Figure 7.
Figure 7: The molecular structures of the organic esters occurring in brewer’s wort a) formic acid, b) acetic acid, c) lactic acid, d) valeric acid.

11
The production process at Åbro Bryggeri
Wort preparation
The process starts with mashing, since Åbro Bryggeri purchases malted barley from Viking Malt (Halmstad, Sweden). Mashing occurs in a continuously stirred tank with a capacity of 300 hL and once the mashing is finished, the content is transferred to a lautering vessel where the grain is removed. The wort is transferred to a boil kettle of similar size where boiling is conducted and hops are added. Hot trub (coagulated nitrogen compounds) and hop residues are removed in the process called whirlpool. In the whirlpool, the wort is pumped tangentially into a cylindrical tank, creating a rotating flow where suspended solid particles move to the bottom center and merge to form a cake (Eßlinger and Narziß, 2011). The cooled wort is pumped to a fermentation vessel, where the wort is mixed with precultured yeast.
Precultivation procedure
Åbro Bryggeri purchases their yeast culture samples from Hefebank Weihenstephan (Au, Germany). The yeast is propagated at ÅBRO, starting with inoculation of 300 ml of wort in an Erlenmeyer flask. After three days, the culture is transferred to an Erlenmeyer flask with 2 L of wort and left there for one day. The content of this flask is then moved to a Carlsberg flask (16-17 L) for the duration of two days. This volume is transported to a small propagation tank with 1200 L of wort and it remains there for four days. The propagation tanks are stirred and aerated. The last step before inoculation is the big propagation tank (7200 L), where the preculture is detained for about one day. 6000 L of preculture from the big propagation tank is used to inoculate the wort in a fermentation tank. The remaining content is pumped back to the small propagation tank.
Fermentation
The ratio between precultured yeast slurry and wort is 1:100. Fermentation takes place in vessels with a capacity of up to 180 000 L, in the largest tanks. The fermentation tanks are used for fermentation, maturation and storing. The duration of the primary fermentation is approximately five to six days at a temperature of 12 °C. Following the primary fermentation is a maturation period to reduce the diacetyl content. During this process, the temperature is lowered to 6.5 °C and held there for 2 days. Recycling of yeast is made in this step. The yeast sediment formed on the bottom is transferred to a yeast storage tank, where the slurry is aerated for one hour before it is used as inoculum. The yeast is reused for a maximum of 10 times.
Downstream process
The beer is then cooled down to 0 °C for 10-25 days and yeast is removed once more. Carbon dioxide and alcohol content by volume are measured at this point and the beer is diluted to the proper alcohol content and carbon dioxide is added. The beer is filtered through a system of rods, coated with diatomaceous earth (kieselguhr) to remove yeast, protein and polyphenols. This filtration method is often used before bottling. It is also the most comprehensive way to remove hot trub and hop residues from hot wort (Eßlinger and
Narziß, 2011). The following step is pasteurisation where the temperature is held at 72 °C for 30 seconds. The beer is then transported to pressure tanks where it is stored for a maximum of one week, before bottled or put in cans or kegs.

12
Materials and methods
Yeast strain and medium The strain used in the experiments was W34/70 (bottom fermenting flocculent yeast) from Hefebank Weihenstephan (Au, Germany). It is of the species Saccharomyces Pastorianus, sometimes referred to as Saccharomyces Carlsbergensis.
The medium used was hopped all-malt wort from Åbro Bryggeri, made with 100 % pilsner malt. The mashing process used was infusion, where the malt is mixed with water and heated all at once to different temperatures. The wort was boiled for one hour. The hop varieties Perle, Hallertau Taurus and Tettnang were added during boiling.
Preculture and yeast storage All yeast samples used for inoculation were treated and stored according to the same procedure. 20 ml of yeast slurry was mixed with 10 ml of glycerol in a centrifugation tube and frozen at -80 °C.
Two centrifugation tubes were thawed in room temperature and the content was added to a shake flask with 140 ml of wort and incubated at 30 °C on an orbital shaker (150 rpm) for 24 hours prior to inoculation. This procedure was used in (Ödman et al., 2009).
Fermentation conditions All fermentations were conducted in 10 L bioreactors with a working volume of 4 L. 3.8 L of wort was inoculated with 0.2 L of preculture. Since 0.2 L of preculture contained 40 ml of original yeast slurry and no biomass growth was detected during the precultivation, the ratio of 1:100 between yeast and wort was maintained. The wort was aerated with sterile air prior to inoculation. Three fermentations were performed with 12 °C, which is the temperature used for the primary fermentation of Kung at Åbro. Experiments with additionally six different temperatures were made and all other parameters were kept constant. The original plan was to test the temperatures 14, 16, 18 and 20 °C, performing two fermentations at each temperature. But due to temperature increase in the water supply, the last two experiments had to be adjusted 15 °C and 17°C respectively. The experimental set-up can be observed in Table 1.
Table 1: The experimental set-up
Temperature (°C) 12 14 15 16 17 18 20
Number of fermentations 3 1 1 1 1 2 2
Sampling procedure Samples to be analysed were withdrawn from a pipe in the bottom of the bioreactor. Since there were no continuous stirring during the fermentations, a layer of yeast sediment was formed in the bottom of the reactor. A mechanical stirring of 200 rpm for approximately 5 minutes was applied prior to sampling to ensure homogeneity of the fermentation broth.

13
Analysis
HPLC
A HPLC system from Shimadzu was used for measurements of the different sugars, alcohols and organic acids in the wort. The system consisted of a six-port two-position automatic injection valve (Rheodyne, US), a pump unit (LC-20AD), a column oven (CTO-20A) and an ion-exclusion column (Aminex® HPX-87H, 300X7.8 mm, BioRad, US). The detection method used was Refractive index (RI) detection, which utilises the fact that light changes direction in different manners depending on the substance it passes through. In the case of on-line measurements, a peristaltic pump (Alitea, C8/2-XV, Sweden) was used to pump fermentation broth (wort) to the injection unit that was controlled by a computer using the software LC Solution (Shimadzu, Japan). The time duration of the measurements was 50 minutes.
For each of the compounds analysed in the wort, a dilution series with known concentrations was made. A calibration curve was produced, in order to quantify the compounds in the unknown samples from the fermentations.
Spectrophotometer
To gain knowledge of the biomass concentration, the optical density of the fermentation broth was measured with a spectrometer (Ultraspec 1000, Pharmacia Biotech, UK) at λ=600 nm and a path length of 1 cm. The sample was diluted with deionised water, if required, to achieve an absorbance value within the linear region (≤ 0.6) of the spectrometer.
Biomass dry matter (BDM) analysis
1 mL of fermentation broth was filtrated through a (mixed) cellulose ester membrane filter (Whatman, Dassel, Germany) with a pore size of 0.2 μm and known weight. The filter was rinsed with 3 mL of deionised water, before incubated at 105 °C for 120 minutes. After drying, the filter was cooled down and weighed together with the dry matter. By calculating the difference between these weights and dividing by the sample volume (1 mL), the concentration of biomass could be estimated.
The BDM analysis was also performed with raw wort to account for large particles in the wort, leading to overestimation of the biomass. The dry matter value of raw wort was subtracted from the dry matter value of the fermenting wort to obtain the biomass weight.
Hemacytometer
The cell density of the yeast slurry received from Åbro was measured using a counting chamber (hemacytometer) from Marienfeld, Germany.

14
Results and discussion
Biomass analysis
Hemacytometer
The result from the cell counting was that the sample from Åbro contained approximately 2.4·1010 cells/ml. This corresponds to a pitching rate of 2.4·108 cells/ml with a yeast-wort ratio of 1:100.
BDM and spectrophotometric analysis
Throughout the fermentation at 17 °C, the fermenting wort was analysed according to the BDM analysis procedure in parallel with the spectrophotometric measurements. The purpose was to determine the relationship between dry matter and optical density. In addition, the raw wort has also been the subject of BDM analysis. The average of these measurements has been subtracted from the BDM analysis results of the fermentation broth. If large particles are present in the wort (e.g. barley fragments), the dry matter does not consist of biomass alone. Therefore, this adjustment was made to acquire a more realistic value for biomass dry matter. The optical density plotted against the BDM results (Figure 8) yields the relationship between these entities.
Figure 8: The relationship between biomass concentration and optical density.
A linear trend line was drawn through the data points to derive Equation 1. The trend line was forced to intercept the Y-axis at 1.1, which is the optical density value of raw wort.
Because CBiomass was desired, Equation 1 was rewritten as Equation 2.
Equation 2 was used to calculate the biomass concentration for all of the experiments, since
optical density was measured throughout the fermentations.
y = 3,0603x + 1,1
0
2
4
6
8
10
12
14
16
18
20
0,0 1,0 2,0 3,0 4,0 5,0 6,0 7,0
Op
tica
l de
nsi
ty
Concentration (g/L)
15
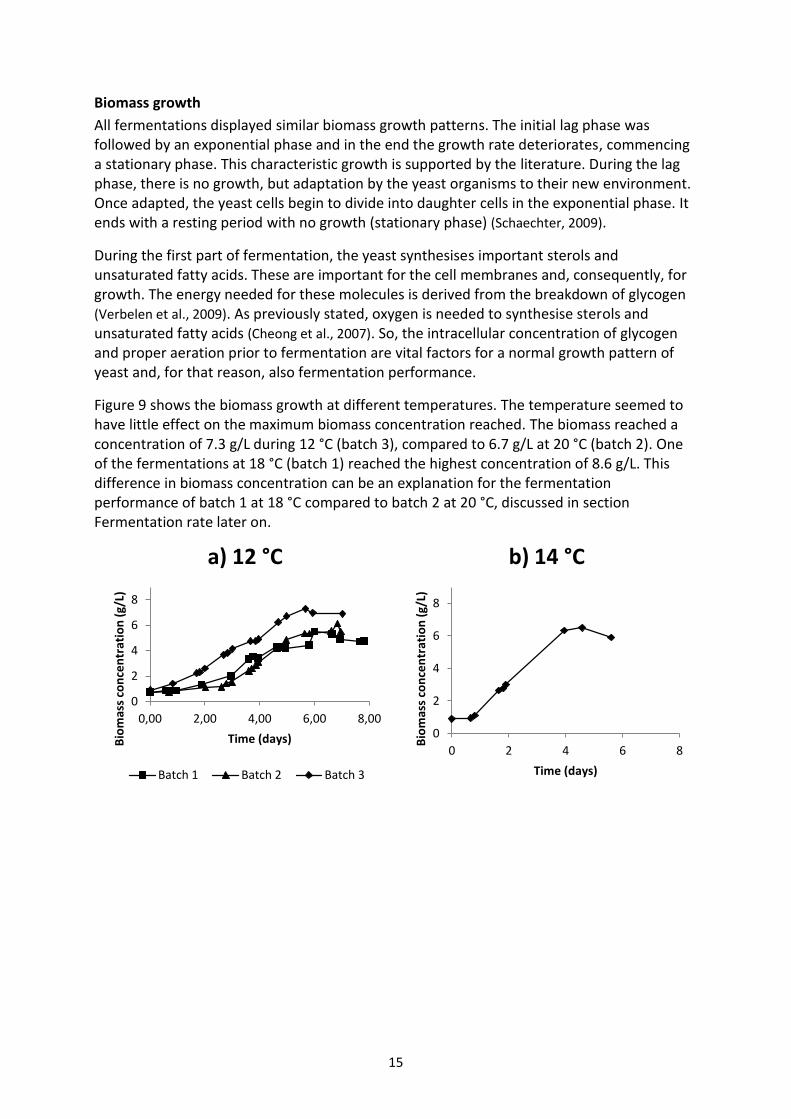
Biomass growth
All fermentations displayed similar biomass growth patterns. The initial lag phase was followed by an exponential phase and in the end the growth rate deteriorates, commencing a stationary phase. This characteristic growth is supported by the literature. During the lag phase, there is no growth, but adaptation by the yeast organisms to their new environment. Once adapted, the yeast cells begin to divide into daughter cells in the exponential phase. It ends with a resting period with no growth (stationary phase) (Schaechter, 2009).
During the first part of fermentation, the yeast synthesises important sterols and unsaturated fatty acids. These are important for the cell membranes and, consequently, for growth. The energy needed for these molecules is derived from the breakdown of glycogen (Verbelen et al., 2009). As previously stated, oxygen is needed to synthesise sterols and unsaturated fatty acids (Cheong et al., 2007). So, the intracellular concentration of glycogen and proper aeration prior to fermentation are vital factors for a normal growth pattern of yeast and, for that reason, also fermentation performance.
Figure 9 shows the biomass growth at different temperatures. The temperature seemed to have little effect on the maximum biomass concentration reached. The biomass reached a concentration of 7.3 g/L during 12 °C (batch 3), compared to 6.7 g/L at 20 °C (batch 2). One of the fermentations at 18 °C (batch 1) reached the highest concentration of 8.6 g/L. This difference in biomass concentration can be an explanation for the fermentation performance of batch 1 at 18 °C compared to batch 2 at 20 °C, discussed in section Fermentation rate later on.
0
2
4
6
8
0,00 2,00 4,00 6,00 8,00
Bio
mas
s co
nce
ntr
atio
n (
g/L)
Time (days)
a) 12 °C
Batch 1 Batch 2 Batch 3
0
2
4
6
8
0 2 4 6 8
Bio
mas
s co
nce
ntr
atio
n (
g/L)
Time (days)
b) 14 °C

16
Figure 9: The biomass growth at different temperatures, showing a) 12 °C, b) 14 °C, c) 15 °C d) 16 °C, e) 17 °C, f) 18 °C and g) 20 °C.
0
2
4
6
8
0 2 4 6 8
Bio
mas
s co
nce
ntr
atio
n (
g/L)
Time (days)
c) 15 °C
0
2
4
6
8
0 2 4 6 8
Bio
mas
s co
nce
ntr
atio
n (
g/L)
Time (days)
d) 16 °C
0
2
4
6
8
0 2 4 6 8
Bio
mas
s co
nce
ntr
atio
n (
g/L)
Time (days)
e) 17 °C
0
2
4
6
8
0 2 4 6 8
Bio
mas
s co
nce
ntr
atio
n (
g/L)
Time (days)
f) 18 °C
Batch 1 Batch 2
0
2
4
6
8
0 2 4 6 8
Bio
mas
s co
nce
ntr
atio
n (
g/L)
Time (days)
g) 20 °C
Batch 1 Batch 2

17
Wort analysis HPLC analysis of the raw wort was performed on several samples and the complete results of these measurements can be seen in Table 4 in the appendix. As previously stated in the introduction, it is the raw material and pretreatment (malting and mashing) that affects the chemical composition of the wort. This is, as well as fermentation conditions, an important factor in beer production.
Brewer’s wort is a complex matrix that comprises many different substances, the most abundant being carbohydrates in the form of sugar. The carbohydrate content and composition and the way these are utilised by the yeast affects the yeasts metabolism and the organoleptic properties of the finished beer. (Gibson et al., 2008)
The sugars identified in the wort was maltose, glucose, maltotriose, fructose and the unfermentable sugar dextrin. The most abundant sugar was maltose, followed by dextrin, glucose, maltotriose and fructose, in that order. The sugar composition can be viewed in Table 2.
What must be taken into consideration here is that sucrose could not be quantified with the HPLC column used. When injected with a sucrose solution, the HPLC system identified it as fructose and glucose. The sucrose molecule seemed to get disintegrated while travelling through the column and since it is a dimer of glucose and fructose, those molecules are the ones being detected. This results in an overestimation of glucose and fructose, depending on how much sucrose the wort contained.
Table 2: The sugar composition in raw wort.
Maltotriose Maltose Glucose Fructose Dextrin
Concentration in wort (g/L) 9 46 14 3 31
% of total fermentable sugar 13 64 19 4
% of total sugar 9 45 14 3 30
Lactic acid occured in the wort in concentrations averaging 124 mg/L, this organic acid is used as an additive during mashing. Acetic acid (8 mg/L), glycerol (56 mg/L) and ethanol (0.2 g/L) was identified as well.
The wort used in the experiments originated from two different batches. There were only minor differences between the batches, except in the case of the occurrence of formic acid. Three analyses were made of the first batch, no detection of formic acid was made. Five out of six analyses of the second batch detected formic acid with an average of 92 mg/L. The detection limit of formic acid was somewhere between 1.8-46 mg/L. Perhaps the difference between the two batches was not that large, the first batch could have contained formic acid just below the detection threshold. No formic acid was detected during the fermentation.

18
Fermentation rate Five temperature conditions were used for the fermentations: 12 °C, 14 °C, 15 °C, 16°C, 17 °C, 18 °C and 20 °C. All other parameters were kept constant. The fermentations were stopped when the ethanol concentration had reached 6 % v/v (corresponding to 47.34 g/L), as is the method used at Åbro Bryggeri. So, the time it took from inoculation to reaching an alcohol content by volume of 6 % is the duration in this context.
Figure 10 is a good representation of fermentation rate during different temperatures. The alcohol concentration is plotted against time for fermentations with different temperature. To emphasise the end of fermentation and make it easier to assess the duration of the fermentations, the alcohol limit (47.3 g/L) has been placed in the graph.
Figure 10: The ethanol concentration plotted against time to illustrate fermentation rates.
0
10
20
30
40
50
0 1 2 3 4 5 6 7 8
Eth
ano
l co
nce
ntr
atio
n (
g/L)
Time (days)
12 °C batch 1 12 °C batch 2 12 °C batch 3 14 °C
15 °C 16 °C 18 °C batch 1 18 °C batch 2
20 °C batch 1 20 °C batch 2

19
The general pattern, with few exceptions, was an increase in fermentation rate as the temperature was elevated. The three fermentations with 12 °C showed the lowest rate, with a duration of roughly seven to eight days with data gathered from three fermentations.
When considering the fermentation duration, it was sometimes difficult to determine a definite value. More frequent sampling could have improved the accuracy of the duration. At several occasions, the last two samples were taken too far apart, which made it problematic to see when the alcohol content reached the limit value. For instance, the curves in Figure 10 might give the impression that the fermentation at 16 °C reaches the alcohol limit after the fermentations at 14 °C and 15 °C. This seems to be caused by sampling too far apart, the actual order in which they reach the alcohol limit is concluded to be the fermentation at 16 °C first and then the ones at 15 °C and 14 °C.
The fermentation with the highest rate (20 °C batch 1) reached the end in two to three days. The fermentation at 18 °C (batch 1) seemed to have the second highest rate, completing fermentation within 2.8 days and the fermentation at 18 °C finishes just afterwards. Batch 2 with 20 °C, however, came to an end sometime between 3.5 and 4.6 days, which is after both fermentations employing a temperature of 18 °C.
The approximated durations of the fermentations can be seen in Table 3. Where it has been hard to determine one approximated value of the duration, an interval has been specified instead.
Table 3: The duration of the fermentations
Fermentation Duration (days)
12 °C batch 1 7.8
12 °C batch 2 6.8-7
12 °C batch 3 ~7
14 °C 4.8-5.6
15 °C ~5
16 °C 4-5.6
17 °C
18 °C batch 1 ~2.8
18 °C batch 2 2.9-4
20 °C batch 1 2-3
20 °C batch 2 3.5-4.6
Figure 11 demonstrates the fermentation profiles for the different temperatures. The sugar and ethanol concentrations are plotted against time.

20
0
10
20
30
40
50
0 2 4 6 8
Co
nce
ntr
atio
n (
g/L)
Time (days)
a) 12 °C batch 1
Maltotriose Maltose
Glucose Fructose
Ethanol
0
10
20
30
40
50
0 2 4 6 8
Co
nce
ntr
atio
n (
g/L)
Time (days)
b) 12 °C batch 2
Maltotriose Maltose
Glucose Fructose
Ethanol
0
10
20
30
40
50
0 2 4 6 8
Co
nce
ntr
atio
n (
g/L)
Time (days)
c) 12 °C batch 3
Maltotriose Maltose
Glucose Fructose
Ethanol
0
10
20
30
40
50
0 2 4 6 8
Co
nce
ntr
atio
n (
g/L)
Time (days)
d) 14 °C
Maltotriose Maltose
Glucose Fructose
Ethanol

21
0
10
20
30
40
50
0 2 4 6 8
Co
nce
ntr
atio
n (
g/L
Time (days)
e) 15 °C
Maltotriose Maltose
Glucose Fructose
Ethanol
0
10
20
30
40
50
0 2 4 6 8
Co
nce
ntr
atio
n (
g/L)
Time (days)
f) 16 °C
Maltotriose Maltose
Glucose Fructose
Ethanol
0
10
20
30
40
50
0 2 4 6 8
Co
nce
ntr
atio
n (
g/L)
Time (days)
h) 18 °C batch 1
Maltotriose Maltose
Glucose Fructose
Ethanol
0
10
20
30
40
50
0 2 4 6 8
Co
nce
ntr
atio
n (
g/L)
Time (days)
i) 18 °C batch 2
Maltotriose Maltose
Glucose Fructose
Ethanol

22
Figure 11: Fermentation profiles showing the degrading sugars and ethanol production in the wort. a)-c) 12 °C, d) 14 °C, e) 15 °C f) 16 °C, g) 17 °C, h) and i) 18 °C, j) and k) 20 °C.
0
10
20
30
40
50
0 2 4 6 8
Co
ne
ntr
atio
n (
g/L)
Time (days)
j) 20 °C batch 1
Maltotriose Maltose
Glucose Fructose
Ethanol
0
10
20
30
40
50
0 2 4 6 8
Co
nce
ntr
atio
n (
g/L)
Time (days)
k) 20 °C batch 2
Maltotriose Maltose
Glucose Fructose
Ethanol

23
Sugar consumption To investigate the sugar catabolism, one can observe the amount of the individual sugars relative to the initial amount of the respective sugar, plotted against time. By looking at these graphs, conclusions can be drawn about which saccharides that are prioritised by the yeast. One of the fermentations at 12 °C (batch 3) and one at 20 °C (batch 1) are used as examples to discuss the sugar consumption (Figure 12). One must have in mind here as well, that sucrose could not be identified. Consequently, conclusions about the catabolism of sucrose are difficult to draw.
Figure 12: Showing the amount of the different sugars relative to their initial amounts at 12 °C (a) and 20 °C (b).
0
10
20
30
40
50
60
70
80
90
100
0 1 2 3 4 5 6 7 8
Re
sid
ual
su
gar
(%)
Time (days)
a) 12 °C batch 3
Maltotriose
Maltose
Glucose
Fructose
0
10
20
30
40
50
60
70
80
90
100
0 1 2 3 4 5 6 7 8
Re
sid
ual
su
gar
(%)
Time (days)
b) 20 °C batch 1
Maltotriose
Maltose
Glucose
Fructose

24
When observing Figure 13 a) and b), glucose certainly seems to be the first saccharide to be reduced in the wort. In Figure 16 a), glucose is being utilised within a day from inoculation and the concentration is below 5 g/L in 2.7 days. Fructose consumption is delayed compared to the reduction of glucose, being utilised after 2.8 days and below 5 g/L after 4.7 days.
The wort concentration of maltose and maltotriose appear to be decreasing at similar rates during the first half of the fermentation. The maltotriose reduction then starts to level off after 4 days and reaches a concentration of about 24 g/L in the end of the fermentation. Maltose, on the other hand, continues down to approximately 5 g/L.
This behaviour is partly supported in (Schaechter, 2009), where it is claimed that the all of the sugar molecules are consumed in sequential order. Judging from the appearances of these curves, it certainly seems as if maltose and maltotriose are consumed at the same time. However, maltotriose is not fully attenuated and levels off before maltose, at a higher end concentration.
De Sousa and colleagues (2004) reported that fructose and glucose are consumed simultaneously, this is supported by Gibson and colleagues (2008). These reports are contradictory with the results of these experiments.
What is definite is that glucose and fructose are consumed before maltose and maltotriose. An explanation to this is the carbon catabolite repression of the metabolic pathways involved in the utilisation of maltose and maltotriose (Gibson et al., 2008).
The consumption pattern described of the individual sugar molecules can be seen in all fermentations, regardless of temperature. Graphs illustrating the sugar consumption for all the fermentations can be found in Figure 13. One of the fermentations at 18 °C (batch 2) is excluded because the first sample was not analysed with the HPLC.

25
0
20
40
60
80
100
0 2 4 6 8
Re
sid
ual
su
gar
(%)
Time (days)
a) 12 °C batch 1
Maltotriose Maltose
Glucose Fructose
0
20
40
60
80
100
0 2 4 6 8
Re
sid
ual
su
gar
(%)
Time (days)
b) 12 °C batch 2
Maltotriose Maltose
Glucose Fructose
0
20
40
60
80
100
0 2 4 6 8
Re
sid
ual
su
gar
(%)
Time (days)
c) 14 °C
Maltotriose Maltose
Glucose Fructose
0
20
40
60
80
100
0 2 4 6 8
Re
sid
ual
su
gar
(%)
Time (days)
d) 15 °C
Maltotriose Maltose
Glucose Fructose
0
20
40
60
80
100
0 2 4 6 8
Re
sid
ual
su
gar
(%)
Time (days)
e) 16 °C
Maltotriose Maltose
Glucose Fructose
0
20
40
60
80
100
0 2 4 6 8
Re
sid
ual
su
gar
(%)
Time (days)
f) 17 °C
Maltotriose Maltose
Glucose Fructose

26
Figure 13: Showing the amount of the different sugars relative to their initial amounts at 12 °C (a and b), 14 °C (c), 15 °C (d), 16 °C (e), 17 °C (f), 18 °C (g) and 20 °C (h).
0
20
40
60
80
100
0 2 4 6 8
Re
sid
ual
su
gar
(%)
Time (days)
g) 18 °C batch 1
Maltotriose Maltose
Glucose Fructose
0
20
40
60
80
100
0 2 4 6 8
Re
sid
ual
su
gar
(%)
Time (days)
h) 20 °C batch 2
Maltotriose Maltose
Glucose Fructose

27
Higher alcohol formation Of the higher alcohols that were monitored, only isoamyl alcohol exceeded the detection limit of the HPLC system. An isoamyl alcohol level of 15 mg/L was the smallest concentration detected during the fermentations but in the making of the calibration curve, the detection limit appeared to be between 50-100 mg/L.
The general production pattern of isoamyl alcohol (seen in Figure 14) is supported by (Saerens et al., 2008), the higher alcohols accumulate during the fermentation and reaches maximum values in the end, with some exceptions where the isoamyl alcohol decreased slightly towards the end (probably caused by measurement uncertainty).
For the fermentations with 12 °C, the isoamyl alcohol reached the maximum concentration of 41 mg/L in batch 3, the other 12 °C fermentations showed maximum concentrations of approximately 40 mg/L. This is not far from the results reported in (Saerens et al., 2008), where an end concentration of 58.29 mg/L was reported for a lager yeast fermenting in wort with an extract content of 12 ° Plato. Another example of isoamyl alcohol concentration in beer is 26.3 mg/L (Yu et al., 2012).
In the fermentation at 14 °C, levels of isoamyl alcohol as high as 48 mg/L was detected. Isoamyl alcohol has a flavour threshold of 50 mg/L (Saerens et al., 2008). So judging from these experiments, a change in fermentation temperature from 12 °C to 14 °C could affect the yeast to produce isoamyl alcohol in amounts bordering the threshold that a human being can sense. Batch 2 of 18 °C reaches 48 mg/L and batch 1 of 20 °C reaches 51 mg/L, indicating that temperature would increase higher alcohol levels, as is claimed in (Saerens et
al., 2008). However, the results are not conclusive, during the other 20 °C fermentation (batch 2) the concentration only reaches 36 mg/L and at the same time it reaches 50 mg/L during the fermentation at 15 °C. Regarding batch 2 at 20 °C, a probable explanation for the poor isoamyl alcohol production is that the biomass growth was significantly lower compared to the other fermentations. As previously mentioned in the introduction, the production of higher alcohol is coupled to the biomass growth.
A different method could have been advantageous in the monitoring of higher alcohols. A recurring method in the literature was gas chromatography. For example, head space gas chromatography (HS-GC) coupled with flame ionisation detection (GC-FID) was used by Saerens and colleagues (2008). This instrument could detect several esters and higher alcohols at lower concentrations, with a maximum standard deviation below 2 mg/L in the final concentrations.

28
0
10
20
30
40
50
60
0 50 100
Co
nce
ntr
atio
n (
mg/
L)
Consumed sugar (%)
a) 12 °C batch 1
0
10
20
30
40
50
60
0 50 100
Co
nce
ntr
atio
n (
mg/
L)
Consumed sugar (%)
b) 12 °C batch 2
0
10
20
30
40
50
60
0 50 100
Co
nce
ntr
atio
n (
mg/
L)
Consumed sugar (%)
c) 12 °C batch 3
0
10
20
30
40
50
60
0 50 100
Co
nce
ntr
atio
n (
mg/
L)
Consumed sugar (%)
d) 14 °C
0
10
20
30
40
50
60
0 50 100
Co
nce
ntr
atio
n (
mg/
L)
Consumed sugar (%)
e) 15 °C
0
10
20
30
40
50
0 50 100
Co
nce
ntr
atio
n (
mg/
L)
Consumed sugar (%)
f) 16 °C

29
Figure 14: Isoamyl alcohol formation during fermentation with different temperatures, showing 12 °C (a-c), 14 °C (d), 15 °C (e), 16 °C (f), 17 °C (g), 18 °C (h) and 20 °C (i and j).
0
10
20
30
40
50
0 50 100
Co
nce
ntr
atio
n (
mg/
L)
Time (days)
g) 17 °C
0
10
20
30
40
50
60
0 50 100
Co
nce
ntr
atio
n (
mg/
L)
Consumed sugar (%)
h) 18 °C batch 1
0
10
20
30
40
50
60
0 50 100
Co
nce
ntr
atio
n (
mg/
L)
Consumed sugar (%)
i) 20 °C batch 1
0
10
20
30
40
50
60
0 50 100
Co
nce
ntr
atio
n (
mg/
L)
Consumed sugar (%)
j) 20 °C batch 2
30
Organic acid formation Formic acid, acetic acid, lactic acid and valeric acid were monitored during the fermentations but only acetic and lactic acid were detected. Detection limits appeared to be approximately 10-20 mg/L and 8-20 mg/L for acetic acid and lactic acid respectively. Graphs showing the formation of organic acids can be seen in Figure 15. Overall, these curves seemed more irregular and unstable, compared to the curves with sugar and ethanol.
When studying the acetic acid concentration during the condition of 12 °C, batch 2 and 3 starts and ends at the same level. Batch 1, on the other hand, starts off at 59 mg/L and ends at a level of 17 mg/L, giving a decrease of roughly 70 %.
A notable phenomenon is that most of the fermentations with increased temperature (14 °C, 15 °C, 16 °C and 18 °C) displayed a decline in acetic acid concentration throughout the fermentations. Starting off with concentrations of 25-40 mg/L and reaching the undetectable concentration range within 2-4 days, depending on temperature. The fermentations deviating from this model are the fermentation at 17 °C and both fermentations at 20 °C. Acetic acid is a volatile organic acid (Eßlinger and Narziß, 2011). A hypothesis is that the acetic acid leaves the fermentation broth together with CO2 because of its volatility, however, this is contradicted by the fact that the concentration remains detectable throughout both fermentation at 20 °C and at 17 °C.
The initial lactic acid concentration was in the 150-220 mg/L range, for all fermentations. Generally, the initial value and end concentration did not differ much, although there are some examples of fluctuations in between. For example, batch 1 of 12 °C starts at a lactic acid concentration of 187 mg/L and decreases to 90 mg/L after six days, but it rises to 179 mg/L towards the end. A similar dip can be seen in batch 2 and at 14 °C. Both fermentations at 18 °C looked irregular, starting off around 150 mg/L and then displayed a rapid concentration decrease, followed by an abrupt raise in concentration. Only 20 °C (batch 2) displayed an increase during fermentation (170 mg/L to 260 mg/L). However, the general trend seemed to be that the initial lactic acid concentration was not affected by yeast metabolism.
The information encountered about organic acids in beer fermentation, describes them as metabolism by-products that are formed during fermentation, resulting in a decrease of the pH of the fermenting wort. Both acetic acid (Eßlinger and Narziß, 2011), (Yoshida and Yokoyama,
2012) and lactic acid (Eßlinger and Narziß, 2011) are described in this manner. The results in the present work are unable to confirm these statements. In fact, based on these experiments alone, the acetic acid seemed to originate from the yeast slurry and increased during the aerobic precultivation process. The average concentration of acetic acid in raw wort was 8 mg/L, while the preculture concentration was about 55 mg/L initially and 105 mg/L in the end. During the fermentation, it appeared to decrease. Lactic acid on the other hand was present in concentrations around 120 mg/L in raw wort, hence, the large part of lactic acid seems to come from a procedure prior to fermentation.
The pH value, however, was consistent with the literature. The average initial pH value was 5.2 and the pH decreased throughout fermentation, with an average end value of 4.2. End pH of lager beer is reported to be approximately 4.1-4.2 (Eßlinger and Narziß, 2011) and in (Schaechter, 2009), pH is said to decrease from 5.2-5.3 to 4.1-4.2. This decrease in pH cannot

31
be explained by increased concentrations of lactic and acetic acid. One alternative is that the measurements of organic acids are faulty, another explanation is that the pH decrease arise due to the formation of pyruvic, succinic, malic and/or citric acid reported to be formed during fermentation (Eßlinger and Narziß, 2011), (Yoshida and Yokoyama, 2012).
The flavour threshold for acetic acid and lactic acid have been reported in (Siebert, 1999) where three sources have reported the same value; 200 mg/L for acetic acid and 400 mg/L for lactic acid. None of these thresholds are reached in the experiments.

32
0
50
100
150
200
250
0 2 4 6 8
Co
nce
ntr
atio
n (
mg/
L)
Time (days)
a) 12 °C batch 1
Lactic acid Acetic acid
0
50
100
150
200
250
0 2 4 6 8
Co
nce
ntr
atio
n (
mg/
L)
Time (days)
b) 12 °C batch 2
Lactic acid Acetic acid
0
50
100
150
200
250
0 2 4 6 8
Co
nce
ntr
atio
n (
mg/
L)
Time (days)
c) 12 °C batch 3
Lactic acid Acetic acid
0
50
100
150
200
250
0 2 4 6 8
Co
nce
ntr
atio
n (
mg/
L)
Time (days)
d) 14 °C
Lactic acid Acetic acid
0
50
100
150
200
250
0 2 4 6 8
Co
nce
ntr
atio
n (
mg/
L)
Time (days)
e) 15 °C
Lactic acid Acetic acid
0
50
100
150
200
250
0 2 4 6 8
Co
nce
ntr
atio
n (
mg/
L)
Time (days)
f) 16 °C
Lactic acid Acetic acid

33
Figure 15: Acetic and lactic acid formation during fermentation with different temperatures, showing 12 °C (a-c), 14 °C (d), 15 °C (e), 16 °C (f), 17 °C (g), 18 °C (h and i) and 20 °C (j and k).
0
50
100
150
200
0 2 4 6 8
Co
nce
ntr
atio
n (
mg/
L)
Time (days)
g) 17 °C
Lactic acid Acetic acid
0
50
100
150
200
250
0 2 4 6 8
Co
nce
ntr
atio
n (
mg/
L)
Time (days)
h) 18 °C batch 1
Lactic acid Acetic acid
0
50
100
150
200
0 2 4 6 8
Co
nce
ntr
atio
n (
mg/
L)
Time (days)
i) 18 °C batch 2
Lactic acid Acetic acid
0
50
100
150
200
250
0 2 4 6 8
Co
nce
ntr
atio
n (
mg/
L)
Time (days)
j) 20 °C batch 1
Lactic acid Acetic acid
0
50
100
150
200
250
300
0 2 4 6 8
Co
nce
ntr
atio
n (
mg/
L)
Time (days)
k) 20 °C batch 2
Lactic acid Acetic acid

34
Differences between the industrial process and the lab-scale process
Down-scaling
In the present thesis work, a downscaled version the fermentation process at Åbro Bryggeri was performed. The aspiration was to duplicate the process at Åbro, only with smaller volumes, but downscaling may be accompanied with flaws regarding the process conditions. Small batches of litre-scale will not necessarily reproduce the conditions occurring during full-scale fermentations at commercial breweries (Gibson et al., 2008).
In large scale fermentations, concentration gradients will be formed without proper mixing of the fermentation medium. Such heterogeneities in the fermentation broth generally lead to reduced fermentation performance in comparison to a homogenous system. Special experiment configurations are necessary to simulate concentration gradients in lab-scale experiments. One way to achieve this is to use two-compartment systems, where the two compartments have different conditions (e.g. different dissolved oxygen concentrations) (Flickinger, 2013). Such special configuration have not been employed in the present work and this should be taken into consideration.
Differences in procedures and equipment
The differences in handling the yeast at Åbro and in these experiments should be reflected upon. At Åbro, inoculation is made with freshly propagated yeast from their propagation tanks. Since the experiments were not performed in close proximity to the brewery, the yeast was transported from Vimmerby to Linköping and then incubated at -80 °C. In the first experiment, the inoculation was made with thawed yeast slurry. This proved to be inadequate, resulting in a considerable reduction of fermentation rate compared to the one at Åbro Bryggeri. The results of this experiment were excluded from the report. The following inoculations were made with yeast that had been incubated at 30 °C on a shaker for 24 hours. This significantly improved the fermentation rate and increased the similarity to fermentation duration at Åbro Bryggeri. However, the yeast handling procedure definitely differs from the one used at Åbro and the effects are difficult to calculate.

35
The fermentation tanks in use at Åbro are cylindroconical vessels (CCV), such a tank can be viewed in Figure 16. CCV has become the equipment of choice in modern breweries due to lower capital and operating costs, increased efficiency due to decreased beer losses, increased vessel utilization, carbon dioxide collection and CIP (cleaning in place) (Lodolo et al.,
2008). The lab-scale bioreactors used throughout this project does not have the same geometrical shape and proportions.
No stirring is performed in the fermentation tanks at Åbro, they rely on the geometrical shape (CCV) of the tanks and CO2 formation. Mixing of the fermentation broth was made during this diploma work only before sampling. The stirring for such small time intervals was assumed not to alter the fermentation process.
Figure 16: The largest conical fermentor used at Åbro Bryggeri

36
Conclusions
The monitoring of fermenting wort with high performance liquid chromatography proved to generate stable and reproducible results, considering the analysis of ethanol and saccharides, which was present in amounts up to 50 g/L. Based on the ethanol formation, the fermentation rate is concluded to be increased with increased temperature, with this particular yeast strain and medium composition.
The by-products (higher alcohols and organic acids) occurred in much lower concentrations, below 1 g/L, down to approximately 25 mg/L. Conclusive evidence regarding the temperature's effect on the metabolism of organic acids or higher alcohols, have not been found. The results were not consistent enough, although there were tendencies of increased concentration of by-products at higher temperatures. A temperature increase from 12 °C to 14 °C reduces the fermentation time by roughly 30 %, without elevating the isoamyl alcohol concentration above the flavor threshold, judging from these experiments alone. However, more experiments needs to be performed before considering to implement such a strategy at Åbro Bryggeri.
The analysis of by-products, present in small quantities, would probably be more successful if performed with another instrument. Head space gas chromatography coupled to flame ionisation detection have been shown to be capable of detecting several higher alcohols and esters in low concentrations, with low standard deviation. Also, it would have been preferable to perform several measurements on each time point to gain information about the uncertainty of the method. This was concluded to be too time consuming in this project, considering the time duration of each measurement.

37
Acknowledgements
First of all, I would like to thank my examiner Carl-Fredrik Mandenius. Thank you for your open-mindedness that led to the possibility to ferment beer in a biotechnology lab that usually is used for recombinant E-coli experiments.
I would like to express my gratitude to Robert Gustavsson, my supervisor, for excellent help throughout the project.
Of course, without the hard working little yeast organisms and wort to feed them with, none of this would have been possible. The material was kindly donated by Åbro Bryggeri and Åsa Johansson was a great help, who took the time to answer questions during the project, as well as give us a guided tour around the brewery. Thank you very much. Credit must also go to Tobias Tybåhl for transportation of wort from Vimmerby to Linköping when the it was about to run out.
I also want to thank Bo Palmqvist and Tove Bjerg for helping me to find chemicals to calibrate the HPLC instrument.
I want to thank my co-workers Gunnar Bergström and Jonas Christoffersson for a really good atmosphere in the office. I need someone to criticise my work as well, so thank you, David Jullesson for being my opponent.
Lastly, I want to declare my appreciation of my friends, family and last but not least, my lovely fiancée.
38
References Almonacid, S.F., Nájera, A.L., Young, M.E., Simpson, R.J., Acevedo, C.A., 2012. A Comparative Study of
Stout Beer Batch Fermentation Using Free and Microencapsulated Yeasts. Food and Bioprocess
Technology 5, 750-758.
Cheong, C., Wackerbauer, K., Kang, S.A., 2007. Influence of aeration during propagation of pitching
yeast on fermentation and beer flavor. Journal of microbiology and biotechnology 17, 297-304.
Cousseau, F.E., Alves, S.L., Trichez, D., Stambuk, B.U., 2013. Characterization of maltotriose
transporters from the subgenome of the hybrid lager brewing yeast strain Weihenstephan 34/70.
Letters in Applied Microbiology 56, 21-29.
Durand, G.A., Corazza, M.L., Blanco, A.M., Corazza, F.C., 2009. Dynamic optimization of the mashing
process. Food Control 20, 1127-1140.
Eßlinger, H.M., Narziß, L., 2011. "Beer," in: Ullmann's Encyclopedia of Industrial Chemistry, in:. Wiley-
VCH Verlag GmbH & Co. KGaA, Weinheim, pp. 177-221.
Flickinger, M.C., 2013. Upstream Industrial Biotechnology. John Wiley & Sons.
Gibson, B.R., Boulton, C.A., Box, W.G., Graham, N.S., Lawrence, S.J., Linforth, R.S., Smart, K.A., 2008.
Carbohydrate utilization and the lager yeast transcriptome during brewery fermentation. Yeast 25,
549-562.
Lodolo, E., Kock, J., Axcell, B., 2008. The yeast Saccharomyces cerevisiae–the main character in beer
brewing. FEMS yeast.
Monošík, R., Magdolen, P., Streďanský, M., Šturdík, E., 2013. Monitoring of monosaccharides,
oligosaccharides, ethanol and glycerol during wort fermentation by biosensors, HPLC and
spectrophotometry. Food Chemistry 138, 220-226.
Nakao, Y., Kanamori, T., Itoh, T., Kodama, Y., 2009. Genome sequence of the lager brewing yeast, an
interspecies hybrid. DNA.
Oka, K., Hayashi, T., Matsumoto, N., Yanase, H., 2008. Decrease in hydrogen sulfide content during
the final stage of beer fermentation due to involvement of yeast and not carbon dioxide gas purging.
Journal of Bioscience and Bioengineering 106, 253-257.
Saerens, S.M., Verbelen, P.J., Vanbeneden, N., Thevelein, J.M., Delvaux, F.R., 2008. Monitoring the
influence of high-gravity brewing and fermentation temperature on flavour formation by analysis of
gene expression levels in brewing yeast. Applied microbiology and biotechnology 80, 1039-1051.
Schaechter, M., 2009. Encyclopedia of microbiology, 3rd ed, 2009. Elsevier Inc.
Siebert, K., 1999. Modeling the flavor thresholds of organic acids in beer as a function of their
molecular properties. Food quality and preference.
Smit, G., Straver, M., Lugtenberg, B., 1992. Flocculence of Saccharomyces cerevisiae cells is induced
by nutrient limitation, with cell surface hydrophobicity as a major determinant. Applied and.

39
Soares, E.V., 2011. Flocculation in Saccharomyces cerevisiae: a review. Journal of Applied
Microbiology 110, 1-18.
Stafisso, A., Marconi, O., Perretti, G., Fantozzi, P., 2011. Determinationof dimethyl sulphide in
brewery samples by headspace gas chromatography mass spectrometry (HS-GC/MS). Ital. J. Food Sci.
23.
Verbelen, P.J., Dekoninck, T.M., Saerens, S.M., Mulders, S.E., Thevelein, J.M., Delvaux, F.R., 2009.
Impact of pitching rate on yeast fermentation performance and beer flavour. Applied microbiology
and biotechnology 82, 155-167.
Verstrepen, K.J., Derdelinckx, G., Verachtert, H., Delvaux, F.R., 2003. Yeast flocculation: what brewers
should know. Applied microbiology and biotechnology 61, 197-205.
Vidgren, V., Multanen, J., Ruohonen, L., Londesborough, J., 2010. The temperature dependence of
maltose transport in ale and lager strains of brewer's yeast. FEMS Yeast Research 10, 402-411.
Yoshida, S., Yokoyama, A., 2012. Identification and characterization of genes related to the
production of organic acids in yeast. Journal of Bioscience and Bioengineering 113, 556-561.
Yu, Z., Zhao, M., Li, H., Zhao, H., Zhang, Q., Wan, C., Li, H., 2012. A comparative study on physiological
activities of lager and ale brewing yeasts under different gravity conditions. Biotechnology and
Bioprocess Engineering 17, 818-826.
de Sousa, H.R., Spencer-Martins, I., Gonçalves, P., 2004. Differential regulation by glucose and
fructose of a gene encoding a specific fructose/H+ symporter inSaccharomyces sensu stricto yeasts.
Yeast 21, 519-530.
Ödman, P., Johansen, C.L., Olsson, L., Gernaey, K.V., Lantz, A.E., 2009. On-line estimation of biomass,
glucose and ethanol in Saccharomyces cerevisiae cultivations using in-situ multi-wavelength
fluorescence and software sensors. Journal of Biotechnology 144, 102-112.

1
Appendix
Table 4: The analysis results of HPLC measurements of raw wort.
Dextrin Maltotriose Maltose Glucose Fructose
Total fermentable sugar Total sugar Lactic acid Glycerol
Formic acid mg/L Acetic acid Ethanol
30,9 8,98 47,52 13,86 2,83 73,19 104,1 120 68 - 6 0,032
30,9 8,95 47,39 13,84 2,82 73 103,9 119 65 - 6,5 0,012
29,9 9,41 48,01 14,26 2,87 74,55 104,4 129 63 - 7,4 0,6
30,9 9,38 46,24 14,5 2,86 72,98 103,9 129 45 98 9 0,032
30,2 9,08 45,58 13,99 2,86 71,51 101,7 123 45 89 8,4 0,041
30,1 9,05 45,05 13,97 2,82 70,89 101,0 123 45 90 8,7 0,038
31,1 9,3 45,67 14,45 2,88 72,3 103,4 127 45 94 9,1 0,03
30,3 9,12 45,5 14,05 2,84 71,51 101,8 123 77 - 9,4 0,24
30,2 9,07 45,19 14,02 2,78 71,06 101,3 123 47 91 7,6 0,093
Average 31 g/L 9 g/L 46 g/L 14 g/L 3 g/L 72 g/L 103 g/L 124 mg/L 56 mg/L 8 mg/L 0,1 g/L Standard deviation 0,45 0,17 1,11 0,24 0,03 1,20 1,37 3,61 12,64 1,20 0,19