monitoring report 2010 quarter 1 malawi revenue authority nlgfc national local government finance...
TRANSCRIPT

Ministry of Finance | Quarter 3 of 2015/16 FY i
MALAWI GOVERNMENT
2015/16 BUDGET PERFORMANCE
QUARTERLY REPORT
(Q3)
Ministry of Finance, Economic Planning & Development
P.O. Box 30049
Lilongwe 3
Malawi
June 2016
Ministry of Finance | Quarter 3 of 2015/16 FY ii
Table of Contents
FOREWORD ..................................................................................................................................................III
ABBREVIATIONS AND ACRONYMS ......................................................................................................... IV
EXECUTIVE SUMMARY .............................................................................................................................. V
REVENUE PERFORMANCE .......................................................................................................................................... V
PERFORMANCE OF GRANTS AND LOANS ....................................................................................................................... V
EXPENDITURES PERFORMANCE.................................................................................................................................. VI
1 INTRODUCTION ................................................................................................................ 7
1.1 BACKGROUND TO THE REPORT ...................................................................................................................... 7
1.2 KEY OBJECTIVES OF THE REPORT ................................................................................................................... 7
1.3 METHODOLOGY ......................................................................................................................................... 8
1.4 LAYOUT OF THE REPORT .............................................................................................................................. 8
2 PERFORMANCE OF DOMESTIC REVENUES ........................................................... 9
2.1 INTRODUCTION ................................................................................................................................................. 9
2.2 OVERALL PERFORMANCE IN REVENUE COLLECTION .................................................................................................. 9
2.3 TAX REVENUE PERFORMANCE ............................................................................................................................ 10
2.4 PERFORMANCE OF NON – TAX REVENUES (NTRS) IN THE THIRD QUARTER ................................................................ 11
2.5 GENERAL REVENUE TREND ................................................................................................................................ 12
2.6 CONCLUSION .................................................................................................................................................. 13
3 PERFORMANCE OF GRANTS .............................................................................. 14
3.1 INTRODUCTION ........................................................................................................................................ 14
3.2 GRANTS PERFORMANCE IN QUARTER ........................................................................................................... 14
3.3 CONCLUSION ........................................................................................................................................... 15
4 EXPENDITURE PERFORMANCE ......................................................................... 16
4.1 INTRODUCTION ........................................................................................................................................ 16
4.2 PERFORMANCE OF OVERALL EXPENDITURES .................................................................................................. 17
4.2.1 PERFORMANCE OF RECURRENT BUDGET ....................................................................................................... 18
4.2.1.1 Expenditures under Personal Emoluments (PE) .............................................................................. 18
4.2.1.2 Other Recurrent Transactions (ORT) ............................................................................................. 18
4.2.1.3 Social Spending ............................................................................................................................... 19
4.2.2 PERFORMANCE OF DEVELOPMENT BUDGET ................................................................................................... 21
4.3 CONCLUSION ........................................................................................................................................... 22
5 CONCLUSION AND RECOMMENDATIONS ....................................................... 23

Ministry of Finance | Quarter 3 of 2015/16 FY iii
Foreword
This Quarterly Budget Performance Report is premised on the performance of
the National Budget implementation in the third quarter of the 2015/16 Fiscal
Year. The report provides a detailed analysis of all the revenue that
Government collects; status of grants and loans and the subsequent
expenditures that Government has incurred in the quarter under review. The
main objective of this report is to appraise all stakeholders on the current status
of National Budget implementation, including risks and challenges associated
with it, so that where necessary, remedial measures can be undertaken much
earlier to salvage the situation.
The Ministry of Finance hopes that the information provided in this report will
be valuable and informative to all the stakeholders. Any further suggestions for
improvements are welcome and can be submitted to the Secretary to the
Treasury.
Ministry of Finance | Quarter 3 of 2015/16 FY iv
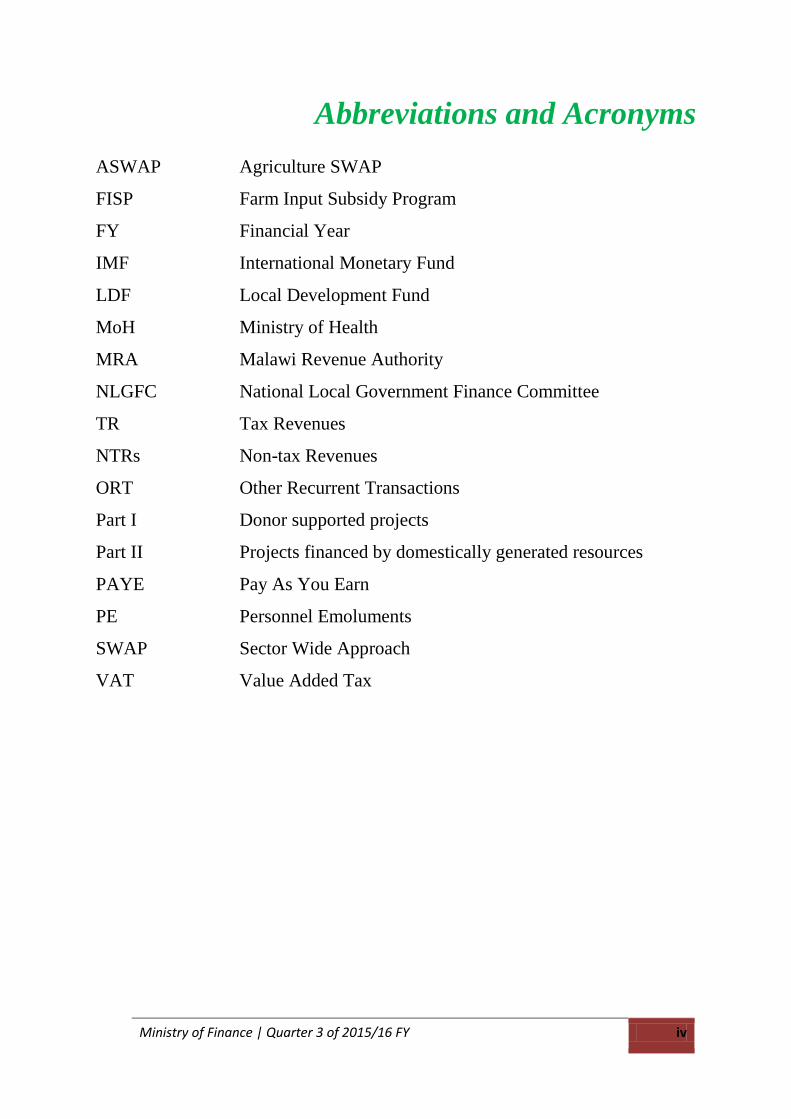
Abbreviations and Acronyms
ASWAP Agriculture SWAP
FISP Farm Input Subsidy Program
FY Financial Year
IMF International Monetary Fund
LDF Local Development Fund
MoH Ministry of Health
MRA Malawi Revenue Authority
NLGFC National Local Government Finance Committee
TR Tax Revenues
NTRs Non-tax Revenues
ORT Other Recurrent Transactions
Part I Donor supported projects
Part II Projects financed by domestically generated resources
PAYE Pay As You Earn
PE Personnel Emoluments
SWAP Sector Wide Approach
VAT Value Added Tax

Ministry of Finance | Quarter 3 of 2015/16 FY v
Executive Summary
Revenue Performance
In the 2015/16 Financial Year, Government plans to collect a total of K666.3
billion in Domestic Revenues of which, K592.4 billion and K73.9 billion is
from Tax Revenues and Non-Tax Revenues, respectively. In the Third Quarter
of the Financial Year, total Domestic Revenues were projected to be K164.6
billion of which, K145.3 billion were Tax Revenues and K19.3 billion were
Non-Tax revenue. However, the outturn for Domestic Revenues for this quarter
was K152.6 billion of which K138.5 billion was Tax Revenue and K14.1 billion
on Non – Tax Revenues, reflecting an underperformance of K12.0 billion. Tax
revenues underperformed by K6.8 billion while Non-Tax revenues by K5.3
billion.
Performance of Grants and Loans
In the 2015/16 Financial Year, Government projects to receive Grants
amounting to K97.1 billion, of which, K6.9 billion are Program Grants, K37.2
billion are Dedicated Grants and K52.9 billion are Project Grants. In the Third
Quarter of the Financial Year, expected disbursements from Grants were K67.2
billion, of which K27.1 billion was Dedicated Grants and K40.1 billion was to
come from Project Grants. The Outturn for the Third Quarter of the Financial
Year represents an overall underperformance of Grants by K38.4 billion. Total
Grants received amounted to K28.7 billion, out of the projected K67.2 billion
during the period under review representing an underperformance of 57.2
percent.
Ministry of Finance | Quarter 3 of 2015/16 FY vi
Expenditures Performance
In the 2015/16 Financial Year, Government planned to spend K930 billion,
including net lending. Out of this sum, K705.9 billion is planned for Recurrent
Expenditure and K224.1 billion for Development Budget Expenditure. In the
Third Quarter of the financial year, Government planned to spend K297.2
billion including net lending, of which, K184.7 billion is Recurrent Expenditure,
K112.4 billion is Development Budget Expenditure and a net lending of K0.2
billion. However, overall, Government spent K243.4 billion reflecting an under
expenditure of K53.6 billion.
Ministry of Finance | Quarter 3 of 2015/16 FY 7
1 INTRODUCTION
1.1 Background to the Report
In June 2015, the National Assembly approved a Budget of K930 billion for the
2015/16 Financial Year (FY). This Budget is expected to be financed by
Domestic Resources amounting to K666.3 billion and K97.1 billion from Grants
and Loans.
In order to assess the performance of the National Budget from time to time, a
report is produced on quarterly basis to provide insight into all the relevant
components of the budget.
This report therefore, examines performance of the National Budget in meeting
the set targets for Third Quarter (January to March 2016) of the Financial Year.
It highlights where discrepancies between the projected and the outturn figures
have occurred and also provides a possible explanation for such discrepancies.
1.2 Key Objectives of the Report
The main objective of this report is to present the performance of Government
in implementing the National Budget in the Third Quarter of the 2015/16
Financial Year. Specific objectives of the report are:
(i) To present the status of Domestic Revenues;
(ii) To report on performance of Grants and Loans from Development
Partners; and
Ministry of Finance | Quarter 3 of 2015/16 FY 8
(iii) To present the details of Expenditures of Government in the Third
Quarter of the Financial Year.
1.3 Methodology
The review and assessment of Receipts and Expenditures for the Second
Quarter of the Financial Year was done in January 2016. The work involved
analysis of data from the Reserve Bank of Malawi, Spending Agencies, and
consultations with various Stakeholders.
1.4 Layout of the Report
The First Chapter introduces the report, its objectives and methodology in
assessing performance. The Second and Third Chapters discuss the performance
of Revenues and Grants, respectively. The Fourth Chapter focuses on the
discussion of Expenditures, while Chapter Five concludes the report.
Ministry of Finance | Quarter 3 of 2015/16 FY 9
2 Performance of Domestic Revenues
2.1 Introduction
In the 2015/16 Financial Year, Government projected to collect total Domestic
Revenues to the tune of K666.3 billion, of which, K592.4 billion were projected
to be Tax Revenues and K73.9 billion Non-Tax Revenues (NTRs). In the Third
Quarter of the Financial Year, total net Domestic Revenues were projected to
amount to K164.6 billion of which, K145.3 billion was expected to be Tax
Revenues while Non-Tax Revenues were projected at K19.3 billion. This
Chapter seeks to assess the performance of Government in Revenue collection
during the Third Quarter of the Financial Year by comparing the Revenue
Outturn for the quarter against the set targets; and discussing some of the
underlying factors that explain the variances.
2.2 Overall Performance in Revenue Collection
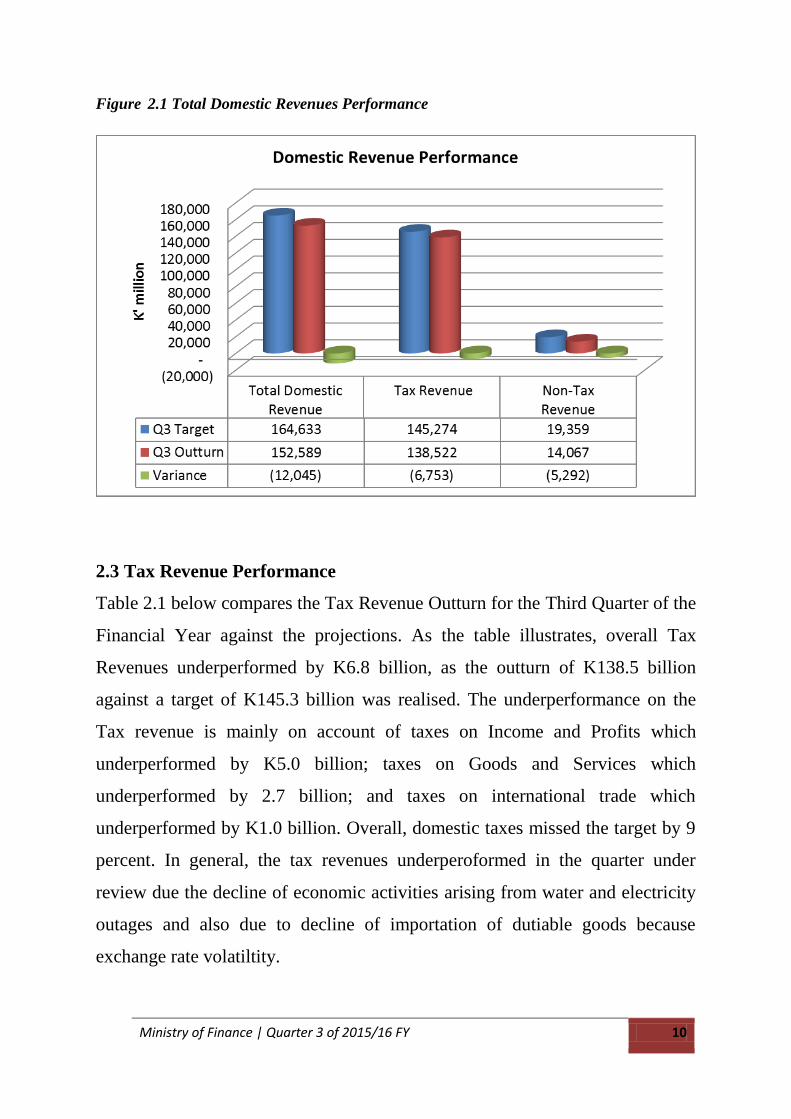
Figure 2.1 below compares the outturn in Domestic Revenues in the Third
Quarter of the Financial Year against their corresponding targets. As indicated
overall, Domestic Revenues underperformed by K12.0 billion as compared to
its target. Total Domestic Revenues collected amounted to K152.6 billion
against a target of K164.6 billion. This translates to undercollection of 7.3
percent.
Ministry of Finance | Quarter 3 of 2015/16 FY 10
Figure 2.1 Total Domestic Revenues Performance
2.3 Tax Revenue Performance
Table 2.1 below compares the Tax Revenue Outturn for the Third Quarter of the
Financial Year against the projections. As the table illustrates, overall Tax
Revenues underperformed by K6.8 billion, as the outturn of K138.5 billion
against a target of K145.3 billion was realised. The underperformance on the
Tax revenue is mainly on account of taxes on Income and Profits which
underperformed by K5.0 billion; taxes on Goods and Services which
underperformed by 2.7 billion; and taxes on international trade which
underperformed by K1.0 billion. Overall, domestic taxes missed the target by 9
percent. In general, the tax revenues underperoformed in the quarter under
review due the decline of economic activities arising from water and electricity
outages and also due to decline of importation of dutiable goods because
exchange rate volatiltity.

Ministry of Finance | Quarter 3 of 2015/16 FY 11
Table 2.1 Tax Revenue Performance
QIII Projection QIII Actual Variance
K' Million
Tax revenue (Net) 145,274.36 138,521.83 (6,752.53)
Income and profits 77,176.26 72,223.35 (4,952.91)
Individual 42,843.22 45,308.05 2,464.83
Corporate 23,019.73 15,344.45 (7,675.28)
Withholding 11,313.31 11,570.85 257.54
Goods and services 57,559.95 54,834.87 (2,725.08)
VAT 45,234.65 42,645.18 (2,589.46)
Excise Duties 12,325.30 12,189.69 (135.61)
International trade 13,724.09 12,724.25 (999.83)
Import duty 13,595.63 12,469.63 (1,126.00)
Prepayment 128.46 254.62 126.17
Other (3,185.93) (1,260.64) 1,925.29
Misc. duties 199.61 124.82 (74.79)
Tax refunds (4,049.45) (2,064.30) 1,985.15
Penalties 246.06 289.61 43.56
Dividend 415.80 386.57 (29.23)
Turn-over tax 2.05 2.66 0.60
2.4 Performance of Non – Tax Revenues (NTRs) in the Third Quarter
Table 2.2 below presents the outturn in NTRs in the Third Quarter of the
2015/16 Financial Year against their set targets. Actual NTRs amounted to
K14.1 billion compared to their target of K19.4 billion, thus an undercollection
of K5.3 billion. This unfavourable performance is mainly attributed to
underperformance on all categories of NTRs. Only the Road Tax and Rural
Electrification Levy overperformed by K0.4 billion and K0.7 billion
respectively. The general decline in economic activities as observed under the
tax revenues had also an impact in the performance of NTRs. Another reason
was that a dividend was expected from the Reserve Bank of Malawi but was
never realised in the quarter under review.

Ministry of Finance | Quarter 3 of 2015/16 FY 12
Table 2.2 Non – Tax Revenue Performance in theThird Quarter
QIII Projection QIII Actual Variance
K' Million
Non-Tax Revenue 19,358.87 14,066.67 (5,292.20)
Departmental receipts 3,650.00 3,232.89 (417.11)
Road Levy 4,906.29 4,772.40 (133.89)
Parastatal dividends 5,757.47 (5,757.47)
Rural electrification levy 4,009.11 4,681.04 671.93
Storage Levy 379.38 345.92 (33.46)
Road Tax 656.63 1,034.43 377.80
2.5 General Revenue Trend
This subsection looks at cumulative performance of revenues up to the end the
end of the Third Quarter to determine whether the overall target would be
achieved.
Figure 2.2 below gives a snapshot of revenue performance up to the end of the
Third Quarter:
Figure 2.2: Performance of Revenues

Ministry of Finance | Quarter 3 of 2015/16 FY 13
As it can be seen in Figure 2.2, the revenues started underperfoming in the
Second Quarter and worsened in the Third Quarter resulting in the a cumulative
underperformance of K15.6 billion in the past nine months.
2.6 Conclusion
In aggregate terms, revenue collection in the Third Quarter of the financial year
was below the set targets. Ministries and Departments should continue
prioritising activities that generate revenues. All revenue monitoring agents are
also expected to enhance their operations to boost revenue collection.

Ministry of Finance | Quarter 3 of 2015/16 FY 14
3
Performance of Grants
3.1 Introduction
In the 2015/16 Financial Year, the projected resource inflows from Grants
amount to K97.1 billion, of which, K6.9 billion would be realized from Program
Grants, K37.2 billion from Dedicated Grants and K52.9 billion from Project
Grants.
In the Third Quarter of the 2015/16 Financial Year, Government expected to
receive K67.2 billion in form of Grants. Out of this amount, K27.1 billion is
expected to be Dedicated Grants and K40.1 billion would come from Project
Grants. This Chapter examines the performance of these Grants in the period
under review.
3.2 Grants Performance in Quarter
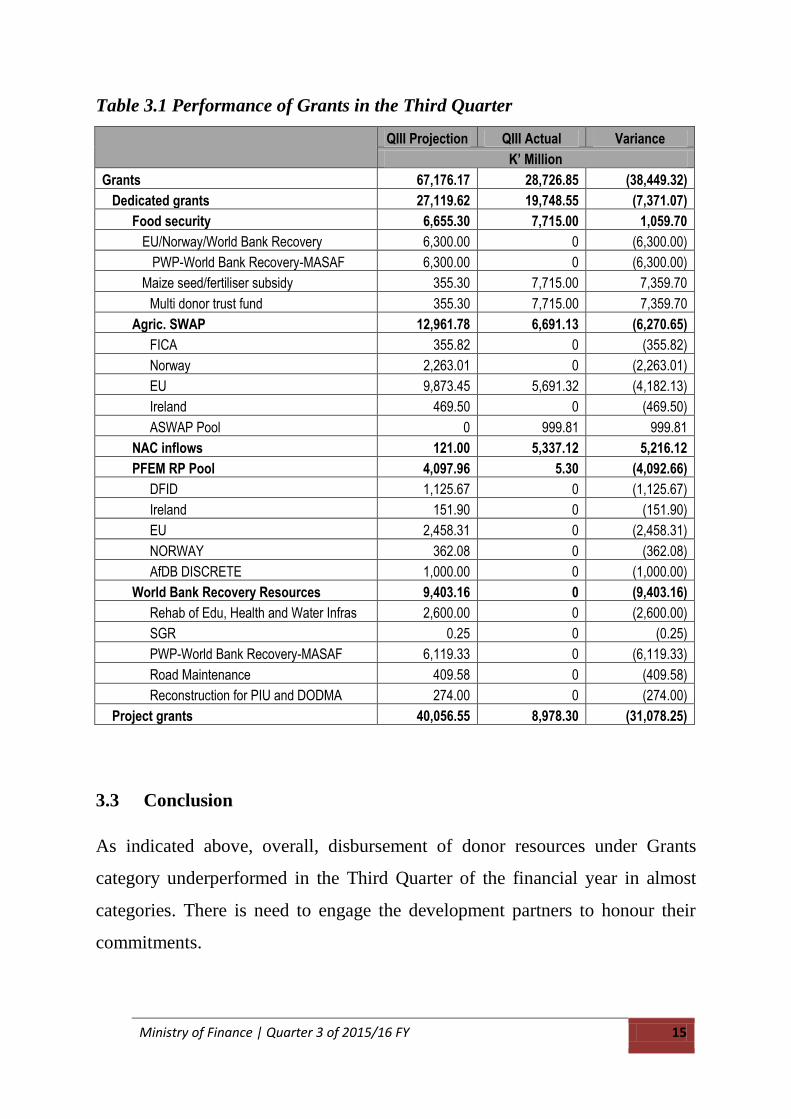
Table 3.1 presents the performance of Grants in the Third Quarter of the
financial year. As indicated, overall, Grants underperformed by K38.4 billion.
In particular, Dedicated and Project Grants underperformed by K7.4 billion and
K31.1 billion respectively. Overall, disbursements under Grants were K28.7
billion against a target of K67.2 billion representing an underperformance of
57.2 percent. All Grants underperformed except grants towards National Aids
Commission (NAC) where disbursements were K5.3 billion against a target of
K0.1 billion.
Ministry of Finance | Quarter 3 of 2015/16 FY 15
Table 3.1 Performance of Grants in the Third Quarter
QIII Projection QIII Actual Variance
K’ Million
Grants 67,176.17 28,726.85 (38,449.32)
Dedicated grants 27,119.62 19,748.55 (7,371.07)
Food security 6,655.30 7,715.00 1,059.70
EU/Norway/World Bank Recovery 6,300.00 0 (6,300.00)
PWP-World Bank Recovery-MASAF 6,300.00 0 (6,300.00)
Maize seed/fertiliser subsidy 355.30 7,715.00 7,359.70
Multi donor trust fund 355.30 7,715.00 7,359.70
Agric. SWAP 12,961.78 6,691.13 (6,270.65)
FICA 355.82 0 (355.82)
Norway 2,263.01 0 (2,263.01)
EU 9,873.45 5,691.32 (4,182.13)
Ireland 469.50 0 (469.50)
ASWAP Pool 0 999.81 999.81
NAC inflows 121.00 5,337.12 5,216.12
PFEM RP Pool 4,097.96 5.30 (4,092.66)
DFID 1,125.67 0 (1,125.67)
Ireland 151.90 0 (151.90)
EU 2,458.31 0 (2,458.31)
NORWAY 362.08 0 (362.08)
AfDB DISCRETE 1,000.00 0 (1,000.00)
World Bank Recovery Resources 9,403.16 0 (9,403.16)
Rehab of Edu, Health and Water Infras 2,600.00 0 (2,600.00)
SGR 0.25 0 (0.25)
PWP-World Bank Recovery-MASAF 6,119.33 0 (6,119.33)
Road Maintenance 409.58 0 (409.58)
Reconstruction for PIU and DODMA 274.00 0 (274.00)
Project grants 40,056.55 8,978.30 (31,078.25)
3.3 Conclusion
As indicated above, overall, disbursement of donor resources under Grants
category underperformed in the Third Quarter of the financial year in almost
categories. There is need to engage the development partners to honour their
commitments.
Ministry of Finance | Quarter 3 of 2015/16 FY 16
4
Expenditure Performance
4.1 Introduction
This chapter highlights the performance of expenditures in the Third Quarter of
the 2015/16 Financial Year and explains the factors underlying the observed
expenditure trends.
In the 2015/16 Financial Year, Government is expected to spend K930 billion
including net lending. Of this sum, K705.9 billion is projected for Recurrent
Expenditures and K224.1 billion for Development Budget Expenditures. In the
quarter under review, total expenditure including net lending and direct
payments was projected at K297.2 billion, broken down as K184.7 billion
recurrent expenditure and K112.4 billion development budget Expenditure with
a net lending of K0.2 billion.
For the quarter under review, out of the projected recurrent expenditure, wages
and salaries were projected at K53.6 billion; Interest Payments at K28.2 billion;
while other purchases of goods and services; and subsidies and transfers were
projected at K37.2 billion and K65.6 billion, respectively. On the other hand,
expenditures on Development Projects budget were projected at K112.4 billion,
broken down as K4.9 billion for domestically financed projects and K107.4
billion for foreign financed projects.
Ministry of Finance | Quarter 3 of 2015/16 FY 17
4.2 Performance of Overall Expenditures
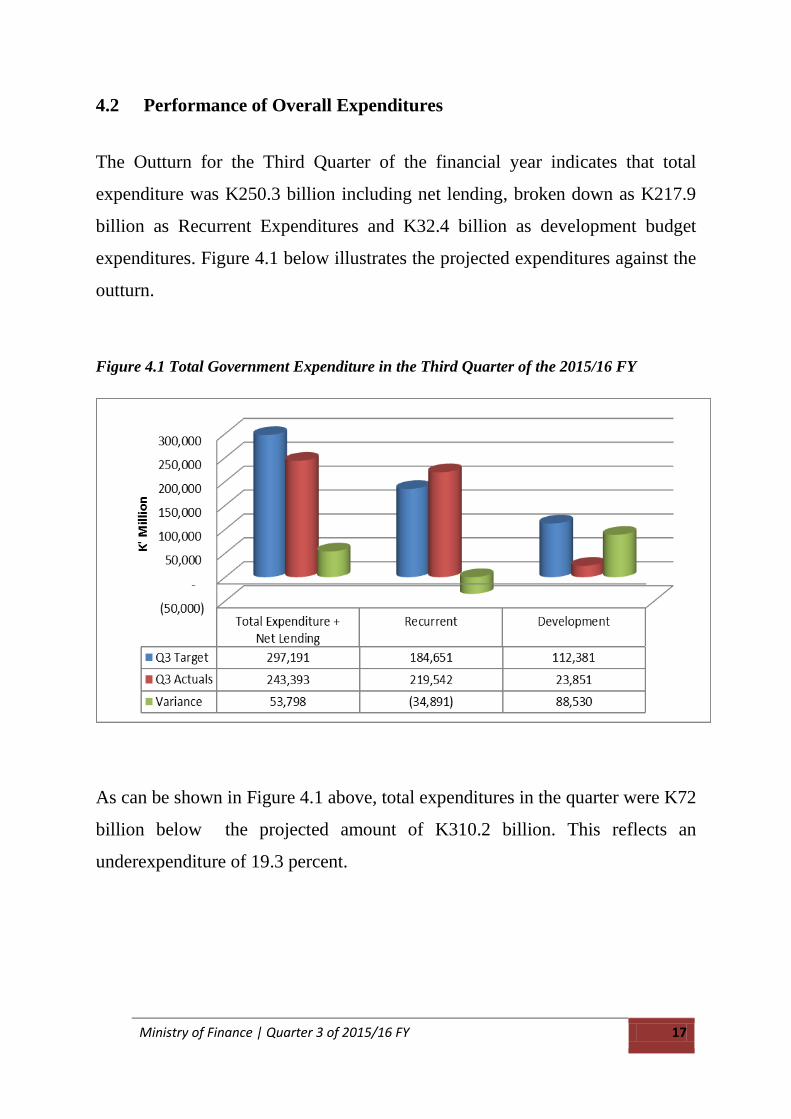
The Outturn for the Third Quarter of the financial year indicates that total
expenditure was K250.3 billion including net lending, broken down as K217.9
billion as Recurrent Expenditures and K32.4 billion as development budget
expenditures. Figure 4.1 below illustrates the projected expenditures against the
outturn.
Figure 4.1 Total Government Expenditure in the Third Quarter of the 2015/16 FY
As can be shown in Figure 4.1 above, total expenditures in the quarter were K72
billion below the projected amount of K310.2 billion. This reflects an
underexpenditure of 19.3 percent.
Ministry of Finance | Quarter 3 of 2015/16 FY 18
4.2.1 Performance of Recurrent Budget
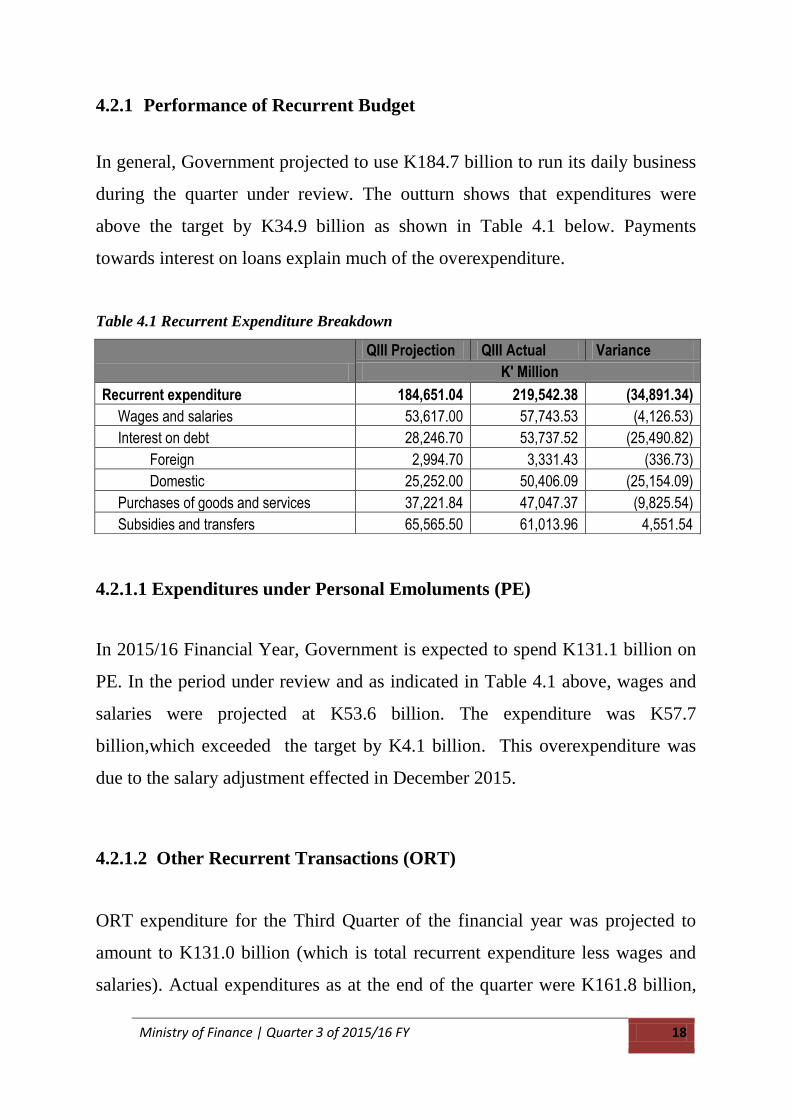
In general, Government projected to use K184.7 billion to run its daily business
during the quarter under review. The outturn shows that expenditures were
above the target by K34.9 billion as shown in Table 4.1 below. Payments
towards interest on loans explain much of the overexpenditure.
Table 4.1 Recurrent Expenditure Breakdown
QIII Projection QIII Actual Variance
K' Million
Recurrent expenditure 184,651.04 219,542.38 (34,891.34)
Wages and salaries 53,617.00 57,743.53 (4,126.53)
Interest on debt 28,246.70 53,737.52 (25,490.82)
Foreign 2,994.70 3,331.43 (336.73)
Domestic 25,252.00 50,406.09 (25,154.09)
Purchases of goods and services 37,221.84 47,047.37 (9,825.54)
Subsidies and transfers 65,565.50 61,013.96 4,551.54
4.2.1.1 Expenditures under Personal Emoluments (PE)
In 2015/16 Financial Year, Government is expected to spend K131.1 billion on
PE. In the period under review and as indicated in Table 4.1 above, wages and
salaries were projected at K53.6 billion. The expenditure was K57.7
billion,which exceeded the target by K4.1 billion. This overexpenditure was
due to the salary adjustment effected in December 2015.
4.2.1.2 Other Recurrent Transactions (ORT)
ORT expenditure for the Third Quarter of the financial year was projected to
amount to K131.0 billion (which is total recurrent expenditure less wages and
salaries). Actual expenditures as at the end of the quarter were K161.8 billion,

Ministry of Finance | Quarter 3 of 2015/16 FY 19
which was above the target by K30.8 billion and represents an overexpenditure
of 23.5 percent. The overexpenditure is attributed to more than anticipated
payments towards interest on domestic debt and specifically interest on zero-
coupon bonds.
4.2.1.3 Social Spending
This section analyses the performance in terms of social spending, which is a
cushion against economic adversities, especially on the poor, following the
current economic status. The areas isolated as social spending are tabulated in
Table 4.2 below.
In the quarter under review, social spending was planned at K64.6 billion, but
the outturn of K91.0 billion was above the target by about 41percent. The
overexpenditure is mainly attributed to expenditures under the Farm Input
Programme (FISP) since most of the payments were made in the period under
review compared to the preceding quarters. This is because the invoices which
were expected in the preceeding quarters were claimed in the Third Quarter.
Expenditures on FISP alone were above the target by K22.2 billion.

Ministry of Finance | Quarter 3 of 2015/16 FY 20
Table 4.2 Social Spending
Millions of Kwacka
Q3 Q3 Variance
Projection Actual (Q3 Actual - Q3
Proj)
Category
Health Expenditure 17,781.51 18,973.82 1,192.31
Wages 7,259.41 12,880.75 5,621.34
Other Recurrent 8,497.10 5,503.07 (2,994.03)
Ministry of Health ORT 3,791.33 4,147.88 356.56
Local Assemblies ORT 4,555.50 1,291.15 (3,264.35)
Subvented Organisations 150.28 64.04 (86.24)
Development expenditure 2,025.00 590.00 (1,435.00)
Education Expenditure 30,929.00 34,588.36 3,659.36
Wages 14,469.84 22,545.01 8,075.17
Other Recurrent 13,973.55 11,621.93 (2,351.62)
Ministry of Education ORT 3,696.00 2,024.12 (1,671.88)
Local Assemblies ORT 2,058.55 1,378.81 (679.74)
Subvented Organisations 8,219.00 8,219.00 -
Development expenditure 2,485.61 421.42 (2,064.19)
Agriculture Expenditure 13,221.61 35,407.27 22,185.66
Farm Input Subsidy Program 13,221.61 35,407.27 22,185.66
Lands and housing Exoenditures 1,000.00 1,300.00 300.00
Cement and Iron Sheets Subsidy 1,000.00 1,300.00 300.00
Gender, Children, Disability and Social
Welfare 516.15 639.07 122.92
Wages 230.56 312.63 82.07
Other Recurrent 203.46 267.04 63.59
Development expenditure 82.13 59.40 (22.73)
Local Development Fund 1,125.00 100.00 (1,025.00)
Poverty and Disaster Management 23.00 40.95 17.95
Wages 23.00 40.95 17.95
Other Recurrent - - -
Total Social Expenditure 64,596.27 91,049.47 26,453.20

Ministry of Finance | Quarter 3 of 2015/16 FY 21
4.2.2 Performance of Development Budget
On Development Budget, Government planned to spend K112.4 billion in the
Third Quarter, of which, K4.9 billion was to be financed using domestic
resources (Part II) and K107.4 billion was for Foreign Financed Projects (Part
I). Figure 4.2 below depicts the outturn on Development Budget of K23.9
billion, implying an underexpenditure of K88.5 billion. The underexpenditure
was on account of lower than anticipated inflows under both dedicated and
project grants for the Part 1.
Figure 4.2 Performance of the Development Budget
The underexpenditure on the development budget has serious ramifications on
contractual obligations, especially under the infrastructure development
projects. Consquently, this would result in cost escalation for the projects due to
claims on idle time, and some projects will not be completed on time.
Ministry of Finance | Quarter 3 of 2015/16 FY 22
4.3 Conclusion
This Chapter focused on the performance of expenditures of Government in the
Third Quarter of the 2015/16 Financial Year. The expenditures were broken
down into various categories, and the analysis was based on the deviations
between the target and the actual expenditure. Generally, the outturn showed
that expenditure was contained within the targets, but development expenditures
were significantly lower than planned. If the status quo is maintained, projects
will not be completed in time and this may lead to escalation of costs and
possible penalties charges.
Ministry of Finance | Quarter 3 of 2015/16 FY 23
5
Conclusion and Recommendations
The report has shown that revenue collection in the Third Quarter of the
2015/16 Financial Year was below the target in all categories. It is therefore
recommended that revenue collecting institutions, especially those collecting
non-tax revenues, should continue to give priority to revenue enhancing
activities in the remaining quarters to compensate for the underperformance in
the previous quarters. Similary, MRA should also intensify its tax revenue
collection efforts.
Disbursement of resources under Grants underperformed during the quarter
under review. This was mainly on account of low inflows under the dedicated
and project grants. It is recommended that Government should continue
engaging the development partners for a turn-around of the status quo.
On the expenditure side, Government expenditure was below the target for the
quarter. The departure from the target is significant and this may translate to
low levels of services provided in terms of both quality and quantity. If the
status quo is not reversed, the various output targets may not be achieved in this
financial year.
The development budget underspent and physical progress is minimal in most
of the projects. This is mainy due to low funding on both Part I and Part II
projects. It is therefore recommended that Government should continue
Ministry of Finance | Quarter 3 of 2015/16 FY 24
engaging the development partners to improve on disbursements towards Part I
projects and improve on its local resource mobilisation efforts.