monitoring : the art of knowing when and why things go wrong
TRANSCRIPT

Monitoring
the art of knowing when and why things go wrong

1
La 1ère école 100 % dédiée à l'open source
Open Source School est fondée à l'initiative de Smile, leader de l'intégration et de l'infogérance open source, et de l'EPSI,établissement privé pionnier de l’enseignement supérieur en informatique.
Dans le cadre du Programme d’Investissements d’Avenir (PIA), le gouvernement français a décidé de soutenir la création de cette école en lui attribuant une première aide de 1,4M€ et confirme sa volonté de soutenir la filière du Logiciel Libre actuellement en plein développement.
Avec une croissance annuelle de plus de 10%, et 4 000 postes vacants chaque année dans le secteur du Logiciel Libre, OSS entend répondre à la pénurie de compétences du secteur en mobilisant l’ensemble de l’écosystème et en proposant la plus vaste offre en matière de formation aux technologies open source tant en formation initiale qu'en formation continue.

2
Les formations du plein emploi !
Formation Continue
Open Source School "Executive Education" est un organisme de formation agréé qui propose un catalogue de plus de 200 formations professionnelles et différents dispositifs de reconversion permettant le retour à l’emploi (POE) ou une meilleure employabilité pour de nombreux professionnels de l’informatique.
Pour vos demandes : [email protected]
Formation Initiale
100% logiciels libres et 100% alternance, le cursus Open Source School s’appuie sur le référentiel des blocs de compétences de l’EPSI.Il est sanctionné par un titre de niveau I RNCP, Bac+5. Le programme est proposé dans 6 campus à Bordeaux, Lille, Lyon, Montpellier, Nantes, Paris.
3
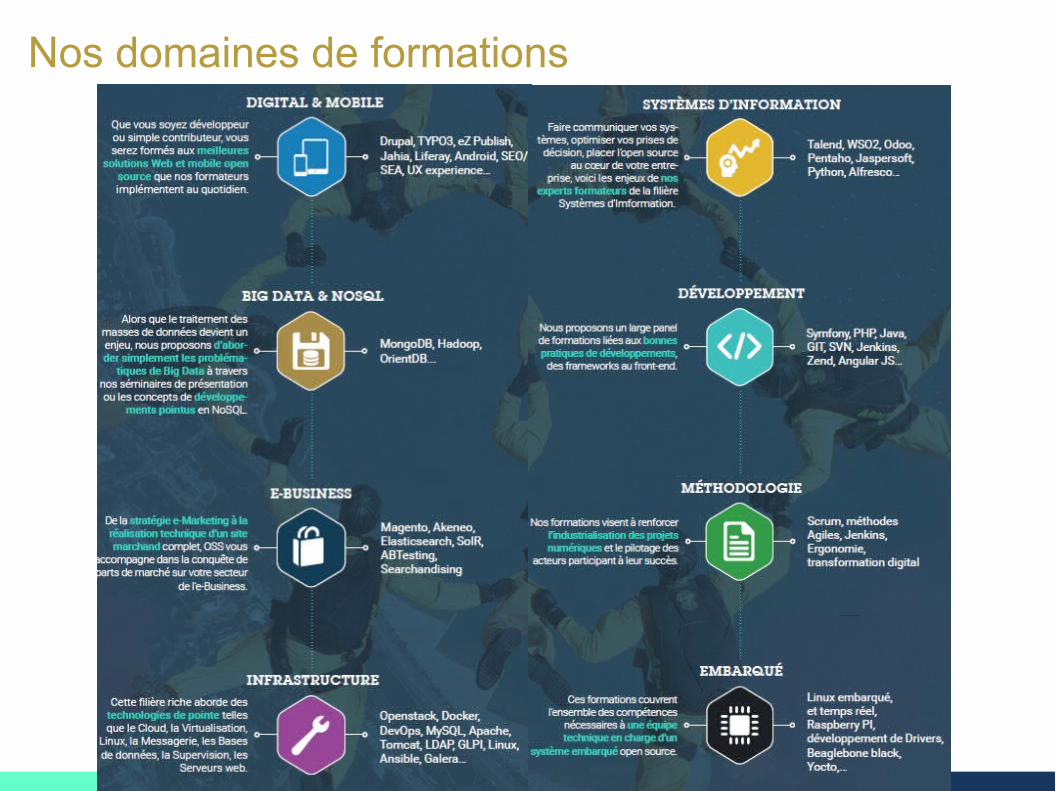
Nos domaines de formations

Principles Monitoring tools Reading graphs Real-life examples
Plan
1 Principles
2 Monitoring tools
3 Reading graphs
4 Real-life examples
www.opensourceschool.fr – Licence Creative Commons (CC BY-SA 3.0 FR) – 2/63

Principles Monitoring tools Reading graphs Real-life examples
Principles
www.opensourceschool.fr – Licence Creative Commons (CC BY-SA 3.0 FR) – 3/63

Principles Monitoring tools Reading graphs Real-life examples
Stating the obvious
Stating the obvious
www.opensourceschool.fr – Licence Creative Commons (CC BY-SA 3.0 FR) – 4/63

Principles Monitoring tools Reading graphs Real-life examples
Stating the obvious
Guess what?
You need monitoring !!
www.opensourceschool.fr – Licence Creative Commons (CC BY-SA 3.0 FR) – 5/63

Principles Monitoring tools Reading graphs Real-life examples
Stating the obvious
Alright, why ?
You application will be down at some point in time, and you’llwant to know it before the users
You will want to know what failed first, because it is the likelycause of the problem
You will want to know how your application behavescompared to projections
You might want to keep an eye on some particular subsystem
www.opensourceschool.fr – Licence Creative Commons (CC BY-SA 3.0 FR) – 6/63

Principles Monitoring tools Reading graphs Real-life examples
What is monitoring
What is monitoring
www.opensourceschool.fr – Licence Creative Commons (CC BY-SA 3.0 FR) – 7/63
Principles Monitoring tools Reading graphs Real-life examples
What is monitoring
What is monitoring
Monitoring is a vague term that encompasses many techniquesused to :
Periodically makes sure everything works fine
Warn you when something is wrong
Take automated corrective actions
Collect performance data periodically and present it to you
Not all monitoring tools implement all these featuressimultaneously, simpler systems may concentrate on one feature
www.opensourceschool.fr – Licence Creative Commons (CC BY-SA 3.0 FR) – 8/63

Principles Monitoring tools Reading graphs Real-life examples
Information theory
Information theory
www.opensourceschool.fr – Licence Creative Commons (CC BY-SA 3.0 FR) – 9/63
Principles Monitoring tools Reading graphs Real-life examples
Information theory
Information theory
To see if something is wrong, you must perform a check
The program that performs the check is often called a probe
The check may return a binary status : working or failing
The check may return data : 35◦C, 1432MB, 14MB/s ...
Such checks are usually compared to a threshold
Failed checks may lead to notification, and even escalation
www.opensourceschool.fr – Licence Creative Commons (CC BY-SA 3.0 FR) – 10/63

Principles Monitoring tools Reading graphs Real-life examples
Information theory
Information theory
In order to get a quick notification, you need to check often
This may increase the load on the server
Checks are not actual users, designing a good check is hard
And often requires additional development !
A single failure does not mean the application is down, asingle success does not mean the application is fully back up
Avoiding false positives and false negatives is hard
www.opensourceschool.fr – Licence Creative Commons (CC BY-SA 3.0 FR) – 11/63

Principles Monitoring tools Reading graphs Real-life examples
Information theory
Polling intervals
Some monitoring tools poll their target every 15 minutes
This is good in some cases
What if you’re doing a 20 minutes load test ? a 5 minutesimport ?
Some monitoring tools poll every 10 seconds
Do you have enough storage space ? Is it really necessary onthe long term ?
www.opensourceschool.fr – Licence Creative Commons (CC BY-SA 3.0 FR) – 12/63
Principles Monitoring tools Reading graphs Real-life examples
Information theory
Data storage
Some monitoring tools store data in RRD databases
Fixed sizeBut you lose accuracy with timeData retention is usually configurable
Others store data in a regular database
Watch for data growth
www.opensourceschool.fr – Licence Creative Commons (CC BY-SA 3.0 FR) – 13/63

Principles Monitoring tools Reading graphs Real-life examples
Monitoring tools
www.opensourceschool.fr – Licence Creative Commons (CC BY-SA 3.0 FR) – 14/63

Principles Monitoring tools Reading graphs Real-life examples
Munin
Munin
www.opensourceschool.fr – Licence Creative Commons (CC BY-SA 3.0 FR) – 15/63

Principles Monitoring tools Reading graphs Real-life examples
Munin
Munin
Munin is a ”graphing” tool
Configuration is almost decentralized, and mostly done on themonitored system
Munin use RRD graphs and has a default polling interval of 5minutes
Munin has a (static) web interface
www.opensourceschool.fr – Licence Creative Commons (CC BY-SA 3.0 FR) – 16/63

Principles Monitoring tools Reading graphs Real-life examples
Munin
Munin: power features
Complex aggregate graphs
Custom probes are simple to write and test
Ability to send notification on thresholds
Easy enough to setup to be used on a single server
www.opensourceschool.fr – Licence Creative Commons (CC BY-SA 3.0 FR) – 17/63

Principles Monitoring tools Reading graphs Real-life examples
Munin
Munin: how to install
aptitude install munin : on the server
aptitude install munin-node : on each monitored system
Or on the same machine, if standalone
aptitude install munin-plugins-extra : additionalplugins
Wait about 5 minutes for munin-cron to trigger
Go to : http://localhost/munin/
You might have to allow from all in/etc/apache2/conf.d/munin
www.opensourceschool.fr – Licence Creative Commons (CC BY-SA 3.0 FR) – 18/63

Principles Monitoring tools Reading graphs Real-life examples
Munin
Munin: configuring plugins
By default, Debian will enable some plugins based on alreadyinstalled packages
Use munin-node-configure to list available and enabledplugins
To enable a new plugin, symlink it in /etc/munin/plugins
Plugins might need configuration in/etc/munin/plugin-conf.d
Usually to change the user the plugin should run asOr transmit environment variables
The name of the symlink can be used to select :
Plugin argument : if eth0, ps apache2
Sub-features or alternate features : df inode,varnish objects
www.opensourceschool.fr – Licence Creative Commons (CC BY-SA 3.0 FR) – 19/63
Principles Monitoring tools Reading graphs Real-life examples
Munin
Munin: testing plugins
Use munin-run to run plugin in the same environment asmunin-node
This avoir permission issues : your plugin may work as rootbut not as munin
You can give arguments such as config to print the pluginconfig
www.opensourceschool.fr – Licence Creative Commons (CC BY-SA 3.0 FR) – 20/63

Principles Monitoring tools Reading graphs Real-life examples
Munin
Munin: writing plugins
A plugin is just a program that returns one or more labelledvalues
It can use any language : C, shell, perl, even PHP
A plugin should have a config argument that makes it printits config
TitleLabelsColorsGraphing options (stacked, lines, differential, units...)
www.opensourceschool.fr – Licence Creative Commons (CC BY-SA 3.0 FR) – 21/63

Principles Monitoring tools Reading graphs Real-life examples
Munin
Munin: configuring nodes for remote polling
Edit /etc/munin/munin-node.confc i d r a l l o w 127 . 0 . 0 . 1 /32c i d r a l l o w $mun i n s e r v e r a d d r e s s
Restart munin-node
Check that you can nc -v host 4949 from the monitoringserver
btw : try list and fetch $plugin
www.opensourceschool.fr – Licence Creative Commons (CC BY-SA 3.0 FR) – 22/63
Principles Monitoring tools Reading graphs Real-life examples
Munin
Munin: adding hosts to the central server
edit /etc/munin/munin.conf[ myse rve r . mydomain . com ]add r e s s myse rve r . mydomain . com
Combined graphs :
[ domain . com ; To ta l s ] #Force i t i n t o the ” foo . com”−domain . . .update no # Turn o f f data−f e t c h i n g f o r t h i s ” hos t ” .
loadsum . g r a p h t i t l e Loads summarisedloadsum . comb ined l oads . sum s e r v e r 1 . mydomain . com : l oad . l oad s e r v e r 2 . mydomain . com : l oad . l oadloadsum . comb ined l oads . l a b e l Combined l o a d s
www.opensourceschool.fr – Licence Creative Commons (CC BY-SA 3.0 FR) – 23/63

Principles Monitoring tools Reading graphs Real-life examples
Nagios
Nagios
www.opensourceschool.fr – Licence Creative Commons (CC BY-SA 3.0 FR) – 24/63
Principles Monitoring tools Reading graphs Real-life examples
Nagios
Nagios
Nagios is a service monitoring application
It is based on a Green-Yellow-Red trichotomy (OK,WARNING and CRITICAL)
It can be used for graphing through third-party components(nagiosgrapher)
Its the heart of many other network monitoring tools(Centreon...)
It is old, and has successors now : ICINGA, Shinken
www.opensourceschool.fr – Licence Creative Commons (CC BY-SA 3.0 FR) – 25/63
Principles Monitoring tools Reading graphs Real-life examples
Nagios
Nagios: features
The largest collection of probes in the world
In fact, other solutions stopped bothering and tend to becompatible with nagios probes
Based on hosts and services
contacts can be defined, and escalated to
It is possible to schedule downtime, and temporaryacknowlege a problem
Nagios has flap detection
Heaps of third-party components (Nagvis...)
Passive monitoring (with freshness checks)
Distribution / redundancy
www.opensourceschool.fr – Licence Creative Commons (CC BY-SA 3.0 FR) – 26/63

Principles Monitoring tools Reading graphs Real-life examples
Nagios
Nagios: installation
aptitude install nagios3
Configure standard HTTP authentication in/etc/apache2/conf.d/nagios3.conf if required
Log in to http://localhost/nagios3/
www.opensourceschool.fr – Licence Creative Commons (CC BY-SA 3.0 FR) – 27/63

Principles Monitoring tools Reading graphs Real-life examples
Nagios
Nagios: object typesSimple types
hosts : a physical or virtual server, printer, switch...services : something a host does or has, and that you want tomonitorcontacts : where and how you want to send notificationscommands : probes and notification methods
Group types
hostgroupservicegroupcontactgroup
Advanced types :
time periodsservice/host dependancyservice/host escalationservice/host extended information : only cosmetic
www.opensourceschool.fr – Licence Creative Commons (CC BY-SA 3.0 FR) – 28/63
Principles Monitoring tools Reading graphs Real-life examples
Nagios
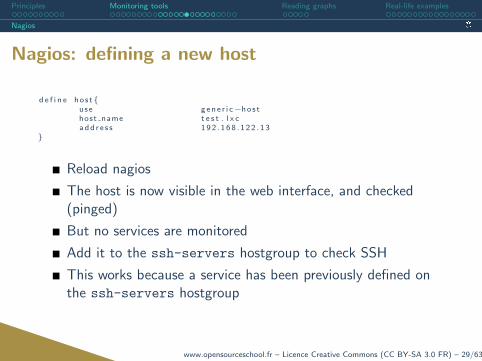
Nagios: defining a new host
d e f i n e hos t{use g en e r i c−hos thost name t e s t . l x cadd r e s s 192 . 168 . 122 . 13
}
Reload nagios
The host is now visible in the web interface, and checked(pinged)
But no services are monitored
Add it to the ssh-servers hostgroup to check SSH
This works because a service has been previously defined onthe ssh-servers hostgroup
www.opensourceschool.fr – Licence Creative Commons (CC BY-SA 3.0 FR) – 29/63
Principles Monitoring tools Reading graphs Real-life examples
Nagios
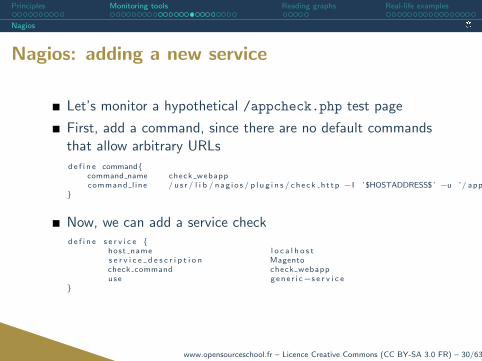
Nagios: adding a new service
Let’s monitor a hypothetical /appcheck.php test page
First, add a command, since there are no default commandsthat allow arbitrary URLs
d e f i n e command{command name check webappcommand l ine / u s r / l i b / nag i o s / p l u g i n s / ch e ck h t t p −I ’$HOSTADDRESS$’ −u ’/ appcheck . php ’
}
Now, we can add a service checkd e f i n e s e r v i c e {
host name l o c a l h o s ts e r v i c e d e s c r i p t i o n Magentocheck command check webappuse g en e r i c−s e r v i c e
}
www.opensourceschool.fr – Licence Creative Commons (CC BY-SA 3.0 FR) – 30/63
Principles Monitoring tools Reading graphs Real-life examples
Nagios
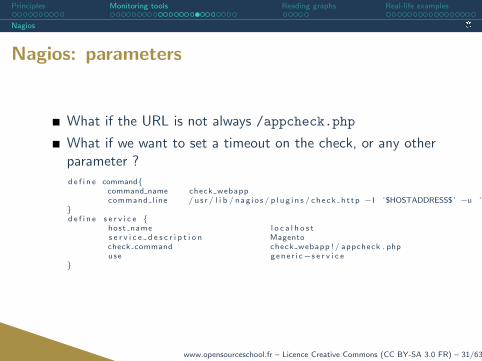
Nagios: parameters
What if the URL is not always /appcheck.php
What if we want to set a timeout on the check, or any otherparameter ?
d e f i n e command{command name check webappcommand l ine / u s r / l i b / nag i o s / p l u g i n s / ch e ck h t t p −I ’$HOSTADDRESS$’ −u ’$ARG1$ ’
}d e f i n e s e r v i c e {
host name l o c a l h o s ts e r v i c e d e s c r i p t i o n Magentocheck command check webapp !/ appcheck . phpuse g en e r i c−s e r v i c e
}
www.opensourceschool.fr – Licence Creative Commons (CC BY-SA 3.0 FR) – 31/63

Principles Monitoring tools Reading graphs Real-life examples
Nagios
Nagios: custom probes
A custom probe is simply a plugin that returns 0, 1, 2 or 3
They may return performance data for graphing, if relevant
All textual output is saved, but has no consequence
As with munin, any language can be used
Of course, the faster the better, standard plugins are thuswritten in C
www.opensourceschool.fr – Licence Creative Commons (CC BY-SA 3.0 FR) – 32/63
Principles Monitoring tools Reading graphs Real-life examples
Nagios
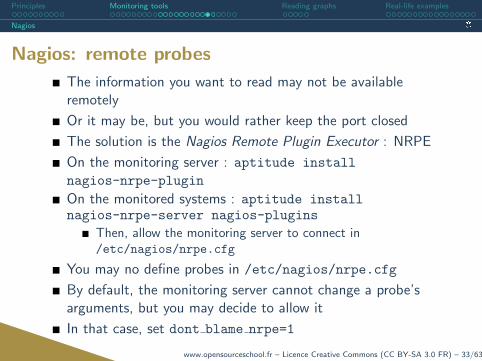
Nagios: remote probes
The information you want to read may not be availableremotely
Or it may be, but you would rather keep the port closed
The solution is the Nagios Remote Plugin Executor : NRPE
On the monitoring server : aptitude install
nagios-nrpe-plugin
On the monitored systems : aptitude installnagios-nrpe-server nagios-plugins
Then, allow the monitoring server to connect in/etc/nagios/nrpe.cfg
You may no define probes in /etc/nagios/nrpe.cfg
By default, the monitoring server cannot change a probe’sarguments, but you may decide to allow it
In that case, set dont blame nrpe=1
www.opensourceschool.fr – Licence Creative Commons (CC BY-SA 3.0 FR) – 33/63

Principles Monitoring tools Reading graphs Real-life examples
Nagios
Nagios: nrpe config
write a plugin that tests if a controversial package has beeninstalled
In nrpe local.cfg :
command [ check open jdk ]=/ u s r / l i b / nag i o s / p l u g i n s / check open jdk
In nagios config :
d e f i n e s e r v i c e {host name l o c a l h o s ts e r v i c e d e s c r i p t i o n Magentocheck command ch e c k n r p e 1 a r g ! check open jdkuse g en e r i c−s e r v i c e
}
www.opensourceschool.fr – Licence Creative Commons (CC BY-SA 3.0 FR) – 34/63

Principles Monitoring tools Reading graphs Real-life examples
collectd
collectd
www.opensourceschool.fr – Licence Creative Commons (CC BY-SA 3.0 FR) – 35/63
Principles Monitoring tools Reading graphs Real-life examples
collectd
collectd
Collectd is a small monitoring tool
uses RRD with a very fast default refresh rate (10 seconds)
Plugins are mostly C and not very easy to adapt
It is pretty easy to compile if you need to
It is perfect for load test monitoring
It is not perfect for long-term monitoring !
www.opensourceschool.fr – Licence Creative Commons (CC BY-SA 3.0 FR) – 36/63
Principles Monitoring tools Reading graphs Real-life examples
collectd
collectd: installation
aptitude install collectd
Edit /etc/collectd/collectd.conf
Enable the plugins you needAnd configure them
For instance, you can display apache2 and mysqld processesseparatelyAnd you might need to enter a mysql password
www.opensourceschool.fr – Licence Creative Commons (CC BY-SA 3.0 FR) – 37/63
Principles Monitoring tools Reading graphs Real-life examples
collectd
collectd: visualization
By default, collectd only fills RRD files, and does not showyou anything
Fortunately, we are provided with a CGI script for that
You can rsync the rrd files and display them locally to avoidmessing with apache config
/usr/share/doc/collectd/examples
Copy collection3 to /var/www
Install libconfig-general-perl andlibregexp-common-perl
AllowOverride All inside /var/www/collection3
Access http://localhost/collection3/bin
Use the controls to zoom on the graphs !
www.opensourceschool.fr – Licence Creative Commons (CC BY-SA 3.0 FR) – 38/63

Principles Monitoring tools Reading graphs Real-life examples
Reading graphs
www.opensourceschool.fr – Licence Creative Commons (CC BY-SA 3.0 FR) – 39/63

Principles Monitoring tools Reading graphs Real-life examples
Reading graphs
”Traffic lights” monitoring is easy to comprehend
It is working (green-OK)It might fail soon (yellow-WARNING)It is failing (red-CRITICAL)
Graphs are harder
Where do I put the threshold ?Is this pattern normal ?What is happening here ?
www.opensourceschool.fr – Licence Creative Commons (CC BY-SA 3.0 FR) – 40/63

Principles Monitoring tools Reading graphs Real-life examples
Common pitfalls
Common pitfalls
www.opensourceschool.fr – Licence Creative Commons (CC BY-SA 3.0 FR) – 41/63

Principles Monitoring tools Reading graphs Real-life examples
Common pitfalls
Common pitfalls: understanding the metric
What is it i’m reading
Load average : what does it mean, what does it NOT mean
CPU usage : user vs system
Memory
Usually extremely confusingsimple available/free graphs are wrong by definition (becausememory management is not simple)graphs that show caches and buffers are probably more reliable
How is the value obtained ?
www.opensourceschool.fr – Licence Creative Commons (CC BY-SA 3.0 FR) – 42/63
Principles Monitoring tools Reading graphs Real-life examples
Common pitfalls
Common pitfalls: monitoring tool limitations
Sampling rate
Frequent spikes will not appeargauge or counter ?
The probe is just another process : it may hang is the serveris loading
Holes in the graph are not a cause for alarm in small amounts
Before reading a graph, check the date : reading stale data isuseless
www.opensourceschool.fr – Licence Creative Commons (CC BY-SA 3.0 FR) – 43/63

Principles Monitoring tools Reading graphs Real-life examples
Common pitfalls
Common pitfalls: graphing limitations
Always check the scales (time scale at top, metric verticalscale, min max and average values at bottom)
A huge spike will completely ”crush” the graph
Adjust the axes if necessary
www.opensourceschool.fr – Licence Creative Commons (CC BY-SA 3.0 FR) – 44/63
Principles Monitoring tools Reading graphs Real-life examples
Common pitfalls
Common pitfalls: interpretation
This weird looking pattern that happened at the same time asthe application bug might just be perfectly normal
Check the history of the graphs, does the pattern repeat itself? regularly ?
You should see your backups
When performance-enhancing changes enter production,check the graphs !
When ”we swear it won’t affect performance” changes enterproduction, double-check the graphs !
www.opensourceschool.fr – Licence Creative Commons (CC BY-SA 3.0 FR) – 45/63

Principles Monitoring tools Reading graphs Real-life examples
Real-life examples
www.opensourceschool.fr – Licence Creative Commons (CC BY-SA 3.0 FR) – 46/63

Principles Monitoring tools Reading graphs Real-life examples
A website has TV coverage on high-audience channel
A website has TV coverage on high-audience channel
www.opensourceschool.fr – Licence Creative Commons (CC BY-SA 3.0 FR) – 47/63
Principles Monitoring tools Reading graphs Real-life examples
A website has TV coverage on high-audience channel
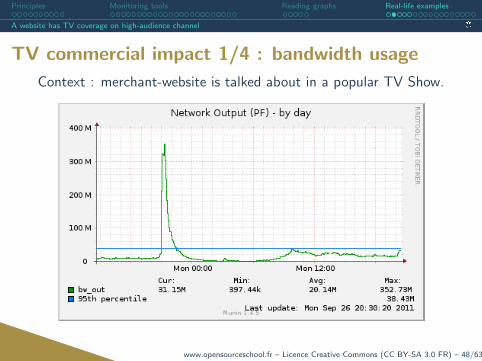
TV commercial impact 1/4 : bandwidth usage
Context : merchant-website is talked about in a popular TV Show.
www.opensourceschool.fr – Licence Creative Commons (CC BY-SA 3.0 FR) – 48/63
Principles Monitoring tools Reading graphs Real-life examples
A website has TV coverage on high-audience channel
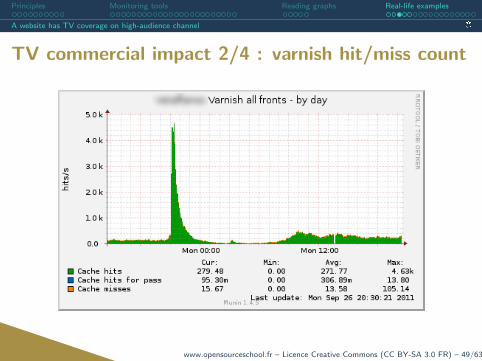
TV commercial impact 2/4 : varnish hit/miss count
www.opensourceschool.fr – Licence Creative Commons (CC BY-SA 3.0 FR) – 49/63

Principles Monitoring tools Reading graphs Real-life examples
A website has TV coverage on high-audience channel
TV commercial impact 2/4 : what to read
What do we read in those two graphs :
1 HTTP hit per second climbs from less than 500/s to almost5000/s (10-fold raise)
2 In the varnish graph we see clearly that the cache scales(green). Not the misses (orange).
3 The burst doesn’t last : people in front of TV go immediatlyor forget. Most don’t stay long on the site.
4 The network usage grows 10 folds too. The average is around20Mb/s, the 95th percentile is around 40 and here we reached352Mb/s max.
5 At no time do we see a ”flat” in either graph. Nothingsaturated. Meaning that nothing was here to limit the goodimpact of TV coverage.
www.opensourceschool.fr – Licence Creative Commons (CC BY-SA 3.0 FR) – 50/63
Principles Monitoring tools Reading graphs Real-life examples
A website has TV coverage on high-audience channel
TV commercial impact 4/4 : analysis
Point 2 above is very good it means that varnish is able tocache most hits, and the rate of the non-cached hits does notgrow with frequentation. This situation is the best one canwish for.
Pre-requisites : the application is design and developped withvarnish in mind and devloppers understand what the gain isProbable outcome : platform can handle massivefrequentation with no sweat.
No network saturation means the website’s users probably hadno visible symptom of slowness.
Reality outcome : this particular website successfully handled it’smost active day (and highest daily income to date).
www.opensourceschool.fr – Licence Creative Commons (CC BY-SA 3.0 FR) – 51/63

Principles Monitoring tools Reading graphs Real-life examples
Important news impact on editorial website
Important news impact on editorial website
www.opensourceschool.fr – Licence Creative Commons (CC BY-SA 3.0 FR) – 52/63

Principles Monitoring tools Reading graphs Real-life examples
Important news impact on editorial website
Big news on news-site 1/3 : varnish hit/miss countContext : newspaper-like website with eZ publish. MuammarGaddafi dies that day. The daily evening newsletter links to thearticle.
www.opensourceschool.fr – Licence Creative Commons (CC BY-SA 3.0 FR) – 53/63
Principles Monitoring tools Reading graphs Real-life examples
Important news impact on editorial website
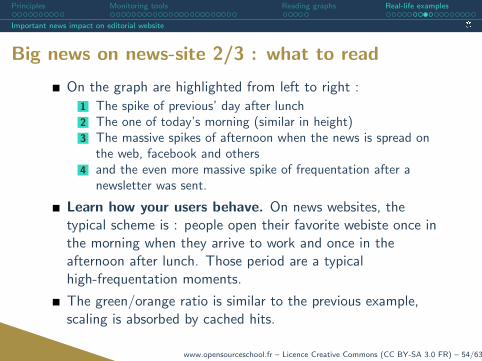
Big news on news-site 2/3 : what to read
On the graph are highlighted from left to right :
1 The spike of previous’ day after lunch2 The one of today’s morning (similar in height)3 The massive spikes of afternoon when the news is spread on
the web, facebook and others4 and the even more massive spike of frequentation after a
newsletter was sent.
Learn how your users behave. On news websites, thetypical scheme is : people open their favorite webiste once inthe morning when they arrive to work and once in theafternoon after lunch. Those period are a typicalhigh-frequentation moments.
The green/orange ratio is similar to the previous example,scaling is absorbed by cached hits.
www.opensourceschool.fr – Licence Creative Commons (CC BY-SA 3.0 FR) – 54/63

Principles Monitoring tools Reading graphs Real-life examples
Important news impact on editorial website
Big news on news-site 3/3 : analysis
As in the previous example varnish handled the scaling by cachingmost hits.Reality outcome : this particular website successfully behavedcorrectly
www.opensourceschool.fr – Licence Creative Commons (CC BY-SA 3.0 FR) – 55/63

Principles Monitoring tools Reading graphs Real-life examples
Hardware limit crashes a website
Hardware limit crashes a website
www.opensourceschool.fr – Licence Creative Commons (CC BY-SA 3.0 FR) – 56/63
Principles Monitoring tools Reading graphs Real-life examples
Hardware limit crashes a website
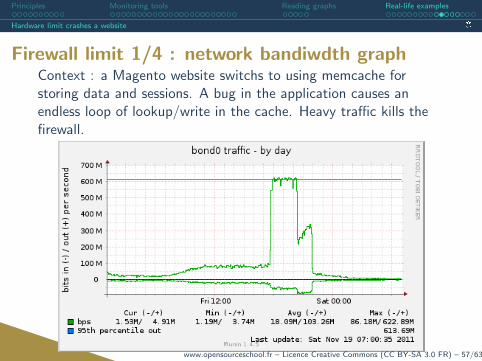
Firewall limit 1/4 : network bandiwdth graphContext : a Magento website switchs to using memcache forstoring data and sessions. A bug in the application causes anendless loop of lookup/write in the cache. Heavy traffic kills thefirewall.
www.opensourceschool.fr – Licence Creative Commons (CC BY-SA 3.0 FR) – 57/63
Principles Monitoring tools Reading graphs Real-life examples
Hardware limit crashes a website
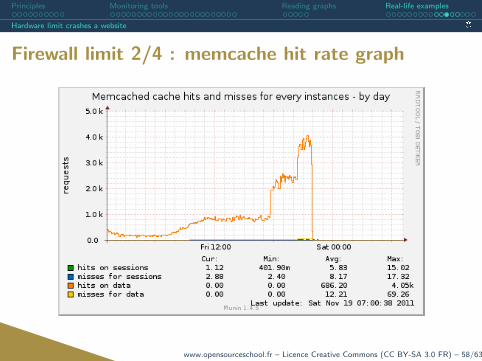
Firewall limit 2/4 : memcache hit rate graph
www.opensourceschool.fr – Licence Creative Commons (CC BY-SA 3.0 FR) – 58/63
Principles Monitoring tools Reading graphs Real-life examples
Hardware limit crashes a website
Firewall limit 3/4 : what to read
1 On the network graph we can see several things
The flat zone indicates the network traffic limit reached by thefirewall (around 600Mb/s)We can see arount 6pm the huge raise in network traffic (3fold) and saturation instantly (caused by the application loop).Around 11pm memcache was desactivated in application’sconfiguration.
2 On the memcache graph, the cache-hit-rate is elevated(around one thousand) whitch is good
Every time a cache is used instead of database or file it’s fasterfor everyone (server performance and client response time)Cache impact was therefore positive but the network limitcripled the architecture and forced a fallback to a slowersolution.
www.opensourceschool.fr – Licence Creative Commons (CC BY-SA 3.0 FR) – 59/63

Principles Monitoring tools Reading graphs Real-life examples
Hardware limit crashes a website
Firewall limit 4/4 : analysis
1 Flat zones in most graph is a synonym for a problemthings are always going up or down.
2 Both graphs above show flat we can see the network problemand the application bug.
3 After firewall crash MySQL servers located in the samesegment as memcache became unreachable, causing thewebsite’s to go dark.
4 Such graphics, used with knowledge of the incident chronologycan help to investigate and understand an incident causepost mortem, but rarely helps to understand real time.
www.opensourceschool.fr – Licence Creative Commons (CC BY-SA 3.0 FR) – 60/63

Principles Monitoring tools Reading graphs Real-life examples
Custom monitoring
Custom monitoring
www.opensourceschool.fr – Licence Creative Commons (CC BY-SA 3.0 FR) – 61/63
Principles Monitoring tools Reading graphs Real-life examples
Custom monitoring
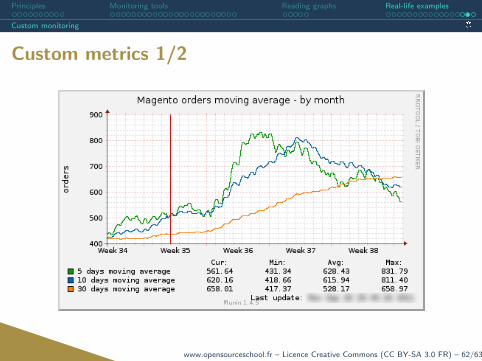
Custom metrics 1/2
www.opensourceschool.fr – Licence Creative Commons (CC BY-SA 3.0 FR) – 62/63
Principles Monitoring tools Reading graphs Real-life examples
Custom monitoring
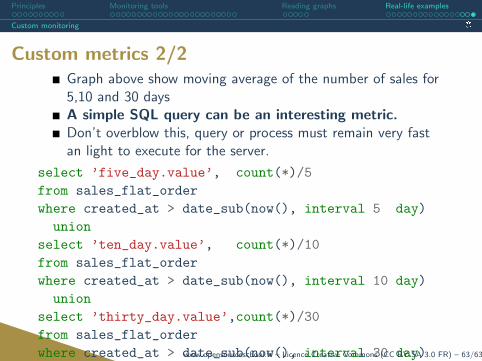
Custom metrics 2/2Graph above show moving average of the number of sales for5,10 and 30 daysA simple SQL query can be an interesting metric.Don’t overblow this, query or process must remain very fastan light to execute for the server.
select ’five_day.value’, count(*)/5
from sales_flat_order
where created_at > date_sub(now(), interval 5 day)
union
select ’ten_day.value’, count(*)/10
from sales_flat_order
where created_at > date_sub(now(), interval 10 day)
union
select ’thirty_day.value’,count(*)/30
from sales_flat_order
where created_at > date_sub(now(), interval 30 day)www.opensourceschool.fr – Licence Creative Commons (CC BY-SA 3.0 FR) – 63/63