monmouth county 1st quarter real estate report
DESCRIPTION
Colleen Tobin's quarterly review of real estate market activity and trends.TRANSCRIPT

M O N M O U T H C O U N T Y
BRIELLE | WALL | SEA GIRT | SPRING LAKE | SPRING LAKE HEIGHTS | AVON-BY-THE-SEA
BELMAR | MANASQUAN
R E A L E S T A T E 2 0 1 4 1ST Q U A R T E R R E P O R T
2013 COMPANY-WIDE TOP PRODUCER
Courtesy of
C O L L E E N T O B I N
SPRING LAKE BRIELLE
WALL SPRING LAKE BRIELLE
WALL BELMAR BRIELLE
Hello Neighbors,
I am pleased to present my analysis of the real estate market for the 1st Quarter of 2014. The
recovery that began last year has continued to take hold during the first three months of
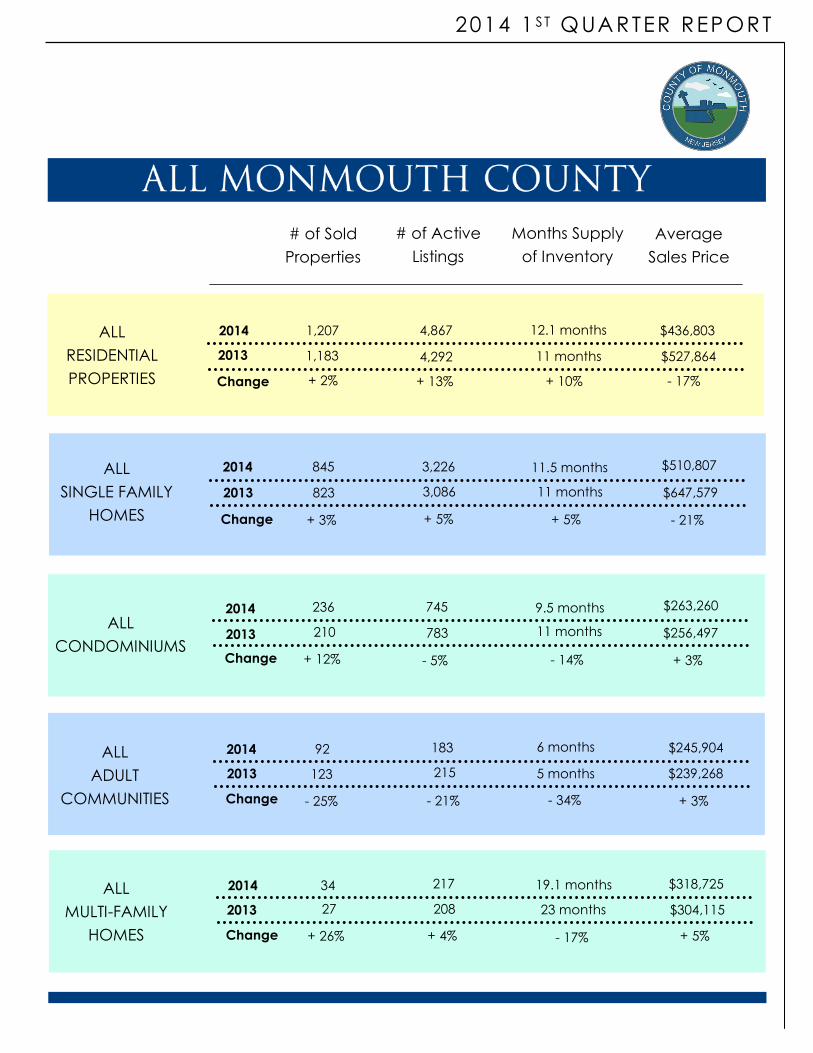
2014. Overall, Monmouth County sales increased slightly but the supply of homes also increased,
leading to more homes on the market now when compared to last year. This may explain the 17%
decline in the average sales price of homes in the county.
Another interesting trend developed in comparing the single-family market with the condominium
and adult community markets. The condominium market experienced a 5% drop in the number of
units for sale, while the supply of single-family homes for sale increased by 10%. Despite the drop in
condominium inventory and increase in the number of sales in both categories, there is still room for
improvement before both single-family and condominium markets fully recover.
There were several positive developments in the real estate market that should be noted.
Adult Communities - The real estate market in adult communities is fully recovered. Inventory
levels are normal and average prices are continuing to increase.
Luxury Market - A recovery in the luxury market is well underway. Sales of properties valued over
$1 million increased by 78% during the first quarter, and the average sales price in this category
was up 9% year-over-year. This is the second year of continuous improvement in the luxury
market.
Wall Township, Belmar & Spring Lake Heights - These three communities posted strong gains in
the number of sales and the increase in average sales prices. Higher than average inventory levels
should continue to drop during the remainder of this year.
Spring Lake & Sea Girt - Sales activity posted strong gains and the average sales price also
increased dramatically in both communities. With inventory levels below normal, it is likely that
the Spring Lake and Sea Girt real estate markets will remain strong throughout 2014.
Homeowners who are thinking about selling should find the upcoming months to be an ideal time to
list and sell their property. Interest rates remain low and buyer demand should remain strong.
Realtor-Associate®
732-213-5166
ALL
RESIDENTIAL
PROPERTIES
2014
2013
Change
1,183
1,207
+ 2% - 17%
4,867
$527,864
12.1 months $436,803
4,292
+ 13% + 10%
11 months
ALL
SINGLE FAMILY
HOMES
2014
2013
Change
823
845
+ 3% - 21%
3,226
$647,579
11.5 months $510,807
3,086
+ 5% + 5%
11 months
ALL
CONDOMINIUMS
2014
2013
Change
210
236
+ 12% + 3%
745
$256,497
9.5 months $263,260
- 5% - 14%
11 months 783
ALL
ADULT
COMMUNITIES
2014
2013
Change
123
92
- 25% + 3%
183
$239,268
6 months $245,904
- 21% - 34%
5 months 215
2014
2013
Change
27
34
+ 26% + 5%
217
$304,115
19.1 months $318,725
+ 4% - 17%
23 months 208
ALL
MULTI-FAMILY
HOMES
Average
Sales Price
Months Supply
of Inventory
# of Active
Listings
# of Sold
Properties
2014 1 ST QUA RTER REPORT

ALL
SINGLE FAMILY
HOMES
2014
2013
Change
33
36
+ 9% + 45%
156
$384,179
13 months $557,533
150
+ 4% - 7%
14 months
Average
Sales Price
Months Supply
of Inventory
# of Active
Listings
# of Sold
Properties
ALL
SINGLE FAMILY
HOMES
2014
2013
Change
5
10
+ 100% + 4%
41
$593,560
12.3 months $616,200
38
+ 8% - 47%
23 months
Average
Sales Price
Months Supply
of Inventory
# of Active
Listings
# of Sold
Properties
ALL
SINGLE FAMILY
HOMES
2014
2013
Change
9
21
+ 133% + 26%
55
$1,749,889
7.9 months $2,209,059
55
0% - 56%
18 months
Average
Sales Price
Months Supply
of Inventory
# of Active
Listings
# of Sold
Properties
ALL
SINGLE FAMILY
HOMES
2014
2013
Change
4
12
+ 200% + 81%
21
$1,099,750
5.3 months $1,991,500
22
- 5% - 69%
17 months
Average
Sales Price
Months Supply
of Inventory
# of Active
Listings
# of Sold
Properties
2014 1 ST QUA RTER REPORT

ALL
SINGLE FAMILY
HOMES
2014
2013
Change
0
2
N/A N/A
19
N/A
28.5 months $861,250
20
- 5% N/A
N/A
Average
Sales Price
Months Supply
of Inventory
# of Active
Listings
# of Sold
Properties
ALL
SINGLE FAMILY
HOMES
2014
2013
Change
13
10
- 23% - 20%
65
$666,835
19.5 months $533,819
64
+ 2% + 30%
15 months
Average
Sales Price
Months Supply
of Inventory
# of Active
Listings
# of Sold
Properties
ALL
SINGLE FAMILY
HOMES
2014
2013
Change
8
11
+ 38% + 84%
51
$363,750
13.9 months $668,330
55
- 7% - 34%
21 months
Average
Sales Price
Months Supply
of Inventory
# of Active
Listings
# of Sold
Properties
ALL
SINGLE FAMILY
HOMES
2014
2013
Change
5
7
+ 40% + 18%
26
$498,200
11.1 months $588,428
22
+ 18% - 15%
13 months
Average
Sales Price
Months Supply
of Inventory
# of Active
Listings
# of Sold
Properties
2014 1 ST QUA RTER REPORT

2 0 1 4
