monolith loop reactors for fischer-tropsch · pdf filechief reviewer prof. dr.-ing. thomas...
TRANSCRIPT

Monolith Loop Reactors forFischer-Tropsch Synthesis
Doctoral Thesis(Dissertation)
to be awarded the degree of
Doctor of Engineering (Dr.-Ing.)
submitted by
Dipl.-Ing. Robert Guttel
from Lobau
approved by the Faculty of
Mathematics/Computer Science and Mechanical Engineering,Clausthal University of Technology.
Date of submissionOctober 21, 2008
Date of oral examinationFebruary 16, 2009
Chairperson of the Board of Examiners
Prof. Dr.-Ing. Hubert Schwarze
Chief Reviewer
Prof. Dr.-Ing. Thomas Turek
Reviewer
Prof. Dr.-Ing. Georg SchaubUniversitat Karlsruhe (TH)
Prof. Dr. Freek KapteijnDelft University of Technology

”Das also war des Pudels Kern!“
J. W. von Goethe, Faust I


Zusammenfassung
Aufgrund steigender Erdolpreise und sinkender Erdolreserven ist die Fischer-Tropsch-Synthese (FTS) weltweit wieder in den Fokus von Forschung und Entwicklung geruckt.Mit diesem Prozess konnen flussige Kohlenwasserstoffe als Treibstoff aus prinzipielljeder Kohlenstoffquelle erzeugt werden. Die wesentlichen Herausforderungen fur dietechnische Umsetzung dieser stark exothermen Reaktion sind in der effizienten War-meabfuhr und der Reduktion der Stoffubergangswiderstande zu sehen. Die bisher tech-nisch eingesetzten Suspensionsblasensaulen- (SBC) und Rohrbundelreaktoren (FBR)mit suspendiertem oder regellos gepacktem Katalysator weisen eine Reihe von Nachtei-len auf. Insbesondere die notwendige Abtrennung des Katalysators von dem Produktin der Suspensionsblasensaule und der hohe Druckverlust und die ineffiziente Warme-abfuhr im Festbettreaktor limitieren die Effizienz des Gesamtverfahrens. Der Einsatzvon neuartigen, strukturierten Katalysatoren, wie monolithischen Wabenkorpern, kanndiese Nachteile eliminieren. Außerdem kann der außere Stofftransport intensiviert wer-den, indem das vorteilhafte Regime der Kolbenstromung in den Minikanalen eingestelltwird.
Gegenstand dieser Arbeit ist der Einsatz von wabenformigen struktuierten Katalysa-toren in einer Schlaufenreaktoranordnung unter Kreislauffuhrung der Flussigkeit fur dieFischer-Tropsch-Synthese. Innerhalb der Kanale soll Kolbenstromung vorliegen, um vondem verbesserten außeren Stofftransport profitieren zu konnen. Zur Einschatzung die-ses neuartigen Konzeptes sollen Vergleichsversuche mit suspendiertem pulverformigenKatalysator in einem Ruhrkesselreaktor durchgefuhrt werden.
Im Vorfeld der Experimente wurden Simulationen durchgefuhrt, welche verschiede-ne Reaktorkonzepte fur die Tieftemperatur-FTS vergleichen. Es wurden die etabliertenSBC und FBR, sowie neuartige Monolithschlaufen- (MLR) und Mikrowandreaktoren(µR) berucksichtigt. Die verschiedenen Reaktoren wurden anhand der Katalysator- undReaktorproduktivitat miteinander verglichen. Außerdem wurde die Reaktorleistung be-wertet und Leistungsverluste durch Warme- und Stofftransportwiderstande quantifi-ziert. Es wurde festgestellt, dass SBC und µR die großte Katalysatorproduktivitat er-reichen. Hinsichtlich der Reaktorproduktivitat nahert sich der MLR jedoch dem Niveaudes SBC an, was in dem hoheren Katalysatorinhalt begrundet ist. Die Produktivitatim MLR kann weiter gesteigert werden durch die Reduktion der Temperaturerhohung.Damit ist der MLR zu dem SBC aus Sicht der Simulationsergebnisse konkurrenzfahig.
Zur Untersuchung von Wabenkorpern in einem Schlaufenreaktor wurde ein geeigne-ter Versuchsaufbau im Labormaßstab realisiert. Die Versuchsanlage besteht aus einemRohrreaktor zum Einsatz von monolithischen Wabenkorpern und einem Ruhrkesselre-
i

Zusammenfassung
aktor zur Untersuchung pulverformiger Katalysatoren. Die Gas- und Flussigphase kannseparat im Kreislauf gefuhrt werden, um verschiedene Stromungsregime in den Kanalendes Wabenkorpers einstellen zu konnen. Weiterhin wurde eine gaschromatographischeAnalytik aufgebaut, welche die Analyse der Gasphase sowie der flussigen Produkte er-moglicht. Damit kann sowohl der CO–Umsatz und die CH4–Selektivitat, als auch dieKettenwachstumswahrscheinlichkeit ermittelt werden.
Außerdem ist eine Methode erarbeitet worden, welche die Herstellung von vergleich-baren waben- und pulverformigen Katalysatoren auf Kobaltbasis ermoglicht. Die wa-benformigen Tragerstrukturen wurden mit einem pulverformigen Katalysatorvorlauferbeschichtet, welcher bereits die Aktivkomponenten Co und Re enthalt. Damit kann einegleichmaßige Verteilung des Aktivmaterials innerhalb der Kanale gewahrleistet werden.Aus dem Uberstand der Beschichtungsprozedur wurde aus dem KatalysatorvorlauferPulverkatalysator hergestellt. Ein Vergleich der waben- und pulverformigen Katalysa-toren zeigt vergleichbare strukturelle Eigenschaften. Jedoch wurden Unterschiede in derVerteilung des aktiven Materials gefunden, welche in weiterfuhrenden Arbeiten redu-ziert werden konnen.
Abschließend wurden Versuche durchgefuhrt, die eine Bewertung der Wabenkatalysa-toren im Schlaufenreaktor gegenuber suspendierten Katalysatoren ermoglichen. Aus denerhaltenen experimentellen Ergebnissen kann geschlussfolgert werden, dass die Raum-Zeit-Ausbeute in der FTS durch den Einsatz von wabenformigen Katalysatoren in ei-ner Schlaufenreaktoranordnung verbessert werden kann. Die wesentliche Ursache furdiese Verbesserung kann in dem intensivierten außeren Stofftransport gesehen werden.Weiterfuhrende Versuche konnen einen entscheidenden Beitrag zur Ubertragung dieserTechnologie in den industriellen Maßstab leisten.
Diese Arbeit stellt einen ersten Beitrag zur Untersuchung von Wabenkorpern in einerSchlaufenreaktoranordnung fur die FTS dar. Es konnte gezeigt werden, dass diese An-ordnung Vorteile gegenuber Suspensionsreaktoren hinsichtlich des außeren Stofftrans-ports aufweist. Allerdings stellt der notwendige Kreislauf der Flussigkeit eine Heraus-forderung fur die technische Umsetzung dar. Weiterfuhrende Untersuchungen konnenzu einer Minimierung des Aufwands fur die Kreislauffuhrung fuhren und gleichzeitig dieStofftransporteigenschaften weiter verbessern.
ii

Summary
Due to increasing oil prices and decreasing oil reserves the worldwide research interestin Fischer-Tropsch synthesis (FTS) increases. This process allows the production ofliquid hydrocarbons for fuel from any carbon source in principle. The essential chal-lenges for the technical realization of this highly exothermic reaction are the need forefficient heat removal and the reduction of mass transfer resistances. Multi tubularfixed-bed reactors (FBRs) and slurry bubble column reactors (SBCs) currently appliedin industrial scale exhibit a number of disadvantages. Especially the need for catalystseparation in the slurry bubble column and the high pressure drop and inefficient heatremoval in the fixed-bed reactor limit the performance of the total process. The ap-plication of novel structured catalysts, such as monolithic honeycombs, could eliminatethese disadvantages. Furthermore, the external mass transfer can be intensified, byoperating in the favorable slug flow regime inside the mini-channels.
The objective of this work is the application of structured honeycomb catalysts forFischer-Tropsch synthesis in a loop-reactor alignment under recirculation of the liquidphase. Within the channels the slug flow regime is established to profit from the in-tensified external mass transfer. For evaluation of this novel reactor concept comparingexperiments were carried out with suspended powder catalyst in a stirred tank reactor.
Prior to experiments a simulation study was carried out to compare various reactorconcepts for low-temperature FTS. The established SBCs and FBRs, as well as the novelmonolith loop reactors (MLRs) and micro reactors (µRs) were considered in this study.The different reactors were compared by catalyst and reactor productivity. Furthermorethe reactor efficiency was evaluated and the efficiency losses due to heat and masstransfer resistances were quantified. It was revealed, that SBC and µR offer the highestcatalyst productivity. However, with respect to the reactor productivity the MLR cancompete with the SBC, due to the relatively high catalyst inventory. The productivityof the MLR can further be improved by reduction of the temperature increase.
Furthermore an adequate experimental setup in laboratory scale was realized, whichallows for investigation of honeycombs in a loop-reactor alignment. The setup consists ofa tubular reactor for investigation of monolithic honeycombs and a stirred tank reactorfor application of powder catalyst. Gas and liquid phase can be recycled separately toadjust different flow regimes inside the honeycomb channels. Moreover, an analyticalsystem was established to analyze the gas phase and the liquid products. This allowsfor determining the CO conversion and CH4 selectivity, as well as the chain growthprobability.
In addition, a method was developed, which allows for preparation of comparable
iii

Summary
cobalt based honeycomb and powder catalysts. The monolithic honeycomb carrierswere coated with a powder catalyst precursor, which already contains the active ma-terial Co and Re. This allows for an even distribution of active material inside thechannels. The final powder catalyst was prepared from the excess of the coating slurry.A comparison between honeycomb and powder catalyst reveals similar structural char-acteristics. However, differences were observed in the distribution of active material,which could be improved in future work.
Finally, experiments were carried out for evaluation of honeycomb catalysts in theloop-reactor against suspended powder catalyst. The experimental results revealed, thatthe space-time-yield for Fischer-Tropsch synthesis could be increased by applying hon-eycomb catalysts in a loop-reactor alignment. The essential reason for this enhancementcould be attributed to the intensified external mass transfer. Additional experimentscould contribute importantly to the scale-up of this technology to industrial scale.
This work represent the first step in the research on MLRs for FTS. It can be shown,that the monolith loop-reactor alignment exhibits advantages compared to reactorswith suspended catalysts with respect to external mass transfer. However, the mainchallenge for technical realization is the required external recycle of the liquid phase.Additional research can minimize the efforts for the liquid recycle and further improvethe mass transfer characteristics.
iv

Acknowledgement
I would like to express my deep gratitude to Prof. Dr.-Ing. Thomas Turek for theopportunity to carry out my doctoral thesis about this very interesting and challengingtopic under his supervision. I am especially grateful for the demanding and constructivescientific discussions as well as his confidence in me and the project, which essentiallycontributed to the successful course of my graduation. In addition, I would like to thankProf. Dr.-Ing. Georg Schaub from Universitat Karlsruhe and Prof. Dr.-Ing. Ulrich Kunzfor their valuable comments and suggestions regarding my work. Moreover, I would liketo thank Prof. Dr.-Ing. Thomas Turek, Prof. Dr.-Ing. Georg Schaub and Prof. Dr. FreekKapteijn for undertaking to be examiners.
I would especially thank my dear colleague and friend Dipl.-Ing. Christian Per-bandt for his personal and scientific support and motivation during our shared time atClausthal University of Technology. I would also like to thank my colleague and friendDipl. Chem. Markus Maly for his scientific support in the first stage of my research.Furthermore, I cordially thank my former diploma students Markus Rose and JensKnochen, who contributed greatly to this thesis. I would like to thank Dipl.-Ing. JensKnochen in particular, for the enormous engagement in performing experiments for mydoctoral theses. Additionally, I would like to express my thanks to the old hands at theinstitute Dipl.-Ing. Christoph Greve and Dr.-Ing. Jan Siebert for their sincere colleague-ship and their help for my first steps at Clausthal University of Technology. Moreover, Iwould like to thank my colleague Dipl.-Ing. Christian Eisenbeis for his personal supportduring my work. I also thank Dipl.-Ing. Stefan Pinnow for his helpful support realizingthis dissertation in LATEX.
Furthermore I would like to thank Roland Schmidt and his colleagues from our work-shop for the competent support in construction of the experimental setup. In addition,I would like to thank Dr. Anton Nagy from Integrated Lab Solutions GmbH for thesupport and kind motivation, which were very helpful in realizing the experimentalsetup. Furthermore, I thank our laboratory technician Hans Langer for his logistictalent. Thanks also go to all the people of our institute who contributed to this work.
I would like to thank my family and my friends, in particular my parents, my sisterand my grandparents for their belief and support throughout my education. I espe-cially thank my father, who shared his experience of his doctoral thesis with me andsubstantially, together with my mother, contributed to my motivation to do a doctorate.Finally, I would like to express my sincere thank to my girlfriend for her support andpatience as well as for her encouragement and motivation during times of a petulantexperimental setup.
v

Contents
Zusammenfassung i
Summary iii
Acknowledgement v
1 Introduction 11.1 General introduction and motivation . . . . . . . . . . . . . . . . . . . . 11.2 Objectives and thesis structure . . . . . . . . . . . . . . . . . . . . . . . 2
2 Background 42.1 Fischer-Tropsch synthesis . . . . . . . . . . . . . . . . . . . . . . . . . . . 4
2.1.1 Overview . . . . . . . . . . . . . . . . . . . . . . . . . . . . . . . 42.1.2 Historical development . . . . . . . . . . . . . . . . . . . . . . . . 52.1.3 Reaction . . . . . . . . . . . . . . . . . . . . . . . . . . . . . . . . 82.1.4 Product distribution . . . . . . . . . . . . . . . . . . . . . . . . . 82.1.5 Reaction kinetics . . . . . . . . . . . . . . . . . . . . . . . . . . . 92.1.6 Catalysts . . . . . . . . . . . . . . . . . . . . . . . . . . . . . . . 10
2.2 Reactors for Fischer-Tropsch synthesis . . . . . . . . . . . . . . . . . . . 112.2.1 Reactors developed in Germany . . . . . . . . . . . . . . . . . . . 112.2.2 State of the art and challenges . . . . . . . . . . . . . . . . . . . . 132.2.3 Possibilities of process intensification . . . . . . . . . . . . . . . . 15
2.3 Reactors with monolithic honeycomb catalysts . . . . . . . . . . . . . . . 182.3.1 Monolith loop reactor . . . . . . . . . . . . . . . . . . . . . . . . 182.3.2 Preparation of monolithic honeycomb catalysts . . . . . . . . . . 212.3.3 Assessment of monolith reactors . . . . . . . . . . . . . . . . . . . 24
3 Modeling and simulation 273.1 Introduction . . . . . . . . . . . . . . . . . . . . . . . . . . . . . . . . . . 273.2 Reactor Models . . . . . . . . . . . . . . . . . . . . . . . . . . . . . . . . 283.3 Simulation Results . . . . . . . . . . . . . . . . . . . . . . . . . . . . . . 343.4 Conclusions . . . . . . . . . . . . . . . . . . . . . . . . . . . . . . . . . . 43
4 Catalyst Preparation 444.1 Catalyst preparation . . . . . . . . . . . . . . . . . . . . . . . . . . . . . 44
vi

4.2 Catalyst characterization . . . . . . . . . . . . . . . . . . . . . . . . . . . 464.3 Results and discussion . . . . . . . . . . . . . . . . . . . . . . . . . . . . 47
4.3.1 Dip-coating . . . . . . . . . . . . . . . . . . . . . . . . . . . . . . 474.3.2 Catalyst composition . . . . . . . . . . . . . . . . . . . . . . . . . 504.3.3 Pore structure and surface areas . . . . . . . . . . . . . . . . . . . 514.3.4 Characteristic diffusion length . . . . . . . . . . . . . . . . . . . . 53
4.4 Conclusions . . . . . . . . . . . . . . . . . . . . . . . . . . . . . . . . . . 55
5 Experimental setup and procedure 575.1 Experimental setup . . . . . . . . . . . . . . . . . . . . . . . . . . . . . . 575.2 Analytical setup and procedure . . . . . . . . . . . . . . . . . . . . . . . 63
5.2.1 Gas phase analysis . . . . . . . . . . . . . . . . . . . . . . . . . . 635.2.2 Wax phase analysis . . . . . . . . . . . . . . . . . . . . . . . . . . 65
5.3 Experimental conditions and procedure . . . . . . . . . . . . . . . . . . . 66
6 Results and Discussion 706.1 Introduction . . . . . . . . . . . . . . . . . . . . . . . . . . . . . . . . . . 706.2 Results and discussion . . . . . . . . . . . . . . . . . . . . . . . . . . . . 70
6.2.1 Product segregation in the sampling system . . . . . . . . . . . . 706.2.2 Evolution of the loop-reactor setup . . . . . . . . . . . . . . . . . 746.2.3 Comparison of catalyst geometries . . . . . . . . . . . . . . . . . 786.2.4 Effect of internal and external mass transfer in STR . . . . . . . . 83
6.3 Conclusions . . . . . . . . . . . . . . . . . . . . . . . . . . . . . . . . . . 87
7 Conclusions and future work 907.1 General conclusions . . . . . . . . . . . . . . . . . . . . . . . . . . . . . . 907.2 Future work . . . . . . . . . . . . . . . . . . . . . . . . . . . . . . . . . . 91
A Appendix 93A.1 Modeling and simulation . . . . . . . . . . . . . . . . . . . . . . . . . . . 93
A.1.1 Physical properties . . . . . . . . . . . . . . . . . . . . . . . . . . 93A.1.2 Correlations for FBR in trickle flow . . . . . . . . . . . . . . . . . 93A.1.3 Correlations for SBC . . . . . . . . . . . . . . . . . . . . . . . . . 94A.1.4 Correlations for MLR . . . . . . . . . . . . . . . . . . . . . . . . . 95A.1.5 Correlations for µR . . . . . . . . . . . . . . . . . . . . . . . . . . 97A.1.6 Simulation results . . . . . . . . . . . . . . . . . . . . . . . . . . . 98
A.2 Experimental . . . . . . . . . . . . . . . . . . . . . . . . . . . . . . . . . 100
Bibliography 103
Nomenclature 114
Abbreviations 118
vii


1 Introduction
1.1 General introduction and motivation
The Fischer-Tropsch synthesis (FTS) is an almost 100 year old process to produce hydro-
carbons for approximately 22 to 25 $ bbl−1 from any carbon source (Dry, 2001). Since
the oil price has risen during the last years from 18.86 $ bbl−1 in 1997 to 69.04 $ bbl−1
in 2007 (BMWi, 2008) and further to more than 100 $ bbl−1 in 20081, the interest in
FTS increased again. The German BMWi (2008) estimates the world oil resources to
≈ 165 000 Mt (≈ 1300 Gbbl, with oil density of 800 kg m−3), which allows sustaining the
current production levels for 42 years. For this reason alternative routes for production
of liquid fuels play an important role. The OPEC estimates that the total oil production
will increase from 10.6 Mt d−1 (83.3 Mbbl d−1) in 2005 to 15 Mt d−1 (117.6 Mbbl d−1) in
2030. The production is partly covered by producing liquid fuels from coal (CTL)
or natural gas (GTL). In 2005 the CTL/GTL capacity was between 6.4 and 19 kt d−1
(50 – 150 kbbl d−1) and will increase to between 64 and 190 kt d−1 (500 – 1500 kbbl d−1)
in 2030 (OPEC, 2007). The lower limit of this value seems not reasonable, since the
available CTL/GTL capacity will already achieve 423 kbbl d−1 by 2010 (Guettel et al.,
2008). With a reasonable CTL/GTL capacity of 1500 kbbl d−1 and an oil price of 100 $
in 2030, the value of the synthetic liquid products will be about 150 M$ d−1 or 54 G$ a−1.
It is obvious, that even small improvements of processes for the production of liquid
fuels have a high effect on process efficiency and financial benefit. Both arguments are
a strong driving force for research in improving FTS.
The challenge of FTS is that the reaction is highly exothermic on the one hand, which
requires a good temperature management in the reactor. On the other hand, mass
transfer resistances between the fluid phases and the solid catalyst, as well as inside the
catalyst play an important role. In industrial application two reactor types are used,
1Brent, September 10, 2008
1

1 Introduction
the slurry bubble column reactor (SBC) and the multi-tubular fixed-bed reactor (FBR)
in trickle-flow operation mode. Both reactors exhibit several disadvantages. The SBC
suffers from the need of separation of the fine powder catalyst from the liquid products,
while the FBR suffers from high pressure drop, low catalyst utilization and challenging
heat removal (Guettel et al., 2008).
The aim of the proposed research is to investigate the possibility of improving the
Fischer-Tropsch (FT) technology significantly by applying an advantageous novel re-
actor system based on structured catalysts. In this thesis the monolithic honeycomb
catalyst was investigated. This structure is characterized by a large number of parallel
channels with a characteristic diameter of about 1 mm. The advantages are the high
geometric surface area, the low pressure drop and the fixed catalyst bed. Under FT con-
ditions gas-liquid two-phase flow will be present inside the channels, which could form
different flow regimes depending on gas and liquid velocity. The slug or Taylor-flow
regime is preferred, as it provides high mass transfer rates and low axial backmixing
(Bauer, 2007). However, the main challenges can be seen in the manufacturing of robust
catalysts with high activity and long life time at acceptable costs on the one hand and
an even distribution of gas and liquid phase over the cross section on the other hand.
First experimental and theoretical investigations revealed, that honeycomb catalysts
are applicable in the FTS and that potential for process intensification exists (Hilmen
et al., 2001, 2005; de Deugd, 2004).
1.2 Objectives and thesis structure
The objective of this work is the benchmark of monolithic honeycomb catalysts for FTS.
Therefore this novel reactor system was compared to the well known slurry stirred tank
reactor (STR) in the same experimental setup. Because the STR is a standard system
in chemical engineering research, the obtained results can be transferred to the SBC.
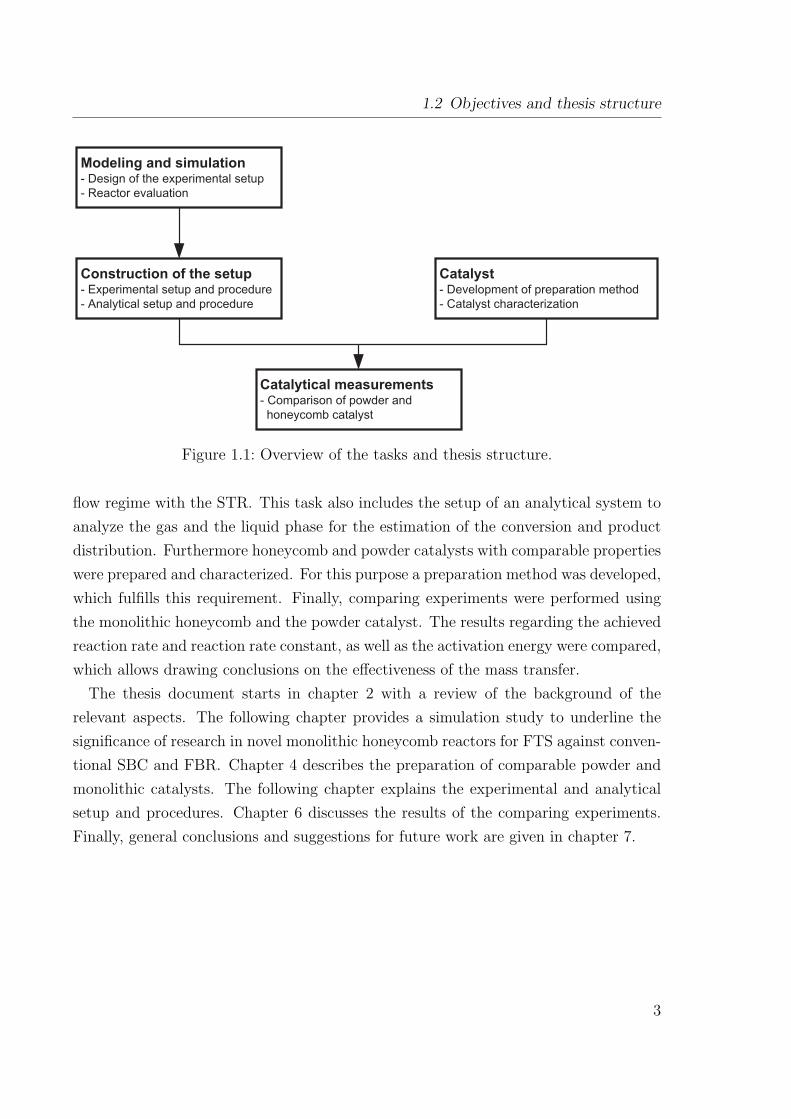
The structure of the thesis is shown in Figure 1.1. The experimental work is sup-
ported by simulation studies, which reveal the significance of the research efforts on
structured monolithic reactors compared to reactors established in industrial practice.
Furthermore, the design of the experimental setup is based on the simulation results.
The experimental work is divided in three basic tasks. Firstly, an experimental setup
was built, which allows the comparison of the monolithic honeycomb catalyst in slug
2
1.2 Objectives and thesis structure
Modeling and simulation- Design of the experimental setup
- Reactor evaluation
Construction of the setup- Experimental setup and procedure
- Analytical setup and procedure
Catalyst- Development of preparation method
- Catalyst characterization
Catalytical measurements- Comparison of powder and
honeycomb catalyst
Figure 1.1: Overview of the tasks and thesis structure.
flow regime with the STR. This task also includes the setup of an analytical system to
analyze the gas and the liquid phase for the estimation of the conversion and product
distribution. Furthermore honeycomb and powder catalysts with comparable properties
were prepared and characterized. For this purpose a preparation method was developed,
which fulfills this requirement. Finally, comparing experiments were performed using
the monolithic honeycomb and the powder catalyst. The results regarding the achieved
reaction rate and reaction rate constant, as well as the activation energy were compared,
which allows drawing conclusions on the effectiveness of the mass transfer.
The thesis document starts in chapter 2 with a review of the background of the
relevant aspects. The following chapter provides a simulation study to underline the
significance of research in novel monolithic honeycomb reactors for FTS against conven-
tional SBC and FBR. Chapter 4 describes the preparation of comparable powder and
monolithic catalysts. The following chapter explains the experimental and analytical
setup and procedures. Chapter 6 discusses the results of the comparing experiments.
Finally, general conclusions and suggestions for future work are given in chapter 7.
3
2 Background
2.1 Fischer-Tropsch synthesis
2.1.1 Overview
The FTS converts synthesis gas to hydrocarbons. Figure 2.1 shows the overall process
for production of synthetic fuels based on FTS. In principle any carbon source can be
used as raw material for synthesis gas production. The broad range of FTS products can
be processed to the desired hydrocarbon fractions. The FT reaction is highly exothermic
and requires the use of heterogeneous catalysts in a temperature range between 200 and
350 ◦C under elevated pressure (Frohning et al., 1992). Since its discovery by Fischer
and Tropsch in the second decade of the 20th century, FTS went through phases of rapid
evolution and stagnation. This development was on the one hand caused by different
economic assessment in times of changing oil prices. On the other hand specific political
conditions in countries like Germany during World War II and South Africa during the
Apartheid played an important role. However, in view of decreasing oil reserves and
rising oil prices it is generally expected that FTS will gain great importance within
the next decades for the production of synthetic fuels and petrochemical base materials
from natural gas, coal, and biomass (Steynberg and Dry, 2004).
In principle different reactor technologies are suitable for performing the highly
exothermic FTS. Several of these concepts have already been proven on laboratory,
pilot plant, and industrial scale (Davis, 2005). One can distinguish between the so-
called high temperature process, where gaseous products are formed in moving bed
reactors and the low temperature process in which liquid products are also present
under reaction conditions. In these more advanced low temperature processes multi-
tubular FBR and SBC are employed industrially (Dry, 2002). However, both reactor
technologies exhibit certain disadvantages. The multitubular FBR suffers from high
pressure drop, low catalyst utilisation and insufficient heat removal, whereas the SBC
4

2.1 Fischer-Tropsch synthesis
Figure 2.1: Overall process for production of liquid fuels by FTS (Guettel et al., 2008).
faces the need for catalyst separation and highly demanding scale-up. These draw-
backs lead to investigations towards improved reactor technologies that might become
industrially applicable in a medium and long term perspective.
For intensification of mass transfer between synthesis gas, liquid products and solid
catalysts alternative catalyst geometries like honeycombs, structured packings and
foams have been developed. An enhancement of mass transfer characteristics while
maintaining isothermal operation can be achieved by using micro reactors (µRs). Fi-
nally, the coupling of FTS reaction with separation of the inhibiting product water
using membrane reactors will be discussed. The present chapter starts with the histor-
ical development of FTS reactor technologies revealing a surprising diversity of applied
reactor types. Based on the state of the art for low temperature FTS, chances and
challenges of emerging reactor technologies will be critically discussed.
2.1.2 Historical development
The FTS has its origin in Germany at the beginning of the 20th century, where ground-
breaking progress for several processes under elevated pressure was made. Haber and
Bosch developed the ammonia synthesis in 1908, Bergius worked on the direct hydro-
genation of coal in 1913, and at the beginning of the second decade, methanol synthesis
was achieved on technical scale by BASF. Based on previous work by BASF (BASF,
1913), Fischer and Tropsch began to develop the synthesis of hydrocarbons from syn-
thesis gas at the Kaiser Wilhelm Institut fur Kohlenforschung in Mulheim (Ruhr),
Germany, in 1920 (Fischer and Tropsch, 1923). This new process was filed as patent in
1925 (Fischer and Tropsch, 1925).
5

2 Background
Table 2.1: Existing plants and plants under construction for FTS (values in kt a−1 cal-culated with assumed average product density of 800 kg m−3) (Guettel et al.(2008), updated).
Company Site Capacity Raw Date of[bpd (kt a−1)] material commissioning
Existing plants
Sasol Sasolburg 2500 (120) Coal 1955Sasol Secunda 85 000 (4000) Coal 1980Sasol Secunda 85 000 (4000) Coal 1982MossGas Mossel Bay 30 000 (1400) Natural gas 1992Shell Bintulu 12 500 (580) Natural gas 1993Sasol/Qatar Petroleum Qatar 34 000 (1600) Natural gas 2006
Under construction
Shell Qatar 140 000 (6500) Coal 2010SasolChevron Escravos 34 000 (1600) Natural gas 2010
As early as 1935, the first commercial plants were installed by Ruhrchemie in Ober-
hausen, Germany. In the 1940s, the total German production capacity of liquid fuels
on FTS basis reached 600 kt a−1 in 9 plants operating with cobalt catalysts (Dry, 1990).
In all cases, the synthesis gas was produced from coal (Steynberg and Dry, 2004). In
addition, nearly 3 Mt a−1 liquid fuels were produced by direct coal liquefaction accord-
ing to the Bergius-Pier process. During World War II, further FTS plants based on
Ruhrchemie licenses were built in Japan.
After World War II, interest in further development of FTS remained strong. Ruhrchemie
and Lurgi developed a fixed bed process based on iron catalysts. These so-called ARGE
reactors were installed for the first time in Sasolburg, South Africa, in 1955. In the USA,
remarkable effort for the development of commercial FTS processes was also undertaken.
Between 1951 and 1957, a FTS pilot plant was operated in Brownsville, Texas (Davis,
2005). The development in the USA was focussed on fluidized bed reactors for high
temperature FTS, as it was subsequently applied in the South African industry.
In the mid-1950s, it became evident that FTS was uneconomical at the extremely
low oil prices of that time. The “oil era” began and except in South Africa, all other
developments in FTS were stopped. Until the first oil crisis in the 1970s, FTS was
almost exclusively developed further in South Africa. The current production capacity
in South Africa amounts to approx. 9 Mt a−1 (200 000 bpd barrel per day). As raw
6

2.1 Fischer-Tropsch synthesis
material for synthesis gas production, coal (Sasol), and to an increasing extent, natural
gas (PetroSA) are used. Different processes and reactor technologies have been used
in South Africa. Stationary and circulating fluidized bed reactors are used for the
high-temperature process to produce more olefinic products with short chain lengths.
The modern low-temperature process for the manufacture of waxy products has been
performed in SBC since the 1990s.
In 1973, Shell began the development of the ShellMiddle Destillate Synthesis (SMDS).
This process is based on the FBR technology and employs cobalt catalysts. In 1993, a
FTS plant based on natural gas with a capacity of 12 500 bpd was placed into operation
in Bintulu, Malaysia (Sie, 1998). The current, most economic way to produce synthesis
gas is the direct usage of natural gas that is obtained as by-product from oil production
and whose transportation would be too expensive. This production of liquid products
from natural gas (Gas To Liquid, GTL) is currently being realized on industrial scale at
several sites. Commissioning of a plant with a capacity of 70 000 bpd built by Sasol and
Qatar Petroleum occurred in June 2006 in Qatar (Fleisch, 2006). Further large-scale in-
dustrial plants in Escravos, Nigeria (SasolChevron), and Qatar (Shell, Qatar Petroleum)
are under construction. After finishing these projects, the worldwide capacity for FTS
fuels will increase to almost 30 Mt a−1 in 2010 (Schaub et al., 2006) (Table 2.1).
Besides natural gas, the usage of coal for synthesis gas production has intensively
been discussed. Particularly coal-rich countries like the USA and China intend to
apply indirect coal liquefaction (Coal To Liquid, CTL) by conversion of synthesis gas
using FTS (Hao et al., 2007). These economically understandable developments may
be discussed critically in view of the possible consequences for anthropogenic climate
change. Because of its insufficient hydrogen content, especially the use of coal gives
rise to additional CO2 emissions during the production of liquid hydrocarbons (Schaub,
2006). In the long term, a CO2 neutral way could be the production of synthesis gas
from biomass and its subsequent liquefaction by FTS (Biomass To Liquid, BTL).
7

2 Background
2.1.3 Reaction
The basic FT reaction can be described as formation of paraffinic or olefinic chains
(Equations 2.1 and 2.2):
nCO + (2 n + 1 ) H2 −→ CnH2n+2 + nH2O (2.1)
nCO + 2 nH2 −→ CnH2n + nH2O (2.2)
The main reaction (Equation 2.1) is highly exothermic with a reaction enthalpy of
≈ −150 kJ mol−1 converted CO. The co-product, H2O, can be converted with CO to
carbon dioxide and hydrogen in the water/gas shift reaction; see Equation 2.3:
CO + H2O −−⇀↽−− CO2 + H2 (2.3)
Undesirable side reactions are the formation of methane (Equation 2.4) and the Boudouard
reaction (Equation 2.5). In addition, alcohols can be formed in small amounts (Equa-
tion 2.6).
CO + 3 H2−−⇀↽−− CH4 + H2O (2.4)
2 CO −−⇀↽−− C + CO2 (2.5)
nCO + 2 nH2 −→ CnH2n+2O + (n−1 ) H2O (2.6)
2.1.4 Product distribution
Anderson (1956) considered the FTS as an ideal polymerization reaction with the
monomer –CH2–. Following this approach, the distribution of mole fractions xn and
mass fractions xm of products can be described as a function of the number of carbon
atoms nc in the chain and the chain growth probability α using the Anderson-Schulz-
Flory distribution (Equations 2.7 and 2.8) (Unruh, 2006). The dependency of the
logarithmic molar fraction of one component on the chain length of this component
can be displayed in the ASF plot (Figure 2.2). In the ideal case the ASF plot shows a
straight line with the slope α. The mass and mole specific product composition with
increasing chain growth probability is shown in (Figure 2.3). The production of long
8

2.1 Fischer-Tropsch synthesis
0 5 1 0 1 5 2 0- 3
- 2
- 1
0
logari
thmic
molar
fracti
on [-]
c h a i n l e n g t h [ - ]
� = 0.65 � = 0.75 � = 0.85 � = 0.95
Figure 2.2: ASF plot for different chain growth probabilities (Unruh (2006), redrawn).
hydrocarbon chains (α > 0.9) is favored, which can be cracked and isomerized to the
desired product.
xn = (1− α)αnc−1 (2.7)
xm = nc (1− α)2 αnc−1 (2.8)
In reality, significant deviations from the ideal polymerization behavior are observed.
Usually the methane mole fraction is higher, while the ethene/ethane mole fractions
are lower than calculated. Furthermore, the real product distribution is characterized
by an increase in the chain growth probability in the range of C8 to C12 (Riedel, 2002).
2.1.5 Reaction kinetics
Because of the complex reaction mechanism, the wide range of involved components
and the diversity of catalyst compositions several kinetic reaction rate expressions
can be found in the literature (van der Laan and Beenackers, 1999). The kinetic ap-
proaches range from simple power law expressions (Post et al., 1989), over Langmuir-
Hinshelwood-Hougen-Watson approaches (Yates and Satterfield, 1991; Riedel and Schaub,
2003) to complex micro kinetics of the elementary steps (Storsæter et al., 2006; Visconti
et al., 2007).
9

2 Background
0 . 0 0 . 2 0 . 4 0 . 6 0 . 8 1 . 00 . 0
0 . 2
0 . 4
0 . 6
0 . 8
1 . 0mo
lar fra
ction [
-]
c h a i n g r o w t h p r o b a b i l i t y [ - ]
s p e c i e s C H 4 C 2 - C 4 C 5 - C 1 1 C 1 2 - C 2 0 C 2 0 +
(a) molar fraction
0 . 0 0 . 2 0 . 4 0 . 6 0 . 8 1 . 00 . 0
0 . 2
0 . 4
0 . 6
0 . 8
1 . 0
mass
fractio
n [-]
c h a i n g r o w t h p r o b a b i l i t y [ - ]
s p e c i e s C 1 C 2 - C 4 C 5 - C 1 1 C 1 2 - C 1 9 C 2 0 +
(b) mass fraction
Figure 2.3: Product distribution in FTS as a function of chain growth probability (Guet-tel et al., 2008).
The reaction rate of FTS is often influenced by pore diffusion processes because the
pores are generally assumed to be filled with liquid products. Post et al. (1989) showed
that the catalyst efficiency is significantly reduced at characteristic catalyst dimensions
of more than 100 µm. However, since the activity of modern and future catalysts is
higher than of the catalysts used by Post et al., internal mass transfer limitations can
occure at significantly smaller characteristic dimensions. Furthermore, the selectivity
can be negatively influenced by pore diffusion effects. Caused by the higher diffusion
coefficient of hydrogen compared to carbon monoxide, the H2/CO ratio inside the porous
catalyst will increase. This leads to an increase of the chain termination probability
and thus to a decrease in chain length of the products (Wang et al., 2001).
2.1.6 Catalysts
As FTS catalysts, metals from the VIII B group of the periodic table like iron, cobalt,
and ruthenium can be used (van der Laan and Beenackers, 1999). Due to the high cost
of ruthenium, solely iron and cobalt have industrial relevance. A disadvantage of iron
catalysts is the kinetic inhibition by the co-product water, whereas an advantage is the
activity for water/gas shift reaction that allows the use of carbon dioxide containing or
10

2.2 Reactors for Fischer-Tropsch synthesis
hydrogen depleted synthesis gas mixtures (Riedel, 2002). However, the water/gas shift
reaction could also lead to a loss of carbon monoxide by formation of carbon dioxide.
Compared to iron, cobalt catalysts are already active at lower reaction temperatures
and have a durability of up to 5 years on stream compared to about 6 months in the
case of iron (Davis, 2005). On the other hand, cobalt is more expensive than iron (van
Steen and Claeys, 2008). In addition to the active component, different promoters (Pt,
Pd, Ru, Re, K) can be employed (Oukaci et al., 1999). As carrier materials, alumina,
silica, and titania – in earlier catalysts also ZnO – can be utilized (Fischer and Tropsch,
1923; Storsæter et al., 2005b). Typical chain growth probabilities are 0.5 – 0.7 for iron
and 0.7 – 0.8 for cobalt (Dry, 1982). Currently, the development of cobalt catalysts is
aimed at maximizing the chain growth probability to values of up to 0.95 (Sie, 1998).
2.2 Reactors for Fischer-Tropsch synthesis
Modern FT processes for the production of liquid fuels are low-temperature processes,
where synthesis gas, liquid products, and solid catalysts are present. Reactors for
high-temperature processes are not discussed in this chapter. Details concerning these
reactors can be found in Steynberg and Dry (2004) and Davis (2005).
2.2.1 Reactors developed in Germany
The first industrial FT process was developed by Ruhrchemie in the third decade of
the 20th century. In this process, a FBR under atmospheric pressure was used which
was cooled by evaporating water. In this “Normaldruck-Synthese”, the catalyst was
located between parallel plates, while the cooling water was transported in tubes. An
enhancement was a process at medium pressure (“Mitteldruck-Synthese”) developed by
Fischer and Pichler, where multitubular reactors with the catalyst located in the gap
of concentric tubes were used. A flow of cooling water inside the inner tubes as well as
outside the outer tubes was used to remove the heat of reaction (Sie, 1998).
Another possibility for heat removal in FBRs is the application of sufficiently large
gas recycles with external heat removal under adiabatic reactor operation. This mode
of cooling was used in the“Michael”process by IG Farben. A hybrid between direct and
indirect cooling of a FBR was used in the commercialized ARGE process after World
War II. In this process, the water cooling system, known from atmospheric and medium
11

2 Background
Table 2.2: Reactor technologies for low-temperature FTS investigated between 1935 and1955 (Guettel et al., 2008).
Process Reactor type Cooling system
Ruhrchemie “Normal-druckverfahren”
FBR with catalyst between parallelplates
Water internal
Ruhrchemie “Mittel-druckverfahren”
FBR with catalyst in gap betweenconcentric tubes
Water internal
IG Farben “Michael-Verfahren”
FBR External gas recycle
ARGE “Hochlast-Synthese”
Multitubular FBR Water internal + exter-nal gas recycle
Lurgi “Stufenofen” Segmented FBR Distributed feed offresh gas + externalgas recycle
BASF “Duftschmidt-Verfahren”
FBR External liquid recycle
BASF “Schaumver-fahren”
Suspension reactor with powder cat-alyst
External liquid recycle
“Rheinpreussen-Koppers-Synthese”
Suspension reactor with powder cat-alyst
Water internal + exter-nal liquid recycle
pressure processes, was combined with a recycle of gas at incomplete conversion (Sie,
1998; Davis, 2005). Besides the gas phase, also the liquid phase can be recycled for
external heat removal which was investigated in the “Duftschmidt” process by BASF.
Finally, the possibility of cooling by distributed feed of fresh synthesis gas to a segmented
fixed bed was achieved by Lurgi in a multiple bed technology (“Lurgi-Stufenofen”).
In addition to FBRs, also reactors with suspended catalysts are a viable option for gas-
liquid reactions. BASF investigated the suitability of these reactors in the “Schaumver-
fahren” with iron catalysts at temperatures of about 250 ◦C. The reaction heat was
removed externally by recycling of liquid. Early investigations by Fischer regarding
the feasibility of suspended catalyst reactors were continued by Kolbel and cowork-
ers during and after World War II (Schulz, 1999). After World War II, a first pilot
plant was operated using an iron catalyst. Unlike the BASF “Schaumverfahren”, this
“Rheinpreußen-Koppers” synthesis was characterized by internal cooling with water.
The different reactor types for low-temperature FTS investigated in Germany between
1935 and 1955 are summarized in Table 2.2. The various possibilities can be grouped
as follows:
12

2.2 Reactors for Fischer-Tropsch synthesis
• internal cooling in suspended reactors or FBRs
• external cooling by gas or liquid recycle in suspended reactors or FBRs
• direct cooling by distributed feed of fresh synthesis gas in staged FBRs
It is impressive to see how within a relatively short span and under difficult conditions,
all reactor types were investigated, that are principally feasible for performing highly
exothermic heterogeneously catalyzed gas-liquid reactions, although the fundamentals
of heterogeneous catalysis and reaction engineering were not yet completely developed
at that time.
2.2.2 State of the art and challenges
The medium pressure process (“Mitteldruck-Synthese”) developed by Fischer and Pich-
ler was commercialized by Ruhrchemie and Lurgi after World War II. In 1955, Sasol
used this technology to build the first plants in Sasolburg, South Africa. These still used
ARGE reactors are operated at 25 bar and at a temperature of 200 – 300 ◦C (Steyn-
berg and Dry, 2004; Davis, 2005). They consist of 2052 parallel tubes with diameters
of 4 cm (Figure 2.4a) (Davis, 2005; Schulz, 1999). The entire reactor is 12.8 m long,
has a diameter of 2.95 m and a catalyst inventory of 40 m3. Compared to the early
German multitubular reactor technology, the ARGE reactors were operated with a re-
cycle of unconverted synthesis gas to support the internal heat removal. In combination
with higher reaction temperatures and pressures, this led to an increase of production
capacity by a factor of 25 (Krishna and Sie, 2000).
In 1973, Shell began to develop the Shell Middle Distillate Synthesis (SMDS), which
was also based on the FBR technology using cobalt catalysts. This technology was
partly based on work by Gulf, who had successfully operated tubular reactors with a
diameter of 2.54 cm and a length of 12.2 m over several months (Davis, 2005). Shell
began building a plant with a capacity of 12 500 bpd in Bintulu, Malaysia, which was
commissioned in 1993 (Davis, 2005; Sie, 1998).
Multitubular FBRs are widely applied to carry out exothermic reactions. They are
easy to handle and to design because the parallel tubes behave very similarly. How-
ever, multitubular reactors exhibit disadvantages. To minimize the pressure drop, the
catalyst dimension should be chosen between 1 and 3 mm (Sie, 1998). This leads to a
13

2 Background
(a) multitubular fixed-bed reactor (b) slurry bubble column reactor
Figure 2.4: Technically established reactors for FTS (Guettel et al., 2008).
decrease of catalyst utilization and to undesirable effects on product selectivity. Fur-
thermore, in tubes with diameters of several centimetres, as used in the industry, hot
spot formation will occur. To prevent damage of the catalyst, the temperatures of both
feed and cooling medium have to be chosen significantly lower than the maximal pos-
sible temperature. This gives rise to a decrease in reactor productivity. Moreover, the
capital costs of multitubular reactors are relatively high.
The second reactor type which is industrially used for FTS is the SBC with suspended
catalyst (Figure 4.6b). Sasol began the development of iron-based SBC in the eighth
decade of the 20th century (Steynberg and Dry, 2004). Since the early nineties, a
commercial plant based on the cobalt catalyst with a capacity of 2500 bpd has been
operated in South Africa. Sasol and Qatar Petroleum recently commissioned a reactor
in Qatar with a capacity of 11 000 bpd, a diameter of 11 m and a height of 60 m.
In SBC, fine catalyst powders with dimensions of 10 to 200 µm are used (Steynberg
and Dry, 2004). Thus, the influence of internal mass transfer resistances are negligible
and optimal activity and selectivity can be achieved. Internals assure efficient heat
removal from the reactor that allows for a nearly isothermal operation. Due to the
higher achievable catalyst fraction of up to 20 vol% (15 vol% in the FBR), the enhanced
catalyst utilization and the higher average reactor temperature, the reactor productivity
of a SBC should be higher than of a FBR. The possible influence of axial dispersion
14

2.2 Reactors for Fischer-Tropsch synthesis
in FTS bubble columns on productivity has been discussed controversially. While Fox
(Fox, 1990) postulated a strong negative effect on the space-time-yield, Steynberg and
Dry (Steynberg and Dry, 2004) saw no reason for such an assumption. The latter
assessment appears to be more plausible because the backmixing of the inert liquid
products should have no influence, while the residence time distribution of synthesis
gas in a reactor with a sufficiently high length-to-diameter ratio should not significantly
differ from ideal plug-flow behavior.
Nevertheless, two aspects decelerated the commercialization of SBC for FTS. Both
separation of the solid catalyst from the liquid products and the scale-up of these
reactors are major challenges for industrial use of SBC. For example the operation
rate of the Oryx-GTL plant in Qatar, operated by Sasol and Qatar Petroleum, was
constrained by the filtration of fine material1. Generally, time and cost intensive pilot-
plant studies with reactors of different diameters have to be conducted for a successful
scale-up. Only recently, adequate models for FTS in SBC have been developed that may
facilitate scale-up in the future (van der Laan, 1999; Krishna and Sie, 2000; Krishna,
2000; Krishna and van Baten, 2003).
Advantages and disadvantages of both established reactor technologies are summa-
rized in Table 2.3. It can be concluded that until now, no reactor concept is available
that combines optimal features in all relevant aspects. An ideal reactor would have the
following characteristics:
• fixed bed catalyst
• high catalyst efficiency due to short diffusion lengths
• highly efficient gas-liquid mass transfer
• isothermal operation at highest possible temperatures
The following chapter deals with strategies to achieve these aims and with other alter-
natives for process intensification in FTS currently under investigation.
2.2.3 Possibilities of process intensification
The specific drawbacks of the commercially established FBR and SBC reactors lead
to investigations of improved reactor technologies that might become applicable in a
1Investor Insight, July 2007, Sasol.
15

2 Background
Table 2.3: Advantages (+) and disadvantages (–) of established reactors for FTS (partlyfrom Sie (1998)).
FBR SBC
Pore diffusion – +Catalyst inventory in reactor + –Gas-liquid mass transfer + –Isothermal behavior – +Catalyst exchange – +Catalyst attrition + –Need for liquid-solid separation + –Scale-up + –Reactor costs – +
medium and long term perspective. In this context this chapter deals with novel struc-
tured catalysts and reactors and membrane reactors.
Structured catalyst geometries are characterized by a non-randomly ordered fixed bed
of catalysts. Important examples are catalytic packings, honeycomb or foam shaped
catalysts, which are reviewed extensively by Pangarkar et al. (2008) with respect to
hydrodynamic and heat and mass transfer characteristics. The main conclusion in this
review is, that strucutred packings will overcome the disadvantages of lower catalyst
inventories and higher costs over randomely packed beds in the near future. This work
is focussed on honeycomb shaped structured catalysts applied in the so called monolith
loop reactor (MLR), which will be discussed in detail later.
Metal-based structures for FTS were investigated by Meshcheryakov et al. (Meshch-
eryakov et al., 1999a,b). The monolithic carrier made of stainless steel was coated with
catalyst. This catalytic packing was operated as gas lift reactor by feeding synthesis gas
to the bottom. The liquid phase was circulating inside the reactor which was caused
by vertical density differences.
Also possible, but not yet demonstrated, is the application of foams for FTS. Solid
foams were originally developed as filters for molten metals. They are increasingly more
often used as catalyst carrier materials in chemical engineering (Twigg and Richardson,
2002; Reitzmann et al., 2006). Foams are characterized by an open structure consisting
of interconnected bridges and void spaces. Advantages are good axial and radial heat
and mass transfer combined with a low pressure drop.
16
2.2 Reactors for Fischer-Tropsch synthesis
Another approach for process intensification during FTS is the use of µRs. As in hon-
eycombs, the parallelization of a large number of small channels gives rise to good mass
transfer characteristics. Furthermore, heat transfer is intensified to an extent, where
isothermal operation even for highly exothermic reactions becomes possible (Klemm
et al., 2003). µRs are especially suitable for modern highly active catalysts, which are
under development for future FT processes.
Only a few results on the use of µRs for FTS have been reported until now. Scientific
and patent literature concentrates on catalyst development (Wang et al., 2003a; Schanke
et al., 1996; Wang et al., 2002; Guillou et al., 2007) and the benefits of the enhanced
heat and mass transfer characteristics (Wang et al., 2005). The application of this
new technology for the production of liquid fuels appears to be especially promising for
decentralized and mobile applications. However, it has also been proposed for large-
scale plants with capacities up to 50 000 bpd. It has been claimed that capital cost
can be reduced significantly using µRs at high conversions and low methane selectivity
(Jarosch et al., 2005).
A recent development concerns the use of membrane reactors in FTS. These reactors
may also have potential in small or medium plants for future off-shore or BTL appli-
cations. Four concepts to use membrane reactors in FTS have been proposed in the
literature (Rohde et al., 2005a):
• distributed feed of reactants
• in situ removal of water
• forced-through membrane contactor
• zeolite encapsulated catalysts
The distributed feed of reactants through a membrane allows for better temperature
control. Furthermore, the methane selectivity can be influenced, because it depends on
the H2/CO-ratio. Thus, a distribution of H2 in a stream of CO can lead to an increase
in the yield of heavy products (Rohde et al., 2005a).
The group of Schaub from the University of Karlsruhe in Germany investigated in
situ water removal with membranes. Water produced during FTS may negatively in-
fluence the reaction by reoxidation of catalysts, increasing water/gas shift activity and
decreasing partial pressures of the educts. The in situ removal of water requires highly
17

2 Background
selective membranes for effective removal of water without loss of educts (Rohde et al.,
2005a,b; Unruh, 2006).
In the literature, two approaches for application of forced-through membrane con-
tactors were described. Khassin et al. (Khassin et al., 2003, 2005a,b) use thermally
conductive contactor modules (plug-through contactor membrane, PCM). Synthesis gas
enters the inner void space and flows through the membrane with a thickness of 2.5 mm.
To enhance the thermal conductivity, metallic copper was added during the membrane
production. Thus, high space-time-yields at flat temperature profiles can be achieved.
Bradford et al. (Bradford et al., 2005) coated a monolithic membrane module with a
catalyst layer. The synthesis gas was fed from shell side to the alumina carrier material
and forced through the membrane to the catalyst. The membrane was impermeable for
the produced hydrocarbons, which can be withdrawn from the tube side.
He et al. presented another membrane application for FTS using encapsulated cat-
alysts. This concept is based on a combination of a FT catalyst and an acidic zeolite.
Educts are diffusing through the zeolitic membrane to the catalyst where the reaction
takes place. The products also have to pass the zeolite where hydrocracking and iso-
merization occurs. This leads to a sharper chain length distribution in the product (He
et al., 2005).
In the field of membrane reactors for FTS, further research activities are expected.
This effort will be focused on the development of new membrane materials and reactor
configurations (Rohde et al., 2005a).
2.3 Reactors with monolithic honeycomb catalysts
Roy et al. (2004) and Cybulski and Moulijn (2006) reviewed the state of knowledge
about monolithic honeycomb catalysts, covering the catalyst preparation, multiphase
flow in the structures, reactor modeling and application in gas and gas-liquid processes.
This chapter summarizes the relevant aspects of monolithic honeycomb catalysts.
2.3.1 Monolith loop reactor
Monolithic honeycomb catalysts, which have been used in exhaust gas cleaning for many
years, consist of a large number of identical, parallel channels with a cell density of 25 up
to 1200 cpsi (channels per square inch). Regarding its characteristic dimension of about
18
2.3 Reactors with monolithic honeycomb catalysts
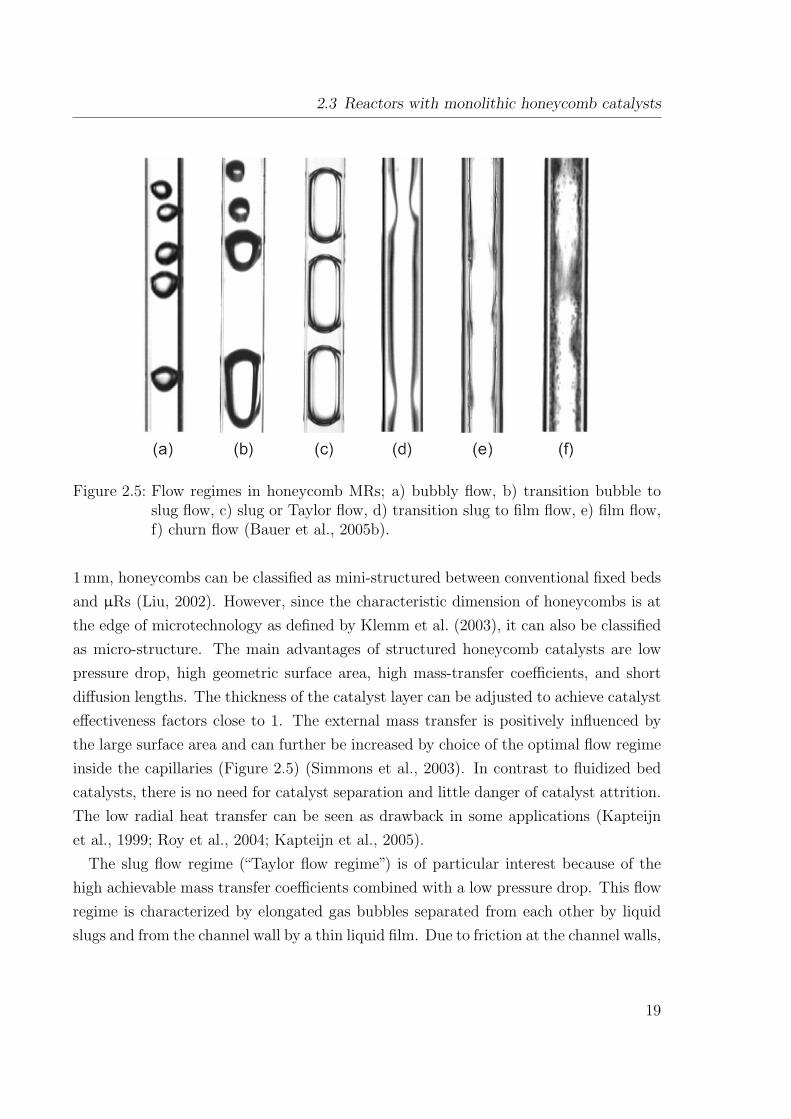
Figure 2.5: Flow regimes in honeycomb MRs; a) bubbly flow, b) transition bubble toslug flow, c) slug or Taylor flow, d) transition slug to film flow, e) film flow,f) churn flow (Bauer et al., 2005b).
1 mm, honeycombs can be classified as mini-structured between conventional fixed beds
and µRs (Liu, 2002). However, since the characteristic dimension of honeycombs is at
the edge of microtechnology as defined by Klemm et al. (2003), it can also be classified
as micro-structure. The main advantages of structured honeycomb catalysts are low
pressure drop, high geometric surface area, high mass-transfer coefficients, and short
diffusion lengths. The thickness of the catalyst layer can be adjusted to achieve catalyst
effectiveness factors close to 1. The external mass transfer is positively influenced by
the large surface area and can further be increased by choice of the optimal flow regime
inside the capillaries (Figure 2.5) (Simmons et al., 2003). In contrast to fluidized bed
catalysts, there is no need for catalyst separation and little danger of catalyst attrition.
The low radial heat transfer can be seen as drawback in some applications (Kapteijn
et al., 1999; Roy et al., 2004; Kapteijn et al., 2005).
The slug flow regime (“Taylor flow regime”) is of particular interest because of the
high achievable mass transfer coefficients combined with a low pressure drop. This flow
regime is characterized by elongated gas bubbles separated from each other by liquid
slugs and from the channel wall by a thin liquid film. Due to friction at the channel walls,
19

2 Background
monolith
gas/liquid
separator
heat exchanger
pump
compressor
product
liquid feed
gas feed liquid
distributor
Figure 2.6: Loop reactor concept (redrawn from Heiszwolf et al. (2001b)).
circulation within the liquid slugs occurs that enhances the gas-liquid mass transfer.
The back mixing along the channel length is diminished by the presence of gas bubbles,
which segregates the liquid phase in isolated liquid slugs (Kreutzer, 2003). Depending
on the physical properties of the gas and liquid phase slug flow occurs up to a gas and
liquid superficial velocity of 1 m s−1 for the nitrogen/water-system and 0.1 m s−1 for the
nitrogen/squalane-system at 20 bar and 20 ◦C (Bauer, 2007).
Due to the poor radial heat conductivity of honeycombs, these reactors have to be
operated adiabatically. For this reason, Moulijn and coworkers from the TU Delft in
The Netherlands suggested to limit the adiabatic temperature rise by recycling of liquid
product, while the reaction heat will be removed in the external recycle (Heiszwolf et al.,
2001a; de Deugd et al., 2003b) (Figure 2.6). The MLR consists of a tubular reactor for
the monolithic catalyst, a gas-liquid separator, a pump and a heat exchanger. The MR
is operated in gas-liquid two phase flow. Gas and liquid will be separated in the gas-
liquid separator. Subsequently, the liquid will be recycled by the pump and the reaction
heat will be removed by the heat exchanger in the liquid recycle. Because of the low
pressure drop in the MR, the liquid can be recirculated at high flow rates. The gas
phase can also be recycled. One advantage of the MLR arise from the separated heat
20

2.3 Reactors with monolithic honeycomb catalysts
and mass transfer section. This allows to scale heat and mass transfer separately, which
is an additional degree of freedom in design compared to conventional fixed-bed and
fluidized-bed reactors. Further advantages are, that (I) catalyst and product remain
separated, (II) no attrition of the catalyst occurs, (III) high gas to liquid mass transfer
could be achieved in the slug flow regime and (IV) simple reactor construction as well
as (V) energy-effcient operation (Heiszwolf et al., 2001b,a).
The application of catalytically active honeycombs for FTS was first investigated by
the Holmen group from the Norwegian University of Science and Technology (NTNU),
Trondheim (Hilmen et al., 2001). Continuative, de Deugd investigated ceramic honey-
combs with a cobalt catalyst in the gas phase (de Deugd et al., 2003c; de Deugd, 2004;
Kapteijn et al., 2005). For the first time, Holmen et al. (Hilmen et al., 2005) carried
out experiments with recirculation of liquid to achieve a better temperature control and
to prevent reactor runaway. In the cobalt-based honeycomb catalyst employed, a two-
phase flow in the film regime was obtained by recirculation of the liquid. However, the
suggested concept with liquid recycle to achieve slug flow in the honeycomb channels
has not yet been investigated in these laboratories.
2.3.2 Preparation of monolithic honeycomb catalysts
The monolithic honeycomb structure can be prepared from ceramic, metal or plastics
(Heck et al., 2001). According to Avila et al. (2005) one can distinguish between two
different types of ceramic monoliths, (I) low surface area monoliths and (II) high surface
area monoliths, whose preparation paths are illustrated in Figure 2.7.
Low surface area monoliths are typically extruded from ceramic materials like cordierite
(2 MgO · 2 Al2O3 · 5 SiO2) which are coated by a catalyst layer (“washcoat”). The cata-
lyst layer consists of a porous material such as alumina, titania, silica or carbon which
is impregnated with the active phase. The high surface area monoliths are directly
extruded from porous material which provides a high internal surface area. This ap-
proach allows to achieve higher catalyst loadings in the reactor. Honeycombs can be
produced in various geometries, both for small- and large-scale applications (Kapteijn
et al., 2001). This work is focussed on the preparation method for low surface area
ceramic monoliths.
The preparation of monolithic catalysts, which was reviewed by Nijhuis et al. (2001a),
is divided in three preparation steps, (I) the extrusion of the monolithic structure, (II)
21

2 Background
Figure 2.7: Preparation of ceramic monolithic catalysts (Avila et al., 2005).
the incorporation of the porous support and (III) the incorporation of the active phase.
The extrusion of the structure will not be discussed here, as it can be obtained ready-
made from producers.
The most common method to increase the internal surface area of low surface area
monolithic carriers is the “washcoating” by a slurry of porous particles. The advantages
of this technique are the small diffusion lengths, the possibility of direct coating of ready-
made catalysts and the high catalyst loading. The washcoat quality depends on the
solid and liquid properties, the mass fraction of solid in the suspension, the suspension
viscosity and the calcination temperature (Nijhuis et al., 2001a; Avila et al., 2005). The
slurry for coating consists of a powder with a mean particle diameter of a few micro
meters suspended in water. Optionally, binder for increasing the coating strength and
acid for changing the pH of the suspension can be added. The monolith carrier is dipped
in a slurry of the porous particles for about 1 min. In this time the porous monolithic
carrier absorbs water from the suspension and a cake of porous particles develops on the
walls. The excess of the slurry is removed gently by pressurized air. Finally, the coated
monolith is dried at temperatures right below 100 ◦C and subsequently calcined. The
calcination temperature is typically at least 400 ◦C. The calcination step is important,
22

2.3 Reactors with monolithic honeycomb catalysts
as it binds the washcoat to the monolith walls. Per coating step typically about 10 wt%
washcoat can by deposited on the walls. To achieve higher washcoat loadings, the
coating procedure can be repeated (Nijhuis et al., 2001a). The adhesion of the coating
on the monolithic carrier depends on the particle size of the ceramic powder in the
slurry (Agrafiotis et al., 1999). It is suggested, that the particle size is in the range of
the macro pores of the carrier, which corresponds to about 5 µm. To further increase
the adhesion of the washcoat on the monolith a binder material can be used, with a
particle size of about two orders of magnitude smaller. The amount of binder should be
about 10 wt% of the total amount of solids. The total amount of solids in the suspension
should be about 40 to 50 wt% (Nijhuis et al., 2001a).
The incorporation of the active phase on the monolithic support can be carried out
using the same methods applied in conventional catalysts in pellet or powder form.
Usually, a high dispersion of the active phase is desired, since the surface area of the
active phase and thus the number of active sites increase with smaller cluster sizes. In
contrast to small catalyst support particles special attention has to be payed in order to
achieve an even distribution of the active phase in the large structure of an monolithic
catalyst. Especially for high cell densities the surface tension of the impregnating
solution can cause heterogeneous distribution of the active phase within the monolith
channels. Several methods for incorporation of the active phase, e. g. impregnation, ion
exchange, precipitation and crystallization are described in the literature (Avila et al.,
2005; Nijhuis et al., 2001a).
The deposition of the active material on the porous support by the impregnation
method will be discussed in more detail in this work. The impregnation method is
carried out in three steps. Firstly, the metal precursor is dissolved e. g. in water and
the porous support is dipped into this solution. The concentration of the precursor in
the solution, affects the loading of the active phase on the support. Subsequently, the
impregnated catalyst support will be dried at a temperature right below the boiling
temperature of the solvent, to prevent boiling. It should be taken into consideration,
that the drying procedure affects the distribution of the active material on the support.
It is suggested to start the drying process after impregnating the support. Freeze-drying
or microwave drying could help to avoid redistribution of the active phase (Vergunst
et al., 2001). The final step is the calcination of the precursor containing support.
At temperatures of usually above 400 ◦C the precursor salt is changing into a metal
oxide and the interaction between the active phase and the support increases. The
23

2 Background
active phase is permanently fixed on the support. The impregnation procedure can be
repeated to increase the active phase loading on the support.
The coating of a monolith with ready-made catalyst can be carried out as described
for the porous support. This method usually results in a system with bimodal pore
size distribution. The small pores originate from the coated particles, while the large
pores originate from the void space between the coated particles. The advantage of this
coating method is an even distribution of active material inside the monolith channels.
The disadvantage is the often lower binding strength of the particles on the monolith
walls. Calcination at high temperatures to bind the particles on the monolith can
result in changes in the crystalline structure of both, the porous support and the active
material. For this purpose it is supposed to use a binding material. However, the
binding material can cover the active phase and block the pores. To avoid this, the
used amount of binding material should be as low as possible. Furthermore, if colloidal
binder material is used, the binder consists of particles and the complete blocking of
the active material is less likely (Nijhuis et al., 2001a).
2.3.3 Assessment of monolith reactors
Theoretical investigations based on correlations for mass transfer, hydrodynamics, pres-
sure drop and intrinsic kinetics showed a high potential for structured catalysts com-
pared to randomly fixed beds (Edvinsson and Cybulski, 1994; Nijhuis et al., 2003; Bauer
et al., 2005a).
In addition to modeling studies, several experimental investigations were carried out
to evaluate the potential of monolithic catalysts (Table 2.4). During these studies, it
was generally assumed that the different catalyst structures had comparable properties.
In most cases, the comparability was based on using the same mass of the catalytically
active metal in the different geometries. However, it can be suspected that the different
catalyst geometries in some of the studies summarized in Table 2.4 had not exactly the
same properties. In the literature examples (Broekhuis et al., 2004; Enache et al., 2005;
Liu, 2002; Marwan and Winterbottom, 2003; Mazzarino and Baldi, 1987; Nijhuis et al.,
2001c,b; Bauer, 2007) monolithic catalysts were compared with commercial or home-
made pellets which were used as fixed-bed or, after crushing, as suspended catalyst. In
these cases, it is not guaranteed that the pore structures and the distribution of the
active metals in different geometries are the same. In the paper by Boger et al. (2004),
24

2.3 Reactors with monolithic honeycomb catalystsT
able
2.4:
Sum
mar
yof
exp
erim
enta
lst
udie
sco
mpar
ing
diff
eren
tca
taly
stge
omet
ries
inga
s-liquid
-sol
idth
ree
phas
ere
acto
rs(A
MS:α
-met
hyls
tyre
ne,
MR
:m
onol
ith
reac
tor,
ST
R:
slurr
yst
irre
dta
nk
reac
tor,
MSR
:m
onol
ithic
stir
red
reac
tor,
DB
C:
dow
nflow
bubble
colu
mn,
RF
PB
:ra
dia
lflow
pac
ked
bed
,R
FB
R:
random
lyfixed
bed
reac
tor)
.
Ref
eren
ceR
eact
ion
Com
pare
dre
ac-
tor
type
sC
atal
yst
Bro
ekhu
iset
al.
(200
4)H
ydro
gena
tion
ofgl
ucos
eto
sorb
itol
MR
,ST
RM
R:
mon
olit
h+
was
hcoa
t+
Ru;
Pow
der:
com
-m
erci
alE
nach
eet
al.
(200
5)H
ydro
gena
tion
ofP
yrol
ysis
Gas
olin
eM
R,
RF
BR
MR
:mon
olit
h+
was
hcoa
t+
Pd/
Ni;P
elle
ts:
com
-m
erci
alL
iu(2
002)
Hyd
roge
nati
onof
styr
ene
and
1-oc
tene
MR
,R
FB
RM
R:
mon
olit
h+
4w
t%N
iO/A
l 2O
3w
ashc
oat,
70µ
m;
Pel
lets
:3.
2m
man
d2
siev
efr
acti
ons,
noco
mpo
siti
ongi
ven
Mar
wan
and
Win
terb
otto
m(2
003)
Hyd
roge
nati
onof
But
yne-
1,4-
diol
DB
C(m
ono-
lithi
c,pa
cked
,sl
urry
)
MR
:m
onol
ith
+w
ashc
oat
+1
wt%
Pd;
Pel
lets
:16
mm
Ras
chig
ring
s+
1w
t%P
d
Maz
zari
noan
dB
aldi
(198
7)H
ydro
gena
tion
ofA
MS
MR
,R
FB
RM
R:
com
mer
cial
1w
t%P
don
mon
olit
h;P
elle
ts:
com
mer
cial
egg-
shel
lP
d/al
umin
aN
ijhui
set
al.
(200
1c,b
)H
ydro
gena
tion
ofA
MS,
cons
ecut
ive
hydr
ogen
atio
nof
benz
alde
hyde
MR
,R
FB
RM
R:
mon
olit
h+
was
hcoa
t+
1w
t%N
i;P
elle
ts:
com
mer
cial
extr
udat
es+
7w
t%N
i
Bog
eret
al.
(200
4)H
ydro
gena
tion
ofed
ible
oil
MSR
,ST
RM
R:
mon
olit
h+
was
hcoa
t+
Pd;
Pow
der:
not
spec
ified
Hoe
ket
al.
(200
4)H
ydro
gena
tion
of3-
met
hyl-
1-pe
ntyn
-3-o
lM
SR,
STR
MR
:mon
olit
h+
was
hcoa
t+
bind
er+
Pd;
Pow
-de
r:Si
-sou
rce
+P
d,no
bind
erL
iuet
al.
(200
2)D
ehyd
roge
nati
onof
Eth
yl-
benz
ene
toSt
yren
eM
R,
RF
PB
MR
:ex
trus
ion
from
acti
vem
ater
ial,
wal
lth
ick-
ness
640
µm
;P
elle
ts:
crus
hed
mon
olit
h,42
0–25
0µ
mB
auer
(200
7)H
ydro
gena
tion
ofA
MS
MR
,R
FB
RM
R:
mon
olit
h+
was
hcoa
t+
Pd;
Pel
lets
:co
m-
mer
cial
Scha
nke
etal
.(1
998)
Fis
cher
-Tro
psch
synt
hesi
sM
R,
RF
BR
Bas
eca
taly
st:
com
mer
cial
alum
ina
+C
o/R
e;M
R:m
onol
ith
+ba
seca
taly
stw
ashc
oat;
Pel
lets
:cr
ushi
ngan
dsi
evin
gof
base
cata
lyst
25

2 Background
the details of the powder catalyst used were not given. In the paper by Hoek et al.
(2004), the same silica source was used for washcoating the monolith and preparing the
powder catalyst. However, the use of a binder in case of the monolith may have caused
differences to the powder catalyst that was manufactured without binder. In the study
of Liu et al. (2002) the monolith was extruded from active material and then crushed
into particles. This procedure assures an even distribution of active sites and the same
pore structure in both catalyst geometries. On the other hand, the diffusion lengths in
powder and monolith were different. Finally, Schanke et al. (1998) prepared monoliths
by washcoating of a cordierite carrier with a catalytically active CoRe/γ–Al2O3 powder.
The powder catalyst used for comparison, however, was prepared by tabletting of the
original catalyst powder and crushing to the desired sieve fractions. During the pressing
of tablets, the pore structure of the catalyst may have changed.
26

3 Modeling and simulation
3.1 Introduction
Multi-tubular fixed-bed reactors (FBRs) are used in the Shell Middle Distillate Synthe-
sis (SMDS). From Sie (1998) it can be derived, that liquid is recycled and the reactor
is operated in the trickle-flow regime in the SMDS to control the temperature inside
the reactor. Models for FBRs in the trickle-flow regime have been developed for several
hydrogenation and oxidation reactions (Dudukovic et al., 1999, 2002). To our knowl-
edge, modeling results for fixed-bed FT reactors in the trickle-flow regime are not yet
available in the literature. In the existing models it was generally assumed that liquid
is only present in the catalyst pores and that external mass transfer resistances can be
neglected (see e.g. Wang et al. (2003b)). Slurry bubble column reactors (SBCs) for
FTS have been commercialized by Sasol in the 1980s (Steynberg and Dry, 2004). The
SBC has been modeled for FTS using Fe catalyst by van der Laan et al. (1999); Rados
et al. (2003) and Wang et al. (2008) and using Co catalyst by Maretto and Krishna
(1999) and Krishna and Sie (2000).
An attractive alternative to the established FBR and SBC is the use of honeycomb
monolithic catalysts in slug flow regime. However, this flow regime requires high liquid
flow rates and consequently recycling of liquid products (Kapteijn et al., 1999). The
resulting monolith loop reactor (MLR) concept is considered in our study. Models
for honeycomb monoliths are available for several gas-liquid reactions (Edvinsson and
Cybulski, 1994; Nijhuis et al., 2003; Bauer et al., 2005a). A modeling study comparing
the MLR with simulation results obtained for a commercially sized SBC (Maretto and
Krishna, 1999) has been presented by de Deugd et al. (2003a). As a second example
of emerging reactor technologies, micro reactors (µRs) are considered. µRs could be
especially suitable for modern highly active FTS catalysts and are under development
by Velocys (Jarosch et al., 2005). Until now, modeling studies concerning µR for FTS
27

3 Modeling and simulation
have not been published.
In the present work a systematic comparison of different reactor technologies for
low temperature FTS is carried out. Both commercially established SBC and FBR as
well as novel MLR and MR are taken into consideration. The aim is to determine the
efficiencies of these reactors and to identify the degree of losses caused by mass and heat
transfer resistances. Special attention was paid to the influence of catalytic activity,
since future improved catalysts might be required for the development of alternative
FT reactor concepts.
3.2 Reactor Models
For comparison of the performance of SBC, FBR, MLR and µR, mathematical models
have been developed. Figure 3.1 illustrates the considered reactors schematically. The
reactors vary in catalyst volume per channel volume, catalyst volume per reactor vol-
ume, characteristic diffusion length (Table 3.1) as well as in the catalyst and reactor
geometry. The reactor or channel diameter represents the diameter of one channel or
tube in FBR, MLR and µR, while the SBC consists of one single reactor vessel only.
The characteristic diffusion length was defined as the ratio of the catalyst volume and
its external surface area. For MLR and µR a plate-type catalyst geometry, for FBR
and SBC spherical catalyst particles were assumed to be used. The ratio of catalyst
and reactor volume depends on both the catalyst fraction in the channel and additional
volume for internals like cooling and phase distribution equipment. Values for catalyst
volume per reactor volume of FBR and µR, which was supposed to contain catalyst
coated walls, were taken from Klemm et al. (2007). The volume of the cooling coils in
the SBC was estimated by Maretto and Krishna (1999), while the volume for internals
in the MLR was assumed to be negligible. The honeycomb catalyst was supposed to
consist of active material only without the use of an inert carrier material. Such fully
active monolith honeycombs were already used for FTS by Hilmen et al. (2001, 2005).
All considered reactors are special cases of integral reactors which are operated with
gaseous and liquid reactants over solid catalyst. The differences are the heat and mass
transfer characteristics and the hydrodynamics. To provide an adequate basis for com-
parison, all models consist of the same mass and heat balances and differ in the necessary
correlations only. The model development is based on general assumptions valid for all
28

3.2 Reactor Models
Figure 3.1: Reactors for low-temperature FTS, a) fixed-bed reactor in trickle-flowregime (FBR), b) slurry bubble column reactor (SBC), c) monolith loopreactor in slug flow regime (MLR), d) micro reactor in film flow regime(µR).
Table 3.1: Characteristics of reactors for low-temperature FTS.
Reactor type FBR SBC MLR µR
Reactor/channel diameter 25 mm variable 1.1 mm 1 mmCatalyst diameter/thickness 2 mm 42 µm 170 µm 85 µmDiffusion length 333 µm 7 µm 85 µm 85 µmCatalyst volume per channel volume 0.60 0.25 0.25 0.25Catalyst volume per reactor volume 0.15 0.20 0.25 14.5× 10⁻³
29

3 Modeling and simulation
Table 3.2: Model assumptions.
General assumptions– ideal gas law and Henry’s law applicable– no addition or removal of catalyst– constant physical properties– constant liquid flow rate– one single n-paraffin represents liquid phase (C28H58)– even distribution of gas and liquid over the cross section– no radial temperature and concentration gradients– no temperature gradients inside the catalyst– steady-state conditions– liquid phase is saturated with synthesis gas at reactor inlet
Reactor specific assumptionsfixed-bed reactor slurry bubble column reactor– polytropic operation – polytropic operation– complete wetting – no large gas bubbles– trickle-flow regime – no LS mass transfer resistances
– no axial dispersionmonolith loop reactor micro reactor– adiabatic operation – polytropic operation– no axial dispersion – no axial dispersion– slug flow regime – film flow regime
reactors and reactor specific assumptions. In general it was assumed that the model is
one-dimensional in axial direction with internal gradients inside the porous catalyst and
that the fluid phases are ideally mixed in radial direction in the bulk phase. All gen-
eral and reactor specific assumptions are listed in Table 3.2. The resulting differential
equation systems were numerically solved with Aspen Custom ModelerTM.
The physical properties of the liquid phase are taken from de Deugd (2004) where
it was assumed that the product consists of a single n-paraffin with a carbon number
of 28 (C28H58). The Henry and diffusion coefficients are taken from Maretto and Kr-
ishna (1999) for 513 K. The heat capacity of the gas phase was calculated to about
30 J mol−1 K−1 for 493 K from Perry and Green (1999). All physical properties which
are summarized in Table A.1 are assumed to be temperature independent. The reaction
kinetics are based on a simple first order approach with respect to H2 as suggested by
Post et al. (1989) (Equation 3.1), which can be used for limited CO conversions of up to
30

3.2 Reactor Models
ca. 60 % (Krishna and Sie, 2000). The activation energy EA amounts to 120 kJ mol−1
and the frequency factor k0 to 3.107× 10¹⁰ m3 m−3cat s−1.
rCO = F k cS,H2(3.1)
k = k0 exp
(− EART
)(3.2)
This reaction rate was varied in our study by a factor F describing the relative catalyst
activity. F was varied between 1 and 20 to simulate modern and future catalysts, which
would be significantly more active. This possibility of activity enhancement is based on
the recent catalyst development reported in the literature. Comparison of the achieved
reaction rate in de Deugd (2004) with Post et al. (1989) (catalyst no. 5) at 493 K reveal
an at least ten times higher reaction rate. Borg et al. (2007) reported an about 17
times higher reaction rate than reported by Post et al. (1989). The maximum possible
enhancement in reaction rate was also estimated using the turn-over frequency (TOF).
The reaction rate can be calculated from the TOF by the available Co surface area
aCo,av, which can be calculated from the Co-cluster size, the Avogadro number NA and
the required surface area per CO atom ACO,req (0.0662 nm2 atom−1) (Equation 3.3).
van Steen and Claeys (2008) reported that the TOF of Co-based FTS catalysts in the
temperature range from 473 to 493 K is limited to about 0.1 s−1 for Co-cluster sizes
above 10 nm. Supposing that the catalyst consists of spherical clusters of Co-atoms
with the minimum size of 10 nm only, a maximum possible reaction rate which is about
100 times higher than reported by Post et al. is obtained. In conclusion, the variation
of catalytic activity up to a relative enhancement of 20 appears to be reasonable.
rCO = TOFaCo,av
NAACO,req
(3.3)
The catalyst effectiveness factor was determined by using a pore diffusion model (Equa-
tion 3.4). The effective diffusion coefficient Deff was calculated from the diffusion co-
efficient D, a tortuosity of τcat = 3 and a catalyst porosity of εcat = 0.5. The catalyst
effectiveness factor was calculated for flat (µR and MR, Equation 3.5) and spherically
31

3 Modeling and simulation
shaped catalysts (SBC and FBR, Equation 3.6).
0 = Deff,H2
d2cS,H2(y)
dy2+ rCO(y) (3.4)
ηplate =1
δcat
δcat∫y=0
rCO(y)dy
rCO(y = δcat)(3.5)
ηsphere =3
δ3cat
δcat∫y=0
rCO(y) y2 dy
rCO(y = δcat)(3.6)
The mass balances comprise axial mass transfer by convection and axial dispersion as
well as mass transfer through the phase interfacial surface area. Since complete wetting
of the catalyst is assumed, kaGS implies the mass transfer from the gas phase through
the liquid film to the catalyst. At reactor inlet Danckwert’s boundary conditions were
used for all reactor types. The heat balance considers convective heat transfer, the
heat transfer to the reactor wall and the reaction enthalpy. The balance equations and
corresponding boundary conditions are summarized below.
Mass balances, gas and liquid phase:
0 =− ∂
∂zuG cG,i(z) +Dax,G
∂2cG,i(z)
∂z2(3.7)
− kaGL,i(cG,i(z)
Hei− cL,i(z)
)− kaGS,i
(cG,i(z)
Hei− cS,i(z)
)0 =− uL
∂
∂zcL,i(z) +Dax,L
∂2cL,i(z)
∂z2(3.8)
+ kaGL,i
(cG,i(z)
Hei− cL,i(z)
)− kaLS,i (cL,i(z)− cS,i(z))
32

3.2 Reactor Models
Boundary conditions, reactor inlet and outlet:
Dax,G∂cG,i(z = 0)
∂z=uinG
(cG,i(z = 0)− cinG,i
)(3.9)
Dax,L∂cL,i(z = 0)
∂z=uinL
(cL,i(z = 0)− cinL,i
)(3.10)
∂cG,i(z = LR)
∂z= 0 (3.11)
∂cL,i(z = LR)
∂z= 0 (3.12)
Boundary conditions, external catalyst surface area:
0 = kaGS,i
(cG,i(z)
Hei− cS,i(z)
)+ kaLS,i (cL,i(z)− cS,i(z)) + νi xcat η rCO(z) (3.13)
Heat balance:
0 =− (uL cp,L ρL + uG cp,G ρG)∂T
∂z− 4
dRhw,ov (T (z)− Tw) + xcat η rCO(z) ∆HR (3.14)
Impulse balance:dp
dz=
(dp
dz
)fri
+
(dp
dz
)hs
(3.15)
During the production of liquid products from the gaseous educts the molar flow rate
of the gas phase and its velocity decrease. Using the simple assumption that the gas
phase consists of CO, H2 and H2O only, the gas velocity can be calculated as a function
of the CO conversion XCO with Equation 3.16.
u(z) = uin3− 2XCO
3(3.16)
The pressure gradients, hydrodynamic and heat and mass transfer characteristics are
reactor specific and can be described with correlations from the literature. These cor-
relations are summarized in the appendix (section A.1.2 – A.1.5) for each reactor.
The SBC model is based on the work of Maretto and Krishna (1999). For simpli-
fication it was assumed, that only small bubbles exist in the SBC, which provide a
better mass transfer than large bubbles. However, the differences in mass transfer rates
33

3 Modeling and simulation
of large and small bubbles are relatively low (Maretto and Krishna, 1999). The MLR
was assumed to be operated in the slug flow regime at a liquid velocity of 0.2 m s−1
corresponding to an external liquid recycle ratio of ≈ 275. In contrast to the SBC and
MLR, it was assumed that only gas is present at the inlet of the FBR and µR. However,
during the reaction liquid product is formed and a liquid film on the catalyst surface
develops. For simplification, the simulations were carried out for a constant thickness
of this liquid film over the length of the reactor. The average film thickness for MLR
and µR was obtained from the liquid phase saturation βL of ≈ 5 vol% calculated from
CO conversion, gas and liquid flow rate (Equation 3.17) for a liquid product consisting
of a species with nc carbon atoms. In reality, the thickness of the liquid film will in-
crease with synthesis gas conversion and reactor length. The assumption of a constant
film thickness may thus lead to an overestimation of external mass transfer resistances
especially in the hot spot region at reactor entrance. The validity of this simplification
will be discussed in the results section.
βL =1
1 +VG,in
VL
uL
uG,in
(3.17)
VG,in
VL=
RTin nc ρnc
XCO pinMnc
(3.18)
3.3 Simulation Results
For the simulation study typical gas and liquid velocities were chosen for each reactor.
The corresponding flow rates and the reactor diameters can be easily calculated from
the velocities. The H2/CO-ratio in the gas feed was fixed to 2 and the liquid feed was
assumed to be saturated with synthesis gas. The temperature of the cooling medium
was set equal to the inlet temperature. The maximum temperature inside the reactor
was limited to 523 K and the CO conversion at reactor outlet was fixed to 70 %. While
typical conversions in industrial reactors are not available, we chose a conversion which
on one hand is not too far beyond the validity region of a first-order approach and
where on the other hand catalyst deactivation by the product water can be excluded.
According to literature data, deactivation and reoxidation of Co-based catalysts occurs
at H2O/H2-ratios of about 1.5 (Schanke et al., 1996) which corresponds to a conversion
of ca. 75 %. To achieve the defined conversion and maximum temperature the reactor
34

3.3 Simulation Results
length and inlet temperature were varied. Using the calculated reactor length pressure
drop, catalyst volume and reactor volume can be obtained. In the present work we
defined the catalyst and reactor productivity P , which represent the daily hydrocarbon
production rate per catalyst or reactor volume. With these data, the size of industrial
reactors can be extrapolated.
Additionally a reactor efficiency E was calculated by Equation 3.19. This reactor
efficiency represents the ratio of the mean achieved apparent reaction rate at the catalyst
and the mean reaction rate in the absence of mass transfer resistances at maximum
reactor temperature. The difference of the reactor efficiency to unity is caused by losses
due to heat and mass transfer resistances. Heat transfer resistances lead to insufficient
heat removal and to the development of a temperature profile along the reactor. If
the mean reactor temperature is lower than the maximum temperature, the achievable
reaction rate decreases. This effect can be quantified by ∆ET (Equation 3.20). On the
other hand one can distinguish between external and internal mass transfer resistances.
The efficiency losses due to internal mass transfer resistances can be calculated with
the catalyst effectiveness factor η (Equation 3.21). The efficiency losses caused by
external mass transfer resistances are given by Equation 3.22. To prove the validity
of Equation 3.22 selected simulations were conducted without external mass transfer
resistances.
E =
∫zη r(cS,H2
(z), T )dz∫zr(cG,H2
(z)
HeH2
, Tmax
)dz
(3.19)
∆ET =
∫zη r(cS,H2
(z), T )dz∫zr(cG,H2
(z)
HeH2
, T)dz− E (3.20)
∆Eintern = 1− η (3.21)
∆Eext = 1− (E + ∆ET + ∆Eintern) (3.22)
In the following diagrams, the simulation results for the different reactor types as a
function of the relative catalyst activity are summarized. Details of operating conditions
and simulation results are given in Table A.2 and A.3. The calculated pressure drop
is decreasing with increasing catalyst activity for all reactors (Figure 3.2). This can
35

3 Modeling and simulation
0 5 1 0 1 5 2 01 0 3
1 0 4
1 0 5
1 0 6
pressu
re dro
p [Pa
]
r e l a t i v e c a t a l y s t a c t i v i t y [ - ]
S B C F B R µR M L R
Figure 3.2: Pressure drop as a function of relative catalyst activity.
be explained by the decreasing residence time required for the desired conversion and
thus a decreasing reactor length. For the FBR a low influence of catalyst activity on
pressure drop is predicted. This can be explained by the very low catalyst utilization
in this reactor type as will be discussed later. The surprisingly small pressure drop in
FBR may be explained by fact that the static liquid holdup, which can increase the
pressure drop significantly, was not considered in this study.
The catalyst productivity increases with increasing catalyst activity (Figure 3.3).
SBC and µR achieve the highest productivities, followed by MLR and FBR. Again,
the FBR shows the least dependence on the variation of catalytic activity. Analysis
of these results is possible by use of the reactor efficiency (Figure 3.4). The reactor
efficiency generally decreases with increasing catalyst activity, caused by an increasing
role of heat and mass transfer resistances. One can see that the utilization of catalysts
is very high for µR and SBC even at high catalytic activities. The value in the range
of 0.6 to 0.65 for the MLR is only slightly decreasing with relative catalytic activity.
Simulation of the FBR results in much lower reactor efficiencies especially for highly
active catalysts.
Figure 3.5 quantifies the efficiency losses for the highest relative catalyst activity
of 20. The columns in this Figure represent the reactor efficiency and the efficiency
losses caused by lower mean reactor temperature, external and internal mass transfer
36

3.3 Simulation Results
0 5 1 0 1 5 2 01 0 1
1 0 2
1 0 3
S B C F B R µR M L R
catal
yst pr
oduc
tivity
[bbl m
cat-3 d-1 ]
r e l a t i v e c a t a l y s t a c t i v i t y [ - ]
Figure 3.3: Catalyst productivity as a function of relative catalyst activity.
0 5 1 0 1 5 2 00 . 0
0 . 2
0 . 4
0 . 6
0 . 8
1 . 0
reacto
r effic
iency
[-]
r e l a t i v e c a t a l y s t a c t i v i t y [ - ]
S B C F B R µR M L R
Figure 3.4: Reactor efficiency as a function of relative catalyst activity.
37

3 Modeling and simulation
� �� �� � ���
���
���
���
���
���
reacto
r effic
iency
and l
osse
s [-]
r e a c t o r e f f i c i e n c ye f f i c i e n c y l o s s e s
t e m p e r a t u r e e f f e c t e x t e r n a l m a s s t r a n s f e r i n t e r n a l m a s s t r a n s f e r
Figure 3.5: Influence of heat and mass transfer resistances on the reactor efficiency fora relative catalyst activity of 20.
resistances (from bottom to top). The SBC is operating completely isothermal. Due
to the small catalyst particles used, internal mass transfer resistances are also absent.
The deviation of the reactor efficiency from unity can thus be ascribed to external (i.e.
gas-liquid) mass transfer resistances. The reactor efficiency for the µR is very high. It is
mainly affected by internal mass transfer resistances at the assumed catalyst layer thick-
ness. External mass transfer resistances are of minor importance, while heat transfer
resistances are absent as the reactor operates almost isothermal. Given the low influence
of external mass transfer resistance for the µR, the accuracy of the simulation results
is not much affected by the assumption of a liquid product layer of constant thickness.
The MLR is the most efficient reactor if only mass transfer resistances are considered.
The main efficiency loss of this reactor type is caused by the adiabatic operation. At
the given recycling rate of the liquid product, the inlet temperature has to be chosen
considerably lower than the maximum reactor temperature. The observed differences
in internal mass transfer resistances between µR and MLR at the same diffusion length
can be attributed to the higher mean temperature and thus higher mean reaction rate
in the µR. In the FBR the temperature effect is surprisingly small, although this reac-
tor exhibits a significant deviation from isothermal behavior (cf. Table A.2). However,
the temperature effect is superimposed by extremely strong internal and external mass
38
3.3 Simulation Results
transfer resistances inhibiting the overall reaction rate and reducing the danger of hot-
spot formation. As operation of the FBR in the trickle-flow regime with a constant
film thickness is only a simplified limiting case, further simulations were carried out.
Another limiting case would be a “dry” FBR without formation of a liquid product film
and with negligible external mass transfer resistances. However, the performed simula-
tions for this case show a very sensitive behavior of the “dry” FBR. Thermal “run-away”
occurs already with a relative catalyst activity of 3, because the heat removal over the
reactor wall is not sufficient at the chosen reactor diameter of 25 mm. In contrast to
the results obtained in the trickle-flow regime, severe efficiency losses are caused by the
deviation from isothermicity even at low relative catalytic activities.
These results clearly indicate the most important efficiency losses for each reactor type
and allow the discussion of possible efficiency improvements. The µR is the most effi-
cient reactor and the main losses are due to internal mass transfer limitations. However,
a further decrease of catalyst layer thickness is not advantageous as will be discussed
later. The already quite efficient SBC is mainly affected by external mass transfer limi-
tation. This behavior can possibly improved by the use of internals giving rise to bubble
breakage and an increased gas-liquid mass transfer coefficient. The strongest limitation
of the MLR originates from the adiabatic operation. The efficiency losses caused by the
lower mean reactor temperature can be reduced by applying a larger recycle of liquid
product. However, this necessitates the use of larger recycle pumps requiring higher
power. Although the results for the FBR are the least reliable, it is evident that this
reactor type suffers from severe mass transfer resistances. The influence of external
mass transfer may be reduced by decreasing the catalyst particle diameter. On the
other hand, pressure drop would increase at the same time. External mass transfer of
the FBR in the trickle-flow regime may be improved by periodic operation (Silveston
and Hanika, 2004). However, unsteady-state operation of mega-size commercial FT
reactors is hard to imagine.
In Figure 3.6 the reactor productivity including the required volume for the catalyst
bed and the internals for cooling and phase distribution is depicted as a function of
catalyst activity. Due to the fact that the considered reactors differ strongly in the
requirements for internals, the reactor productivity shows different trends than the cat-
alyst productivity. Again, the reactor productivity increases with the catalyst activity.
Now, the highest values are obtained for the SBC and the MLR, whereas the produc-
tivity for µR and FBR is low. Although the µR allows for the best catalyst utilization,
39

3 Modeling and simulation
0 5 1 0 1 5 2 01 0 - 1
1 0 0
1 0 1
1 0 2
reacto
r prod
uctivi
ty [bb
l mR-3 d-1 ]
r e l a t i v e c a t a l y s t a c t i v i t y [ - ]
S B C F B R µR M L R
Figure 3.6: Reactor productivity as a function of relative catalyst activity.
it does not offer attractive reactor volumes as the assumed ratio of catalyst and reactor
volume is by far too low.
In an attempt to improve the performance of µR and MR, further simulations were
carried out with increased thicknesses of the catalyst layers (Figure 3.7). While the
ratio of catalyst and reactor volume can be increased with higher layer thicknesses,
the efficiency is negatively affected by stronger pore diffusion resistances. We assume
that the chosen higher diffusion length of 125µm for the MLR represents the maximum
achievable in a channel of ca. 1 mm as the open frontal area would otherwise become
too small. It can be seen that with a MLR of this layer thickness a reactor productivity
close to a SBC can be achieved. On the other hand, even an µR with a catalyst layer
thickness of 250µm exhibits only one sixth of the SBC reactor productivity. A further
increase of the catalyst layer thickness is not useful since the catalyst effectiveness factor
would decrease even more.
A comparison of the MLR to the SBC was already carried out by de Deugd (2004).
De Deugd compared the required reactor volume for the MLR and SBC and found
that it is about the same. It was stated, that the MLR exhibits several advantages
over the SBC. First of all, the MLR offers plug flow behavior due to the slug flow
regime, whereas the SBC suffers from backmixing. However, the backmixing behavior
in the SBC is controversially discussed as already mentioned. It appears more plausible,
40

3.3 Simulation Results
��� ��� ����� ����� ��� ������
��
��
��
�
��� r e a c t o r p r o d u c t i v i t y r e a c t o r e f f i c i e n c y
reacto
r prod
uctivi
ty [bb
l d-1 m
R-3 ]rea
ctor e
fficien
cy [%
]
S B C µR M L R
Figure 3.7: Reactor efficiency and productivity for different diffusion lengths in µR andMLR compared to the SBC.
that the residence time distribution of synthesis gas should not significantly differ from
ideal plug flow behavior in reactors with a sufficient high length-to-diameter ratio.
Furthermore, de Deugd stated, that the adiabatic temperature rise in the MLR increases
the productivity, but decreases the selectivity to heavy products. It was also stated, that
the process is reaction determined on the one hand and benefits from the enhanced mass
transfer rate for more active catalysts on the other hand. Based on these arguments it
is surprising, that the MLR do not outperform the SBC with respect to the required
reactor volume.
The simulation results presented in this work first of all confirm the results obtained
by de Deugd with respect to the comparison of MLR and SBC. The MLR is able to
compete with the SBC especially for more active catalysts. Compared to de Deugd
this simulation study was extended to SBC, µR and FBR. Furthermore, the reactor
efficiency and efficiency losses due to heat transfer and internal and external mass
transfer resistances are quantified. It was shown, that for highly active catalysts the
SBC suffers from external mass transfer resistances, while the MLR is affected by the
adiabatic temperature rise. This explains, that the MLR is not able to outperform the
SBC even for more active catalysts. In addition to results from de Deugd it was shown,
that the reactor productivity of the SBC and the MLR profits in a similar manner from
41

3 Modeling and simulation
more active catalysts. A decision between SBC and MLR will depend on the reduction
in mass transfer resistances and on the efforts of catalyst separation in the SBC and
the reduction of adiabatic temperature rise and on efforts for the liquid recycle in the
MLR.
The required liquid recycle flow rate for an industrial scale MLR plant can be cal-
culated with Equation 3.23. As an example a hydrocarbon production capacity of
Vproduct = 47 300 bbl d−1 (5000 t d−1) and a relative catalyst activity of 5 was chosen, as
described by Maretto and Krishna (1999) for a SBC. The liquid recycle flow rate was
calculated to 41.3 m3 s−1, which results in a total reactor cross sectional area of 206 m2
for a liquid superficial velocity of 0.2 m s−1. The power consumption of the liquid pump
can be calculated from the pressure drop and the liquid recycle flow rate. With a pres-
sure drop of 82 kPa, the total resulting power consumption of the pumps amounts to
approx. 3.39 MW excluding the pressure drop of the tubing. Increasing the relative
catalyst activity to 20 will also result in a liquid recycle flow rate of 41.3 m3 s−1, but
a significantly smaller total pressure drop of 22.3 kPa, which reduces the total power
consumption to 923 kW. However, the total liquid recycle flow rate is split over the
number of parallel reactors. The feasible volumetric flow rate of one pump will define
the number of parallel trains and the reactor diameter. Depending on the process tem-
perature and pressure a liquid flow rate of several cubic meter per second seems to be
feasible (e. g. KSB AG, type RDLO).
Vrecycle =uL VproductPR LR
(3.23)
The liquid recycle is reasonable to remove the heat of reaction of ≈600 MW. This
huge amount of thermal power can be calculated from the daily production capacity of
hydrocarbons, the molar weight for one –CH2– element in the hydrocarbon chain and
the reaction enthalpy of −150 kJ per mole converted CO. In relation to the heat of
reaction the power consumption of the pump amounts to about 0.6 % and thus reduces
the degree of effectiveness only slightly. Moreover, the heat exchanger in the liquid
recycle could be used to produce steam at up to 250 ◦C, which corresponds to a pressure
of ≈40 bar. The required mass flow rate of the cooling water can be calculated with
the standard enthalpy of vaporization of ≈1.7 MW kg−1 at 250 ◦C to ≈350 kg s−1. This
attractive energy transfer medium can be used to significantly reduce the electric power
consumption of the total FT plant. It can be concluded, that, besides the distribution
42

3.4 Conclusions
of gas and liquid over the cross section, the main challenge in applying MLR in FTS is
the large liquid recycle flow rate, since the power consumption is high. Nevertheless, it
is almost negligible in the overall energy balance of the unit. However, increasing the
catalyst activity will further reduce the required reactor length and thus the pressure
drop and power consumption for pumping.
3.4 Conclusions
Different reactor types for low temperature FTS were compared. In addition to the
commercially established SBC and FBR, novel MR and µR were taken into account.
According to our analysis, the SBC is up to one order of magnitude more effective
than a FBR operated in the trickle-flow regime both in terms of required catalyst
and reactor volume. This drastic difference can be explained by smaller external and
internal mass transfer resistances and a completely isothermal operation of the SBC.
However, as the separation of the catalyst from the liquid products is still a challenge
for SBCs, the search for alternative reactors is justified. The MLR appears to be a
quite interesting alternative to the SBC as it offers almost the same productivity per
reactor volume using a fixed-bed catalyst configuration. However, this concept requires
a large external recycle of the liquid product, which represents the essential challenge
for an application on industrial scale. A µR offers a very high efficiency, since mass
and heat transfer resistances are negligibly small. On the other hand, a µR with only a
thin layer of catalyst applied to the reactor walls provides not enough productivity per
unit of total reactor volume to become industrially attractive. Progress in µR for FTS
will only be achieved if the ratio of catalyst and reactor volume can be significantly
increased.
43

4 Catalyst Preparation
This chapter describes the preparation and characterization of different catalyst ge-
ometries with comparable pore structure and dispersion of active sites in the catalyst
layer. For this purpose monolithic honeycomb catalysts are prepared by coating with
ready-made catalysts. This method is quite often used by manufacturers of automotive
car exhaust catalysts (Heck et al., 2002).
4.1 Catalyst preparation
Powder and monolithic catalysts with approximate contents of 20 wt% Co and 1 wt% Re
on γ-Al2O3 were prepared (Figure 4.1) as described by Schanke et al. (1998). This allows
comparison to previous investigations of monoliths in FTS by the groups of Kapteijn
and Moulijn (de Deugd et al., 2003c; Kapteijn et al., 2005) and Holmen (Hilmen et al.,
2001, 2005; Storsæter et al., 2005b). Firstly, a base powder catalyst was prepared (step
1). The base catalyst and additional binder material was suspended (step 2) to coat
a cordierite monolith carrier by dip-coating (step 3). The suspension was also used
to produce the powder catalyst by drying and calcining (step 4). For preparation of
the base powder catalyst 139.5 g alumina powder (γ-Al2O3, 5 µm, Puralox UF 5/230,
Sasol) was suspended in a solution of 174.6 g cobalt nitrate (Co(NO3)2 · 6 H2O) and
4.56 g perrhenic acid (54 wt%, H.C. Starck) in 222 ml of de-ionized water. Subsequently,
this suspension was dried at 90 ◦C and calcined for 4 h at 400 ◦C in air. The slurry for
dip-coating was prepared by suspending 60 g of the base powder catalyst in 54 ml de-
ionized water and 34 ml colloidal alumina binder (pseudo-boehmite AlOOH, 20 wt%,
50 nm, pH 7, Alfa Aesar). A pH of 7 in aqueous environment was optimal as will be
shown later. The suspension was dispersed with an ultrasound sonotrode for 1 min at
100 W. The resulting slurry contained 45 wt% of solid while 10 wt% of the solid fraction
consisted of colloidal binder material.
44

4.1 Catalyst preparation
Figure 4.1: Preparation method for powder and monolithic catalysts.
As carrier monoliths (cordierite, 400 cpsi, Corning) with a diameter of 16 mm and
a length of 50 mm were used (Figure 4.2). After dip-coating for 1 min, the monolith
channels were blown out with pressurized air to remove the excess slurry. The outer
surface of the monolith was cleaned to remove the coating. Finally, the coated monoliths
were dried for 1 h at 90 ◦C and calcined for 4 h at 400 ◦C in air. The coating procedure
was repeated to achieve higher washcoat mass fractions, each step followed by drying
and calcination. For comparison, monolith samples were also coated with pure alumina
washcoats.
The mechanical stability of the washcoats was examined by flow-through tests with
water. After 3 h at a velocity of 12 cm s−1 followed by 1 h at a velocity of 1 m s−1 a loss
of only 0.3 wt% was measured. Hence, the washcoat on the monolithic carrier appears
to be sufficiently stable.
The final powder catalyst was prepared by using the same slurry as for the dip-
coating. The slurry was dried for 6 h at 90 ◦C, calcined for 4 h at 400 ◦C and then
crushed and sieved to the desired fraction.
45

4 Catalyst Preparation
Figure 4.2: Photograph of an uncoated (left) and coated (right) honeycomb monolith.
4.2 Catalyst characterization
The zeta potential of slurries was measured with a Nano-ZS zeta sizer (Malvern Instru-
ments). The resulting catalysts and the main intermediates were analyzed by different
methods. The chemical composition of the catalysts was determined by ICP-OES. The
pore structure and BET surface area were measured using nitrogen adsorption. XRD
(X-ray diffraction) measurements were carried out to determine the phase structures.
The distribution and the layer thickness of the washcoat were examined by scanning
electron microscopy (SEM).
Temperature programmed reduction (TPR) was performed to receive information
about the phases present in the sample (Lemaitre, 1984). The samples were heated
with a ramp of 10 K min−1 from 50 to 550 ◦C in a flow (30 ml min−1STP) of 10 % H2 in Ar
at atmospheric pressure.
Pulsed chemisorption measurements with CO were used to determine the active metal
surface area, the metal dispersion and the mean cluster size. The pulsed chemisorption
was carried out at 50 ◦C with 10 % CO in He after reducing the catalyst for 1.5 h at
350 ◦C under pure hydrogen. For both techniques a BELCAT-M (BEL Japan, Inc.)
catalyst analyzer was used. The active metal surface area aCo and the active metal
dispersion DCo can be calculated from the measured CO uptake ∆nCO (Equations 4.1
and 4.2, Lemaitre et al. (1984)). The mean Co cluster size dCo can be calculated from
the Co dispersion by Equation 4.3 (Lemaitre et al., 1984). The parameters used in
46

4.3 Results and discussion
Table 4.1: Required parameters for calculation of active metal surface area, dispersionand the mean cluster size from CO chemisorption measurements, (taken fromReuel and Bartholomew (1984): νCO for 15 wt% Co on Al2O3, σCo).
Symbol Dimension Value
CO uptake ∆nCO mol g−1cat –
Avogadro number NA mol−1 6.022× 10²³
Area per surface atom σCo nm2 atom−1 0.0685Stoichiometry factor for CO adsorption on Co νCO – 1.0Co molar mass MCo g mol−1 58.93Co mass fraction on catalyst xm,Co – 0.186Co density ρCo kg m−3 8900Geometry factor for spheres g – 6Fraction of active metal surface exposed to reactants f – 1
Equations 4.1, 4.2 and 4.3 and typical values are summarized in Table 4.1.
aCo =∆nCONA σCo
νCO
(4.1)
DCo =MCo ∆nCO
νCO xm,Co
(4.2)
dCo =g f MCo
ρCo σCoNADCo
(4.3)
The pore size distribution was measured by N2 adsorption and Hg intrusion, respec-
tively. The N2 adsorption allows a high resolution of pore sizes between 0.4 and 400 nm,
while the Hg intrusion method allows the measurement of the pore size distribution over
a broad range between 2 nm and 200 µm with a more rough resolution.
4.3 Results and discussion
4.3.1 Dip-coating
To optimize the pH conditions for the dip-coating procedure zeta potential measure-
ments were carried out for the base materials by varying the pH with hydrochloric
acid between 3.5 and 7. The zeta potential is a reference value for the adhesive forces
between particles. Particles with different or low absolute potentials tend to agglom-
erate, while a suspension with particles with a potential of more than 25 – 50 mV can
47

4 Catalyst Preparation
be assumed as stable (Hunter, 1991). The results of the measurements are shown in
Figure 4.3. The monolithic carrier was crushed to particles to measure its potential.
Between pH 3.5 and 7 the potential of the carrier decreases from −20 to −35 mV, while
the potential of the base powder decreases from 40 to 20 mV. The colloidal binder
material has a potential of 55 mV at a pH of 7. After impregnating the base powder
with active material the potential of the base powder catalyst is lower than that of the
base powder and decreases between pH 3.5 and 7 from 40 to 0 mV. Adding the binder
material to the base powder catalyst leads to an increase in the potential of the final
powder catalyst that remains almost constant at 40 mV over the considered pH range.
These results reveal that a suspension of the final powder catalyst is stable. Due to the
large difference in the potentials of monolith carrier and final powder catalyst at pH
7, a good adhesion between washcoat and cordierite carrier should result. Christiani
et al. (2005) analyzed the effect of ageing time in γ-Al2O3 slurries for dip-coating and
suggested to use a pH of 3.5. However, in contrast to the experiments described in this
paper, Christiani et al. used base alumina powder without active metal and colloidal
binder. In conclusion, for coating monoliths with the CoRe/Al2O3 powder catalyst with
added AlOOH binder a pH of 7 should be chosen.
The mass of the washcoat on the monolithic carrier was measured gravimetrically.
The different curves shown in Figure 4.4 were obtained by repeating the experiments
under identical conditions. A comparison of coatings with base alumina powder and
powder catalyst shows that higher washcoat mass fractions are achieved using the pure
alumina slurry. This can be explained by the higher zeta potential difference between
alumina powder and monolithic carrier compared to the powder catalyst Figure (4.3).
The high washcoat mass fraction increase during the sixth coating step with alumina
powder can be explained by blocking of some channels. In all other cases, the increase
of washcoat mass fraction gradually decreases with number of coating steps. Two
explanations may be given for this phenomenon. Firstly, if a surface is coated with
porous layer, the zeta potential of the whole system will change until eventually the
values of the coating are reached. Consequently, the driving force for agglomeration
will decrease. Secondly, the surface area of the channel also diminishes with increasing
washcoat mass fraction. This leads to a decrease in coating capacity of the capillary
and thus in a lower achievable washcoat mass fraction per coating step.
48

4.3 Results and discussion
1 3 5 7 9- 6 0
- 3 0
0
3 0
6 0
zeta
poten
tial [m
V]
p H [ - ]
b i n d e r m o n o l i t h i c c a r r i e r b a s e p o w d e r b a s e p o w d e r c a t a l y s t f i n a l p o w d e r c a t a l y s t
Figure 4.3: Zeta potentials of base materials and catalysts.
0 1 2 3 4 5 60 . 0
0 . 1
0 . 2
0 . 3
m o n o l i t h i c c a r r i e r w i t h f i n a l p o w d e r c a t a l y s t
m o n o l i t h i c c a r r i e r w i t h b a s e p o w d e r
wash
coat
mass
fractio
n [g wc
/g cat]
n u m b e r o f c o a t i n g s t e p s [ - ]
Figure 4.4: Mass fraction of washcoat on monolithic catalysts.
49

4 Catalyst Preparation
10 20 30 40 50 60 70 80
scattering angle 2q
counts
monolithic catalyst
final powder catalyst
base powder catalyst
+
x
x
x xx
oo
+
++
Figure 4.5: XRD pattern for base powder catalyst, final powder catalyst and monolithiccatalyst, (+) AlOOH, (x) Co3O4, (o) γ-Al2O3.
4.3.2 Catalyst composition
The catalyst composition was determined by ICP-OES measurements. According to
the elemental analysis, the prepared catalyst had a cobalt content of 18.6 ± 0.9 wt%
and a rhenium content of 1.2 ± 0.1 wt% on the γ-Al2O3 support. These values are in
good agreement with the desired composition of 20 wt% Co and 1 wt% Re.
Figure 4.5 shows the results of XRD measurements for base powder, final powder and
monolithic catalyst as a function of the scattering angle 2θ. The characteristic peaks for
Co3O4, γ-Al2O3 and AlOOH are marked exemplary for the final powder catalyst with
(x), (o) and (+), respectively. The difference between the base powder and final powder
catalyst is the presence of colloidal alumina binder in the final powder catalyst. The
results for the monolithic catalyst exhibit more peaks compared to the powder catalyst,
since the sample contains high amounts of cordierite. The peaks for Co3O4 and γ-Al2O3
can not be identified, as the washcoat mass fraction in the sample amounts to about
20 wt% only. The crystal structure is similar to the results obtained by Storsæter et al.
(2005b).
50

4.3 Results and discussion
Table 4.2: Properties of final catalyst and intermediates (* measured, ** calculated,*** as final powder catalyst, ] from data sheet).
aBET Vpore dpore ε ρappDimension m2 g−1 cm3 g−1 nm – g cm−3
Monolithic carrier* 0.28 0.16 2528 0.26 1.60Monolithic catalyst* 33.6 0.22 730 0.36 1.65Base powder* 197 (208)] 1.00 288 0.64 0.645Base powder catalyst* 144 0.80 541 0.65 0.806Final powder catalyst* 167 0.67 325 0.62 0.920Washcoat** 167 0.46 0.63 0.920***
4.3.3 Pore structure and surface areas
Data describing the pore structure and BET surface area of catalysts and intermedi-
ates are summarized in Table 4.2. The washcoat could not be characterized separately,
because it is attached to the monolith carrier. The corresponding data were thus cal-
culated from values for the monolith carrier and catalyst using Equations 4.4 to 4.6.
awc =amcat − (1− xm,wc) amc
xm,wc(4.4)
Vpore,wc =Vpore,mcat − (1− xm,wc)Vpore,mc
xm,wc(4.5)
εwc =εmcat − (1− xv,wc) εmc
xv,wc(4.6)
In Equation 4.6 the volume fraction of the washcoat in the catalyst xv,wc is used.
This value can be calculated from the mass fraction xm,wc as shown in Equation 4.7,
where ρ is the apparent density. From the measured densities and porosities given in
Table 4.2, a value of xv,wc = 0.27 is obtained.
xv,wc =1
1 + ρwc
ρmc
1−xm,wc
xm,wc
(4.7)
The results in Table 4.2 show that the pore volume of the washcoat is smaller than that
of the final powder catalyst although the calculated porosities are very similar. This
contrasting result may be caused by measurement errors, especially for the monolithic
catalyst and thus also for the washcoat.
51

4 Catalyst Preparation
0.1 1 10 100 10000.000
0.002
0.004
0.006
0.008
0.010
sp
ecifi
c po
re v
olum
e [c
m3 /g
]
pore diameter [nm]
(a) N2 adsorption
1 10 100 1000 100000.00
0.05
0.10
0.15
0.20
spec
ific
pore
vol
ume
[cm
3 /g]
pore diameter [nm]
final powder catalyst washcoat
(b) Hg intrusion
Figure 4.6: Distribution of specific pore volume in the final powder catalyst and thewashcoat.
Table 4.3: Active metal dispersion, active surface area and mean cluster size of finalpowder catalyst and monolithic catalyst.
DCo aCo dCo
% m2Co g−1
cat nm
Final powder catalyst 3.77 ± 0.38 5.09 ± 0.51 26.7 ± 2.69Monolithic catalyst 3.01 ± 0.08 4.08 ± 0.11 33.2 ± 0.92
As can be seen in Figure 4.6, there are only minor differences in the pore size distri-
butions of final powder and monolithic catalyst. The BET surface area of the washcoat
and the final powder catalyst are also very similar (Table 4.2). Thus, it can be con-
cluded, that the monolithic catalyst and the final powder catalyst have comparable pore
structure properties. Since the same active catalyst powder was used for washcoating
and preparation of the powder catalyst, the distribution of active sites must also be
very similar.
The results of TPR measurements of final powder and monolithic catalysts are shown
in Figure 4.7. The profile of monolithic catalyst shows smaller peaks for Co(NO3)2,
Co3O4 and Re, which may be caused by its longer overall calcination time. The results
of the chemisorption experiments obtained with final powder and monolithic catalysts
52

4.3 Results and discussion
0 100 200 300 400 500 6000
10
20
30
40
spec
ific
TCD
sig
nal [
mV
mg ca
t-1]
temperature [°C]
CoOCo3O4Co(NO3)2 Re
final powder catalyst monolithic catalyst
Figure 4.7: TPR profiles of final powder and monolithic catalyst.
are summarized in Table 4.3. In all cases, the small rhenium content was neglected
and it was assumed that the reduced catalyst consisted of cobalt metal on alumina.
It can be seen that the measured active metal surface area of the final powder cata-
lyst is somewhat higher than for the monolithic catalyst. Consequently, higher metal
dispersion and smaller cobalt cluster size are obtained. The results of chemisorption
measurements are mainly comparable to literature, although a higher cobalt dispersion
of 10.2 % has been reported (Storsæter et al., 2005a). This may be caused by lower
cobalt and rhenium contents (12 wt% Co, 0.5 wt% Re) and a different chemisorption
method using hydrogen adsorption at 40 ◦C.
4.3.4 Characteristic diffusion length
The characteristic diffusion length in porous catalysts is usually expressed by the ratio
of catalyst volume and its external surface area. If one assumes spherical geometry of
the powder catalyst, the resulting diffusion length amounts to one sixth of the mean
particle diameter.
In our case, a coated square monolith channel typically shows an about 5 times higher
catalyst thickness in the corners (≈ 225 µm) compared to the planar walls (≈ 45 µm)
(Figure 4.8). The characteristic diffusion length of the monolith washcoat was calculated
53

4 Catalyst Preparation
planar wallthickness
edge thickness
carrier material
washcoatvoid space
(a) scheme of one coated square monolithchannel
(b) SEM picture of the wash-coat thickness in the cornersof the channels
(c) SEM picture of an array ofmonolith channels
Figure 4.8: Washcoated square monolith channel.
54

4.4 Conclusions
with Equation 4.8. Here, the numerator represents the washcoat volume in one cell of
the monolith. In the denominator the external surface area is calculated using the
void space of a coated capillary. The open frontal area OFA of an uncoated monolith
capillary is typically 0.75 and the diameter of a monolith cell dcell is 1.27 mm for the
400 cpsi monolith used in our study. This calculation accounts for the distribution of
the washcoat thickness and should give a reliable value for the characteristic diffusion
length.
δwc,char =xv,wc dcell
4√OFAmc − xv,wc
(4.8)
For the crushed monolithic catalysts, which are also investigated in the STR, it can be
expected that the diffusion length of the major fraction is lower than the washcoat layer
thickness on the planar walls, i.e. 45 µm. However, it cannot be excluded that part of
the crushed catalyst layer, especially from the corners of the square monolith channels
has a higher diffusion length. Overall, we assume a characteristic diffusion length of
50 µm for the crushed monolith.
4.4 Conclusions
Monolithic and powder catalysts for FTS based on Co (18.6 ± 0.9 wt%) and Re (1.2
± 0.1 wt%) on γ-Al2O3 have been prepared. The monolithic catalysts were obtained
by dip-coating in an aqueous suspension of base powder catalyst and colloidal binder
followed by a calcination step. The washcoat thickness was adjusted by repeating this
procedure. It was found, that the washcoat mass fraction achieved in each coating
step decreases with the number of steps. This can be explained by decreasing surface
area during coating and lower differences in zeta potential between the slurry particles
and the monolith carrier. After six coating steps a washcoat mass fraction of about
0.20 gwc/gcat was achieved. The final powder catalyst was prepared by drying and
calcination of the same catalyst slurry. The composition of the monolithic washcoat
and powder catalyst is equal, because the same slurry was used for both preparations.
It could also be shown that the pore structure and the internal surface area of the
final powder catalyst and the monolith washcoat are very similar. Some differences
were found in the reduction behavior and the active metal dispersion by TPR and CO
chemisorption measurements, which might be caused by different overall calcination
times. The comparability of powder catalyst and monolith washcoat may be further
55

4 Catalyst Preparation
increased by preparing the final powder catalyst in different layers on a flat support in
the same manner as the washcoat. These layers can afterwards be removed from the
support, crushed and sieved to the desired fraction.
In conclusion, the present results show that the preparation of powder and monolithic
catalysts with identical physical and catalytic properties is challenging. However, the
achieved properties of the catalysts are very similar and provide a good basis for a more
detailed and systematic comparison of powder and monolithic catalysts used for FTS.
56

5 Experimental setup and procedure
5.1 Experimental setup
The experimental setup consists of a combination of a fixed-bed reactor and a well-
mixed tank reactor for investigating monolithic and powder catalysts. Figure 5.1 and
5.2 present the scheme and an image of the experimental setup. The detailed flow
diagram is given in Figure A.3 in the Appendix A.2.
The setup can be operated continuously by feeding CO, H2 and an internal standard
(e. g. CO2, Ar) in separated lines using Bronkhorst Hi-Tec mass flow controllers. Addi-
tionally, the setup can be flushed with N2. The feed gas mixture is led to the reaction
section. After passing the reaction section the product stream is separated by wax (V3)
and water (V4) separators to take wax and water samples. The operating pressure is
maintained by a back pressure regulator downstream the water separator. The setup is
mounted on a vented framework which is covered by plexiglass.
The reaction section can be operated in two modes. For investigation of powder
catalysts, the stirred tank (V2) is used by directly feeding the educts via line S3. The
streams S1, S2 and S4 are disconnected in this case. For operation in fixed-bed mode,
the feed gas mixture is added to the gas recycle stream (S1). Gas and liquid (S2) recycle
streams are mixed and supplied to the tubular reactor (V1). In this operation mode
the STR is used as phase separator for the gas and liquid phase. Gas and liquid phase
can be recycled independently from the STR by means of a compressor and a pump.
Since the gas recycle ratio at the chosen conditions is about 100 and the conversion per
pass is low, both the MLR and the STR are well mixed.
The stainless steel tubular reactor (22×2 mm) contains a static mixer (Fluitec Georg
AG, CSE-X/8G 12.4 mm, 5 elements) at the top and a stainless steel sieve (≈ 500 mesh)
at the bottom. The static mixer is used to disperse gas and liquid over the reactor
cross section. The sieve fixes the monolithic catalyst inside the tubular reactor. Two
57

5 Experimental setup and procedure
streams:
S1 gas recycle
S2 liquid recycle
S3 bypass for
CSTR operation
S4 recycle for
condensed liquid
vessels:
V1 tubular reactor
V2 stirred tank reactor
V3 hot separator
V4 cold separator
FIC
FIC
FIC
H2
CO
standard
N2 PC
flare
GC
water
sample
wax
sample
V3 V4
S3
V2
FIC
FIC
S1
S2
V1
S4
Figure 5.1: Scheme of the monolith loop reactor setup.
internal reactor diameters were used during the experiments (12 mm and 18 mm) at
constant length of the catalyst bed of 50 cm. The reactor can be heated up to 400 ◦C
by heating tape from HORST GmbH. Temperature is measured at the reactor wall, in
the liquid recycle above the static mixer and directly below the catalyst bed by type K
thermocouples.
The STR is home made and consists of a lid and a body (Figure 5.3). The lid is
mounted on the framework and is heated by a flexible heating cartridge (hotspring F/4,
4.2×2.2 mm, 295 W) from Hotset GmbH. The lid also provides thread bores (6×G1/4 in,
2×G3/8 in) for the connection to gas and liquid recycle, gas feed, tubular reactor,
liquid reservoir, downstream section, thermocouple and manometer. On the top of
the lid the stirrer engine (Funrun MRK 46, premex reactor GmbH, 90 N cm, 120 W)
is mounted, which can be equipped with home made blade and gas injection stirrers.
The body of the stirred tank is equipped with two windows of sapphire glass from
SITEC-Sieber Engineering AG (Ø 18 mm). To achieve good mixing and to prevent
sedimentation of the catalyst the dead volume is minimized by rounded edges at the
bottom. Furthermore the reactor has been equipped with baffles. The body is heated
by six heating cartridges from Hotset GmbH (hotrod HHP, 8×130 mm, 250 W). For
58

5.1 Experimental setup
1
7
2
3
4
6 8
9
5
10
Figure 5.2: Image of the monolith loop reactor setup: (1) gas feed, (2) tubular reactor,(3) liquid recycle pump, (4) liquid recycle mass flow meter, (5) gas recyclecompressor, (6) gas reservoir, (7) gas recycle mass flow controller, (8) liquidreservoir, (9) stirred tank reactor and phase separator, (10) heated tubingto wax and water separator.
59

5 Experimental setup and procedure
1
234
5
6
7
Figure 5.3: Image of the homemade STR (lid: (1) mounting element, (2) thread bores,(3) groove for flexible heating cartridge, (4) thread bore for stirrer engine,body: (5) bore for heating cartridge, (6) sealing groove, (7) window).
60

5.1 Experimental setup
G
G, L
Liquid level
Figure 5.4: Control of liquid level in the STR.
filling and emptying the stirred tank body can be moved vertically by a jack. The
lid and the body are sealed by a Chemraz R© o-ring (Greene, Tweed & Co. GmbH,
Chemraz 9350-605). The STR has a volume of 1 L and can be operated at up to 40 bar
and 250 ◦C. The burst strength calculation for 40 bar and 250 ◦C revealed, that the
maximum equivalent stress in the lid (100 N mm−2) and the body (35 N mm−2) should
not exceed the yield stress of 130 N mm−2 at the maximum conditions. Additionally,
the reactor was successfully pressurized to 40 bar at 20 ◦C and 30 bar at 175 ◦C, which
proves the mechanical strength at typical operating conditions.
Figure 5.4 shows the principle of controlling the liquid level in the STR as described
in Claeys (1997). The device consists of a frit (10 µm) with a 1/8 in tube connection
and U-shaped 1/8 in tubing. Due to the continuous operation mode gas flows through
the setup entering the U-shaped tubing in the head space of the STR towards the outlet
of the setup. The liquid produced during the reaction percolates through the frit. The
gas phase sweeps the liquid along to the wax and water separators. This procedure
avoids pressure gradients over the frit that would lead to the formation of a filter cake
and blocking of pores. Thus the principle is comparable to cross flow filtration, which
will be the filtration process of choice for FTS in SBC.
61

5 Experimental setup and procedure
The setup can be fed with CO (0.1 – 5 LSTP h−1), H2 (0.2 – 10 LSTP h−1) and an
internal standard (e. g. CO2, Ar, 0.02 – 1 LSTP h−1 for Ar) using mass flow controllers
(Bronkhorst El-Flow F-230M). The feed can be disconnected by air driven valves. Dur-
ing operation in fixed-bed mode gas and liquid can be recycled independently by a
compressor and a pump, respectively. A gear pump (Gather Industrie) transports the
liquid phase from the STR and pumps it towards the tubular reactor (approx. 5 –
100 kg h−1). The mass flow rate is measured by a coriolis mass flow meter (Endress
+ Hauser, Promass 83F DN 8). The pump is controlled by a frequency converter. In
the high pressure section of the pump a pressure transmitter (BD Sensors, DMP331P)
is installed, to detect pressure increases caused by blocking. The gas is recycled by a
compressor (Haskel, HUAGD-4, 0.05 – 1.5 kg h−1). In the low pressure section of the
compressor an additional gas reservoir (300 mL) and a needle valve is installed. The
needle valve reduces the gas flow that can be taken in from the compressor and decreases
the pumping frequency. Combined with the reservoir the pressure changes in the stirred
tank are reduced. This gas reservoir is cooled to ≈ 0 to 5 ◦C to condense liquid which
will be present in the gas phase. The compressor is suspended on springs to reduce
vibrations (Thema Federn GmbH). At the outlet of the compressor a gas reservoir (1 L)
and a pressure regulator (Tescom, 44-2200) are installed to smooth the pressure for
the mass flow controller. The mass flow controller for the gas recycle is a combina-
tion of a coriolis mass flow meter (Bronkhorst, Cori-Flow, 0.15–1.5 kg h−1) and a air
driven regulator valve (Badger Meter, RCV RC200). Due to the higher pressure in the
high pressure section liquid may condense. Therefore the reservoir at the high pressure
section is connected directly to the STR, which allows for transport of the condensed
liquid directly back to the STR. Downstream the reactor, the setup was equipped with
a wax (500 ml) and a water (300 ml) separator operated at 150 ◦C and 0 ◦C to take wax
and water samples, respectively. The tubing between reactor and water separator was
heated at 150 ◦C. The operation pressure was maintained by a backpressure regulator
(Tescom, 44-1700). The total volume of the plant amounts to approx. 4.25 L in fixed
bed mode.
Overflow valves with an opening pressure of 32.5 bar were installed in the gas feed
line and at the STR. In addition the supply pressure of all gases is limited to 30 bar to
prevent over pressure. To prevent the formation of an explosive gas mixture the setup
is mounted in a vented framework which is equipped with CO and H2 gas detectors.
The control software allows the definition of alarm limits for pressure and temperature.
62

5.2 Analytical setup and procedure
The gas detectors are also connected to the software. If the alarm is released, the power
supply to the plant is disconnected and the setup is flushed with N2.
The setup is computer controlled (Eurotherm Suite Graphics version 3.6.2). The
control cabinet and software application was provided by Pro Control BV.
5.2 Analytical setup and procedure
5.2.1 Gas phase analysis
A HP 5890 GC was used to take on-line gas samples after passing the water separator.
The GC is equipped with a TCD and a FID in series, a 250 µL sample loop and a HP-
PLOT/Q column (Agilent, 30 m × 0.533 mm × 40 µm) to analyze CO, H2, CO2 and
CH4. The temperature program starts with 40 ◦C for 5.5 min followed by a temperature
ramp of 20 K min−1 up to 200 ◦C which is maintained for 46.5 min. The split ratio is
12. The adjusted gas flow rates in the GC and supply pressures are given in Table 5.1.
Table 5.1: Gas flow rates and supply pressures for the gas phase GC.
Gas flow rate supply pressureml min−1 kPa
Sample – 2 – 4 2000Column He 1.37 23.5FID AUX He 30.1 380FID H2 32.1 120FID Air 422 290WLD AUX He 5.63 380WLD Reference He 16.2 380
Calibration measurements were carried out twice in April 2007 and January 2008 for
CO, CH4 and the internal standard CO2. The molar fraction of each gas species is
varied and the dependence of the molar fraction on the peak area is fitted with a linear
function intersecting the coordinate origin (Equation 5.1). The number of data points,
the range of molar fraction yi, the slope of the linear function mi and the coefficient of
determination R2 is given in Table 5.2. The presented data shows, that the calibration
63

5 Experimental setup and procedure
is reproducible over the mentioned time span.
xn,i = miAi,peak (5.1)
For collecting and analyzing the GC data as well as for controlling the GC a LabView
program was developed. This program allows to start sample analysis in a given time
interval and to record the detector signal of the TCD and FID with a frequency of
20 Hz automatically. The collected raw data is processed to obtain the peak areas of
the analyzed components. Both the raw and the processed data are archived. A typical
chromatogram of FID and TCD data is given in the Appendix A.2 Figure A.1.
Under the assumption that no carbon dioxide is formed during the reaction it can
be used as internal standard. Ar is not appropriate for use as internal standard with a
HP-PLOT/Q column, since the separation of Ar and CO is not possible. CO conversion
XCO and methane selectivity SCH4can be calculated with Equations 5.2 and 5.3. Here
R is the peak area ratio of species CO or CH4 and the internal standard, and mi the
slope of the calibration curve.
XCO =Rin,CO −RCO
Rin,CO
(5.2)
SCH4=mCH4
mCO
Rin,CH4
Rin,CO −RCO
(5.3)
Since the reactants are well mixed in stirred tank and fixed bed mode, the observed
reaction rate robs,CO can be determined from the conversion XCO, the modified resi-
dence time τmod and the H2/CO feed ratio Rfeed,H2/CO (Equation 5.5). The modified
residence time τmod is defined by the ratio of catalyst mass to synthesis gas feed rate at
standard conditions Equation 5.4. The simplified first order reaction rate constant kobs
Table 5.2: Calibration of the gas phase GC.
Gas data points xn,i mi R2
– – V−1 min−1 –
CO 26 0.16, 0.22, 0.36 7.32 0.9957CO2 14 0.024, 0.041, 0.054, 0.078 6.05 0.9993CH4 10 0.099 10.13 0.9899
64

5.2 Analytical setup and procedure
can be calculated from the observed reaction rate, the catalyst density ρcat and the CO
concentration in the liquid phase (Equation 5.6). The activation energy can be derived
from the rate constants at different temperatures (Equation 5.7).
τmod =mcat
VSG,in,STP(5.4)
robs,CO =XCO
τmod
pSTP(1 +Rfeed,H2/CO)RTSTP
(5.5)
kobs =robs,CO ρcatcL,CO
(5.6)
EA =R
1T2− 1
T1
ln
(k1
k2
)(5.7)
5.2.2 Wax phase analysis
The wax phase is analyzed with a HP 5890 Series II Plus GC, equipped with an au-
tosampler, a FID and a DB-2887 column (Agilent, 10 m × 0.530 mm × 3 µm). The
injection volume is 2 µL. The GC is supplied by H2 (29.3 mL min−1, 133 kPa) and air
(349 mL min−1, 250 kPa) for the FID and He as carrier gas (1.71 mL min−1, 220 kPa)
and FID dilution (AUX) gas (10.9 mL min−1, 220 kPa). The split ratio is 20. The tem-
perature program starts at 30 ◦C with a heating rate of 20 K min−1 up to 350 ◦C. The
total temperature program takes 120 min. The data is collected and processed with
the GC ChemStation software (Agilent, Rev.B.03.01). The heavy waxy products de-
rived from the wax separator still contain squalane and are present in solid state. For
analysis, the heavy products are diluted in cyclohexane (≈ 14 wt % wax) and heated to
≈ 70 ◦C in a homemade Aluminum jacket for the autosampler, to keep it in liquid state
for injection.
The analysis of the wax phase allows the calculation of the chain growth probability
α. It is stated in ASTM (2002) that the relative mass specific response factor of each n-
paraffin must not deviate from unity by more than ± 10 %. On this basis a chain growth
probability α (Equation 5.8) can be calculated from the peak areas A of species with i
and j carbon atoms in the chain. If data over a range of hydrocarbon species is available,
65

5 Experimental setup and procedure
α can be calculated from the slope of the curve in the ASF-plot (see Equation 2.7).
αi−j =Ai j
Aj i(5.8)
5.3 Experimental conditions and procedure
Prior to catalytic measurements the feed gas mass flow controllers were calibrated by
the manufacturer at 40 bar and 20 ◦C. The calibration was checked at 30 bar and 20 ◦C
with N2 for the H2 and CO and with Ar for the Ar controller. The deviation of the
set point in the control software and the measured value was quantified for usage as
correction factor.
Catalytic measurements were carried out to compare reaction rate and methane selec-
tivity obtained with monolithic and powder catalysts during FTS. The powder catalyst
was crushed and sieved to the desired fraction. The monolithic catalyst was investigated
both as fixed and suspended catalyst bed. In the latter case the monolithic catalyst was
crushed to allow the use in the STR. In order to avoid separation of the washcoat layer
and the inert cordierite carrier, the crushed material was not sieved but completely used
for the catalytic measurements. For the monolithic catalyst in fixed bed operation mode
the mass of active catalyst material was limited to ≈ 10 g because of the dimensions of
the reactor. In the STR ≈ 14.5 g of active catalyst material (powder or washcoat) were
used. In case of the crushed monolith the total solid fraction consists of inert carrier
material and active catalyst. This leads to a mass fraction of about 18.6 wt% solids
in the suspension compared to about 4.1 wt% in the case of powder catalyst where no
inert solid was present.
The reduction of the catalyst was performed with 10 % H2 in N2 at 350 ◦C for ≈ 36 h
after heating in N2 with 1 K min−1. The monolithic catalyst was reduced in situ and the
powder catalyst in an external oven. The hydrogen flow rate was set to 48 mlSTP min−1
corresponding to ≈ 4.62 mol of H2, which exceeds the stoichiometric required H2 amount
for the reduction of 15 g catalyst by a factor of ≈ 70. After reduction the powder cat-
alyst was cooled down in N2 to room temperature, covered with squalane (C30H62,
CAS no.: 111-01-3) under N2 flow to prevent reoxidation and directly transferred to the
STR which is filled to ≈ 450 mL. Squalane was chosen as starting solvent as it is a
good solvent for FT products and inert in FTS (Claeys, 1997). Subsequently, the setup
66

5.3 Experimental conditions and procedure
was immediately purged with N2 to remove O2 to prevent catalyst reoxidation. After-
wards the setup was pressurized and purged continuously with the desired synthesis gas
mixture at room temperature, until the feed gas composition was reached in the setup.
The stabilization of the gas mixture in the setup was examined and quantified by the
GC. A stable composition was assumed to be achieved, if ten gas phase samples differed
in less then 1 % standard deviation. The measured feed gas composition was used in
the calculation of conversion and selectivity. Subsequently, the catalyst was activated
under synthesis gas flow for 24 h at 160 ◦C and 170 ◦C within the experimental setup.
During the activation procedure gas and liquid phase were recycled in the monolith
experiment. The mild reduction conditions with only 10 % H2 and the long activation
phase at relatively low temperatures was chosen to prevent catalyst damage.
The start-up procedure for operation in stirred tank and fixed-bed mode are different.
In case of the STR operation mode the start-up procedure is presented in the discussion
of the activation procedure. In the case of the fixed-bed mode of operation the STR was
also filled initially with squalane. The liquid level in the STR decreased after the pump
was started, due to filling of the tubing of the liquid recycle. To maintain the liquid level
an additional reservoir was also filled with ≈ 1 L of squalane. After filling the setup with
catalyst and liquid the setup was purged with N2 carefully, to eliminate O2 which could
be hazardous under reduction conditions. For this purpose the gas compressor recycles
the gas phase from the STR via the shortcut from the gas reservoir at the high pressure
section back to the STR. This method allows the purge of the complete gas recycle and
is also applied to the subsequent purge with feed gas mixture. The reduction procedure
was carried out as described followed by pressurizing and purging continuously with
feed gas mixture. After achieving a stable gas composition the setup was started up in
fixed-bed mode. First the compressor was started and the gas recycle was pressurized.
Due to higher pressure in the gas recycle the pressure in the setup decreases during
this time. After achieving the operating pressure again, the desired gas recycle flow
rate is set followed by the start of the liquid recycle pump. The liquid temperature was
previously set to at least 150 ◦C to reduce the liquid viscosity. After starting the pump
the liquid recycle was unstable. This can be caused by various reasons. Firstly, in the
beginning gas and liquid phase will be present in the tubing disturbing both, the pump
and the mass flow controller. Secondly, the liquid level in the STR decreases, which
causes the transport of gas into the liquid recycle. Additionally, the temperature of the
liquid decreases, due to the lower temperature of the steel tubing, which will increase the
67

5 Experimental setup and procedure
viscosity. These reasons hinder the operation of the pump. To simplify the start-up of
the pump a valve can be opened in the high pressure section of the pump. The pressure
difference between the STR and the ambience will force liquid through the pump, which
induces a continuous liquid flow and greases the pump. Simultaneously, liquid is added
to the STR from the liquid reservoir to maintain the liquid level in the stirred tank.
The amount of additional liquid should be slightly higher than required for achieving
the desired liquid level inside the STR, since the liquid level is controlled as described
before. If the STR contains too much liquid it will be removed and transported to the
wax separator by the continuous gas flow. Consequently, liquid will be present in the
wax separator which can be controlled by taking samples. Due to the small diameter of
the tubing between STR and wax separator of 1/8 in it may take a few hours to remove
the excess of liquid from the STR. It is recommend that the cooling aggregates and the
heat tracing are activated as soon as possible.
To shut down the setup, the heating of the tubular reactor, the pump and compressor
(in this order) were shut off and the temperature in the STR is set to 70 ◦C. At this
temperature the products remain in liquid state and it is possible to clean the stirred
tank without the risk of burning. After achieving a lower temperature the setup is
depressurized and afterwards purged with N2 to remove the hazardous CO and H2.
Subsequently, the STR is opened and cleaned under temperature. Finally, the wax and
water separator and the tubular reactor are emptied. The internals of the STR are
cleaned and the heating system is shut off.
In general the experiments were carried out at temperatures of 190 and 200 ◦C at
a modified residence time of 12 000 kgcat s m−3SG,STP and a H2/CO ratio of 2. In both
operation modes the STR was equipped with a stirrer. In the stirred tank mode a gas
injection stirrer was used to disperse the gas phase into the suspension, while in fixed-
bed mode a blade stirrer was used to increase the heat transfer to the reactor wall. The
flow rates of gas and liquid inside the monolithic honeycomb channels were adjusted to
achieve the advantageous slug flow regime. Bauer (2007) investigated the flow regimes in
mini-channels for different gas-liquid systems at 20 ◦C and 20 bar. It is stated that slug
flow was achieved for gas and liquid superficial velocities smaller than 0.1 m s−1 for the
squalane-nitrogen system. The maximum gas and liquid superficial velocities increase
to 1 m s−1 for the lower viscous water-nitrogen system. Since the viscosity of squalane
decreases with increasing temperature, the maximum gas and liquid superficial velocities
for achieving slug flow are between 0.1 and 1 m s−1. To assure the slug flow regime inside
68

5.3 Experimental conditions and procedure
the monolith channels and to prevent catalyst abrasion the gas and liquid superficial
velocity was adjusted to ≈ 0.05 m s−1. The required mass flow rates are estimated from
the density of the gas and liquid phase. The liquid phase was assumed to consist of
squalane, whose density was extrapolated according to data from Fandino et al. (2005).
The measured mass flow rate for the gas phase was converted to a volumetric flow rate,
assuming a molar mass of 10 g mol−1, which approximately corresponds to the feed gas
mixture. At the top and the bottom of the monolithic bed an inert bed of glass beads
with a length of 2.5 cm and a particle diameter of 1.25 – 1.55 mm was used to ensure
an even gas-liquid flow distribution over the cross section.
Regularly, (approx. every two days) wax and water samples were taken. The samples
were weighed and the composition of the wax samples was analyzed. As no fresh
squalane was fed to the setup during the experiment the initially added squalane is
substituted by liquid products over time. Thus, the sample composition represents an
integral composition over the total experimental time up to the sampling time. Since
the sampling is coupled with a pressure loss in the setup of ≈ 0.5 bar the experiment
is slightly disturbed. To minimize the disturbance the sampling frequency was kept es
low as possible.
During the experiments gas samples were analyzed online every 2 h. This allows the
monitoring of CO conversion and CH4 selectivity over time on stream. It was assumed
that steady state had been reached, when the standard deviation of conversion and
selectivity of the last ten samples is below 1.0 %. Steady state condition in the gas
phase during the measurements was achieved after approx. 125 – 150 h.
The mass balance was carried out by weighing the liquid in the setup before and after
the campaign as well as the wax and water samples. The total amount of feed gas was
calculated from the mass flow controller data. The volumetric flow of the exhaust gas
was calculated by Equation 5.9 under the assumption, that the molar flow rate of CO2
as internal standard between inlet and outlet is constant.
Vout = VinAin,CO2
Aout,CO2
(5.9)
The composition of the exhaust gas was estimated from the feed gas composition for
each campaign using the mean CO conversion and CH4 selectivity. The exhaust gas
was assumed to consist of CO, CO2, H2 and CH4.
69
6 Results and Discussion
6.1 Introduction
In this chapter the experimental results obtained with powder and monolithic honey-
comb catalysts will be discussed. In total 7 experimental campaigns were conducted
between April 2007 and January 2008 with approx. 3170 h on stream. The experiments
were carried out with two different catalyst batches. Table 6.1 summarizes the exper-
imental campaigns. Within the campaigns different experiments were carried out by
varying operation conditions.
This chapter provides the results and discussion of the conducted experiments. The
first two sections deal with the experimental setup in particular. First of all, the sam-
pling system and the effect of the sampling procedure on the sample composition will be
discussed. Subsequently, the evolution of the loop-reactor setup in fixed-bed operation
mode will be presented. The following sections present the results of the compar-
ing measurements for powder and monolithic honeycomb catalysts with respect to the
achieved reaction rate and methane selectivity. Finally, the influence of internal and
external mass transfer on reactor performance in the slurry stirred tank reactor (STR)
is discussed.
6.2 Results and discussion
6.2.1 Product segregation in the sampling system
The experimental setup consists of a wax and a water separator operated at 150 and
≈ 5 ◦C, respectively. Due to the different temperatures between the STR and the
separators the original product mixture will be segregated. Heavy products will be
enriched in the reactor and the wax separator, while light products will be enriched
in the water separator and the exhaust gas. This segregation allows no conclusion
70

6.2 Results and discussion
Table 6.1: Overview of conducted experiments (* Modified residence time inkgcat s m−3
SG,STP).
Campaign I II III IVCatalyst type monolith powder monolith powderCatalyst batch 1 1 1 1Total time on stream h 573 399 331 684
H2/CO feed ratio – 2 2 2 2Modified residence time * 4000 12000 3250 12000Catalyst mass g 4.04 14.2 3.75 13.3Solid mass g 19.25 14.2 20.11 13.3Particle size/catalyst thickness µm 120 50–140 120 500–1000Characteristic diffusion length µm 120 16 120 16Diameter of tubular reactor mm 12 12
Flow rate H2 LSTP h−1 2.42 2.84 2.77 2.65Flow rate CO LSTP h−1 1.21 1.42 1.38 1.33Flow rate CO2 LSTP h−1 0.47 0.19 0.19 0.19
Deviation in mass balance % – 7.3 7.2 1.0Deviation in mass balance g – 142 192 18
Campaign V VI VIICatalyst type crushed powder monolith
monolithCatalyst batch 2 2 2Total time on stream h 384 312 485
H2/CO feed ratio – 2 2 2Modified residence time * 12000 12000 12000Catalyst mass g 14.6 14.3 10.1Solid mass g 66.7 14.3 50.8Particle size/catalyst thickness µm < 120 50–140 120Characteristic diffusion length µm 50 16 120Diameter of tubular reactor mm 18
Flow rate H2 LSTP h−1 2.91 2.86 2.13Flow rate CO LSTP h−1 1.46 1.43 1.01Flow rate CO2 LSTP h−1 0.19 0.19 0.19
Deviation in mass balance % 0.22 0.25 6.2Deviation in mass balance g 4.5 4.0 135
71

6 Results and Discussion
wax separator
water separator
feed
gas sample
wax sampling
water sampling
water sample
wax sample
reactor
200 °C
21 bar150 °C
21 bar
5 °C
21 bar
100 °C
1 bar
10 °C
1 bar
Figure 6.1: Scheme of the sampling system.
from the measured gas or wax phase analysis on the total product composition without
further investigation. For this purpose the described phenomenon is modeled in Aspen
Custom Modeler R© using the Aspen Properties R© physical properties database and the
Redlich-Kwong-Soave equation of state with Kabadi-Danner modification according to
de Deugd (2004). The equilibrium composition in the three phase gas-liquid-water
system was calculated using the physical property submodel “Props flash3” assuming
equilibrium. The product mixture was assumed to consist of CO, H2, H2O, squalane
and paraffins with a chain length of up to 30 carbon atoms. Olefins are neglected, since
physical properties such as the vapor pressure are similar to paraffins. The aim of this
model is to describe the segregation behavior in the present experimental setup and
to provide a method to utilize the wax phase data for determining the chain growth
probability.
Figure 6.1 illustrates the sampling setup including the operation conditions. The
operating conditions of the phase separators and the sampling procedure are chosen
according to the experimental setup and procedure. In the reactor the product distri-
bution is calculated with a typical chain growth probability of α = 0.777 for the used
catalyst according to results of campaign VI, which will be presented later. The product
mixture is transported to the wax separator where a gas-water-liquid three phase sys-
tem develops. The liquid hydrocarbon and water phase were taken as samples. During
sampling the temperature decreases and also the pressure decreases to ambient pressure
in the sample. This results in partial evaporation of water and hydrocarbons. The gas
phase in the wax separator is transported to the water separator. Since the temperature
72

6.2 Results and discussion
0 1 0 2 0 3 0- 6
- 4
- 2
0
logari
thmic m
olar fr
actio
n [-]
c h a i n l e n g t h [ - ]
o r i g i n a l d i s t r i b u t i o n g a s s a m p l e w a t e r s a m p l e w a x s a m p l e
(a) Simulation results
0 9 1 8 2 7- 3
- 2
3
4
5
logari
thmic s
pecifi
c pea
k area
c h a i n l e n g t h [ - ]
g a s s a m p l e w a x s a m p l e � = 0 . 7 7 7
(b) Experimental results (campaign VI,200 ◦C, crushed monolithic catalyst)
Figure 6.2: Product segregation in the sampling system for α = 0.777.
is smaller in the water separator water and lighter hydrocarbons will condense and a
gas-water-liquid three phase system will also develop. The sampling procedure of the
liquid hydrocarbon and water phase causes a decrease in pressure and an increase in
temperature, which leads to partial evaporation of the sample. The gas phase in the
water separator is directly transported to the GC and analyzed. The presented model
assumes equilibrium. This assumption is realistic for the phase separators, since the
residence time is high. However, during sampling equilibrium may not be achieved and
differences between experimental and calculated data will occur.
Figure 6.2a displays the simulation results of the product segregation. It is obvious,
that significant segregation of the products in the samples occur, which results in devi-
ations from the original product distribution. The segregation is caused by decreasing
vapor pressures with increasing chain lengths of the hydrocarbons. This leads to an
enrichment of light hydrocarbons in the vapor phase and heavy hydrocarbons in the
liquid phase depending on the temperatures in the wax and water separator. The liquid
phase of the wax separator mainly consists of heavy hydrocarbons with a maximum for
the species C9 to C11. Lighter hydrocarbons are mainly present in the gas phase and
are transported to the water separator. For heavier hydrocarbons the product distribu-
tion converges with the original distribution, since the vapor pressure of these species
73

6 Results and Discussion
is too low at the given temperature. In the sample of the gas phase in the water sep-
arator heavy hydrocarbons are present in a proportionally low amount, leading to an
underestimation of the chain growth probability. The water sample contains medium
hydrocarbons in the range of C7. Lighter hydrocarbons are mainly present in the gas
phase, while heavier hydrocarbons are already separated in the wax separator.
Figure 6.2b presents measured product distributions for the gas and wax sample.
Comparing the simulation results with the measured product distributions, deviations
are observed for the gas phase composition. This could mainly be attributed to the
fact, that equilibrium is assumed in the model, whereas it may not be reached in the
experiment. The deviation for CH4 and C2 can be explained by the deviance of real and
ideal ASF distribution. However, comparing the simulated and measured wax phase
composition good agreement can be observed. Both results exhibit a maximum for C11
in the model and C13 in the wax sample, respectively. For increasing chain lengths
the distribution converges with the original distribution. The curves for the measured
product distributions in gas and wax phase are shifted in vertical direction, since dif-
ferent GC systems are applied using different peak area definitions, e. g. V ×min or
counts× s. However, the specific peak area of one species is proportional to its molar
fraction in the sample.
It can be concluded from the simulation results, that the presented model is able to
describe the segregation of the products and that the chain growth probability could
by determined from samples of the wax phase, while gas and water samples are not
significant. It is suggested to identify the chain growth probability with data for species
following the maximum in the distribution of the wax sample to achieve reasonable
values.
6.2.2 Evolution of the loop-reactor setup
The loop-reactor setup presented in chapter 5 is the result of revisions of two prelim-
inary experiments in fixed-bed operation mode. To support the comprehensibility of
the revisions discussed in this section, Figure 6.3 again displays the scheme of the ex-
perimental setup. The main challenge in operating the setup in fixed-bed mode is the
gas recycle. Since the phase separator operates at temperatures of 200 to 240 ◦C the
vapor pressure of the produced liquid hydrocarbons, water and Squalane causes that
the gas recycle contains liquid components in the range of ≈ 0.1 vol %. This will lead
74
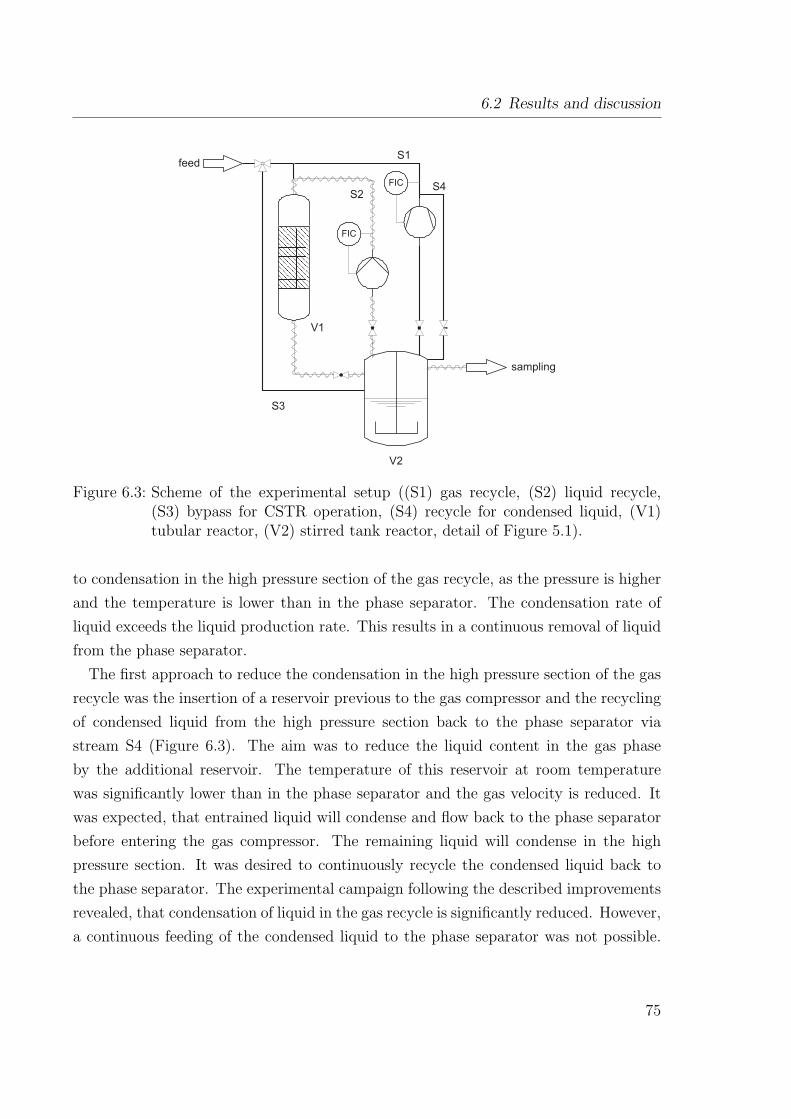
6.2 Results and discussion
feed
sampling
S3
V2
FIC
FIC
S1
S2
V1
S4
Figure 6.3: Scheme of the experimental setup ((S1) gas recycle, (S2) liquid recycle,(S3) bypass for CSTR operation, (S4) recycle for condensed liquid, (V1)tubular reactor, (V2) stirred tank reactor, detail of Figure 5.1).
to condensation in the high pressure section of the gas recycle, as the pressure is higher
and the temperature is lower than in the phase separator. The condensation rate of
liquid exceeds the liquid production rate. This results in a continuous removal of liquid
from the phase separator.
The first approach to reduce the condensation in the high pressure section of the gas
recycle was the insertion of a reservoir previous to the gas compressor and the recycling
of condensed liquid from the high pressure section back to the phase separator via
stream S4 (Figure 6.3). The aim was to reduce the liquid content in the gas phase
by the additional reservoir. The temperature of this reservoir at room temperature
was significantly lower than in the phase separator and the gas velocity is reduced. It
was expected, that entrained liquid will condense and flow back to the phase separator
before entering the gas compressor. The remaining liquid will condense in the high
pressure section. It was desired to continuously recycle the condensed liquid back to
the phase separator. The experimental campaign following the described improvements
revealed, that condensation of liquid in the gas recycle is significantly reduced. However,
a continuous feeding of the condensed liquid to the phase separator was not possible.
75
6 Results and Discussion
The main reason could be blocking of the needle valve in stream (S4) by waxy products.
The following second approach aims at improving the liquid condensation before the gas
compressor. For this purpose, the reservoir in the low pressure section was furnished
with cooling coils. Furthermore, the diameter of the tubing between the reservoir and
the phase separator was increased from 1/4 in to 1/2 in. This enhancement was expected
to reduce the liquid content in the gas recycle significantly, but it is still necessary to
discontinuously recycle condensed liquid. However, the improvement was successful, as
the time span between recycling condensed liquid could be increased from 1 to 4 days.
The discontinuous recycling of condensed liquid also affects the pressure in the setup.
The pressure in the phase separator and the high pressure section of the gas recycle will
equalize, which results in an increasing pressure in the phase separator and a decreasing
pressure in the gas recycle. The pressure increase in the phase separator will cause a
pressure release by the back pressure regulator, as the adjusted pressure is exceeded.
This will cause an undefined loss of material, which could cause the relatively high
deviation in the mass balance. After recycling the condensed liquid the pressure in
the high pressure section increases again and thus the pressure in the phase separator
and the whole system decreases, as the total gas volume was reduced by the pressure
release. To prevent this pressure drop the outlet of the setup can be closed, until the
original pressures are reached.
During recycling the condensed liquid it was furthermore observed, that instabilities
in the liquid recycle stream appear. Possible explanations could be the lower tempera-
ture and different composition of the condensed liquid. The lower temperature of this
liquid will reduce the temperature in the phase separator, which increases its viscosity.
Furthermore, the fraction of light hydrocarbons and water in the condensed liquid is
higher than in the liquid of the phase separator, as the waxy products are condensed
before entering the gas compressor. Recycling the light components will cause evaporat-
ing of these components. The liquid phase in the phase separator will be in a turbulent
gas-liquid flow and gas can enter the liquid recycle. This could cause instabilities in the
liquid recycle flow rate.
In Figure 6.4 the conversion and selectivity for the monolithic catalyst in fixed bed
mode (campaign VII) are displayed. Deviations in conversion and selectivity were found
and marked in this figure. These deviations are caused by the discontinuous recycling
of fresh liquid to the phase separator at the marked times. A possible explanation could
be, that the fresh liquid dilutes the produced wax and thus enhances mass transfer and
conversion for a short time period.
76

6.2 Results and discussion
0 1 0 0 2 0 0 3 0 0 4 0 00 . 0
0 . 1
0 . 2
0 . 3
0 . 4
0 . 5
0 . 6
0 . 7
conv
ersion
, sele
ctivity
[-]
t i m e o n s t r e a m [ h ]
c o n v e r s i o n C O s e l e c t i v i t y C H 4
I I I
a d d i t i o n o ff r e s h l i q u i d
Figure 6.4: CO conversion and CH4 selectivity over time on stream, campaign VII:monolithic catalyst in fixed-bed operation mode.
A further challenge is the adjustment of the temperatures in the setup to achieve the
desired temperature in the tubular reactor. The temperature of the liquid is directly
measured in the phase separator, before the liquid recycle mass flow controller and at the
inlet and outlet of the tubular reactor. The temperature for the liquid recycle mass flow
controller is limited to 200 ◦C. The mass flow controller and the liquid pump contribute
significantly to the heat losses in the liquid recycle, as both devices could not be isolated
completely. To achieve 200 ◦C at the reactor inlet and outlet, the liquid in the phase
separator has to be heated to 220 ◦C which results in a temperature of 209 ◦C directly
before the mass flow controller. This temperature exceeds the specified maximum. The
large liquid flow rate from the outlet of the tubular reactor has to be heated from 200 to
220 ◦C in the phase separator, which requires a shell temperature of the phase separator
of 252 ◦C. These big differences between minimum and maximum temperature of 52 K
could only slightly be influenced by improved insulation of the present setup. However,
it could be reasonable to implement an additional heat exchanger at the top of the
tubular reactor which is supplied by a heating circulator or by electrical heating. It
should be possible to heat the recycled liquid from 200 ◦C up to 220 ◦C depending on
the flow rate, which significantly will increase the reaction and hydrocarbon production
rate and buffers the heat losses in the liquid recycle.
77
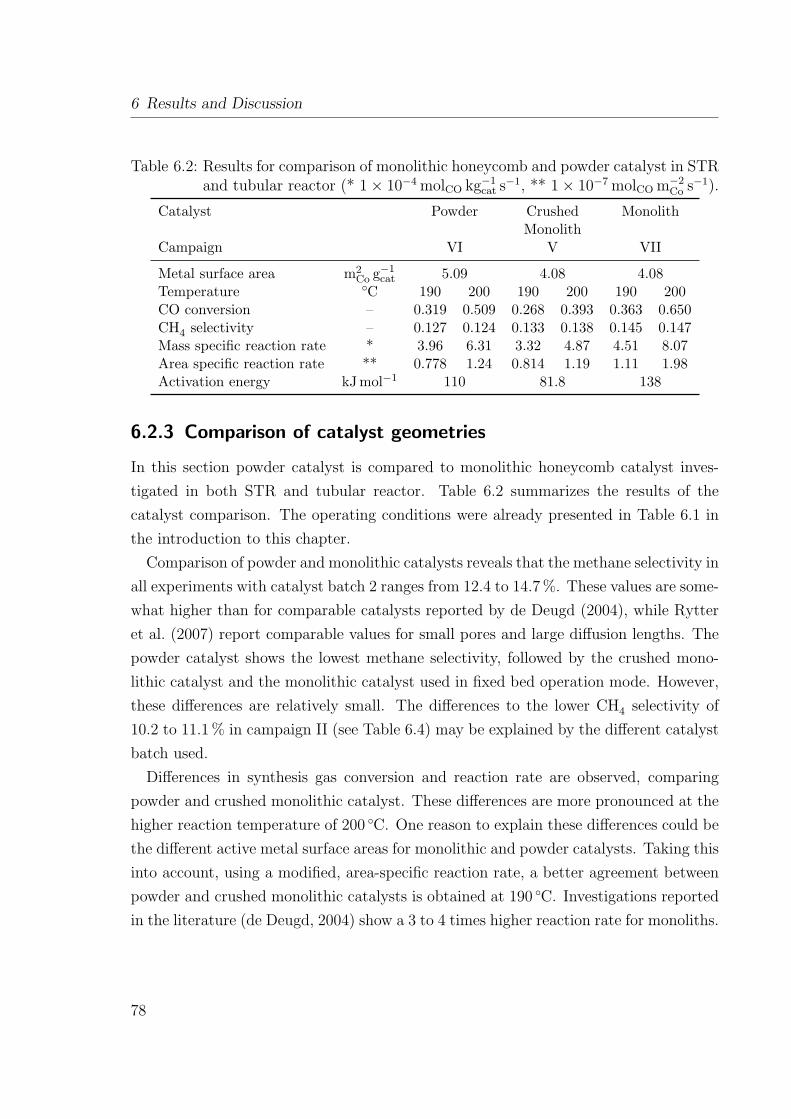
6 Results and Discussion
Table 6.2: Results for comparison of monolithic honeycomb and powder catalyst in STRand tubular reactor (* 1× 10⁻⁴ molCO kg−1
cat s−1, ** 1× 10⁻⁷ molCO m−2Co s−1).
Catalyst Powder Crushed MonolithMonolith
Campaign VI V VII
Metal surface area m2Co g−1
cat 5.09 4.08 4.08Temperature ◦C 190 200 190 200 190 200CO conversion – 0.319 0.509 0.268 0.393 0.363 0.650CH4 selectivity – 0.127 0.124 0.133 0.138 0.145 0.147Mass specific reaction rate * 3.96 6.31 3.32 4.87 4.51 8.07Area specific reaction rate ** 0.778 1.24 0.814 1.19 1.11 1.98Activation energy kJ mol−1 110 81.8 138
6.2.3 Comparison of catalyst geometries
In this section powder catalyst is compared to monolithic honeycomb catalyst inves-
tigated in both STR and tubular reactor. Table 6.2 summarizes the results of the
catalyst comparison. The operating conditions were already presented in Table 6.1 in
the introduction to this chapter.
Comparison of powder and monolithic catalysts reveals that the methane selectivity in
all experiments with catalyst batch 2 ranges from 12.4 to 14.7 %. These values are some-
what higher than for comparable catalysts reported by de Deugd (2004), while Rytter
et al. (2007) report comparable values for small pores and large diffusion lengths. The
powder catalyst shows the lowest methane selectivity, followed by the crushed mono-
lithic catalyst and the monolithic catalyst used in fixed bed operation mode. However,
these differences are relatively small. The differences to the lower CH4 selectivity of
10.2 to 11.1 % in campaign II (see Table 6.4) may be explained by the different catalyst
batch used.
Differences in synthesis gas conversion and reaction rate are observed, comparing
powder and crushed monolithic catalyst. These differences are more pronounced at the
higher reaction temperature of 200 ◦C. One reason to explain these differences could be
the different active metal surface areas for monolithic and powder catalysts. Taking this
into account, using a modified, area-specific reaction rate, a better agreement between
powder and crushed monolithic catalysts is obtained at 190 ◦C. Investigations reported
in the literature (de Deugd, 2004) show a 3 to 4 times higher reaction rate for monoliths.
78

6.2 Results and discussion
However, these results were obtained in absence of a liquid phase and are thus not
directly comparable, as discussed by Hilmen et al. (2005).
The higher reaction rate of the monolithic catalyst in fixed bed operation mode
compared to the crushed monolithic catalyst could be caused by external mass transfer
resistances in the STR. To test this hypothesis the mass transfer coefficients in the STR
and the MR have been estimated. Based on literature correlations (Pangarkar et al.,
2002; Kreutzer, 2003) the overall mass transfer coefficient kaov for STR (Equation 6.1)
and MR (Equation 6.5) under reaction conditions was estimated. For kaGL,STR a typical
value was taken from measured data reported in the literature for a representative
hydrocarbon mixture (Soriano, 2005). The density, viscosity and surface tension of the
liquid phase as well as the Henry coefficient for CO were calculated with literature
correlations for Sasol wax (Soriano, 2005).
1
kaov,STR=
1
kaGL,STR+
1
kaLS,STR(6.1)
kaLS,STR =6Dxcatd2P
(2 + 0.3Re0.75
ε Sc0.33)
(6.2)
Reε =
(ε d4
P ρ3L
η3L
) 13
(6.3)
kaGL,STR = 0.1 s−1 (6.4)
kaov,MR = kaGLS,MR + kaGS,MR =4D
δf dch(6.5)
δf = dch0.66Ca
23
1 + 3.33Ca23
Ca =ηL uTPσL
(6.6)
The influence of the internal and external mass transfer on the observed reaction rate
can be analyzed using the time constants for mass transfer ka−1ov , the observed reaction
rate k−1obs and the intrinsic reaction rate k−1
int inside the catalyst, as well as the catalyst
effectiveness factor η (Equation 6.7, Losey et al. (2001)). From the measured conver-
sion and inlet molar flow rate of CO the observed reaction rate can be obtained. The
79

6 Results and Discussion
simplified first order reaction rate constant kobs can be calculated from the observed re-
action rate, the catalyst density and the CO concentration in the liquid phase assuming
equilibrium. The gas phase was assumed to be ideally mixed and to consist of CO, H2
and H2O only. The effect of internal mass transfer can be estimated using the Thiele
modulus φ (Equation 6.8).
1
kobs=
1
kaov+
1
η kint(6.7)
η =tanh φ
φ(6.8)
φ = δchar
√k
Deff
(6.9)
These simple calculations show that mass transfer resistances obviously influence the
observed reaction rate (Table 6.3). Comparison between crushed monolithic catalyst in
STR and monolithic catalyst in fixed-bed reactor with the same active metal surface
area show a higher influence of mass transfer on the observed reaction rate in the STR.
At comparable intrinsic reaction rates the observed reaction rate in MR is significantly
higher. These differences are more pronounced at the higher reaction temperature of
200 ◦C. The time constants for powder catalyst in the STR are summarized in Table 6.3
as well. These results also show a higher influence of mass transfer resistances on the
observed reaction rate compared to the monolithic catalyst in FBR. Furthermore, very
similar intrinsic reaction rates as calculated for the monolithic catalysts are obtained.
The results in Table 6.3 also show, that the powder catalyst in the STR is not
influenced, while the monolithic catalyst in FBR mode is slightly affected by internal
mass transfer. However, these estimations are rough and based on several assumptions
and are thus only suitable for qualitative analysis. Especially, the analysis of the data
for the crushed monolithic catalyst is challenging, as the particle size distribution is
difficult to describe and the large particles could sediment at the bottom of the STR.
The influence of mass transfer resistances on the observed reaction rate can also
be seen from the apparent activation energies, which were calculated from the first
order reaction rate constants kobs. The results range from 81.8 kJ mol−1 for the crushed
monolithic catalyst, over 110 kJ mol−1 for the powder catalyst to 138 kJ mol−1 for the
monolithic catalyst. The influence of internal and external mass transfer resistances for
80
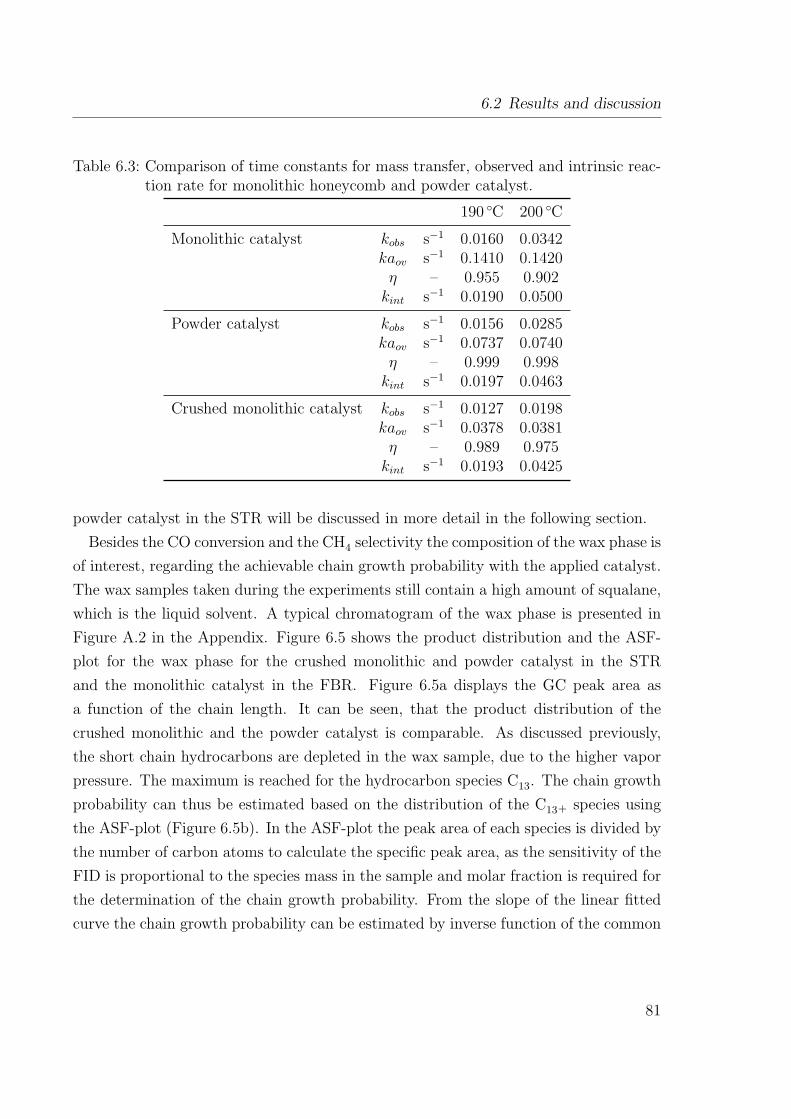
6.2 Results and discussion
Table 6.3: Comparison of time constants for mass transfer, observed and intrinsic reac-tion rate for monolithic honeycomb and powder catalyst.
190 ◦C 200 ◦C
Monolithic catalyst kobs s−1 0.0160 0.0342kaov s−1 0.1410 0.1420η – 0.955 0.902kint s−1 0.0190 0.0500
Powder catalyst kobs s−1 0.0156 0.0285kaov s−1 0.0737 0.0740η – 0.999 0.998kint s−1 0.0197 0.0463
Crushed monolithic catalyst kobs s−1 0.0127 0.0198kaov s−1 0.0378 0.0381η – 0.989 0.975kint s−1 0.0193 0.0425
powder catalyst in the STR will be discussed in more detail in the following section.
Besides the CO conversion and the CH4 selectivity the composition of the wax phase is
of interest, regarding the achievable chain growth probability with the applied catalyst.
The wax samples taken during the experiments still contain a high amount of squalane,
which is the liquid solvent. A typical chromatogram of the wax phase is presented in
Figure A.2 in the Appendix. Figure 6.5 shows the product distribution and the ASF-
plot for the wax phase for the crushed monolithic and powder catalyst in the STR
and the monolithic catalyst in the FBR. Figure 6.5a displays the GC peak area as
a function of the chain length. It can be seen, that the product distribution of the
crushed monolithic and the powder catalyst is comparable. As discussed previously,
the short chain hydrocarbons are depleted in the wax sample, due to the higher vapor
pressure. The maximum is reached for the hydrocarbon species C13. The chain growth
probability can thus be estimated based on the distribution of the C13+ species using
the ASF-plot (Figure 6.5b). In the ASF-plot the peak area of each species is divided by
the number of carbon atoms to calculate the specific peak area, as the sensitivity of the
FID is proportional to the species mass in the sample and molar fraction is required for
the determination of the chain growth probability. From the slope of the linear fitted
curve the chain growth probability can be estimated by inverse function of the common
81

6 Results and Discussion
1 0 1 5 2 0 2 50
1
2
3
4
5 c r u s h e d m o n o l i t h p o w d e r m o n o l i t h
pe
ak ar
ea [1
0-5 coun
ts s]
c h a i n l e n g t h [ - ](a) Product distribution
1 0 1 5 2 0 2 53
4
5 c r u s h e d m o n o l i t h p o w d e r m o n o l i t h
logari
thmic s
pecifi
c pea
k area
[log(c
ounts
s)]
c h a i n l e n g t h [ - ] (b) ASF plot (line: α = 0.791)
Figure 6.5: Product distribution in the wax phase and determination of the chain growthprobability.
logarithm. Since the product distribution of the crushed monolithic and powder catalyst
is comparable, the estimation of the chain growth probability is based on a mean value of
both samples each with two injection runs. The dependence of the specific peak area on
the chain length for crushed monolithic and powder catalyst is fitted with an accuracy of
more than 99 %, while the standard deviation between the four data sets is less than 2 %.
The estimated chain growth probability amounts to ≈ 0.791. In case of the monolithic
catalyst in the tubular reactor the analysis of the wax sample is more complicated.
The product distribution shows two maxima for C12 and C21, which was not expected.
Accordingly, the estimation of the chain growth probability is uncertain. A linear fit
in the ASF-plot for C13+ species is not possible. Explanations for the unusual product
distribution could be a higher content of the solute squalane on the one hand. On the
other hand an enhanced loss of lighter hydrocarbons can occur. During the recirculation
of the gas phase, light hydrocarbons condense in the gas recycle as described. The
condensed liquid was discontinuously transported back to the phase separator, where
it evaporates again. This causes a pressure increase in the setup and thus a loss of
gas due to pressure control. At this time, light hydrocarbons are enriched in the gas
phase and are consequently lost in the exhaust gas. The measurement of the CO
conversion is not affected by this circumstance, since the conversion is monitored every
82

6.2 Results and discussion
Table 6.4: Influence of stirrer speed on CO conversion and CH4 selectivity, campaign II.
Experiment III IV V VI
T ◦C 200 200 200 200p bar 21 21 21 21n min−1 1000 500 1500 1000
TOS h 254.5 312.75 350.75 398.75XCO – 0.560 0.515 0.538 0.542SCH4
– 0.102 0.111 0.109 0.109r 10−4 molCO kg−1
cat s−1 6.95 6.38 6.67 6.72
2 h over an adequate time period, while the evaporation of the light hydrocarbons occurs
in a relatively short time. In general conclusion, considering the uncertainty of the
estimation procedure, the chain growth probability achieved in the STR is comparable
for both investigated catalysts between 0.75 and 0.8.
6.2.4 Effect of internal and external mass transfer in STR
Campaign II was performed to study the influence of external mass transfer for powder
catalyst in the STR at 200 ◦C. For this purpose the stirrer speed was varied between
500 and 1500 min−1 at 200 ◦C for powder catalyst with a characteristic diffusion length
of 16 µ m. At this small diffusion length internal mass transfer resistances can be ne-
glected. Table 6.4 and Figure 6.6a display the relevant results. Decreasing the stirrer
speed from 1000 to 500 min−1 results in a decrease of conversion from 0.56 to 0.515
(experiments III and IV in campaign II). Further increase of the stirrer speed shows a
slightly increase in conversion. The conversion before changing the stirrer speed could
not be reached again. These results indicate external mass transfer limitations at a
stirrer speed below 1000 min−1. However, the influence of stirrer speed on conversion
and methane selectivity is relatively low.
In contrast to the experimental results simple estimations show a significant influence
of external mass transfer resistances on the observed reaction rate constant in campaign
II at 200 ◦C. With an overall mass transfer coefficient of kaov,STR = 0.0740 s−1 at
a specific power input of ε = 2 W kg−1 and a catalyst effectiveness factor of η = 1
(see Table 6.5) the intrinsic reaction rate constant amounts to kint,STR = 0.0602 s−1,
83
6 Results and Discussion
while the observed reaction rate constant kobs,STR = 0.0332 s−1 is significantly smaller.
This may be explained by the fact, that the enhancement in mass transfer rate by
increasing the specific power input is very limited. Figure 6.6b illustrates, that the
intrinsic reaction rate constant could not be reached even by significant increase in
specific power input. This corresponds well to the experience, that the achievable
relative velocity between the liquid phase and fine catalyst particles is limited, since
especially the small particles are entrained in the liquid flow. It can thus be concluded,
that the intrinsic kinetics cannot be directly measured with the STR used in the present
study. The influence of external mass transfer on the observed reaction rate constant
is also estimated for SBCs. This estimation is rough, since small and large bubbles
contribute to the external mass transfer differently. Furthermore, a correlation for mass
transfer between liquid phase and solid catalyst is not available. For the border cases
of small and large bubbles, the range of the observed reaction rate constant is shown in
Figure 6.6b. The ratio between intrinsic and observed reaction rate constant for small
bubbles in the SBC is comparable to the reactor efficiency discussed in Figure 3.5. The
results also show comparable observed reaction rate constants for STR and SBC, which
supports the STR as reasonable model system for the SBC.
Campaign IV was conducted to study the influence of internal mass transfer on
CO conversion and CH4 selectivity. Therefore catalyst with a particle size between
500 and 1000 µm was used which results in a mean characteristic diffusion length of
125 µm compared to 16 µm in campaign II. The characteristic diffusion length influences
the catalyst effectiveness factor as shown in Figure 6.7. However, after finishing the
campaign catalyst attrition was observed, which leads to smaller catalyst particles.
Table 6.5 compares the reaction rate and methane selectivity for different diffusion
lengths at 200 ◦C and 21 bar. The results show, that an increase in average catalyst
particle diameter from 95 to 750 µm leads to a significant decrease in reaction rate.
The catalyst with a particle size between 500 and 1000 µm achieves only 25.8 % of
the reaction rate of the smaller particle fraction. From the observed reaction rate
constant kobs,STR = 6.33× 10⁻³ s−1, the catalyst effectiveness factor η = 0.868 and the
overall mass transfer coefficient kaov,STR = 0.0278 s−1 for the large particles the intrinsic
reaction rate constant kint,STR = 9.45× 10⁻³ s−1 can be calculated. This estimation
reveals an approx. 6.4 times smaller intrinsic reaction rate constant for large particles,
which can only partly be explained by the catalyst effectiveness factor of 0.868. The big
differences between the theoretical and measured catalyst effectiveness factors may be
84

6.2 Results and discussion
5 0 0 1 0 0 0 1 5 0 00 . 0
0 . 1
0 . 5
0 . 6
conv
ersion
, sele
ctivity
[-]
s t i r r e r s p e e d [ m i n - 1 ]
c o n v e r s i o n s e l e c t i v i t y
(a) Influence of stirrer speed on CO conver-sion and CH4 selectivity
0 . 1 1 1 0 1 0 0 1 0 0 00 . 0 0
0 . 0 1
0 . 0 2
0 . 0 3
0 . 0 4
0 . 0 5
0 . 0 6
0 . 0 7
o b s e r v e d , S T R i n t r i n s i c
reactio
n rate
cons
tant [s
-1 ]
s p e c i f i c p o w e r i n p u t [ W k g - 1 ](b) Influence of specific power input on the
observed reaction rate constant (shaded:SBC)
Figure 6.6: Influence of external mass transfer resistances for powder catalyst in theSTR (campaign II, powder catalyst, 16 µm diffusion length, 200 ◦C).
1 0 1 0 0 1 0 0 00 . 0
0 . 2
0 . 4
0 . 6
0 . 8
1 . 0
�
catal
yst ef
fective
ness
factor
[-]
������������������������������� �
16
µm
125
µm
Figure 6.7: Catalyst effectiveness factor for different characteristic diffusion lengths(Deff = 2× 10⁻⁹ m2 s−1, k = 0.06 s−1 from campaign II, 200 ◦C).
85

6 Results and Discussion
Table 6.5: Influence of internal mass transfer resistances for powder catalyst in the STR.
Powder catalystCampaign II IV
T ◦C 200 200p bar 21 21n min−1 1000 1000dP µm 50 – 140 500 – 1000dP,mean µm 95 750δchar µm 16 125
XCO – 0.560 0.144SCH4
– 0.102 0.151r 10−4 molCO kg−1
cat s−1 6.95 1.79φ – 0.088 0.685η – 0.997 0.868
explained by sedimentation of the large particles at the bottom of the reactor, which are
less supplied with educts and thus constrict the observed reaction rate. In conclusion the
STR is not appropriate for investigation of internal mass transfer resistances with large
particle diameters. However, these rough estimations show that internal and external
mass transfer influence the observed reaction rate significantly. Due to the complex
multiphase system, the influences of each mass transfer aspect could not be quantified
exactly.
The methane selectivity increases with increasing diffusion length. This could be
explained by an increase in H2/CO-ratio inside the catalyst, due to the different diffusion
coefficients of H2 and CO. For a CoRe catalyst on narrow pore γ-Al2O3 Rytter et al.
(2007) reported an increase in CH4 selectivity from 10 to 16 % when increasing the
particle size from 46 to 638 µm.
Figure 6.8 shows the CO conversion and CH4 methane selectivity over time on stream
for campaign II. The results show an interesting behavior upon temperature changes.
Increasing the temperature from 180 ◦C to 190 ◦C and further to 200 ◦C results in a
strong increase in conversion. After passing a maximum the conversion decreases again.
The methane selectivity is on the other hand not affected by the temperature. With the
available results, it is not possible to explain this behavior at this stage of investigation.
During this work two different batches of catalyst were produced using the same
86

6.3 Conclusions
0 1 0 0 2 0 0 3 0 0 4 0 00 . 0
0 . 1
0 . 2
0 . 3
0 . 4
0 . 5
0 . 6
0 . 7
0 . 8
conv
ersion
, sele
ctivity
[-]
t i m e o n s t r e a m [ h ]
c o n v e r s i o n C O s e l e c t i v i t y C H 4
I I I I I I I V V V I
Figure 6.8: Conversion and selectivity over TOS (campaign II, powder catalyst, 16 µmdiffusion length).
preparation method. A comparison between campaign II and VI allows for the eval-
uation of the reproducibility of the preparation method. The comparison of the mass
specific reaction rates reveal, that the catalyst used in campaign VI achieves approx.
90 % of the reaction rate of the catalyst in campaign II. The CH4 selectivity in cam-
paign IV is slightly higher than in campaign II. Thus it can be concluded, that the
catalyst preparation method is reproducible.
6.3 Conclusions
Previous to experiments a model was developed to simulate the segregation of the in-
volved species in the reactor and wax and water separator and while sampling performed
at different temperatures and pressures. It was observed by simulation, that segrega-
tion of the hydrocarbon products occurs, which could be verified with experimental
data. It was possible to develop an adequate method for determining the chain growth
probability from wax phase analysis.
The aim of the experiments was the investigation and comparison of powder and
monolithic honeycomb catalysts in a MLR setup. Preliminary experiments revealed
challenges in operating the setup in fixed-bed mode. The gas recycle stream contains
87
6 Results and Discussion
evaporated liquid, which will condense in the high pressure section and consequently
cause instabilities in operation of the liquid recycle. In two steps the setup was improved
to minimize the amount of evaporated liquid in the gas recycle stream.
First experiments were conducted to investigate the influence of internal and external
mass transfer on the reaction rate and methane selectivity in the STR. It was observed,
that external mass transfer resistances constrain the reaction rate in the STR. Espe-
cially for small catalyst particles the relative velocity between particle and fluid phase
is small, since the particles are entrained in the liquid flow. This results in a large stag-
nant film thickness, which can hardly be decreased even at high specific power input. It
was also observed, that internal mass transfer resistances affect the apparent reaction
rate and the methane selectivity. The methane selectivity increases, while the observed
reaction rate decreases for increasing characteristic diffusion lengths. The increase in
methane selectivity corresponds well to literature (Rytter et al., 2007), whereas the
strong decrease in reaction rate could not be explained by internal mass transfer resis-
tances only. Most probably also sedimentation of the particles occurred, resulting in a
reduced accessible catalyst amount and thus a smaller observed reaction rate. In con-
clusion, the STR applied in this work is not viable for directly measuring the intrinsic
reaction kinetics.
During catalytic measurements with powder and crushed monolithic catalysts in the
STR, comparable methane selectivities and reaction rate constants could be observed.
Larger deviations at higher reaction temperatures are probably caused by pore diffusion
effects in a fraction of the crushed monolithic catalyst with higher diffusion length
and sedimentation of catalyst particles. Measurements with monolithic catalysts in
fixed bed operation mode show higher reaction rate and activation energy at similar
methane selectivities compared to powder catalyst. This reaction rate enhancement is
most probably caused by the advantageous external mass transfer characteristics of the
monolithic catalyst in the slug flow regime that was for the first time experimentally
realized. In conclusion, the results obtained with the monolithic catalyst reveal that
structured catalysts are a very promising alternative to suspended powder catalysts.
The discussed setup and experiments represent the first step in the research on MLRs
for FTS. It was shown, that investigations in monolithic honeycomb catalysts with re-
circulation of liquid and gas phase are possible in principle. However, the experiments
also reveal challenges for future investigations. The main challenge is the condensation
of liquid in the gas recycle, which causes an unsteady operation of the MLR. Although,
88
6.3 Conclusions
the measurement of CO conversion and CH4 selectivity is not affected, the product
composition is influenced by this fact. Furthermore, the temperature of the monolith
reactor can not be increased to more than 200 ◦C in the present setup, since the tem-
perature of the liquid recycle is limited. An increase in reaction temperature by means
of an additional heat exchanger at the top of the tubular reactor will lead to an in-
creased production rate of liquid products, which also supports the steady operation of
the setup.
89

7 Conclusions and future work
7.1 General conclusions
A simulation study was performed for comparing the established SBC and FBR with
the novel MLR and µR for low temperature FTS. The obtained results confirm the
current advantages of the SBC technology compared to FBRs. However, it was also
found, that the novel MLR and µR technology offer advantages against the SBC. The
achieved catalyst productivity is comparable, combined with the absence of required
separation of the catalyst from the product. The challenges of the low catalyst amount
in the µR and the large liquid recycle in the MLR are solvable. Especially the MLR
can be seen as a promising reactor technology in the near future, since the reactor
productivity is high and the liquid recycle is feasible in a large scale plant with the
current state of the art.
In order to perform catalytic measurements comparable monolithic honeycomb and
powder catalysts were prepared. To achieve a high degree of comparability the mono-
lithic catalyst was prepared by dip-coating of ready-made CoRe on γ-Al2O3 catalyst
onto a cordierite honeycomb carrier. The powder catalyst was made from the same
slurry for the dip-coating procedure. It was discovered, that both catalysts have a com-
parable pore structure. However, differences in the distribution of the active material
were observed. The preparation method was found to be reproducible, which could be
verified by catalytic measurements with different catalyst preparation batches. In con-
clusion, the achieved properties of the catalyst are similar and provide a good basis for
a detailed and systematic comparison of powder and monolithic honeycomb catalysts
for FTS.
For investigation of powder and monolithic honeycomb catalysts an experimental
setup was built according to the loop reactor concept. The continuously operated setup
consists of a tubular and a stirred tank reactor and is equipped with independent gas
and liquid recycle lines. Moreover, analytical systems were developed for analyzing the
gaseous and liquid components present in FTS. The analyzing method of the liquid
90

7.2 Future work
waxy products was supported by modeling and simulation of the product segregation
in the sampling systems. It was revealed, that product segregation occurs. However,
the sample of the wax phase taken from the wax separator allows reliable estimations
of the chain growth probability.
During catalytic measurements in the STR it was found, that internal and external
mass transfer affect the reaction rate and methane selectivity. The most important
result of these experiments is, that external mass transfer constrains the reaction rate
in the STR. This could be explained by the small relative velocity between catalyst
particles and surrounding liquid, since the catalyst particles are entrained in the liquid
flow. In conclusion, the STR applied in this work is not viable for directly measuring
of the intrinsic reaction kinetics.
Comparing experiments between monolithic catalyst in fixed bed operation mode and
powder catalyst in the STR show a higher reaction rate at comparable methane selec-
tivity for the monolithic catalyst. This enhancement in reaction rate is most probably
caused by the advantageous external mass transfer characteristics of the monolithic
catalyst in slug flow regime. From the results it can be concluded, that structured
catalysts are a very promising alternative to suspended powder catalysts in large scale
low temperature FTS.
7.2 Future work
In addition to the presented results more detailed research is required for deeper un-
derstanding of the interaction between the intrinsic characteristics, such as flow regime,
mass transfer and reaction mechanism. In this chapter, some of the research challenges
for future work will be pointed out.
The presented model is based on empirical correlations to describe hydrodynamic
and mass transfer characteristics for the considered reactor. This method is suitable, as
it allows a sufficient accuracy with low efforts. However, the assumptions simplify the
model strongly. An improvement could be the modeling of the MLR depending on the
operation time and considering the liquid recycle. A further improvement would be the
implementation of microkinetics, to calculate the change of product composition and its
effect on the physical properties of the gas and liquid phase. The single improvement
steps can be verified by a comparison with experimental data. Finally it could be
possible, to design a MLR in pilot plant scale. However, especially the consideration of
the real product composition is complex and requires extensive efforts.
91

7 Conclusions and future work
The preparation method of the catalyst reveals comparable pore structures of the
monolithic honeycomb and powder catalyst. However, the deviations in the active
metal distribution should be improved. A possible reason for the differences could be
the different overall calcination time of both catalyst types. An improvement could
be the preparation of the final powder catalyst in different layers on a flat support in
the same manner as the washcoat. These layers can afterwards be removed from the
support, crushed and sieved to the desired fraction. Furthermore, the calcination time
and temperature could be optimized. The catalyst raw component Re2O7 melts at 296
and boils at 360 ◦C. Especially long calcination times at the applied temperature of
350 ◦C could result in a depletion of the final Re content. A reduction of the calcination
temperature towards 300 ◦C under reducing atmosphere could prevent evaporation of
Re2O7. Finally, the long time stability of the catalysts should be investigated.
The main challenge concerning the experimental setup is the condensation of liquid in
the gas recycle stream. Further effort should be invested in reducing the condensation
to achieve high stability during experiments. Furthermore, the operation temperature
of the tubular reactor should be increased, to achieve higher reaction and hydrocar-
bon production rates. This could be accomplished by the implementation of a heat
exchanger at the top of the tubular reactor. Moreover, the analytical system should be
improved to quantify C2 + hydrocarbons in the gas phase.
With respect to future experiments for the monolithic honeycomb catalyst it is sug-
gested, to vary the gas and liquid flow rates for optimizing the operation conditions
and to investigate the film flow regime. Besides the study of the influence of the hy-
drodynamics on the external mass transfer, the effect of internal mass transfer could
by examined by changing the washcoat layer thickness. It would also be interesting to
evaluate the influence of the presence of a liquid phase on the methane selectivity and
reaction rate by experiments with and without liquid recycle.
In long term perspective the scale-up of the MLR would come in focus. For this
purpose long time stability experiments are necessary for the catalyst evaluation. Fur-
thermore, scale-up of the reactor setup is supposed to be feasible based on the presented
results and experience. This aim could be achieved by designing a pilot scale MLR oper-
ating with single pass of the gas phase. The reactor length should be designed to several
meters to achieve the desired conversion of about 70 %. The reactor diameter is limited
by the feasible liquid recycle and gas feed flow rate. Investigations towards gas-liquid
distribution over the cross sectional area can be conducted separately. In conclusion the
MLR has the chance to become industrially applicable in a medium term perspective.
92
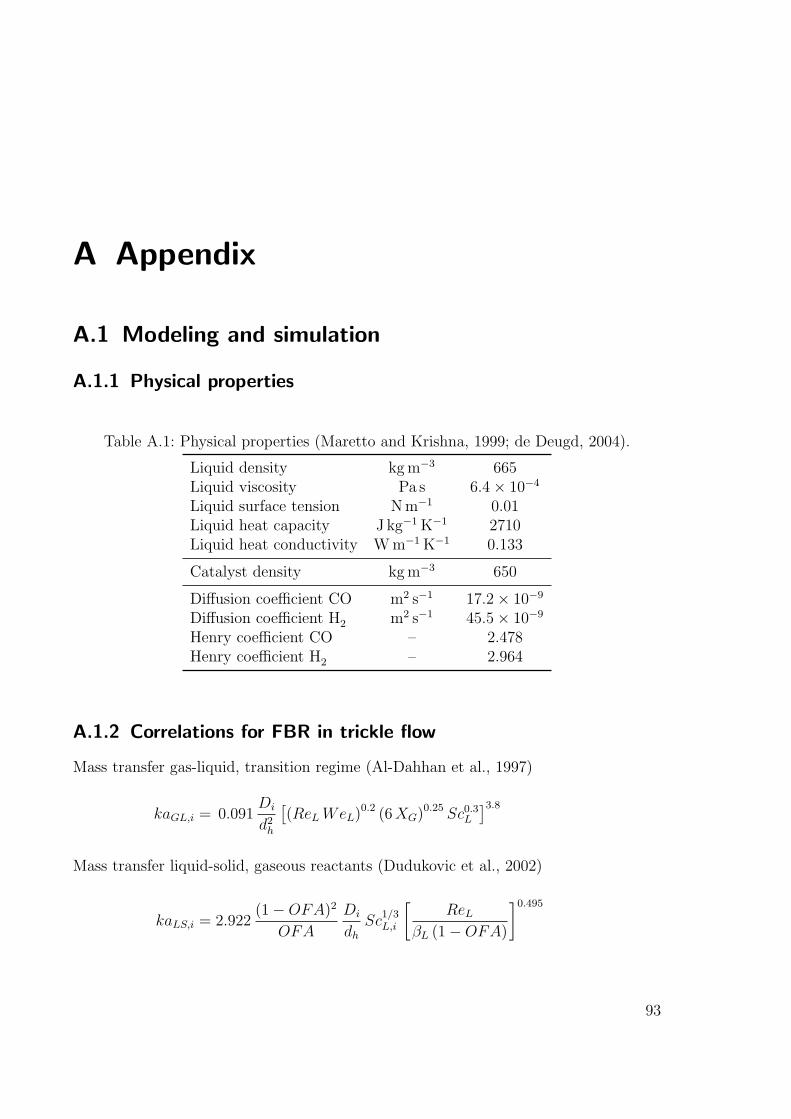
A Appendix
A.1 Modeling and simulation
A.1.1 Physical properties
Table A.1: Physical properties (Maretto and Krishna, 1999; de Deugd, 2004).
Liquid density kg m−3 665Liquid viscosity Pa s 6.4× 10⁻⁴
Liquid surface tension N m−1 0.01Liquid heat capacity J kg−1 K−1 2710Liquid heat conductivity W m−1 K−1 0.133
Catalyst density kg m−3 650
Diffusion coefficient CO m2 s−1 17.2× 10⁻⁹
Diffusion coefficient H2 m2 s−1 45.5× 10⁻⁹
Henry coefficient CO – 2.478Henry coefficient H2 – 2.964
A.1.2 Correlations for FBR in trickle flow
Mass transfer gas-liquid, transition regime (Al-Dahhan et al., 1997)
kaGL,i = 0.091Di
d2h
[(ReLWeL)0.2 (6XG)0.25 Sc0.3
L
]3.8Mass transfer liquid-solid, gaseous reactants (Dudukovic et al., 2002)
kaLS,i = 2.922(1−OFA)2
OFA
Di
dhSc
1/3L,i
[ReL
βL (1−OFA)
]0.495
93

A Appendix
Axial dispersion, liquid phase (Lange et al., 1999)
Dax,L = 0.55 · 10−4Re0.61L
Axial dispersion, gas phase (Lange et al., 1999)
Dax,G = 13 · 10−4Re0.78G
Heat transfer to reactor wall ReL < 40, dR/dP > 15 (Mariani et al., 2001)
hw,ov =λLdh
[3.87− 3.77 exp
(−1.37 dh
dR
)]Pr
1/3L Re0.643
L
Pressure drop (Larachi et al., 1991)
[∂p
∂z
]fri+hs
=2 ρG u
2G
dh[XG (ReLWeL)0.25]1.5
[31.3 +
17.3[XG (ReLWeL)0.25]0.5
]
A.1.3 Correlations for SBC
The correlations for the SBC reactor were taken from Maretto and Krishna (1999).
Gas saturation, large bubbles, xcat > 0.16
βG =0.3
OFA
u0.58G
d0.18R
Liquid saturation
βL = 1− βG
Mass transfer, gas-liquid, small bubbles
kaGL,i = OFAβG
√Di
2 · 10−9
94

A.1 Modeling and simulation
Mass transfer, gas-solid
kaGS,i = 0
Heat transfer to reactor wall
St =hw,ov
uTP ρLS cp,L= 0.1Rebubble Frbubble Pr
2
hw,ov =0.01u4
TP ρ2LS c
3p,L ηLS
g λ2L
Pressure gradient, friction[∂p
∂z
]fri
= 0
Pressure gradient, hydrostatic[∂p
∂z
]hs
= −(1− βG) ρLS g
Density and viscosity of suspension
ρLS = ρL
[1− ρL
ρSxcat
]+ ρS (1− εcat)xcat
ηLS = ηL (1 + 4.5xcat)
A.1.4 Correlations for MLR
Mass transfer, gas-liquid (Bercic and Pintar, 1997)
kaGL,i =0.133u1.2
TP
L0.5L
[Di
5 · 10−9
]0.5
95
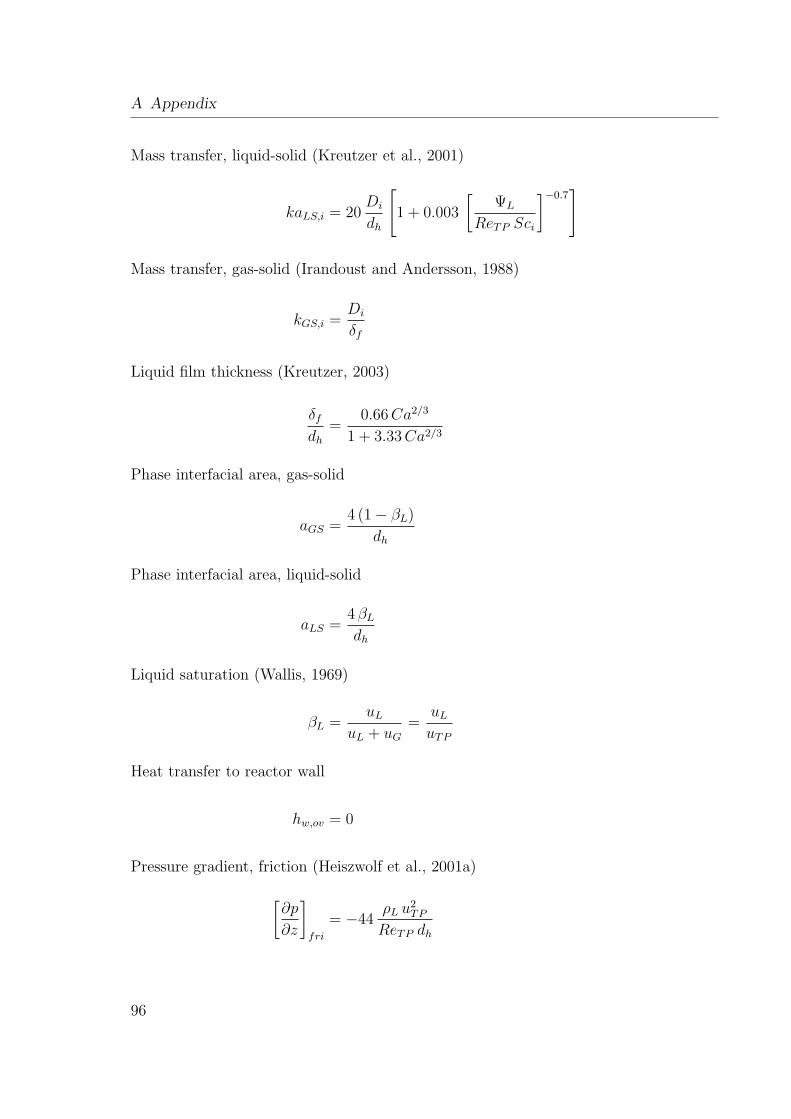
A Appendix
Mass transfer, liquid-solid (Kreutzer et al., 2001)
kaLS,i = 20Di
dh
[1 + 0.003
[ΨL
ReTP Sci
]−0.7]
Mass transfer, gas-solid (Irandoust and Andersson, 1988)
kGS,i =Di
δf
Liquid film thickness (Kreutzer, 2003)
δfdh
=0.66Ca2/3
1 + 3.33Ca2/3
Phase interfacial area, gas-solid
aGS =4 (1− βL)
dh
Phase interfacial area, liquid-solid
aLS =4 βLdh
Liquid saturation (Wallis, 1969)
βL =uL
uL + uG=
uLuTP
Heat transfer to reactor wall
hw,ov = 0
Pressure gradient, friction (Heiszwolf et al., 2001a)
[∂p
∂z
]fri
= −44ρL u
2TP
ReTP dh
96
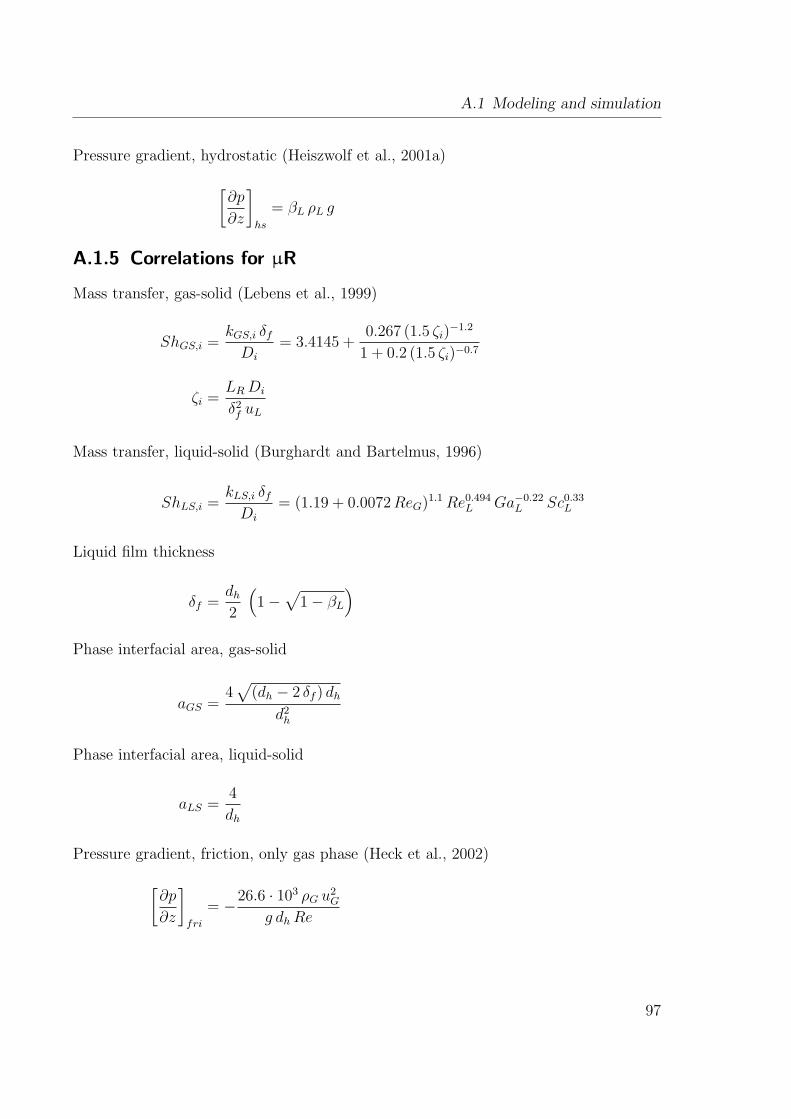
A.1 Modeling and simulation
Pressure gradient, hydrostatic (Heiszwolf et al., 2001a)[∂p
∂z
]hs
= βL ρL g
A.1.5 Correlations for µR
Mass transfer, gas-solid (Lebens et al., 1999)
ShGS,i =kGS,i δfDi
= 3.4145 +0.267 (1.5 ζi)
−1.2
1 + 0.2 (1.5 ζi)−0.7
ζi =LRDi
δ2f uL
Mass transfer, liquid-solid (Burghardt and Bartelmus, 1996)
ShLS,i =kLS,i δfDi
= (1.19 + 0.0072ReG)1.1Re0.494L Ga−0.22
L Sc0.33L
Liquid film thickness
δf =dh2
(1−
√1− βL
)Phase interfacial area, gas-solid
aGS =4√
(dh − 2 δf ) dhd2h
Phase interfacial area, liquid-solid
aLS =4
dh
Pressure gradient, friction, only gas phase (Heck et al., 2002)
[∂p
∂z
]fri
= −26.6 · 103 ρG u2G
g dhRe
97
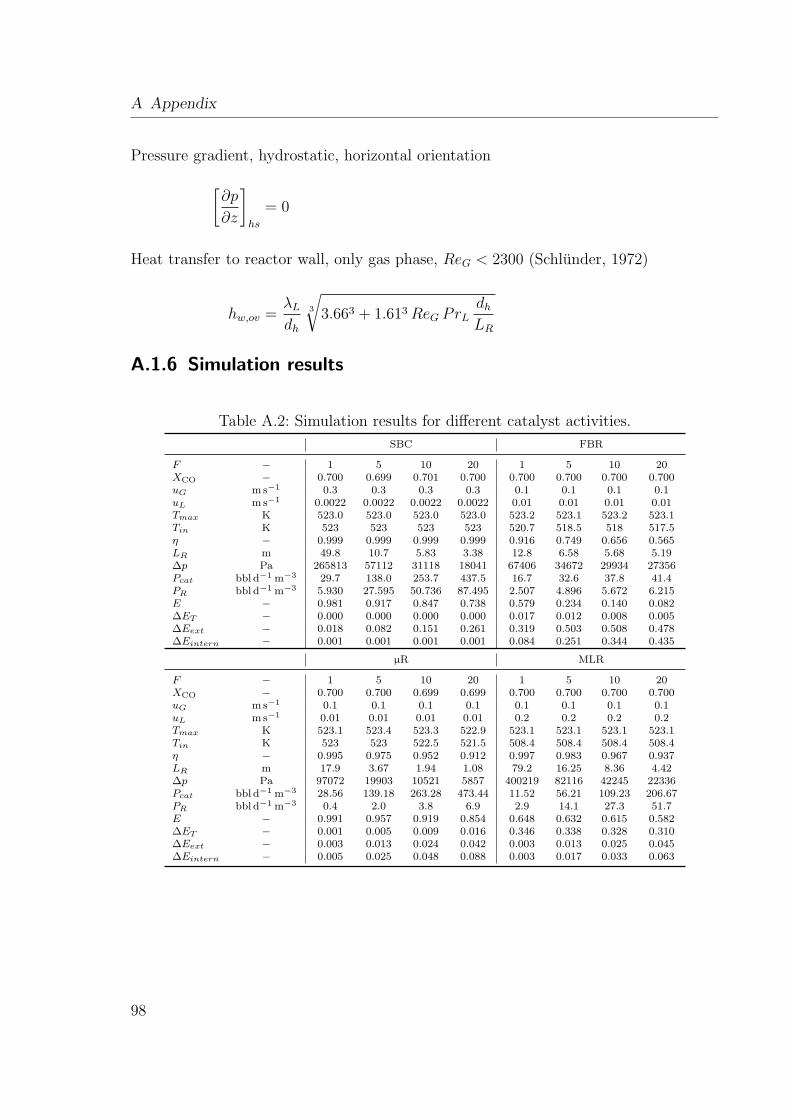
A Appendix
Pressure gradient, hydrostatic, horizontal orientation[∂p
∂z
]hs
= 0
Heat transfer to reactor wall, only gas phase, ReG < 2300 (Schlunder, 1972)
hw,ov =λLdh
3
√3.663 + 1.613ReG PrL
dhLR
A.1.6 Simulation results
Table A.2: Simulation results for different catalyst activities.
SBC FBR
F − 1 5 10 20 1 5 10 20XCO − 0.700 0.699 0.701 0.700 0.700 0.700 0.700 0.700uG m s−1 0.3 0.3 0.3 0.3 0.1 0.1 0.1 0.1uL m s−1 0.0022 0.0022 0.0022 0.0022 0.01 0.01 0.01 0.01Tmax K 523.0 523.0 523.0 523.0 523.2 523.1 523.2 523.1Tin K 523 523 523 523 520.7 518.5 518 517.5η − 0.999 0.999 0.999 0.999 0.916 0.749 0.656 0.565LR m 49.8 10.7 5.83 3.38 12.8 6.58 5.68 5.19∆p Pa 265813 57112 31118 18041 67406 34672 29934 27356Pcat bbl d−1 m−3 29.7 138.0 253.7 437.5 16.7 32.6 37.8 41.4PR bbl d−1 m−3 5.930 27.595 50.736 87.495 2.507 4.896 5.672 6.215E − 0.981 0.917 0.847 0.738 0.579 0.234 0.140 0.082∆ET − 0.000 0.000 0.000 0.000 0.017 0.012 0.008 0.005∆Eext − 0.018 0.082 0.151 0.261 0.319 0.503 0.508 0.478∆Eintern − 0.001 0.001 0.001 0.001 0.084 0.251 0.344 0.435
µR MLR
F − 1 5 10 20 1 5 10 20XCO − 0.700 0.700 0.699 0.699 0.700 0.700 0.700 0.700uG m s−1 0.1 0.1 0.1 0.1 0.1 0.1 0.1 0.1uL m s−1 0.01 0.01 0.01 0.01 0.2 0.2 0.2 0.2Tmax K 523.1 523.4 523.3 522.9 523.1 523.1 523.1 523.1Tin K 523 523 522.5 521.5 508.4 508.4 508.4 508.4η − 0.995 0.975 0.952 0.912 0.997 0.983 0.967 0.937LR m 17.9 3.67 1.94 1.08 79.2 16.25 8.36 4.42∆p Pa 97072 19903 10521 5857 400219 82116 42245 22336Pcat bbl d−1 m−3 28.56 139.18 263.28 473.44 11.52 56.21 109.23 206.67PR bbl d−1 m−3 0.4 2.0 3.8 6.9 2.9 14.1 27.3 51.7E − 0.991 0.957 0.919 0.854 0.648 0.632 0.615 0.582∆ET − 0.001 0.005 0.009 0.016 0.346 0.338 0.328 0.310∆Eext − 0.003 0.013 0.024 0.042 0.003 0.013 0.025 0.045∆Eintern − 0.005 0.025 0.048 0.088 0.003 0.017 0.033 0.063
98

A.1 Modeling and simulation
Table A.3: Simulation results for different diffusion lengths.
µR MLR
F − 20 20 20 20 20δcat m 85 125 250 85 125Vcat/Vchannel − 0.25 0.25 0.25 0.25 0.36Vcat/VR − 1.45× 10⁻² 2.10× 10⁻² 4.10× 10⁻² 0.25 0.36XCO − 0.699 0.698 0.699 0.700 0.699uG m s−1 0.1 0.1 0.1 0.1 0.1uL m s−1 0.01 0.01 0.01 0.2 0.2Tmax K 522.9 522.8 522.4 523.1 523.1Tin K 521.5 521.5 521.5 508.4 508.4η − 0.912 0.831 0.584 0.937 0.834LR m 1.08 1.18 1.67 4.42 3.58∆p Pa 5857 522 9056 22336 18091Pcat bbl d−1 m−3 473.4 432.9 306.4 206.7 182.0PR bbl d−1 m−3 6.865 9.091 12.562 51.668 64.606E − 0.854 0.783 0.561 0.582 0.512∆ET − 0.016 0.013 0.007 0.310 0.272∆Eext − 0.042 0.035 0.017 0.045 0.049∆Eint − 0.088 0.169 0.416 0.063 0.166
99

A Appendix
A.2 Experimental
0 5 10 15 20 25 300.0
0.1
0.2
1.0
1.1
FID
sig
nal [
mV
]
time [min]
40
80
120
160
200
tem
pera
ture
[°C
]
2 3 4 5 6
0.0
0.2
0.4
0.6
0.8
1.0
WLD
sig
nal [
mV
]
time [min]
20
30
40
50
60
tem
pera
ture
[°C
]
CH
4
C2H
4
C2H
6
C3H
6
C3H
8
C4H
8
C4H
10
C5H
10
C5H
12
C6H
12
C6H
14
H2
CO
CH
4
CO
2
Figure A.1: Typical chromatograms for gas phase analysis (campaign II, 232.5 h TOS,200 ◦C, 21 bar, 1000 min−1, 12 000 kgcat s m−3
SG,STP).
100

A.2 Experimental
4 6 8 10 12 14 160
2
4
6
8
10
FID
sig
nal [
104 c
ount
s]
time [min]
4 6 8 10 12 14 160
5
10
15
20
25
4 6 8 10 12 14 160
5
10
15
20
25
Cycl
oh
exane
Squ
ala
ne
C13H
28
C11H
24
C17H
36
C21H
44
Figure A.2: Chromatograms for the wax phase analysis of powder, crushed mono-lithic and monolithic catalyst from top to bottom (200 ◦C, 21 bar,12 000 kgcat s m−3
SG,STP).
Figure A.3 (facing page): Detailed flow diagram of the experimental setup.
101
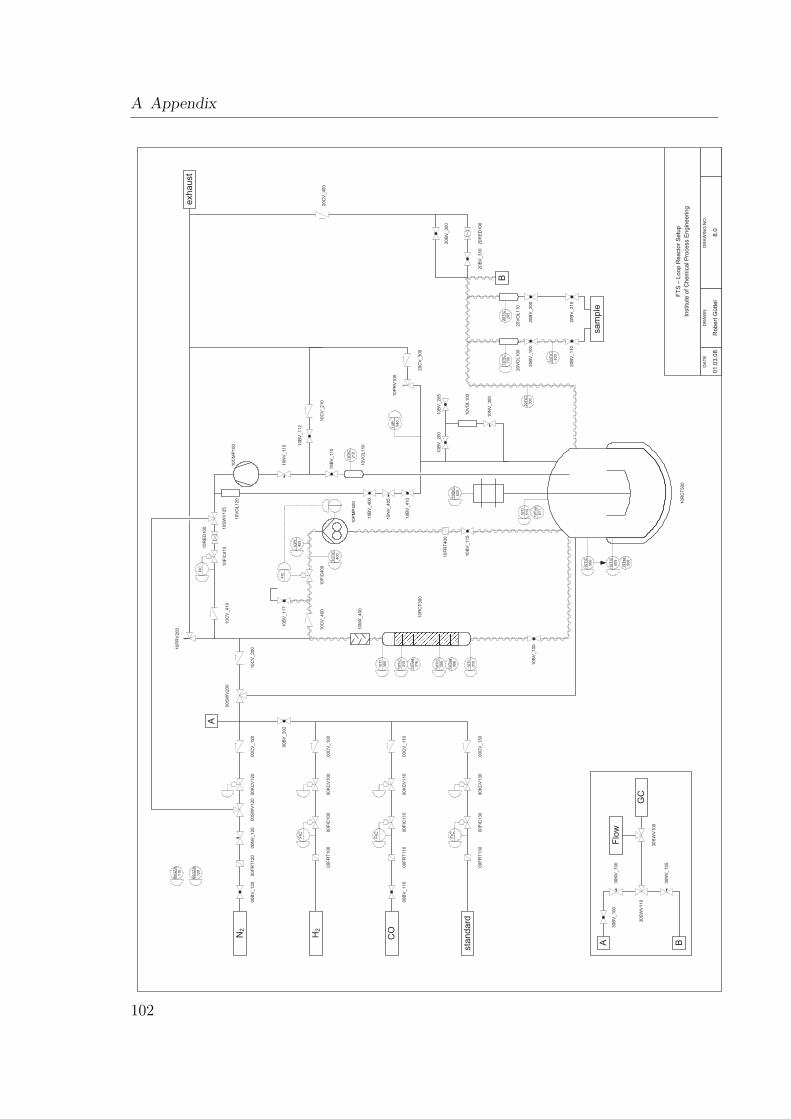
A Appendix
00
BV
_202
10
CV
_2001
0P
RV
200
10
CV
_410
FIC
10
FIC
400
10
CV
_400
10
BV
_117
10P
I
405
10
PM
P400
10
RC
T300
10T
IC
315
10T
I
300
10T
IC
305
10
Tsa
316
10
Tsa
306
10T
I
310
10
RC
T500
10
BV
_100
10
BV
_115
00
BV
_120
10S
IC
520
10T
sa
511
10
TIC
500
10
TIC
505
10T
sa
506
10T
I
510
10
VO
L120
10
RE
D100
10
BV
_400
10
BV
_410
10
CM
P100 1
0B
V_
112 10P
I_
540
10
PR
V100
10
VO
L100
10
BV
_205
10
BV
_200
10
NV
_300
20
VO
L100
20
VO
L110
20
BV
_100
20
BV
_110
20
BV
_200
20
BV
_210
20
RE
D100
20
BV
_300
10T
IC
700
20
TIC
205
00G
ZA
110
00G
ZA
120
exh
au
st
10
CV
_210
20
CV
_300
20
CV
_400
00
NV
_120
00
KC
V120
00
FR
T120
00
CV
_120
FIC
00
KC
V100
00
FIC
100
00
FR
T100
00
CV
_100
FIC
00
KC
V110
00
FIC
110
00
FR
T110
00
CV
_110
FIC
00
KC
V130
00
FIC
130
00
FR
T130
00
CV
_130
FIC
10
FIC
410
10T
IC
400
FT
S–
Loop
Reacto
rS
etu
p
Institu
teof
Chem
icalP
rocess
Engin
eeri
ng
DA
TE
DR
AW
ND
RA
WIN
GN
O.
01.0
3.0
8R
obert
Gütt
el
8.0
10
NV
_110
00
BV
_110
00
SW
V120
10
SW
V125
10
FR
T400
00
SW
V200
A
B
Flo
w
GC
30
NV
_100
30
NV
_105
30
BV
_100
30
SW
V100
A B
30
SW
V110
10
VO
L110
20
BV
_310
10
BV
_110
10
NV
_405
10T
IC
210
20T
IC
300
20T
IC
400
sa
mp
le
N2
H2
CO
sta
nd
ard
10
MX
_400
102

Bibliography
Agrafiotis, C., Tsetsekou, A., Ekonomakou, A., 1999. The effect of particle size on theadhesion properties of oxide washcoats on cordierite honeycombs. Journal of MaterialsScience Letters 18 (17), 1412–1224. doi:10.1023/A:1006675524692.
Al-Dahhan, M., Larachi, F., Dudukovic, M. P., Laurent, A., 1997. High-PressureTrickle-Bed Reactors: A Review. Industrial & Engineering Chemistry Research 36,3292–3314. doi:10.1021/ie9700829.
Anderson, R. B., 1956. Catalysts for the Fischer-Tropsch synthesis. In: Emmett, P. H.(Ed.), Catalysis. Vol. 4. Van Nostrand-Rheinhold, New York, pp. 29–255.
ASTM, 2002. Standard Test Method for Boiling Range Distribution of Petroleum Frac-tions by Gas Chromatography. Vol. ASTM D 2887 - 02. ASTM International, WestConshohocken, PA, USA.
Avila, P., Montes, M., Miro, E. E., 2005. Monolithic reactors for environmental ap-plications A review on preparation technologies. Chemical Engineering Journal 109,11–36. doi:10.1016/j.cej.2005.02.025.
BASF, 1913. Verfahren zur Darstellung von Kohlenwasserstoffen und deren Derivaten.DE293787.
Bauer, T., 2007. Experimental and theoretical investigations of monolithic reactors forthree-phase catalytic reactions. Dissertation, TU Dresden.
Bauer, T., Guettel, R., Roy, S., Schubert, M., Al-Dahhan, M., Lange, R.,2005a. Modelling and Simulation of the Monolithic Reactor for Gas-Liquid-Solid Reactions. Chemical Engineering Research and Design 83 (A7), 811–819.doi:10.1205/cherd.04335.
Bauer, T., Schubert, M., Lange, R., 2005b. Prozessintensivierung heterogenkatalysierter Gas/Flussig-Reaktionen mit Monolithreaktoren. Chemie IngenieurTechnik 77 (11), 1683–1692. doi:10.1002/cite.200500143.
Bercic, G., Pintar, A., 1997. The role of gas bubbles and liquid slug lengths on masstransport in the Taylor flow through capillaries. Chemical Engineering Science 52 (21-22), 3709–3719. doi:10.1016/S0009-2509(97)00217-0.
103

Bibliography
BMWi, 2008. Energiedaten, Nationale und Internationale Entwicklung.
Boger, T., Zieverink, M. P., Kreutzer, M. T., Kapteijn, F., Moulijn, J. A., 2004. Mono-lithic Catalysts as an Alternative to Slurry Systems: Hydrogenation of Edible Oil.Industrial & Engineering Chemistry Research 43, 2337–2344. doi:10.1021/ie030809v.
Borg, O., Eri, S., Blekkan, E. A., Storsæter, S., Wigum, H., Rytter, E., Hol-men, A., 2007. Fischer-Tropsch synthesis over γ-alumina-supported cobalt cat-alysts: Effect of support variables. Journal of Catalysis 248 (1), 89–100.doi:10.1016/j.jcat.2007.03.008.
Bradford, M. C. J., Te, M., Pollack, A., 2005. Monolith loop catalytic membranereactor for Fischer-Tropsch synthesis. Applied Catalysis A: General 283, 39–46.doi:10.1016/j.apcata.2004.12.032.
Broekhuis, R. R., Budhlall, B. M., Nordquist, A. F., 2004. Monolith Catalytic Processfor Producing Sorbitol: Catalyst Development and Evaluation. Industrial & Engi-neering Chemistry Research 43, 5146–5155. doi:10.1021/ie0400393.
Burghardt, A., Bartelmus, G., 1996. Hydrodynamics and mass transfer in three-phasecocurrent reactors. Chemical Engineering Science 51, 2733–2738. doi:10.1016/0009-2509(96)00144-3.
Christiani, C., Valentini, M., Merazzi, M., Neglia, S., Forzatti, P., 2005. Effect of ag-ing time on chemical and rheological evolution in γ-Al2O3 slurries for dip-coating.Catalysis Today 105 (3-4), 492–498. doi:10.1016/j.cattod.2005.06.020.
Claeys, M., 1997. Selektivitat, Elementarschritte und kinetische Modellierung bei derFischer-Tropsch-Synthese. Dissertation, Universitat Karlsruhe (TH).
Cybulski, A., Moulijn, J. A., 2006. Structured Catalysts and Reactors, 2nd Edition.Marcel Dekker Ltd., New York.
Davis, B. H., 2005. Fischer-Tropsch synthesis: Overview of reactor development andfuture potentialities. Topics in Catalysis 32 (3-4), 143–168. doi:10.1007/s11244-005-2886-5.
de Deugd, R. M., 2004. Fischer-Tropsch Synthesis Revisited; Efficiency and SelectivityBenefits from Imposing Temporal and/or Spatial Structure in the Reactor. Disserta-tion, Delft University of Technology.
de Deugd, R. M., Chougule, R. B., Kreutzer, M. T., Meeuse, F. M., Grievink, J.,Kapteijn, F., Moulijn, J. A., 2003a. Is a monolithic loop reactor a viable optionfor Fischer-Tropsch synthesis? Chemical Engineering Science 58 (3-6), 583–591.doi:10.1016/S0009-2509(02)00583-3.
104

Bibliography
de Deugd, R. M., Kapteijn, F., Moulijn, J. A., 2003b. Trends in Fischer-Tropsch ReactorTechnology - Opportunities for Structured Reactors. Topics in Catalysis 26 (1-4), 29–39. doi:10.1023/B:TOCA.0000012985.60691.67.
de Deugd, R. M., Kapteijn, F., Moulijn, J. A., 2003c. Using monolithic catalystsfor highly selective Fischer-Tropsch synthesis. Catalysis Today 79-80, 495–501.doi:10.1016/S0920-5861(03)00073-7.
Dry, M. E., 1982. Catalytic aspects of industrial Fischer-Tropsch synthesis. Journal ofMolecular Catalysis 17 (2-3), 133–144. doi:10.1016/0304-5102(82)85025-6.
Dry, M. E., 1990. The Fischer-Tropsch Process - Commercial Aspects. Catalysis Today6 (3), 183–206. doi:10.1016/0920-5861(90)85002-6.
Dry, M. E., 2001. High quality diesel via the Fischer-Tropsch process - a review. Journalof Chemical Technology and Biotechnology 77, 43–50. doi:10.1002/jctb.527.
Dry, M. E., 2002. The Fischer-Tropsch process: 1950-2000. Catalysis Today 71, 227–241.doi:10.1016/S0920-5861(01)00453-9.
Dudukovic, M. P., Larachi, F., Mills, P. L., 1999. Multiphase reactors - revisited. Chem-ical Engineering Science 54, 1975–1995. doi:10.1016/S0009-2509(98)00367-4.
Dudukovic, M. P., Larachi, F., Mills, P. L., 2002. Multiphase Catalytic Reactors: APerspective on Current Knowledge and Future Trends. Catalysis Reviews - Scienceand Engineering 44, 123–246. doi:10.1081/CR-120001460.
Edvinsson, R. K., Cybulski, A., 1994. A comparative analysis of the trickle-bed andthe monolithic reactor for three-phase hydrogenations. Chemical Engineering Science49 (24), 5653–5666. doi:10.1016/0009-2509(94)00370-X.
Enache, D. I., Landon, P., Lok, C. M., Pollington, S. D., Stitt, E. H., 2005. DirectComparison of a Trickle Bed and a Monolith for Hydrogenation of Pyrolysis Gasoline.Industrial & Engineering Chemistry Research 44, 9431–9439. doi:10.1021/ie0502180.
Fandino, O., Pensado, A. S., Lugo, L., Comunas, M. J. P., Fernandez, J., 2005. Com-pressed Liquid Densities of Squalane and Pentaerythritol Tetra(2-ethylhexanoate).Journal of Chemical & Engineering Data 50, 939–946. doi:10.1021/je049580w.
Fischer, F., Tropsch, H., 1923. Uber die Herstellung synthetischer Olgemische (Synthol)durch Aufbau aus Kohlenoxyd und Wasserstoff. Brennstoff-Chemie 4, 276–285.
Fischer, F., Tropsch, H., 1925. Verfahren zur Gewinnung mehrgliedriger Paraffinkohlen-wasserstoffe aus Kohlenoxyden und Wasserstoff auf katalytischem Wege. DE484337.
105

Bibliography
Fleisch, T. H., 2006. Overview of Syngas Generation from Different Sources and MainPathways for Syngas Conversion. In: Ernst, S., Jess, A., Nees, F., Perego, C.,Rupp, M., Santacesaria, E. (Eds.), DGMK/SCI-Conference ”Synthesis Gas Chem-istry”. Vol. 4 of DGMK Tagnungsbericht. Dresden, Germany, p. 7.
Fox, J. M., 1990. Fischer-Tropsch Reactor Selection. Catalysis Letters 7, 281–292.doi:10.1007/BF00764509.
Frohning, C. D., Kolbel, H., Ralek, M., Rottig, W., Schnur, F., Schulz, H., 1992.Fischer-Tropsch-Synthese. In: Falbe, J. (Ed.), Chemierohstoffe aus Kohle. GeorgThieme Verlag, Stuttgart.
Guettel, R., Kunz, U., Turek, T., 2008. Reactors for Fischer-Tropsch Synthesis. Chem-ical Engineering & Technology 31 (5), 746–754. doi:10.1002/ceat.200800023.
Guillou, L., Balloy, D., Supiot, P., Le Courtois, V., 2007. Preparation of a multilayeredcomposite catalyst for Fischer-Tropsch synthesis in a micro-chamber reactor. AppliedCatalysis A: General 324, 42–51. doi:10.1016/j.apcata.2007.03.006.
Hao, X., Dong, G., Yang, Y., Xu, Y., Li, Y., 2007. Coal to Liquid (CTL): Commercial-ization Prospects in China. Chemical Engineering & Technology 30 (9), 1157–1165.doi:10.1002/ceat.200700148.
He, J., Yoneyama, Y., Xu, B., Nishiyama, N., Tsubaki, N., 2005. Designing a CapsuleCatalyst and Its Application for Direct Synthesis of Middle Isoparaffins. Langmuir21, 1699–1702. doi:10.1021/la047217h.
Heck, R. M., Farrauto, R. J., Gulati, S. T., 2002. Monolithic Reactors for EnvironmentalCatalysis. In: Catalytic Air Pollution Control, 2nd Edition. Wiley-Interscience, NewYork.
Heck, R. M., Gulati, S. T., Farrauto, R. J., 2001. The application of monolithsfor gas phase catalytic reactions. Chemical Engineering Journal 82 (1-3), 149–156.doi:10.1016/S1385-8947(00)00365-X.
Heiszwolf, J. J., Engelvaart, L. B., van den Eijnden, M. G., Kreutzer, M. T., Kapteijn,F., Moulijn, J. A., 2001a. Hydrodynamic aspects of the monolith loop reactor. Chem-ical Engineering Science 56 (3), 805–812. doi:10.1016/S0009-2509(00)00292-X.
Heiszwolf, J. J., Kreutzer, M. T., van den Eijnden, M. G., Kapteijn, F., Moulijn, J. A.,2001b. Gas-liquid mass transfer of aqueous Taylor flow in monoliths. Catalysis Today69 (1-4), 51–55. doi:10.1016/S0920-5861(01)00354-6.
Hilmen, A.-M., Bergene, E., Lindvag, O. A., Schanke, D., Eri, S., Holmen, A., 2001.Fischer-Tropsch synthesis on monolithic catalysts of different materials. CatalysisToday 69 (1-4), 227–232. doi:10.1016/S0920-5861(01)00373-X.
106

Bibliography
Hilmen, A.-M., Bergene, E., Lindvag, O. A., Schanke, D., Eri, S., Holmen, A., 2005.Fischer-Tropsch synthesis on monolithic catalysts with oil circulation. Catalysis To-day 105, 357–361. doi:10.1016/j.cattod.2005.06.032.
Hoek, I., Nijhuis, T. A., Stankiewicz, A., Moulijn, J. A., 2004. Performance of themonolithic stirrer reactor: applicability in multi-phase processes. Chemical Engineer-ing Science 59, 4975–4981. doi:10.1016/j.ces.2004.07.077.
Hunter, R. J., 1991. Foundations of Colloid Science. Vol. 1. Clarendon Press, Oxford.
Irandoust, S., Andersson, B., 1988. Mass transfer and liquid-phase reactions in a seg-mented two-phase flow monolithic catalyst reactor. Chemical Engineering Science43 (8), 1983–1988. doi:10.1016/0009-2509(88)87072-6.
Jarosch, K. T., Tonkovich, A. L., Perry, S. T., Kuhlmann, D., Wang, Y., 2005. Mi-crochannel Reactors for Intensifying Gas-to-Liquid Technology. A.C.S. symposiumseries 914, 258–272.
Kapteijn, F., de Deugd, R. M., Moulijn, J. A., 2005. Fischer-Tropsch synthesis usingmonolithic catalysts. Catalysis Today 105, 350–356. doi:10.1016/j.cattod.2005.06.063.
Kapteijn, F., Heiszwolf, J. J., Nijhuis, T. A., Moulijn, J. A., 1999. Monoliths in multi-phase catalytic processes - aspects and prospects. CATTECH 3, 24–41.
Kapteijn, F., Nijhuis, T. A., Heiszwolf, J. J., Moulijn, J. A., 2001. New non-traditionalmultiphase catalytic reactors based on monolithic structures. Catalysis Today 66 (2-4), 133–144. doi:10.1016/S0920-5861(00)00614-3.
Khassin, A. A., Sipatrov, A. G., Chermashentseva, G. K., Yurieva, T. M., Par-mon, V. N., 2005a. Fischer-Tropsch synthesis using plug-through contactor mem-branes based on permeable composite monoliths. Selectivity control by porous struc-ture parameters and membrane geometry. Topics in Catalysis 32 (1-2), 39–46.doi:10.1007/s11244-005-9258-2.
Khassin, A. A., Sipatrov, A. G., Yurieva, T. M., Chermashentseva, G. K., Rudina, N. A.,Parmon, V. N., 2005b. Performance of a catalytic membrane reactor for the Fischer-Tropsch synthesis. Catalysis Today 105, 362–366. doi:10.1016/j.cattod.2005.06.031.
Khassin, A. A., Yurieva, T. M., Sipatrov, A. G., Kirillov, V. A., Chermashentseva,G. K., Parmon, V. N., 2003. Fischer-Tropsch synthesis using a porous catalyst pack-ing: experimental evidence of an efficient use of permeable composite monoliths as anovel type of the Fischer-Tropsch synthesis catalyst. Catalysis Today 79-80, 465–470.doi:10.1016/S0920-5861(03)00063-4.
107
Bibliography
Klemm, E., Doring, H., Geisselmann, A., Schirrmeister, S., 2007. Microstructured Reac-tors in Heterogeneous Catalysis. Chemical Engineering & Technology 30 (12), 1615–1621. doi:10.1002/ceat.200700311.
Klemm, E., Rudek, M., Markowz, G., Schutte, R., 2003. Mikroverfahrenstechnik. In:Dittmeyer, R., Kreysa, G., Keim, W., Oberholz, A. (Eds.), Winnacker Kuchler:Chemische Technik, 5th Edition. Vol. 2 of Winnacker Kuchler: Chemische Technik.Wiley-VCH, Weinheim.
Kreutzer, M. T., 2003. Hydrodynamics of Taylor Flow in Capillaries and MonolithReactors. Dissertation, Delft University of Technology.
Kreutzer, M. T., Du, P., Heiszwolf, J. J., Kapteijn, F., Moulijn, J. A., 2001. Masstransfer characteristics of three-phase monolith reactors. Chemical Engineering Sci-ence 56 (21-22), 6015–6023. doi:10.1016/S0009-2509(01)00271-8.
Krishna, R., 2000. A Scale-up Strategy for a Commercial Scale Bubble Column SlurryReactor for Fischer-Tropsch Synthesis. Oil & Gas Science and Technology - Rev. IFP55 (4), 359–393.
Krishna, R., Sie, S. T., 2000. Design and scale-up of the Fischer-Tropsch bubble columnslurry reactor. Fuel Processing Technology 64, 73–105.
Krishna, R., van Baten, J. M., 2003. A strategy for scaling up the Fischer-Tropschbubble column slurry reactor. Topics in Catalysis 26, 21.
Lange, R., Gutsche, R., Hanika, J., 1999. Forced periodic operation of a trickle-bed reac-tor. Chemical Engineering Science 54, 2569–2573. doi:10.1016/S0009-2509(99)00004-4.
Larachi, F., Laurent, A., Midoux, N., Wild, G., 1991. Experimental study of a trickle-bed reactor operating at high pressure: two-phase pressure drop and liquid saturation.Chemical Engineering Science 46 (5-6), 1233–1246. doi:10.1016/0009-2509(91)85051-X.
Lebens, P. J. M., Heiszwolf, J. J., Kapteijn, F., Sie, S. T., Moulijn, J. A., 1999.Gas-liquid mass transfer in an internally finned monolith operated countercur-rently in the film flow regime. Chemical Engineering Science 54 (21), 5119–5125.doi:10.1016/S0009-2509(99)00265-1.
Lemaitre, J. L., 1984. Temperature-Programmed Methods. In: Delannay, F. (Ed.),Characterization of Heterogeneous Catalysts. Marcel Dekker, Inc., New York.
Lemaitre, J. L., Menon, P. G., Delannay, F., 1984. The Measurement of Catalyst Dis-persion. In: Delannay, F. (Ed.), Characterization of Heterogeneous Catalysts. MarcelDekker, Inc., New York.
108

Bibliography
Liu, W., 2002. Ministructured Catalyst Bed for Gas-Liquid-Solid Multiphase CatalyticReaction. AIChE Journal 48 (7), 1519–1532. doi:10.1002/aic.690480715.
Liu, W., Addiego, W. P., Sorensen, C. M., 2002. Monolith Reactor for the Dehydro-genation of Ethylbenzene to Styrene. Industrial & Engineering Chemistry Research41, 3131–3138. doi:10.1021/ie010730v.
Losey, M. W., Schmidt, M. A., Jensen, K. F., 2001. Microfabricated Multiphase Packed-Bed Reactors: Characterization of Mass Transfer and Reactions. Industrial & Engi-neering Chemistry Research 40, 2555–2562. doi:10.1021/ie000523f.
Maretto, C., Krishna, R., 1999. Modelling of a bubble column slurry reactor for Fischer-Tropsch synthesis. Catalysis Today 52, 279–289. doi:10.1016/S0920-5861(99)00082-6.
Mariani, N. J., Martinez, O. M., Barreto, G. F., 2001. Evaluation of heat transferparameters in packed beds with cocurrent downflow of liquid and gas. ChemicalEngineering Science 56, 5995–6001. doi:10.1016/S0009-2509(01)00225-1.
Marwan, H., Winterbottom, J. M., 2003. Operating characteristics and perfor-mance of a monolithic downflow bubble column reactor in selective hydrogena-tion of butyne-1,4-diol. Chemical Engineering & Technology 26 (9), 996–1002.doi:10.1002/ceat.200301742.
Mazzarino, I., Baldi, G., 1987. Liquid Phase Hydrogenation on a Monolithic Catalyst.In: Kulkarni, B. D., Mashelkar, R. A., Sharma, M. M. (Eds.), Recent Trends inChemical Reaction Engineering. Vol. 2. Wiley Eastern Ltd., New Delhi, pp. 181–189.
Meshcheryakov, V. D., Kirillov, V. A., Kuzin, N. A., 1999a. A multifunctional reactorwith a regular catalyst packing for Fischer-Tropsch synthesis. Chemical EngineeringScience 54 (10), 1565–1570. doi:10.1016/S0009-2509(99)00066-4.
Meshcheryakov, V. D., Kirillov, V. A., Kuzin, N. A., 1999b. A stacked catalyst packingreactor for superexothermal processes in gas-liquid-solid three-dimensional systems.Theoretical Foundations Of Chemical Engineering 33 (5), 508–516.
Nijhuis, T. A., Beers, A. E. W., Vergunst, T., Hoek, I., Kapteijn, F., Moulijn, J. A.,2001a. Preparation of monolithic catalysts. Catalysis Reviews - Science and Engi-neering 43 (4), 345–380. doi:10.1081/CR-120001807.
Nijhuis, T. A., Dautzenberg, F. M., Moulijn, J. A., 2003. Modeling of monolithic andtrickle-bed reactors for the hydrogenation of styrene. Chemical Engineering Science58 (7), 1113–1124. doi:10.1016/S0009-2509(02)00547-X.
Nijhuis, T. A., Kreutzer, M. T., Romijn, A. C. J., Kapteijn, F., Moulijn, J. A., 2001b.Monolithic catalysts as efficient three-phase reactors. Chemical Engineering Science56 (3), 823–829. doi:10.1016/S0009-2509(00)00294-3.
109

Bibliography
Nijhuis, T. A., Kreutzer, M. T., Romijn, A. C. J., Kapteijn, F., Moulijn, J. A., 2001c.Monolithic catalysts as more efficient three-phase reactors. Catalysis Today 66 (2-4),157–165. doi:10.1016/S0920-5861(00)00621-0.
OPEC, 2007. World Oil Outlook. Tech. rep.
Oukaci, R., Singleton, A. H., Goodwin, J. G., J., 1999. Comparison of patented CoF-T catalysts using fixed-bed and slurry bubble column reactors. Applied CatalysisA: General 186, 129–144. doi:10.1016/S0926-860X(99)00169-6.
Pangarkar, K., Schildhauer, T. J., van Ommen, J. R., Nijenhuis, J., Kapteijn, F.,Moulijn, J. A., 2008. Structured Packings for Multiphase Catalytic Reactors. Indus-trial & Engineering Chemistry Research 47 (10), 3720–3751. doi:10.1021/ie800067r.
Pangarkar, V. G., Yawalkar, A. A., Sharma, M. M., Beenackers, A. A. C. M.,2002. Particle-Liquid Mass Transfer Coefficient in Two-/Three-Phase Stirred TankReactors. Industrial & Engineering Chemistry Research 41 (17), 4141–4167.doi:10.1021/ie010933j.
Perry, R. H., Green, D., 1999. Perry’s Chemical Engineers’ Handbook. McGraw-Hill.
Post, M. F. M., van’t Hoog, A. C., Minderhoug, J. K., Sie, S. T., 1989. Diffu-sion Limitations in Fischer-Tropsch Catalysts. AIChE Journal 35 (7), 1107–1114.doi:10.1002/aic.690350706.
Rados, N., Al-Dahhan, M., Dudukovic, M. P., 2003. Modeling of the Fischer-Tropsch synthesis in slurry bubble column reactors. Catalysis Today 79-80, 211–218.doi:10.1016/S0920-5861(03)00007-5.
Reitzmann, A., Patcas, F. C., Kraushaar-Czarnetzki, B., 2006. Keramische Schwamme- Anwendungspotenzial monolithischer Netzstrukturen als katalytische Packungen.Chemie Ingenieur Technik 78 (7), 885–898. doi:10.1002/cite.200600029.
Reuel, R. C., Bartholomew, C. H., 1984. The stoichiometries of H2 and CO adsorptionson cobalt: Effects of support and preparation. Journal of Catalysis 85 (1), 63–77.doi:10.1016/0021-9517(84)90110-6.
Riedel, T., 2002. Reaktionen von CO2 bei der Fischer-Tropsch Synthese - Kinetik undSelektivitat. Dissertation, Universitat Karlsruhe (TH).
Riedel, T., Schaub, G., 2003. Low-temperature Fischer-Tropsch synthesis on cobaltcatalysts - effects of CO2. Topics in Catalysis 26 (1-4), 145–156.
Rohde, M. P., Unruh, D., Schaub, G., 2005a. Membrane application in Fischer-Tropsch synthesis reactors - Overview of concepts. Catalysis Today 106, 143–148.doi:10.1016/j.cattod.2005.07.124.
110

Bibliography
Rohde, M. P., Unruh, D., Schaub, G., 2005b. Membrane Application in Fischer-TropschSynthesis to Enhance CO2 Hydrogenation. Industrial & Engineering Chemistry Re-search 44, 9653–9658. doi:10.1021/ie050289z.
Roy, S., Bauer, T., Al-Dahhan, M., Lehner, P., Turek, T., 2004. Monoliths as multiphasereactors: a review. AIChE Journal 50 (11), 2918–2938. doi:10.1002/aic.10268.
Rytter, E., Eri, S., Skagseth, T. H., Schanke, D., Bergene, E., Myrstad, R., Lindvag,A., 2007. Catalyst Particle Size of Cobalt/Rhenium on Porous Alumina and theEffect on Fischer-Tropsch Catalytic Performance. Industrial & Engineering ChemistryResearch 46 (26), 9032–9036. doi:10.1021/ie071136+.
Schanke, D., Bergene, E., Holmen, A., 1998. Fischer-Tropsch Synthesis. WO9838147.
Schanke, D., Hilmen, A.-M., Bergene, E., Kinnari, K., Rytter, E., Adnanes, A., Hol-men, A., 1996. Reoxidation and Deactivation of Supported Cobalt Fischer-TropschCatalysts. Energy & Fuels 10 (4), 867–872. doi:10.1021/ef950197u.
Schaub, G., 2006. Synthetic Fuels and Biofuels for the Transportation Sector - Principlesand Perspectives. OIL GAS European Magazine 32, 34.
Schaub, G., Rohde, M. P., Mena Subiranas, A., 2006. Overview of Syngas Generationfrom Different Sources and Main Pathways for Syngas Conversion. In: Ernst, S., Jess,A., Nees, F., Perego, C., Rupp, M., Santacesaria, E. (Eds.), DGMK/SCI-Conference“Synthesis Gas Chemistry”. Vol. 4 of DGMK Tagnungsbericht. Dresden, Germany,p. 75.
Schlunder, E. U., 1972. Einfuhrung in die Warme- und Stoffubertragung. Vieweg Verlag,Braunschweig.
Schulz, H., 1999. Short history and present trends of Fischer-Tropsch synthesis. AppliedCatalysis A: General 186, 3–12. doi:10.1016/S0926-860X(99)00160-X.
Sie, S. T., 1998. Process Development and Scale up: IV. Case History of the Devel-opment of a Fischer-Tropsch Synthesis Process. Reviews in Chemical Engineering14 (2), 109–157.
Silveston, P. L., Hanika, J., 2004. Periodic Operation of Three - Phase Catalytic Reac-tors. The Canadian Journal of Chemical Engineering 82 (6), 1105–1142.
Simmons, M. J., Wong, D. C. Y., Travers, P. J., Rothwell, J. S., 2003. Bubble behaviorin three phase capillary microreactors. International Journal of Chemical ReactorEngineering 1, A30.
Soriano, J.-P., 2005. Mass transfer characteristics in an agitated slurry reactor operatingunder Fischer-Tropsch conditions. Master thesis, University of Pittsburgh.
111

Bibliography
Steynberg, A. P., Dry, M. E., 2004. Fischer-Tropsch Technology. Vol. 152 of Studies inSurface Science and Catalysis. Elsevier B.V., Amsterdam.
Storsæter, S., Borg, O., Blekkan, E. A., Holmen, A., 2005a. Study of the effect of wateron Fischer-Tropsch synthesis over supported cobalt catalysts. Journal of Catalysis231, 405–419. doi:10.1016/j.jcat.2005.01.036.
Storsæter, S., Chen, D., Holmen, A., 2006. Microkinetic modelling of the formation ofC1 and C2 products in the Fischer-Tropsch synthesis over cobalt catalysts. SurfaceScience 600, 2051–2063. doi:10.1016/j.susc.2006.02.048.
Storsæter, S., Totdal, B., Walmsley, J. C., Tanem, B. S., Holmen, A., 2005b. Char-acterization of alumina-, silica-, titania-supported cobalt Fischer-Tropsch catalysts.Journal of Catalysis 236, 139–152. doi:10.1016/j.jcat.2005.09.021.
Twigg, M. V., Richardson, J. T., 2002. Theory and applications of ceramicfoam catalysts. Chemical Engineering Research and Design 80 (A2), 183.doi:10.1205/026387602753501906.
Unruh, D., 2006. Fischer-Tropsch Synthese mit Synthesegasen aus Biomasse -Verbesserung der Kohlenstoffnutzung durch Anwendung eines Membranreaktors. Dis-sertation, Universitat Karlsruhe (TH).
van der Laan, G. P., 1999. Kinetics, Selectivity and Scale Up of the Fischer-TropschSynthesis. Dissertation, University of Groningen.
van der Laan, G. P., Beenackers, A. A. C. M., 1999. Kinetics and Selectivity of theFischer-Tropsch Synthesis: A Literature Review. Catalysis Reviews - Science andEngineering 41 (3-4), 255–318.
van der Laan, G. P., Beenackers, A. A. C. M., Krishna, R., 1999. Multicomponentreaction engineering model for Fe-catalyszed Fischer-Tropsch synthesis in commercialscale slurry bubble column reactors. Chemical Engineering Science 54, 5013–5019.doi:10.1016/S0009-2509(99)00225-0.
van Steen, E., Claeys, M., 2008. Fischer-Tropsch Catalysts for the Biomass-to-Liquid Process. Chemical Engineering & Technology 31 (5), 655–666.doi:10.1002/ceat.200800067.
Vergunst, T., Kapteijn, F., Moulijn, J. A., 2001. Monolithic catalysts – non-uniformactive phase distribution by impregnation. Applied Catalysis A: General 213 (2),179–187. doi:10.1016/S0926-860X(00)00896-6.
Visconti, C. G., Tronconi, E., Lietti, L., Zennaro, R., Forzatti, P., 2007. Development ofa complete kinetic model for the Fischer-Tropsch synthesis over Co/Al2O3 catalysts.Chemical Engineering Science 62, 5338–5343. doi:10.1016/j.ces.2006.12.064.
112

Bibliography
Wallis, G. B., 1969. One Dimensional Two-Phase Flow. Mc-Graw-Hill, New York.
Wang, Y., Fan, W., Liu, Y., Zeng, Z., Hao, X., Chang, M., Zhang, C., Xu,Y., Xiang, H., Li, Y., 2008. Modeling of the Fischer-Tropsch synthesis in slurrybubble column reactors. Chemical Engineering and Processing 47 (2), 222–228.doi:10.1016/j.cep.2007.02.011.
Wang, Y., Tonkovich, A. L., Mazanec, T., Daly, F. P., VanderWiel, D., Hu, J., Cao, C.,Kibby, C. L., Li, X. S., Briscoe, M. D., Gano, N., Chin, Y.-H., 2005. Fischer-TropschSynthesis using Microchannel Technology and Novel Catalyst and Microchannel Re-actor. WO2005075606.
Wang, Y., Vanderwiel, D., Tonkovich, A. L., Gao, Y., Baker, E. G., 2002. CatalystStructure and Method of Fischer-Tropsch Synthesis. US6451864B1.
Wang, Y., Vanderwiel, D., Tonkovich, A. L., Gao, Y., Baker, E. G., 2003a. CatalystStructure and Method of Fischer-Tropsch Synthesis. US6558634B1.
Wang, Y.-N., Xu, Y.-Y., Li, Y.-W., Zhao, Y.-L., Zhang, B.-J., 2003b. Heterogeneousmodeling for fixed-bed Fischer-Tropsch synthesis: Reactor model and its applications.Chemical Engineering Science 58, 867–875. doi:10.1016/S0009-2509(02)00618-8.
Wang, Y.-N., Xu, Y.-Y., Xiang, H.-W., Li, Y.-W., Zhang, B.-J., 2001. Modeling ofCatalyst Pellets for Fischer-Tropsch Synthesis. Industrial & Engineering ChemistryResearch 40, 4324–4335. doi:10.1021/ie010080v.
Yates, I., Satterfield, C. N., 1991. Intrinsic Kinetics of the Fischer-Tropsch Synthesis ona Cobalt Catalyst. Energy & Fuels 5, 168–173.
113

Nomenclature
Latin Letters
a m2 kg−1 specific surface areaA m2 areaa m−1 specific surface areac mol m−3 concentrationcp J mol−1 K−1 heat capacityCa – Capillary number, Ca = η u
σ
D m2 s−1 dispersion coefficentD – dispersionD m2 s−1 diffusion coefficentd m diameterE – efficiencyEA J mol−1 activation energyF – relative catalyst activityf – exposed metal surface areaFr – Froude number, Fr = u
g d
g m s−2 standard gravity, 9.81 m s−2
Ga – Galileo number, Ga =OFA3 d3P ρ2L g
η2i (1−OFA)3
∆HR J mol−1 reaction enthalpyh W m−2 K−1 heat transfer coefficientHe – Henry coefficientk m s−1 mass transfer coefficientk s−1 reaction rate constantk0 s−1 frequency factorka s−1 mass transfer coefficientL m length
– slope of linear functionM kg mol−1 molar massm kg massn – number of molesNA mol−1 Avogadro number, 6.022× 10²³ mol−1
nc – number of carbon atomsOFA – open frontal area, void fraction
114

Nomenclature
∆p Pa pressure dropP bbl d−1 m−3 productivityp Pa pressurePr – Prandtl number, Pr = η cp
λ
r mol g−1cat s−1 mass specific reaction rate
R – peak area ratioR J mol−1 K−1 ideal gas constant, 8.3144 J mol−1 K−1
r mol m−3cat s−1 volume specific reaction rate
Re – Reynolds number, Re = ρ u dη
Reε – specific Reynolds number, Reε =(ε d4P ρ3Lη3
L
) 13
S – selectivitySc – Schmidt number, Sc = η
ρD
Sh – Sherwood number, Sh = k dD
St – Stanton number, St = hu ρ cp
T K temperatureTOF s−1 turn-over frequencyTOS h time on streamu m s−1 velocity
V m3 s−1 volumetric flow rateV m3 volume
We – Weber number, We = ρ u2 dσ
X – conversionXG – modified Lockhart-Martinelli ratio, XG =
uG
uL
√ρG
ρL
xm – mass fractionxn – molar fractionxv – volume fractionxcat – catalyst volume per channel volumey m internal coordinate inside the catalystz m axial coordinate
Greek Letters
α – chain growth probabilityβ – phase saturationδ m thicknessε – porosityε W kg−1 specific power inputη – catalyst effectiveness factorη Pa s dynamic viscosity
115
Nomenclature
λ W m−1 K−1 heat conductivityν – stochiometric factorφ – Thiele modulusΨ – dimensionless slug lengthρ kg m−3 densityσ N m−1 surface tensionσ nm2 atom−1 area per surface atomτmod kgcat s−1 m−3
SG,STP modified residence time
Subscripts
app apparentav availableax axialBET Brunauer-Emmet-Tellerbubble bubblecat catalystcell cellch channelchar characteristiceff effectiveext externalf film
feed feedfri frictionG gasGL gas-liquidGLS gas-liquid-solidGS gas-solidh hydraulichs hydrostaticin inletint intrinsic
intern internL liquidLS liquid-solidmax maximummc monolithic carriermcat monolithic catalystmean meanobs observed
116

Nomenclature
out outov overallP particlepeak peakplate platepore pore
product productR reactor
recycle recyclereq requiredS solidSG synthesis gas
sphere sphereSTP standard temperature and pressureT temperatureTP two-phasew wallwc washcoat
117

Abbreviations
FT Fischer-Tropsch
FTS Fischer-Tropsch synthesis
SBC slurry bubble column reactor
FBR fixed-bed reactor
STR slurry stirred tank reactor
MLR monolith loop reactor
MR monolith reactor
µR micro reactor
118