monotone data modeling using rational functions
TRANSCRIPT

Turk J Elec Eng & Comp Sci(2019) 27: 2331 – 2343© TÜBİTAKdoi:10.3906/elk-1806-223
Turkish Journal of Electrical Engineering & Computer Sciences
http :// journa l s . tub i tak .gov . t r/e lektr ik/
Research Article
Monotone data modeling using rational functions
Zoha TARIQ1, Farheen IBRAHEEM2∗ , Malik Zawwar HUSSAIN1, Muhammad SARFRAZ3
1Department of Mathematics, University of the Punjab, Lahore, Pakistan2Department of Mathematics, Forman Christian College-A Chartered University (FCCU), Lahore, Pakistan3Department of Information Science, College of Computing Sciences and Engineering, Kuwait University,
Kuwait City, Kuwait
Received: 29.06.2018 • Accepted/Published Online: 17.12.2018 • Final Version: 15.05.2019
Abstract: Rational schemes for shape preservation of monotone data both in 2D and 3D setups have been developed.C1 rational cubic and partially blended bicubic functions are employed for this purpose. Monotonicity is achieved byextracting constraints on parameters involved in the description of these rational functions. Monotone curves and surfaceshave been obtained, which provide evidence that the algorithm used fits most types of monotone data and producesvisually pleasing results.
Key words: Monotone data, shape preservation, rational functions
1. IntroductionConstruction of curves and surfaces in the digital age is at the heart of many scientific fields such as computer-aided geometric design (CAGD), computer graphics (CG), and computer-aided design (CAD). These appliedfields integrate concepts from linear algebra, differential geometry, visualization, and numerical methods, allimplemented in software. Curve and surface drawing techniques have given architects a cutting edge over theconventional drafting equipment and optimized the probability of turning their visions into practice, displayingthem on computer screens in incredibly short spans of time. Three categories of data, i.e. monotonicity,positivity, and convexity, are often dominant in the majority of these applications. Rise in cholesterol levelin the blood due to consuming food high in saturated fat, chlorofluorocarbon amounts in the depletion of theozone layer, and uric acid levels in gout patients are some variables that always show monotonic pattern. Heightand age of a person, number of computers in a computer laboratory, and population in a specific area are somereal-life examples of positive data. Exponential and power functions, negative entropy, and area enclosed by asemicircle in the lower half plane are a few examples of curves that show convex behavior.
Mathematical models of the datasets exhibiting one of these three properties have ensured their signifi-cance in the fields of engineering, natural sciences, and social sciences. Construction of these models can assistin the study of effects of various constituents and in estimating the behavior of the system as a whole. Forthis purpose, the intrinsic shape of the data must be retained to avoid misinterpretation of the information.Standard methods of spline functions do not retain inherited characteristics of the data. Hence, by introducingsome parameters into the spline structure, various characteristics of the data, including convexity, monotonicity,and positivity, can be conserved. Moreover, the number of parameters can be increased to pull the curve orsurface towards the intrinsic shape of the data, keeping the smoothness of the results intact.∗Correspondence: [email protected]
This work is licensed under a Creative Commons Attribution 4.0 International License.2331

TARIQ et al./Turk J Elec Eng & Comp Sci
Spline interpolating rational functions are very helpful in the envisioning of shaped data because theyfurnish smooth and captivating views of the data under consideration. Much notable work has been donepreviously to overcome this difficulty [1–10]. Kvasov [3] created an algorithm for interpolation by means ofweighted cubic spline functions that keep the monotone and convex shape of discrete sets of data. Ibraheemet al. [4] evolved rational cubic and bicubic trigonometric methodologies to maintain the monotonicity ofdata in two and three dimensions. Constraints were attained on parameters of rational cubic and bicubictrigonometric functions. In [5], the authors did work on conservation of shaped data by evolving a C1 rationalcubic spline that formed a convex interpolant for given convex data. Sarfraz et al. [1] developed a piecewiserational cubic function of order O(h3) to visualize monotone data. Hussain et al. [9] designed a control pointstate of quadratic trigonometric functions that fulfill each of the properties of Bezier functions. Floater andPena [7] considered and explained the types of monotonicity preservation of systems of bivariate function ona triangle. Sarfraz et al. [2] illustrated a rational cubic function having two parameters for the envisioning ofpositive-shaped data. The focus of the work was to present a smooth view of data. Sarfraz et al. [10] createda novel technique of curve interpolation. A piecewise rational cubic function encompassing two parameterswas considered and their influence on the shape of the curve was scrutinized. Hussain et al. [6] extendedthe GC1 quadratic trigonometric functions in [9] to GC1 biquadratic trigonometric functions that confinedfour free parameters. Smooth and eye-catching monotone and positive surfaces were attained by developinglimits on free parameters. The prime objective of this research is to acquire data-dependent constraints onparameters to retain monotonicity. For this purpose, rational cubic and bicubic functions by the authors in[2] are utilized. Monotonicity-preserving constraints for curve and surface data are developed in Section 3 andSection 4, respectively. Section 5 provides the implementation of a rational scheme developed on 2D and 3Ddatasets. The corresponding numerical results of values of derivatives and parameters are calculated usingMATLAB and are shown in Section 6, followed by conclusions in Section 7.
2. Rational cubic and bicubic partially blended functions
Let us presume that (εi, fi) , 0 ≤ i ≤ n , is the dataset supposed to be delineated on the interval [a, b] in sucha way that a = ε0 < ε1 < ε3 < · · · < εn = b. A rational cubic piecewise defined function possessing two freeparameters defined in all the subintervals Ii = [εi, εi+1], 0 ≤ i ≤ n− 1 , is provided below:
Si(ε) =pi(Φ)
qi(Φ), (1)
where
pi(Φ) = δifi(1− Φ)3 + {δifi + hiδidi + 2fi}Φ(1− Φ)2
+ {ξifi+1 − hiξidi+1 + 2fi+1}Φ2(1− Φ) + ξifi+1Φ3,
qi(Φ) = δi(1− Φ)2 + 2Φ(1− Φ) + ξiΦ2,
and Φ = ε−εihi
, hi = εi+1 − εi. The function provided in Eq. (1) holds C1 continuity if the following attributesare satisfied:
Si(εi) = fi, Si(εi+1) = fi+1,
S(1)i (εi) = di, S
(1)i (εi+1) = di+1.
(2)
2332
TARIQ et al./Turk J Elec Eng & Comp Sci
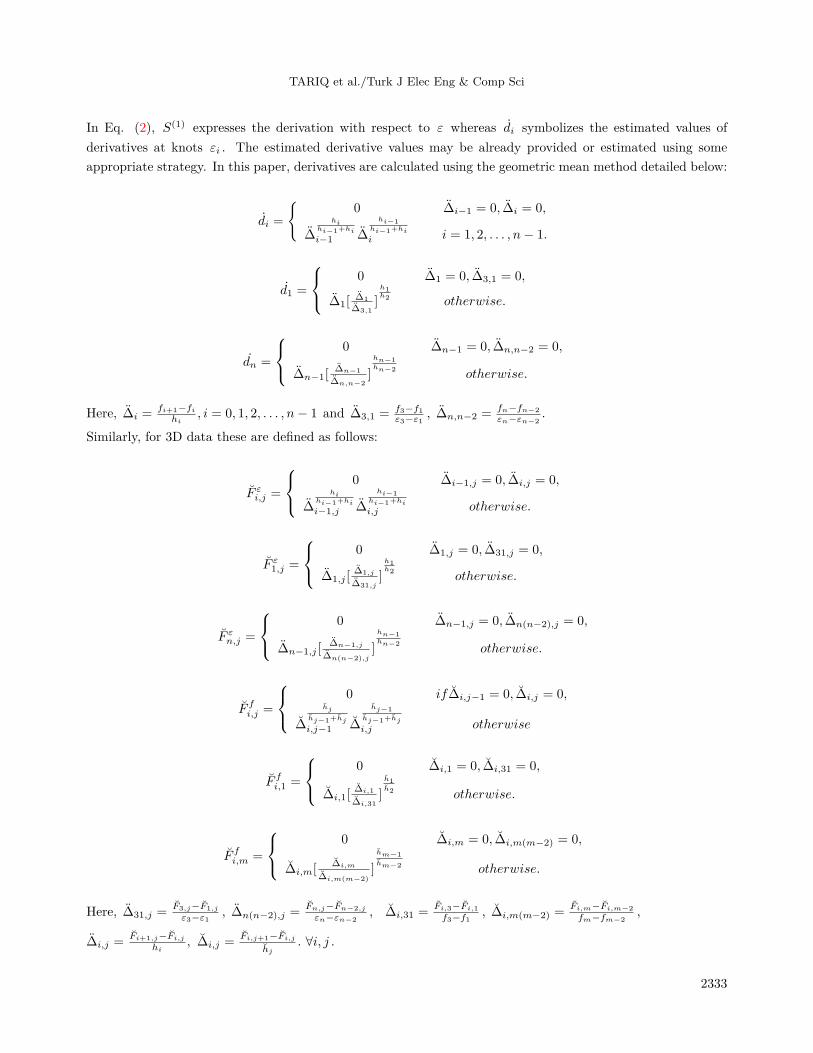
In Eq. (2), S(1) expresses the derivation with respect to ε whereas di symbolizes the estimated values ofderivatives at knots εi . The estimated derivative values may be already provided or estimated using someappropriate strategy. In this paper, derivatives are calculated using the geometric mean method detailed below:
di =
{0 ∆i−1 = 0, ∆i = 0,
∆hi
hi−1+hi
i−1 ∆
hi−1hi−1+hi
i i = 1, 2, . . . , n− 1.
d1 =
0 ∆1 = 0, ∆3,1 = 0,
∆1[∆1
∆3,1]h1h2 otherwise.
dn =
0 ∆n−1 = 0, ∆n,n−2 = 0,
∆n−1[∆n−1
∆n,n−2]
hn−1hn−2 otherwise.
Here, ∆i =fi+1−fi
hi, i = 0, 1, 2, . . . , n− 1 and ∆3,1 = f3−f1
ε3−ε1, ∆n,n−2 = fn−fn−2
εn−εn−2.
Similarly, for 3D data these are defined as follows:
F εi,j =
0 ∆i−1,j = 0, ∆i,j = 0,
∆hi
hi−1+hi
i−1,j ∆
hi−1hi−1+hi
i,j otherwise.
F ε1,j =
0 ∆1,j = 0, ∆31,j = 0,
∆1,j [∆1,j
∆31,j]
h1h2
otherwise.
F εn,j =
0 ∆n−1,j = 0, ∆n(n−2),j = 0,
∆n−1,j [∆n−1,j
∆n(n−2),j]
hn−1hn−2
otherwise.
F fi,j =
0 if∆i,j−1 = 0, ∆i,j = 0,
∆
hj
hj−1+hj
i,j−1 ∆
hj−1
hj−1+hj
i,j otherwise
F fi,1 =
0 ∆i,1 = 0, ∆i,31 = 0,
∆i,1[∆i,1
∆i,31]
h1h2 otherwise.
F fi,m =
0 ∆i,m = 0, ∆i,m(m−2) = 0,
∆i,m[∆i,m
∆i,m(m−2)]
hm−1
hm−2 otherwise.
Here, ∆31,j =F3,j−F1,j
ε3−ε1, ∆n(n−2),j =
Fn,j−Fn−2,j
εn−εn−2, ∆i,31 =
Fi,3−Fi,1
f3−f1, ∆i,m(m−2) =
Fi,m−Fi,m−2
fm−fm−2,
∆i,j =Fi+1,j−Fi,j
hi, ∆i,j =
Fi,j+1−Fi,j
hj. ∀i, j .
2333

TARIQ et al./Turk J Elec Eng & Comp Sci
Here, a fact worth mentioning is that for δi = ξi = 1 in the interval [εi, εi+1] , the rational cubic functionin Eq. (1) alters to the basic cubic Hermite spline. The rational cubic piecewise function supplied in Eq. (1) isadvanced to a rational bicubic function delineated over a given set of 3D data points (εi, fj , Fi,j) where 0 ≤ i ≤ n
and 0 ≤ j ≤ m on rectangular mesh D = [ε0, εn] × [f0, fm] . Let ρ : a = ε0 < ε1 < ε2 < ε3 < . . . < εn = b be the partitioning of [a, b] and ρ : c = f0 < f1 < f2 < f3 < . . . < fm = d be the partitioning of [c, d] . Weelucidate a bicubic partially blended rational function defined over rectangular patch [εi, εi+1]× [fj , fj+1] as:
S(ε, f) = −ABCT . (3)
Here,
B =
0 S(ε, fj) S(ε, fj+1)S(εi, f) S(εi, fj) S(εi, fj+1)
S(εi+1, f) S(εi+1, fj) S(εi+1, fj+1)
and A and C are row matrices given as:
A =[−1 a0(Φ) a1(Φ)
],
C =[−1 c0(Ψ) c1(Ψ)
],
where a0(Φ) = (1− Φ)2(1 + 2Φ) ,a1(Φ) = Φ2(3− 2Φ) , c0(Ψ) = (1−Ψ)2(1 + 2Ψ) ,c1(Ψ) = Ψ2(3− 2Ψ) .
Furthermore, Φ = (ε−εi)hi
and Ψ =(f−fj)
hjand 0 ≤ Φ ≤ 1 and 0 ≤ Ψ ≤ 1 , hi = εi+1 − εi, hj = fj+1 − fj .
Four rational cubic functions S(ε, fj), S(ε, fj+1), S(εi, f), S(εi+1, f) are acquired just like the one in Eq. (1)delineated on the boundary of rectangular patch [εi, εi+1]× [fj , fj+1] as:
S(ε, fj) =J0(1− Φ)3 + J1Φ(1− Φ)2 + J2Φ
2(1− Φ) + J3Φ3)
q1(Φ), (4)
and values corresponding to Ji, i = 0, 1, 2, 3 are:J0 = δi,jFi,j , J1 = δi,jFi,j + hiδi,jF
εi,j + 2Fi,j , J2 = ξi,jFi+1,j − ξi,jF
εi+1,jhi + 2F ε
i+1,j , J3 = ξi,jFi+1,j .q1(Φ) = δi,j(1− Φ)2 +Φ(1− Φ) + ξi,jΦ
2 .In similar fashion,
S(ε, fj+1) =K0(1− Φ)3 +K1Φ(1− Φ)2 +K2Φ
2(1− Φ) +K3Φ3
q2(Φ), (5)
where the values of Ki, i = 0, 1, 2, 3 are:K0 = δi,j+1Fi,j+1,K1 = δi,j+1Fi,j+1 + hiδi,j+1F
εi,j+1 + 2Fi,j+1 ,
K2 = ξi,j+1Fi+1,j+1 − ξi,j+1Fεi,j+1hi + 2Fi+1,j+1,K3 = ξi,j+1Fi+1,j+1,
q2(Φ) = δi,j+1(1− Φ)2 +Φ(1− Φ) + ξi,j+1Φ2 .
Likewise,
S(εi, f) =L0(1−Ψ)3 + L1Ψ(1−Ψ)2 + L2Ψ
2(1−Ψ) + L3Ψ3)
q3(Ψ), (6)
and values corresponding to Li, i = 0, 1, 2, 3 are:
2334

TARIQ et al./Turk J Elec Eng & Comp Sci
L0 = δi,jFi,j , L1 = δi,jFi,j + hj δi,j+1Ffi,j + 2Fi,j , L2 = ξi,jFi,j+1 − ξi,jF
fi,j+1hj + 2Fi,j+1, L3 = ξi,jFi,j+1 ,
q3(Ψ) = δi,j+1(1−Ψ)2 +Ψ(1−Ψ) + ξi,j+1Ψ2 .
In like manner,
S(εi+1, f) =M0(1−Ψ)3 +M1Ψ(1−Ψ)2 +M2Ψ
2(1−Ψ) +M3Ψ3
q4(Ψ), (7)
where the values corresponding to Mi, i = 0, 1, 2, 3 are:M0 = δi+1,jFi+1,j ,M1 = δi+1,jFi+1,j + hj δi+1,jF
fi+1,j + 2Fi+1,j ,
M2 = ξi+1,jFi+1,j+1 − ξi+1,jFfi+1,j+1hj + 2Fi+1,j+1,M3 = ξi+1,jFi+1,j+1,
q4(Ψ) = δi+1,j(1−Ψ)2 +Ψ(1−Ψ) + ξi+1,jΨ2 .
3. Monotone curve model
Assume (εi, fi) to be the provided dataset where 0 ≤ i ≤ n . Suppose fi, i = 0, 1, 2, . . . , n is a monotonicdataset, i.e. fi ≤ fi+1 . Also,hi = εi+1 − εi , ∆i =
fi+1−fihi
≥ 0 .
Further, let us assume that di, 0 ≤ i ≤ n , symbolizes the estimated derivative values at the points εi, 0 ≤ i ≤ n .Also, the vital monotonicity condition di ≥ 0, 1 ≤ i ≤ n is satisfied. The free parameters within the interval[εi, εi+1] are δi and ξi . The piecewise rational cubic function [2] is monotonically increasing if and only if
S(1)i (ε) ≥ 0∀ε ∈ [εi, εi+1] .
S(1)i (ε) =
a1(1− Φ)4 + a2Φ(1− Φ)3 + a3Φ2(1− Φ)2 + a4Φ
3(1− Φ) + a5Φ4
[qi(Φ)]2, (8)
where ai, 1 ≤ i ≤ 5 are given as:a1 = δ2i di, a2 = 2δiξi∆i+4δi∆i−2δiξidi+1 , a3 = 4δiξi∆i+2δi∆i+2ξi∆i+4∆i−δiξidi+1−2ξidi+1−2δidi−δiξidi ,a4 = 2δiξi∆i + 4ξi∆i − 2δiξidi, a5 = ξ2i di+1 .
Now S(1)i (ε) ≥ 0, iff aj > 0, 1 ≤ j ≤ 5 in all of the subintervals [εi, εi+1] . Consequently, the following
constraints have been derived on free parameters:
ξi >2∆i
di+1−∆i, δi >
2∆i
di−∆i, ξi >
2(di−∆i)
4∆i−di−di+1.
The above discussion can be summarized as follows:
Theorem 1 The rational cubic piecewise function in [2] retains monotonicity if in each subinterval [εi, εi+1], 0 ≤i ≤ n− 1, δi and ξi fulfill:
δi = λi +2∆i
di − ∆i
, λi > 0,
ξi = σi + max{0, 2∆i
di+1 − ∆i
,2(di − ∆i)
4∆i − di − di+1
}, σi > 0.
2335

TARIQ et al./Turk J Elec Eng & Comp Sci
4. Monotone surface model
Assume the given set of 3D data points (εi, fj , Fi,j) where 0 ≤ i ≤ n and 0 ≤ j ≤ m on rectangular mesh
D = [ε0, εn]× [f0, fm] such that the following conditions are met:� Fi,j < Fi+1,j , Fi,j < Fi,j+1 , F ε
i,j > 0 , F fi,j > 0, and ∆i,j > 0 , ∆i,j > 0,
where ∆i,j =Fi+1,j−Fi,j
hi, ∆i,j =
Fi,j+1−Fi,j
hj.
For the surface patch in [2] to be monotone, we only need to establish that the boundary curvesS(ε, fj), S(ε, fj+1), S(εi, f), andS(εi+1, f) are all monotone. First consider S(ε, fj) . It is known that S(ε, fj)
is surely monotone if S(1)i (ε, fj) > 0 .
S(1)i (ε, fj) =
A0(1− Φ)4 +A1Φ(1− Φ)3 +A2Φ2(1− Φ)2 +A3Φ
3(1− Φ) +A4Φ4)
[q1(Φ)]2. (9)
The values corresponding to Ai, i = 0, 1, 2, 3, 4 are:A0 = δ2i,jF
εi,j , A1 = 2δi,jξi,j∆i,j + 4δi,j∆i,j − 2δi,jξi,jFi+1,j ,
A2 = 4δi,jξi,j∆i,j + 2δi,j∆i,j + 2ξi,j∆i,j + 4∆i,j − δi,jξi,jFεi+1,j − 2ξi,jF
εi+1,j − 2δi,jF
εi,j − δi,jξi,jF
εi,j ,
A3 = 2δi,jξi,j∆i,j + 4ξi,j∆i,j − 2δi,jξi,jFεi,j A4 = ξ2i,jF
εi+1,j .
When S(1)i (ε, fj) > 0 , all Ai, i = 1, 2, 3 , are necessarily positive. Thus, A1 > 0, A2 > 0 , and A3 > 0 yield the
following constraints on δi,j and ξi,j :
δi,j > max{0, 2∆i,j
F εi+1,j−∆i,j
,2(F ε
i,j−∆i,j)
4∆i,j−F εi,j−F ε
i+1,j
}, ξi,j > max{0, 2∆i,j
F εi,j−∆i,j
}. Continuing in a similar fashion, S(ε, fj+1)
is said to be monotone if S(1)i (ε, fj+1) > 0.
S(1)i (ε, fj+1) =
B0(1− Φ)4 +B1Φ(1− Φ)3 +B2Φ2(1− Φ)2 +B3Φ
3(1− Φ) +B4Φ4)
[q2(Φ)]2. (10)
Here,B0 = δ2i,j+1F
εi,j+1, B1 = 2δi,j+1ξi,j+1∆i,j+1 + 4δi,j+1∆i,j+1 − 2δi,j+1ξi,j+1F
εi+1,j+1,
B2 = 4δi,j+1ξi,j+1∆i,j+1 + 2δi,j+1∆i,j+1 + 2ξi,j+1∆i,j+1 + 4∆i,j+1 − δi,j+1ξi,j+1Fεi+1,j+1 − 2ξi,j+1F
εi+1,j+1 −
2δi,j+1Fεi,j+1 − δi,j+1ξi,j+1F
εi,j+1 ,
B3 = 2δi,j+1ξi,j+1∆i,j+1 + 4ξi,j+1∆i,j+1 − 2δi,j+1ξi,j+1Fεi,j+1, B4 = ξ2i,j+1F
εi+1,j+1 .
S(1)i (ε, fj+1) > 0 where Bi, i = 0, 1, 2, 3, 4 are essentially positive. Thus, B1 > 0, B2 > 0 , and B3 > 0 yield the
following constraints on δi,j+1 and ξi,j+1 :
ξi,j+1 > max{0, 2∆i,j+1
F εi+1,j+1−∆i,j+1
, 2(F ε
i,j+1−∆i,j+1)
4∆i,j+1−F εi,j+1−F ε
i+1,j+1
} , δi,j+1 > max{0, 2∆i,j+1
F εi,j+1−∆i,j+1
} .
Likewise, S(εi, f) is monotone if S(1)i (εi, f) > 0 .
S(1)i (εi, f) =
C0(1−Ψ)4 + C1Ψ(1−Ψ)3 + C2Ψ2(1−Ψ)2 + C3Ψ
3(1−Ψ) + C4Ψ4)
[q3(Ψ)]2, (11)
whereC0 = δ2i,jF
fi,j , C1 = 2δi,j ξi,j∆i,j + 4δi,j∆i,j − 2δi,j ξi,jF
fi,j+1 ,
2336

TARIQ et al./Turk J Elec Eng & Comp Sci
C2 = 4δi,j ξi,j∆i,j + 2δi,j∆i,j + 2δi,j∆i,j + 4∆i,j − δi,j ξi,jFfi,j+1 − 2δi,jF
fi,j+1 − 2δi,jF
fi,j − δi,j ξi,jF
fi,j ,
C3 = 2δi,j ξi,j∆i,j + 4ξi,j∆i,j − 2δi,j ξi,jFfi,j , C4 = ξ2i,jF
fi,j+1 .
Similarly, for S(1)i (εi�, �f) > 0 , Ci�, i� = 0, 1, 2, 3, 4 should necessarily be positive. Here, C1 > 0, C2 > 0 , and
C3 > 0 yield the following constraints on δi,j and ξi,j �:
δi,j > max{0, 2∆i,j
F fi,j+1∆i,j
,2(F f
i,j−∆i,j)
4∆i,j−F fi,j−F f
i,j+1
}, ξi,j > max{0, (2∆i,j)
F fi,j−∆i,j
} . Lastly, S(εi+1, f) is considered to be
monotone if S(1)i (εi+1, f) > 0 .
S(1)i (εi+1, f) =
D0(1−Ψ)4 +D1Ψ(1−Ψ)3 +D2Ψ2(1−Ψ)2 +D3Ψ
3(1−Ψ) +D4Ψ4
[q4(Ψ)]2. (12)
Here we have:D0 = δ2i+1,jF
fi+1,j , D1 = 2δi+1,j ξi+1,j∆i+1,j + 4δi+1,j∆i+1,j − 2δi+1,j ξi+1,jF
fi+1,j+1 ,
D2 = 4δi+1,j ξi+1,j∆i+1,j + 2δi+1,j∆i+1,j + 2ξi+1,j∆i+1,j + 4∆i+1,j − δi+1,j ξi+1,jFfi+1,j+1 − 2ξi+1,jF
fi+1,j+1 −
2δi+1,jFfi+1,j − δi+1,j ξi+1,jF
fi+1,j ,
D3 = 2δi+1,j ξi+1,j∆i+1,j + 4ξi+1,j∆i+1,j − 2δi+1,j ξi+1,jFfi+1,j , D4 = ξ2i+1,jF
fi+1,j .
Furthermore, forS(1)i (εi+1, f) > 0 , Di, i = 0, 1, 2, 3, 4 essentially is positive. From D1 > 0, D2 > 0 , and D3 > 0 ,
we procure the following constraints on free parameters:
δi+1,j > max{0, 2∆i+1,j
F fi+1,j+1−∆i+1,j
,2(F f
i+1,j−∆i+1,j)
4∆i+1,j−F fi+1,j−F f
i+1,j+1
} , ξi+1,j > max{0, 2∆i+1,j
F fi+1,j−∆i+1,j
}. The following theorem
summarize the whole of the above argument:
Theorem 2 The bicubic partially blended rational function supplied in [2] provides the envisaging of monotonedata in the form of a monotone surface if in rectangular mesh Iij = [εi, εi+1]×[fj , fj+1] , the constraints providedas follows are satisfied by the free parameters:
δi,j = ´ci,j + max{0, 2∆i,j
F εi+1,j−∆i,j
,2(F ε
i,j−∆i,j)
4∆i,j−F εi,j−F ε
i+1,j
}, ´ci,j > 0;
ξi,j = ´di,j + max{0, 2∆i,j
F εi,j−∆i,j
}, ´di,j > 0;
δi,j+1 = ´ei,j + max{0, 2∆i,j+1
F εi,j+1−∆i,j+1
} , ´ei,j > 0;
ξi,j+1 = ´gi,j + max{0, 2∆i,j+1
F εi+1,j+1−∆i,j+1
, 2(F ε
i,j+1−∆i,j+1)
4∆i,j+1−F εi,j+1−F ε
i+1,j+1
} , ´gi,j > 0;
δi,j = ´ji,j + max{0, 2∆i,j
F fi,j+1∆i,j
,2(F f
i,j−∆i,j)
4∆i,j−F fi,j−F f
i,j+1
} , ´ji,j > 0;
ξi,j = ´ki,j + max{0, (2∆i,j)
F fi,j−∆i,j
} , ´ki,j > 0;
δi+1,j = ´li,j + max{0, 2∆i+1,j
F fi+1,j+1−∆i+1,j
,2(F f
i+1,j−∆i+1,j)
4∆i+1,j−F fi+1,j−F f
i+1,j+1
} , ´li,j > 0;
ξi+1,j = mi,j + max{0, 2∆i+1,j
F fi+1,j−∆i+1,j
} , mi,j > 0.
2337

TARIQ et al./Turk J Elec Eng & Comp Sci
5. Numerical examplesMonotonicity-conserving rational schemes developed in Section 3 and Section 4 have been applied on 2Dmonotone datasets (Table 1 and Table 2) and 3D monotone datasets (Table 3 and Table 4), correspondingto which monotone curves and surfaces are obtained as shown in Figure 1, Figure 2, Figure 3, and Figure 4.The tz and fz views of the monotone surface generated from the dataset in Table 3 are demonstrated in Figure5 and Figure 6, respectively. Similarly, Figure 7 and Figure 8 represent tz and fz views of the monotone surfaceproduced from the dataset in Table4.
Table 1. A 2D monotone dataset, I.
ti 1 2 3 4 5 6 7fi 0 5 9 13 17 20 21
Table 2. A 2D monotone dataset, II.
ti 2 3 6.5 7 7.5fi 2 3 17 23 29
Table 3. A 3D monotonic dataset generated by the function F (ε, f) =√ε+ f + 0.005 .
f/ε 0.1 1.49 2.52 3.49 3.50.1 0.4528 1.2629 1.6202 1.8960 1.8987
1.49 1.2629 1.7277 2.0037 2.2327 2.2349
2.52 1.6202 2.0037 2.2461 2.4525 2.4546
3.49 1.8960 2.2327 2.4525 2.6429 2.6448
3.5 1.8987 2.2349 2.4546 2.6448 2.6467
Table 4. A 3D monotonic dataset generated by the function F (ε, f) = exp(ε0.05 + f0.07) .
f/ε 2.5 11.10 25.652.5 0.4528 1.2629 1.6202
11.10 1.2629 1.7277 2.0037
25.65 1.6202 2.0037 2.2461
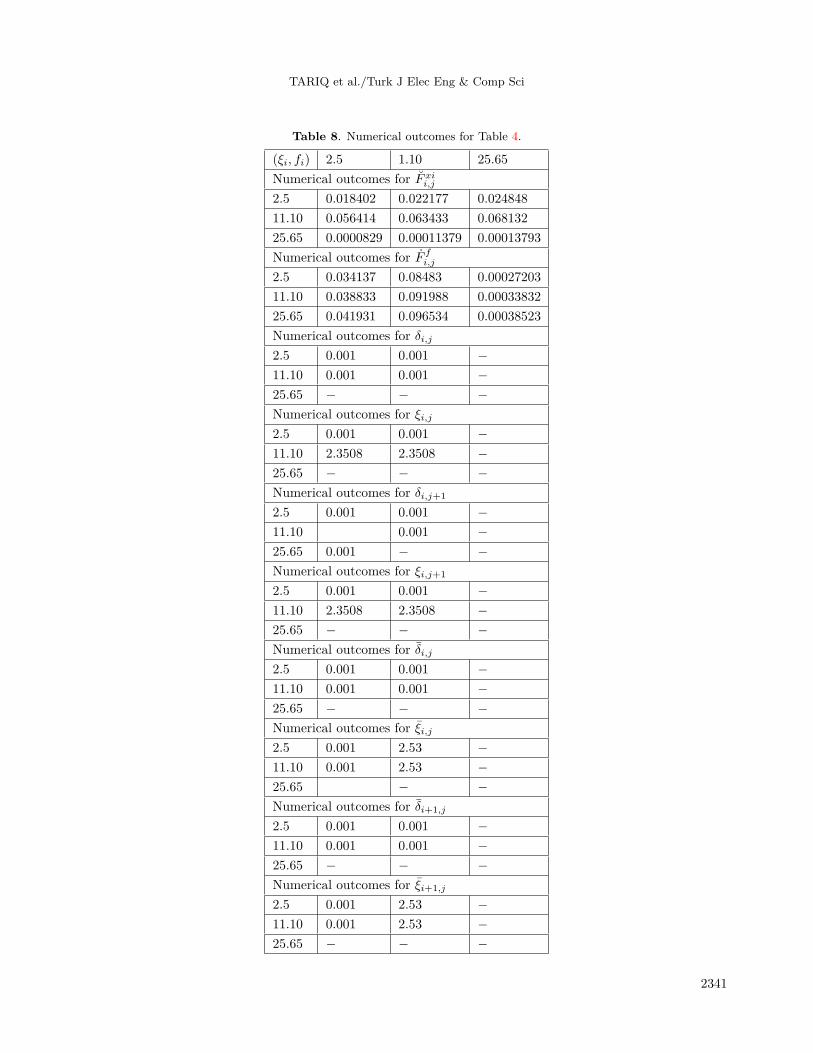
6. Numerical valuesThe values of the parameters and the derivatives involved in the proposed algorithm have been calculated usingMATLAB software and are presented in Table 5, Table 6, Table 7, and Table 8.
7. ConclusionA C1 rational cubic interpolating scheme put forward by the authors in [2] encompassing two parameters hasbeen used for the modeling of monotone two- and three-dimensional data evolving as an outcome of certain
2338

TARIQ et al./Turk J Elec Eng & Comp Sci
x-axis1 2 3 4 5 6 7
y-axis
0
5
10
15
20
25
x-axis2 3 4 5 6 7 8
y-axis
0
5
10
15
20
25
30
Figure 1. Monotonicity-conserving curve for dataset pro-vided in Table 1.
Figure 2. Monotonicity-conserving curve for dataset pro-vided in Table 2.
4
3
2
f-axis
1
00
1
t-axis
2
3
1
1.5
2
2.5
3
4
z-a
xis
z-axis
1
1.2
1.4
1.6
1.8
2
2.2
2.4
2.6
2.8
f-axis
0.5 1 1.5 2 2.5 3 3.5
Figure 3. Monotone surface generated from dataset inTable 3.
Figure 4. Monotone surface generated from dataset inTable 4.
Table 5. Numerical outcomes for Table 1.
i 1 2 3 4 5 6 7di 4.0000 4.0000 4.0000 4.0000 3.4641 1.7321 0.5000
δi 3.2321 3.2321 3.2321 3.2321 3.2321 3.2321 −ξi 1.3281 1.3281 1.3281 1.3281 1.3281 1.3281 −
Table 6. Numerical outcomes for Table 2.
i 1 2 3 4 5di 0.70893 1.3608 10.46 12 12
δi 0.5 0.5 0.5 0.5 −ξi 0.5 0.5 0.5 0.5 −
2339

TARIQ et al./Turk J Elec Eng & Comp Sci
Table 7. Numerical outcomes for Table 3.(ξi, fi) 0.1 1.49 2.52 3.49 3.5
Numerical outcomes for F εi,j
0.1 0.2813 0.0762 0.0486 0.0357 0.03561.49 0.4326 0.2945 0.2518 0.2252 0.22502.52 0.3131 0.2510 0.2234 0.2044 0.20423.49 0.2637 0.2240 0.2039 0.1892 0.18913.5 0.2599 0.2204 0.2005 0.1859 0.1858
Numerical outcomes for F fi,j
0.1 0.2813 0.4326 0.3131 0.2637 0.25991.49 0.0762 0.2945 0.2510 0.2240 0.22042.52 0.0486 0.2518 0.2234 0.2039 0.20053.49 0.0357 0.2252 0.2044 0.1892 0.18593.5 0.0356 0.2250 0.2042 0.1891 0.1858Numerical outcomes for δi,j0.1 0.001 0.001 0.001 0.001 −1.49 0.001 0.001 0.001 0.001 −2.52 0.001 0.001 0.001 0.001 −3.49 0.001 0.001 0.001 0.001 −Numerical outcomes for ξi,j0.1 0.001 0.001 0.001 0.001 −1.49 8.0909 20.25 28.506 36.173 −2.52 19.79 31.5 40.085 48.141 −3.49 2570.4 3687.5 4513.7 5291.1 −3.5 − − − − −Numerical outcomes for δi,j+1
0.1 0.001 0.001 0.001 0.0011.49 0.001 0.001 0.001 0.001 −2.52 0.001 0.001 0.001 0.001 −3.49 0.001 0.001 0.001 0.001 −3.5 − − − − −Numerical outcomes for ξi,j+1
0.1 0.001 0.001 0.001 0.001 −1.49 20.25 28.506 36.173 36.251 −2.52 31.5 40.085 48.141 48.224 −3.49 3687.5 4513.7 5291.1 5299.1 −3.5 − − − − −Numerical outcomes for δi,j0.1 0.001 0.001 0.001 0.001 −1.49 0.001 0.001 0.001 0.001 −2.52 0.001 0.001 0.001 0.001 −3.49 0.001 0.001 0.001 0.001 −3.5 − − − − −
Numerical outcomes for ξi,j0.1 0.001 8.0909 19.79 2570.4 −1.49 0.001 20.25 31.5 3687.5 −2.52 0.001 28.506 40.085 4513.7 −3.49 0.001 36.173 48.141 5291.1 −3.5 − − − − −Numerical outcomes for δi+1,j
0.1 0.001 0.001 0.001 0.0011.49 0.001 0.001 0.001 0.0012.52 0.001 0.001 0.001 0.0013.49 0.001 0.001 0.001 0.0013.5Numerical outcomes for ξi+1,j
0.1 0.001 8.0909 19.79 2570.4 −1.49 0.001 20.25 31.5 3687.5 −2.52 0.001 28.506 40.085 4513.7 −3.49 0.001 36.173 48.141 5291.1 −3.5 − − − − −
2340
TARIQ et al./Turk J Elec Eng & Comp Sci
Table 8. Numerical outcomes for Table 4.
(ξi, fi) 2.5 1.10 25.65
Numerical outcomes for F xii,j
2.5 0.018402 0.022177 0.024848
11.10 0.056414 0.063433 0.068132
25.65 0.0000829 0.00011379 0.00013793
Numerical outcomes for F fi,j
2.5 0.034137 0.08483 0.00027203
11.10 0.038833 0.091988 0.00033832
25.65 0.041931 0.096534 0.00038523
Numerical outcomes for δi,j
2.5 0.001 0.001 −11.10 0.001 0.001 −25.65 − − −Numerical outcomes for ξi,j
2.5 0.001 0.001 −11.10 2.3508 2.3508 −25.65 − − −Numerical outcomes for δi,j+1
2.5 0.001 0.001 −11.10 0.001 −25.65 0.001 − −Numerical outcomes for ξi,j+1
2.5 0.001 0.001 −11.10 2.3508 2.3508 −25.65 − − −Numerical outcomes for δi,j
2.5 0.001 0.001 −11.10 0.001 0.001 −25.65 − − −Numerical outcomes for ξi,j
2.5 0.001 2.53 −11.10 0.001 2.53 −25.65 − −Numerical outcomes for δi+1,j
2.5 0.001 0.001 −11.10 0.001 0.001 −25.65 − − −Numerical outcomes for ξi+1,j
2.5 0.001 2.53 −11.10 0.001 2.53 −25.65 − − −
2341

TARIQ et al./Turk J Elec Eng & Comp Sciz-axis
1
1.2
1.4
1.6
1.8
2
2.2
2.4
2.6
2.8
t-axis
0.5 1 1.5 2 2.5 3 3.5
30
20
f-axis
10
00
10
t-axis
20
8
9
10
11
12
30
z-a
xis
Figure 5. tz view of monotone surface generated fromdataset in Table 3.
Figure 6. fz view of monotone surface generated fromdataset in Table 3.
z-axis
8
8.5
9
9.5
10
10.5
11
11.5
t-axis
0 5 10 15 20 25 30
z-axis
8
8.5
9
9.5
10
10.5
11
11.5
f-axis
0 5 10 15 20 25 30
Figure 7. tz view of monotone surface generated fromdataset in Table 4.
Figure 8. fz view of monotone surface generated fromdataset in Table 4.
scientific phenomena. We then deduced certain constraints on both of these parameters to keep the shapeof monotonic 2D data. To estimate the derivative values, the geometric mean approach has been used. Theformulation of the monotonic C1 continuous rational cubic spline function is extended to a monotone rationalbicubic partially blended surface, where the data are guaranteed to be organized over a rectangular grid. Onceagain the parameters in the elucidation of the bicubic partially blended functions have been constrained formonotonicity. Eye-catching and appealing curves and surfaces are then acquired that can be used in systemsthat require such models.
References
[1] Hussain MZ, Sardraz M, Shaikh TS. Monotone data visualization using rational functions. World Appl Sci J 2012;16: 1496-1508.
2342

TARIQ et al./Turk J Elec Eng & Comp Sci
[2] Sardraz M, Hussain MZ, Nisar A. Positive data modeling using spline function. Appl Math Comput 2010; 216:2036-2049.
[3] Kvasov BI. Monotone and convex interpolation by weighted cubic splines. Comp Math Math Phys 2013; 53: 1428-1439.
[4] Ibraheem F, Hussain M, Hussain MZ. Monotone data visualization using rational trigonometric spline interpolation.Sci World J 2014; 2014: 602453.
[5] Hussain M, Hussain MZ. Convexity preserving piecewise rational bi-cubic interpolation. Computer Graphics andCAD/CAM 2008; 2: 14-24.
[6] Hussain M, Hussain MZ, Waseem A, Javaid M. GC1 shape preserving trigonometric surface. J Math Imaging Vis2014; 53: 21-41.
[7] Floater MS, Pena JM. GC1 monotonicity preservation on triangles. Math Comput 2000; 69: 1502-1519.
[8] Hussain MZ, Sarfraz M, Hussain F. Shape preserving positive trigonometric spline curves. Iran J Sci Technol A2016; 59: 1-13.
[9] Hussain MZ, Hussain M, Waseem A. Shape preserving trigonometric functions. Comp Appl Math 2014; 2: 411-431.
[10] Sarfraz M, Hussain MZ, Hussain M. Modeling rational spline for visualization of shaped data. Journal of NumericalMathematics 2013; 2: 63-88.
2343