monthly bulletin january 1999 - european central bank · ecb monthly bulletin • january 1999 3...
TRANSCRIPT
MO
NT
HL
Y B
UL
LE
TI
N
Ja
nu
ar
y 1
99
9
EU
RO
PE
AN
CE
NT
RA
L B
AN
K
M O N T H L YB U L L E T I N
J a n u a r y 1 9 9 9
EC
B
EZ
B
EK
T
BC
E
EK
P
EN

M O N T H L YB U L L E T I N
J a n u a r y 1 9 9 9

ECB Mon th l y Bu l l e t i n • J anua r y 19992
© European Central Bank, 1999
Address Kaiserstrasse 29
D-60311 Frankfurt am Main
Germany
Postal address Postfach 16 03 19
D-60066 Frankfurt am Main
Germany
Telephone +49 69 1344 0
Internet http://www.ecb.int
Fax +49 69 1344 6000
Telex 411 144 ecb d
This Bulletin was prepared under the responsibility of the Executive Board of the ECB. Translations are prepared and published by
the national central banks.
All rights reserved.
Reproduction for educational and non-commercial purposes permitted provided that the source is acknowledged.
The cut-off date for the statistics included in this issue was 7 January 1999.
ISSN 1561-0136

ECB Month l y Bu l l e t i n • January 1999 3
Foreword 5
The Eurosystem and the European System of Central Banks (ESCB) 7
Editorial 9
The euro area at the start of Stage Three 11
Economic developments in the euro area 17
The stability-oriented monetary policy strategy of the Eurosystem 39
Euro area statistics 1*
Chronology of monetary policy measures of the Eurosystem 37*
Documents published by the European Central Bank (ECB) 40*
Contents

ECB Month l y Bu l l e t i n • January 19994

ECB Month l y Bu l l e t i n • January 1999 5
The Monthly Bulletin of the European CentralBank (ECB), the first issue of which you nowhave at hand, is one of the most importantmeans of written communication for the ECB.In its Monthly Bulletin the ECB will explain tothe public the monetary policy decisions takenby the Governing Council of the ECB. Througha comprehensive economic analysis, it will aimat enhancing the transparency of monetarypolicy. It will thus constitute an indispensableform of support for a successful single monetarypolicy of the “Eurosystem”, comprising the ECBand the national central banks (NCBs) of the 11EU Member States which have adopted the eurofrom the start of Stage Three of Economic andMonetary Union. The Monthly Bulletin will betranslated by the NCBs. The publication of theMonthly Bulletin will also fulfil the ECB’sobligation to publish at least quarterly reportson the activities of the European System ofCentral Banks (ESCB) (Article 15.1 of theStatute of the ESCB).
While being subject to further development andimprovement, the contents of this first issue ofthe Monthly Bulletin should set a standard forfuture issues. The “Editorial” will summarisethe aspects on which monetary policy decisionsare based, explaining these from the point ofview of the stability-oriented monetary policystrategy of the Eurosystem, whether or not theGoverning Council of the ECB decides tochange the ECB interest rates. These aspects
will be further expounded in the section on“Economic developments in the euro area”. Inthe quarterly version of the Monthly Bulletin –to be published in March, June, September andDecember every year – this section will be moreextensive and will also cover developments infiscal policies. The third standard component ofthe Monthly Bulletin is a section on “Euro areastatistics”, which will contain a comprehensiveset of tables and charts supplying importanteconomic information on the euro area.Furthermore, the Monthly Bulletin will includea chronology of monetary policy measures, aswell as material informing readers about theECB’s publications. We shall also publish articleson various matters related to the design andconduct of monetary policy and on othermatters relevant for the ECB in the MonthlyBulletin. In particular, issues which are relevantfor the success of the single monetary policyand the stability of the euro will be addressed,including such themes as wage and labourmarket developments, fiscal policies andstructural rigidities. Other central bankingthemes will also be addressed.
With all these efforts aimed at providingcomprehensive information, our intention is todemonstrate that the ECB will do its utmost toperform its task of maintaining price stability forthe benefit of all European citizens to ensurethat their confidence in their new currency iswell founded.
Frankfurt am Main, January 1999
Willem F. DuisenbergPresident
Foreword

ECB Month l y Bu l l e t i n • January 19996

ECB Month l y Bu l l e t i n • January 1999 7
The Eurosystem and the EuropeanSystem of Central Banks (ESCB)
The Treaty establishing the European Community and the Statute of the European System of Central Banksand of the European Central Bank confer several tasks upon the European System of Central Banks (ESCB)which have to be carried out by the European Central Bank (ECB) and the national central banks (NCBs).To enhance transparency and enable the public to grasp more easily the very complex structure ofEuropean central banking, the Governing Council of the ECB has decided to adopt the term “Eurosystem”as a user-friendly expression denoting the composition in which the ESCB performs its basic tasks.
The Eurosystem
The Eurosystem comprises the ECB and theNCBs of the Member States which have adoptedthe euro in Stage Three of Economic andMonetary Union (EMU). There are currently11 NCBs in the Eurosystem (see the chart above).If and when all 15 Member States participate inthe euro area, the term “Eurosystem” willbecome a synonym for the ESCB.
The Eurosystem is governed by the GoverningCouncil and the Executive Board of the ECB.
The Governing Council comprises all themembers of the Executive Board and thegovernors of the NCBs of the Member Stateswhich have adopted the euro.
The Executive Board comprises the President, theVice-President and four other members appointed
by the Heads of State or Government of theMember States which have adopted the euro.
The European System of CentralBanks (ESCB)
The ESCB is composed of the ECB and theNCBs of all 15 Member States, i.e. it includes, inaddition to the members of the Eurosystem,the NCBs of the Member States which have notadopted the euro from the start of Stage Threeof EMU.
The ESCB is governed by the Governing Counciland the Executive Board of the ECB and, as athird decision-making body of the ECB, by theGeneral Council.
The General Council comprises the President,the Vice-President and the governors of all 15NCBs.
EUROSYSTEM
EU
RO
PE
AN
SY
ST
EM
OF
CE
NT
RA
LB
AN
KS
(E
SC
B)
European Central Bank (ECB)
Governing Council
Executive Board
Governing Council
Executive Board
Gen
eral
Co
un
cil
Gen
eral
Co
un
cil European Central Bank (ECB)
DanmarksNationalbank
Bank of Greece
Sveriges Riksbank
Bank of England
Nationale Bank van België/Banque Nationale de Belgique
Deutsche Bundesbank
Banco de Espan̄a
Banque de France
Central Bank of Ireland
Banca d’Italia
DanmarksNationalbank
Bank of Greece
Sveriges Riksbank
Bank of England
Nationale Bank van België/Banque Nationale de Belgique
Deutsche Bundesbank
Banco de Espan̄a
Banque de France
Central Bank of Ireland
Banca d’Italia
Banque centrale duLuxembourg
De Nederlandsche Bank
Oesterreichische Nationalbank
Banco de Portugal
Suomen Pankki
Banque centrale duLuxembourg
De Nederlandsche Bank
Oesterreichische Nationalbank
Banco de Portugal
Suomen Pankki

ECB Month l y Bu l l e t i n • January 19998

ECB Month l y Bu l l e t i n • January 1999 9
The Eurosystem – comprising the EuropeanCentral Bank (ECB) and the national centralbanks of the 11 Member States which adoptedthe euro on 1 January 1999 – has assumed thetask of conducting the single monetary policyfor the euro area. On 22 December 1998 theGoverning Council of the ECB announced theECB interest rates to be applied under the newregime and indicated that it regarded these ratesas appropriate for the foreseeable future. Thisannouncement was deemed important toeliminate uncertainties about the monetarypolicy stance of the Eurosystem at the start ofStage Three and to contribute to a smoothchangeover to Monetary Union. Three decisionswere adopted in this context on 22 December1998 and confirmed on 7 January 1999 by theGoverning Council.
First, it was decided that the initial mainrefinancing operations would be conducted asfixed rate tenders at a rate of 3%. Already inearly December 1998 the Governing Councilhad judged this level to be compatible with themaintenance of price stability in the euro areaover the medium term. The arguments leadingto the decision are summarised below and areelaborated in more detail in the section on“Economic developments in the euro area” inthis Bulletin.
Second, the interest rate for the marginal lendingfacility was set at 4.5% and the interest rate forthe deposit facility was set at 2% at the start ofStage Three, i.e. 1 January 1999. The asymmetriccharacter of this corridor around the mainrefinancing rate underlines the intentionexpressed by the Governing Council to continueto apply a level of 3% for the main refinancingrate, which is very low by historical standards,for the foreseeable future.
Third, the Governing Council decided to narrowtemporarily the corridor between the interestrates on the two standing facilities to 50 basispoints. This was achieved by setting the marginallending rate at 3.25% and the deposit facilityrate at 2.75% for the period from 4 to21 January 1999. The purpose of this measurewas to smooth the adaptation of marketparticipants to the integrated money market in
Editorial
the euro area during the initial days of MonetaryUnion. However, since the maintenance of sucha narrow corridor over a prolonged period oftime may hamper the development of anefficient euro area money market, theGoverning Council has also announced that itintends to terminate this transitional measurefollowing its meeting on 21 January 1999.
The aforementioned decisions on the levels ofthe ECB interest rates were taken in accordancewith the announced monetary policy strategy,which is presented in detail in this Bulletin inthe article entitled “The stability-orientedmonetary policy strategy of the Eurosystem”.This strategy is based on a quantitative definitionof price stability, namely that an annual increasein the Harmonised Index of Consumer Prices(HICP) of below 2% can be considered as beingcompatible with this primary objective ofmonetary policy. Furthermore, to achieve thisobjective, the strategy is based on two pillars.The first consists in a prominent role for money,as signalled by the announcement of aquantitative reference value of 4½% for thegrowth rate of the broad monetary aggregateM3 which is regarded as being compatible withprice stability. The second comprises a broadlybased assessment of the outlook for pricedevelopments and the risks to price stabilityusing financial and other economic indicators.
For almost two years now HICP increases havebeen in line with the Eurosystem’s definition ofprice stability. In November 1998 the 12-monthrise in the HICP was 0.9%. Taking a forward-looking perspective, the environment for pricedevelopments is determined by the followingfactors. With regard to monetary growth, thefirst pillar of the strategy, it can be observedthat M3 showed a stable trend in 1998. Thethree-month moving average of the 12-monthgrowth rate of M3 up to November 1998 stoodat around 4.7%. This rate of monetary expansionis very close to the reference value of 4½%.
With regard to other economic indicators, thesecond pillar, financial indicators support theview that market participants expect the currentclimate of price stability to continue in themedium to longer term. At the start of Stage

ECB Month l y Bu l l e t i n • January 199910
Three nominal short-term and long-terminterest rates in the euro area have reachedlevels which are very low by historical standards.Real interest rates are also significantly belowtheir long-term averages.
With regard to indicators for real economicactivity in the euro area, many uncertaintiessurround the outlook for the world economyat the start of Stage Three. These uncertaintieshave tended to have a negative impact onindustrial confidence and have contributed to aless optimistic view of future economic growthin the euro area. More recently a decline hasalso been observed in outstanding orders and,to a lesser extent, in capacity utilisation.Furthermore, Eurostat’s first estimate of realGDP growth in the third quarter of 1998 was2.4% on an annual basis, following an increase ofaround 3% in the first half of last year. All thishas fostered expectations of a slowdown in thegrowth of economic activity in the short term.
At the same time, however, consumerconfidence resumed its earlier increase and theannual increase in retail sales showed anacceleration in the months up toSeptember 1998. Furthermore, the increase inemployment led to a further small reduction inthe unemployment rate (from 11.0% in thesummer months to 10.8% in November).Subdued wage growth in the first half of 1998may have supported this. Low wage growthwas also a major factor underpinning the lowrate of increase in the HICP. Another key –though possibly temporary – factor which hascontributed to bringing down HICP inflation toits current levels was the falling trend in energyand other commodity prices.
On balance, the evidence suggests that thereare no indications of significant upward ordownward pressures on price developments at
this juncture. Some risks to price stability cannonetheless be identified. On the downwardside, the possibility cannot be ruled out thatthe negative repercussions of recent globaldevelopments on economic growth in the euroarea could turn out to be more serious than iscurrently anticipated. This might also have afurther dampening effect on import anddomestic prices. On the upward side, wagedemands in excess of labour productivity growthand a relaxation of the fiscal stance in the euroarea could represent sources of inflationary riskin the future. Overall, however, the outlook forprice developments in the euro area can beregarded as being broadly balanced.
Against this background, the Governing Councilconfirmed at its meeting on 7 January 1999 thata level of 3% for the Eurosystem’s mainrefinancing rate should, for the foreseeablefuture, be appropriate in order to maintain thecurrent climate of price stability in the euroarea, in line with the Eurosystem’s primaryobjective.
As is also observed in this Bulletin in the articleentitled “The euro area at the start of StageThree”, the euro area enjoys, in many respects,a favourable starting position, and price stabilityis one aspect of this. At the same time, there isalso ample evidence to suggest that the euroarea faces many structural challenges, first andforemost the problem of high unemployment.These challenges will need to be addressed bymeans of determined structural adjustmentmeasures taken in other areas of economicpolicy. This will also be vital for ensuring thestability of the euro over the longer term. Thecontribution of monetary policy consists inmaintaining price stability and establishingconfidence in the continuation of its efforts,thereby creating the conditions necessary forthe sustained, non-inflationary growth of outputand employment.

11ECB Month l y Bu l l e t i n • January 1999
The euro area at the start of Stage Three
The start of the single monetary policy of the Eurosystem for the euro area marked the beginning of a newera in the process of European economic integration. While important fields of economic policy, includingfiscal policy, will remain primarily the responsibility of the 11 participating Member States, monetary policyis now determined at the euro area level. When deciding on monetary policy, the Governing Council of theEuropean Central Bank (ECB) will focus on euro area-wide economic data within the framework of itsmonetary policy strategy adopted in late 1998 (see “The stability-oriented monetary policy strategy of theEurosystem” in this Bulletin). Many of the key features of the euro area as a whole, such as the size andopenness of the economy and the financial structure, are quite different from those of the individualMember States and should rather be compared with those of the United States and Japan. Thesecharacteristics should be borne in mind when undertaking economic analyses of the euro area. In order tofamiliarise the public at large with the euro area economy, this article highlights its key features. In addition,it describes the macroeconomic situation prevailing at the start of Stage Three, so as to provide a starting-point for the first, more detailed commentary on recent developments in the euro area (see “Economicdevelopments in the euro area” in this Bulletin).
1 Key features of the euro area
The euro area: a large economy witha significant weight in the worldeconomy
Putting the euro area into perspective (seeTable 1), the most striking feature is that itcomprises formerly small and medium-sizedeconomies, which have joined together to forman economy with a large internal market. Indeed,with a share of world GDP of 15%, the euroarea is one of the largest economies in theworld, possessing a significant purchasing powerwhich is matched only by that of the UnitedStates. In comparison, the largest Member Statein the euro area accounts for only just over 4%of world GDP, while the individual shares of thesmaller ones do not exceed 1%.
Being a large economy, the “degree ofopenness” of the euro area is much smallerthan that of the individual Member States. Witha ratio of exports of goods to euro area-wideGDP standing at around 14% (after adjusting forintra-euro area trade), the euro area’s degreeof openness is by and large comparable to thatof the United States and Japan. This contrastswith the position of individual euro areacountries, which were previously seen as “smallor medium-sized open economies”, with, forexample, export ratios (including intra-euro areatrade) ranging from 19% to 62%, thus giving anaverage for the countries in the euro area as awhole of around 35%. The share of the euro
area in total world exports (of goods) amountsto almost 16%, which substantially exceeds theshares of both the United States and Japan.Machinery and transport equipment, othermanufactured articles and chemicals accountedfor the bulk of trade effected with, in order oftheir share of trade, the United Kingdom, theUnited States, Switzerland and Japan, whichtogether account for a large part of euro areaexternal trade. For the euro area as a whole,trade in services is less significant and it isestimated not to have exceeded 4% of GDP in1997.
Similarities to and differences fromthe United States and Japan
When considering other features of the euroarea, it may be more appropriate to makecomparisons with the United States and Japanrather than with the individual Member States,and to point to areas of similarity anddifferences. Patterns of production are broadlysimilar to those of the United States and Japan.Primary production, such as agriculture, fishingand forestry, accounts for around 2% of totaloutput in all three economies. The servicessector in the euro area accounts for about 67%of total production, which is a smaller sharethan in the United States (72%) but larger thanin Japan (59%). The industrial sector (includingconstruction) accounts for 31% of total
ECB Month l y Bu l l e t i n • January 199912
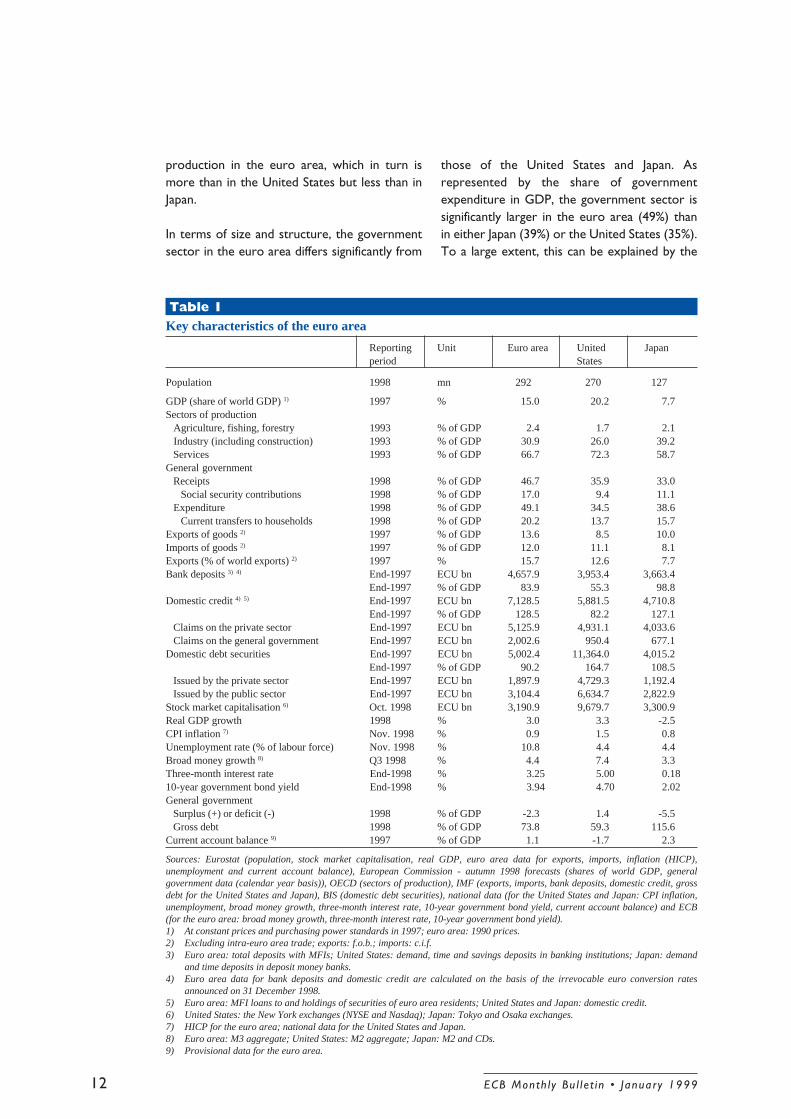
Table 1Key characteristics of the euro area
Reporting Unit Euro area United Japanperiod States
Population 1998 mn 292 270 127
GDP (share of world GDP) 1) 1997 % 15.0 20.2 7.7Sectors of production Agriculture, fishing, forestry 1993 % of GDP 2.4 1.7 2.1 Industry (including construction) 1993 % of GDP 30.9 26.0 39.2 Services 1993 % of GDP 66.7 72.3 58.7General government Receipts 1998 % of GDP 46.7 35.9 33.0 Social security contributions 1998 % of GDP 17.0 9.4 11.1 Expenditure 1998 % of GDP 49.1 34.5 38.6 Current transfers to households 1998 % of GDP 20.2 13.7 15.7Exports of goods 2) 1997 % of GDP 13.6 8.5 10.0Imports of goods 2) 1997 % of GDP 12.0 11.1 8.1Exports (% of world exports) 2) 1997 % 15.7 12.6 7.7Bank deposits 3) 4) End-1997 ECU bn 4,657.9 3,953.4 3,663.4
End-1997 % of GDP 83.9 55.3 98.8Domestic credit 4) 5) End-1997 ECU bn 7,128.5 5,881.5 4,710.8
End-1997 % of GDP 128.5 82.2 127.1 Claims on the private sector End-1997 ECU bn 5,125.9 4,931.1 4,033.6 Claims on the general government End-1997 ECU bn 2,002.6 950.4 677.1Domestic debt securities End-1997 ECU bn 5,002.4 11,364.0 4,015.2
End-1997 % of GDP 90.2 164.7 108.5 Issued by the private sector End-1997 ECU bn 1,897.9 4,729.3 1,192.4 Issued by the public sector End-1997 ECU bn 3,104.4 6,634.7 2,822.9Stock market capitalisation 6) Oct. 1998 ECU bn 3,190.9 9,679.7 3,300.9Real GDP growth 1998 % 3.0 3.3 -2.5CPI inflation 7) Nov. 1998 % 0.9 1.5 0.8Unemployment rate (% of labour force) Nov. 1998 % 10.8 4.4 4.4Broad money growth 8) Q3 1998 % 4.4 7.4 3.3Three-month interest rate End-1998 % 3.25 5.00 0.1810-year government bond yield End-1998 % 3.94 4.70 2.02General government Surplus (+) or deficit (-) 1998 % of GDP -2.3 1.4 -5.5 Gross debt 1998 % of GDP 73.8 59.3 115.6Current account balance 9) 1997 % of GDP 1.1 -1.7 2.3
Sources: Eurostat (population, stock market capitalisation, real GDP, euro area data for exports, imports, inflation (HICP),unemployment and current account balance), European Commission - autumn 1998 forecasts (shares of world GDP, generalgovernment data (calendar year basis)), OECD (sectors of production), IMF (exports, imports, bank deposits, domestic credit, grossdebt for the United States and Japan), BIS (domestic debt securities), national data (for the United States and Japan: CPI inflation,unemployment, broad money growth, three-month interest rate, 10-year government bond yield, current account balance) and ECB(for the euro area: broad money growth, three-month interest rate, 10-year government bond yield).1) At constant prices and purchasing power standards in 1997; euro area: 1990 prices.2) Excluding intra-euro area trade; exports: f.o.b.; imports: c.i.f.3) Euro area: total deposits with MFIs; United States: demand, time and savings deposits in banking institutions; Japan: demand
and time deposits in deposit money banks.4) Euro area data for bank deposits and domestic credit are calculated on the basis of the irrevocable euro conversion rates
announced on 31 December 1998.5) Euro area: MFI loans to and holdings of securities of euro area residents; United States and Japan: domestic credit.6) United States: the New York exchanges (NYSE and Nasdaq); Japan: Tokyo and Osaka exchanges.7) HICP for the euro area; national data for the United States and Japan.8) Euro area: M3 aggregate; United States: M2 aggregate; Japan: M2 and CDs.9) Provisional data for the euro area.
production in the euro area, which in turn ismore than in the United States but less than inJapan.
In terms of size and structure, the governmentsector in the euro area differs significantly from
those of the United States and Japan. Asrepresented by the share of governmentexpenditure in GDP, the government sector issignificantly larger in the euro area (49%) thanin either Japan (39%) or the United States (35%).To a large extent, this can be explained by the

13ECB Month l y Bu l l e t i n • January 1999
existence of different social security systems.Government current transfers to households ineuro area countries, as a share of GDP, arerelatively high compared with the United Statesand Japan. Another noticeable difference is thatthe proportion of GDP devoted to the provisionof collective services by the government sectoris also higher in the euro area than in either theUnited States or Japan. Also, with respect tothe structure of government receipts, in theeuro area and in Japan social securitycontributions represent about one-third of thegovernment’s current revenue, compared withonly one-quarter in the United States. Asregards tax income, the governments of boththe United States and Japan rely more on directtaxation, whereas in the euro area indirect taxesrepresent a higher share of tax revenue.
Turning to a number of key monetary andfinancial indicators, several structural differencesbetween the euro area’s financial system andthe financial systems of the United States andJapan may be noted. The key difference, inparticular from the United States, lies in therelative roles played by banks and securitiesmarkets. Whereas the euro area’s financialsystem is predominantly based on bankingproducts and equity financing plays only a limitedrole, in the United States equity and debtsecurities markets provide the principal meansof financing and saving.
This general picture of the financial structure ofthe euro area can be illustrated by reference tovarious indicators (see Table 1). Bank deposits,if measured relative to GDP, are more significantin the euro area (84%) than in the United States(55%), but less important than in Japan (99%).Similarly, the outstanding amount of domesticbank credit, both in absolute terms and relativeto GDP, is far larger in the euro area than in the
United States, although it is comparable, as ashare of GDP, to that in Japan. In the euro areaa relatively large amount of bank credit isextended to general government. By contrast,the amount of domestic debt securities relativeto GDP in the United States far exceeds theamounts in either the euro area or Japan. Inabsolute terms, the outstanding amount ofdomestic debt securities in the United States, atECU 11,364 billion, was more than twice that inthe euro area at the end of 1997, and thedifference is even more pronounced in terms ofsecurities issued by the private sector. Finally,stock market capitalisation is also far higher inthe United States than in the euro area andJapan.
Labour market characteristics also differsubstantially between the euro area and thetwo other economies. The latest overallunemployment rate in the euro area (10.8%) isfar higher than that in the United States (4.4%),and differences are accounted for by a host offactors, including structural features of the twolabour markets, such as wage and non-wagelabour costs, employment protection legislationand the scale and duration of unemploymentbenefits. From a medium-term perspective,experience also suggests that, for a comparablelevel of real GDP growth, the euro area hasexperienced much weaker employment growththan the United States. Also, by contrast withthe United States, there has been a clearasymmetric response to fluctuations ineconomic activity, such that each downturn hasbrought about a higher level of unemploymentin the euro area. However, labour markets arenotoriously difficult to compare by referring tomeasured unemployment rates alone. This isparticularly true in the case of Japan, where,despite persistent weakness of the economy,the official unemployment rate is also only 4.4%.

ECB Month l y Bu l l e t i n • January 199914
2 The economic situation in the euro area at the start of Stage Three
Monetary and financial developmentsreflect an environment of pricestability
The broad monetary aggregate M3 has followeda rather smooth path, with growth rates ofbetween 3.5% and 5% over the past two years.This monetary trend can be regarded ascompatible with ongoing price stability andsustainable economic growth in the euro area.At the same time, interest rates declined allalong the maturity spectrum, on account of theimprovement in the price environment. Theeuro area average three-month interbank ratehas shown a trend decline from a level of morethan 7% in spring 1995 to 3.25% at the end of1998. This decline reflects the achievement ofprice stability in the euro area and the increasingstability of intra-euro area exchange rates beforethe start of Stage Three. The euro area long-term interest rate (as measured by the averageof 10-year government bond yields) has declinedfrom more than 9½% in early 1995 to justbelow 4% at the end of December 1998. In realterms, i.e. corrected for the decline in inflation,the long-term interest rate has fallen by around3½ percentage points since early 1995 toaround 3% at end-1998. Within the euro area,the gradual disappearance of exchange rate riskpremia, the reduction in inflation risk premia,the closing of short-term interest ratedifferentials and the progress towards fiscalconsolidation which have taken place over thepast few years have all played a positive role inthis respect.
Increase in consumer prices ataround 1%
Focusing on more recent trends, price increasesas measured by the Harmonised Index ofConsumer Prices (HICP) have declined fromaround 1.6% in mid-1997 to a level of 0.9% inNovember 1998. This was mainly due to alower rate of increase in goods prices, of 0.3%,whereas the price increase for servicesremained broadly unchanged in 1998 at around2%. An important factor underlying lower
goods price increases in the recent past hasbeen the considerable decline in oil and othercommodity prices since their 1997 peak.Moreover, growth in compensation peremployee slowed further in 1998 and unitlabour costs declined slightly over the mostrecent quarters for which data are available.
Robust output growth in 1998, butslowdown in the course of the year
Following a recovery in 1997, real GDP growthin the euro area accelerated further in 1998 asa whole, being increasingly driven by domesticdemand rather than by net exports. Privateconsumption has accounted for the largestsingle contribution to GDP growth in recentquarters, while fixed investment has expandedless strongly. However, against the backgroundof a worsening of the external environment,the risk increased during the course of 1998that the expansion in the euro area would notcontinue at its recent pace, and real GDPgrowth slowed after the summer months, fallingfrom 3% in the first half of 1998 to 2.4% in thethird quarter, compared with the correspondingperiod in the previous year. This coincidedwith a deterioration in industrial confidence,while consumer confidence remained athistorically high levels.
Unemployment rate declinesgradually as employment recovers
Notwithstanding the cyclical improvement ineconomic activity, unemployment in the euroarea as a whole remains high. However, itdeclined slightly in 1998, following a pick-up inemployment growth that started inearly 1997. According to Eurostat, thestandardised unemployment rate in the euroarea declined to 10.8% in autumn 1998, i.e. tothe lowest level in five years.

15ECB Month l y Bu l l e t i n • January 1999
Improvements in fiscal positions havestalled
Compared with the progress in fiscalconsolidation achieved in previous years, only asmall further reduction in budgetary deficitsacross the euro area was achieved in 1998. Theaverage deficit-to-GDP ratio in the euro area isestimated by the European Commission to havedeclined to 2.3% in 1998 from 2.5% in theprevious year. This reduction, however, wasthe effect of favourable cyclical influences andlower interest payments. According to theEuropean Commission, adjusting the deficit ratiofor cyclical effects shows that the remaining“structural deficit” in the euro area in factdeteriorated slightly in 1998, rather than havingimproved. This would be the first deteriorationin the cyclically adjusted deficit ratio since 1991,which contrasts with the commitment enshrinedin the Stability and Growth Pact to respect themedium-term budgetary objective of achievingfiscal positions “close to balance or in surplus”.Moreover, the primary balance ratio is alsoestimated to have worsened in 1998 for thefirst time in several years. While the share ofgovernment expenditure in GDP appears to beon a declining trend after reaching a peak in1993, the ratio of euro area governmentrevenue to GDP declined in 1998 afterincreasing in the period 1995-97. In the euroarea as a whole taxes increased slightly in 1998,whereas social security contributions werelower.
On average, the euro area general governmentdebt is estimated by the European Commissionto have been 73.8% of GDP in 1998,1.2 percentage points less than in 1997.Government debt ratios in the euro area havebeen falling since 1996, not only because of thereduction in deficits, but also on account of thebenefits accruing from a number of financialtransactions, including, most notably,privatisation. However, debt ratios in the euroarea as a whole are still far above the referencelevel of 60% of GDP laid down in ProtocolNo. 5 to the Treaty establishing the EuropeanCommunity, thus limiting substantially thebudgetary room for manoeuvre in MemberStates. At the same time, deficit ratios are still
too high to set debt ratios on a rapidly decliningpath.
Euro area currencies appreciatedslightly
In 1998 euro area currencies appreciated byabout 2.1% on average in nominal terms and byabout 1.5% in real terms against their majortrading partner currencies, compared with ayear earlier. However, this appreciation - duemainly to a weakening of the US dollar and thepound sterling in the second and third quartersof 1998 - took place against the background ofa marked depreciation in 1997, when, driven bythe exceptional strengthening of the US dollarand the pound sterling, euro area currencieshad fallen by about 9% vis-à-vis their tradingpartner currencies. As a result, on the eve ofStage Three, euro area currencies stood, ineffective terms, still somewhat below theiraverage levels of the past few years.
On 31 December 1998, in accordance withArticle 1091 (4) of the Treaty establishing theEuropean Community, the irrevocableconversion rates for the euro were adopted bythe EU Council (see Table 2), upon a proposalfrom the European Commission and afterconsultation of the ECB. In compliance with thelegal framework for the use of the euro, theirrevocable conversion rate for the euro vis-à-vis each participating currency is the only rateto be used for conversion either way between
Table 2Irrevocable euro conversion rates
EUR 1 =
Belgium BEF 40.3399Germany DEM 1.95583Spain ESP 166.386France FRF 6.55957Ireland IEP .787564Italy ITL 1936.27Luxembourg LUF 40.3399Netherlands NLG 2.20371Austria ATS 13.7603Portugal PTE 200.482Finland FIM 5.94573

ECB Month l y Bu l l e t i n • January 199916
the euro and the national currency unit andalso for conversions between national currencyunits. The last official ECU (and first euro) rateagainst the US dollar was set at USD 1.168 on31 December 1998. The euro opened trading inAustralia on 4 January 1999 at USD 1.175. InEurope the euro started trading at USD 1.1855.
External accounts recently affectedby the deterioration in the globalenvironment
Over recent years both the euro area trade andcurrent account balances with the rest of the
world have shown rising surpluses (on the basisof provisional data), from 1.2% and 0.5% ofGDP respectively in 1995 to 1.6% and 1.1% ofGDP in 1997. However, from mid-1998onwards, the worsening in the global economy,whose origins lay in the Asian crisis, had adelayed impact on external accounts. Fallingforeign demand caused a deceleration of exportgrowth, which was also adversely affected bythe currency appreciation. At the same time,while the growth of import volumes rose, asdomestic demand remained strong, importprices declined, reflecting the fall in commodityprices.
3 Final considerations
Overall, the euro area, as one of the largesteconomies in the world, will play a significantrole in shaping global macroeconomicconditions. Equally, it will be open vis-à-vis itstrading partners, although developments in thedomestic economy will by far outweigh externalfactors. Residents of the euro area willundoubtedly benefit from the enhanced growthand employment opportunities which areafforded by a large internal market.
However, important challenges remain. Theseinclude, in particular, a high level ofunemployment and fiscal imbalances, as reflectedin both current deficit and debt levels in relationto GDP. In order to address these challenges, alarge economy such as the euro area has to relyprimarily on maintaining a sound and sustainablepolicy framework “at home”, thereby alsocontributing to a stable world economy. This
framework is characterised by fiscal policies thatare consistent with the Stability and GrowthPact, on the one hand, and ongoing structuralreform in the labour and product marketsaccompanied by moderate wage developments,on the other. Maintaining this policy frameworkwill help to foster competitiveness andprofitability in the corporate sector, therebypromoting investment. Equally, it will help tosustain and foster the employment growth thathas been seen recently, which will in turnsupport private consumption.
Monetary policy will play its part by pursuing itsprimary objective of price stability, therebykeeping inflationary expectations and risk premiain long-term interest rates low and hencecontributing to an environment conducive togrowth in economic activity and employment inthe euro area.

ECB Month l y Bu l l e t i n • January 1999 17
Economic developments in the euro area
1 Monetary and financial developments
Monetary policy decisions by theGoverning Council of the ECB
On 22 December 1998 the Governing Councilof the ECB announced the interest rates for thefirst monetary policy operations of theEurosystem. The interest rate applicable to thefirst main refinancing operation, offered in theform of a fixed rate tender and settled on7 January 1999, was set at a level of 3%. Inaddition, the interest rate for the marginallending facility was set at a level of 4.5% and theinterest rate for the deposit facility at a level of2% at the start of Stage Three (i.e. 1 January1999). However, as a transitional measurebetween 4 and 21 January 1999, the interestrate for the marginal lending facility was set at alevel of 3.25% and the interest rate for thedeposit facility at a level of 2.75%. At its meetingon 7 January 1999 the Governing Councildecided that the main refinancing operations tobe settled on 13 and 20 January 1999 wouldalso be conducted as a fixed rate tender at arate of 3% (see Chart 1 and the “Chronology ofmonetary policy measures of the Eurosystem”at the end of this Bulletin).
The interest rate on the main refinancingoperation, i.e. the weekly tender, is the maininterest rate with which the Eurosystem steersmovements in short-term market rates, whereasthe interest rates on the two standing facilitiesprovide a corridor for movements of theovernight money market rate (see Box 1). Theaforementioned decisions on the interest rateapplicable to the first three main refinancingoperations reflected the view of the GoverningCouncil, based on its assessment of theeconomic, monetary and financial situation inthe euro area, that a level of 3% is appropriatefor the foreseeable future as it best serves themaintenance of price stability over the mediumterm.
With regard to the first interest rates on thestanding facilities of the Eurosystem, theGoverning Council had to consider two aspects.First, it needed to signal clearly its monetarypolicy intentions. These were expressed bysetting the rate for the marginal lending facilityat 4.5% and the rate for the deposit facility at2% for the start of Stage Three. Hence thecorridor for movements in short-term interestrates, relative to the 3% main refinancing rate,is asymmetric towards the upper boundary.Determining these rates was also necessary inorder to provide successors to the officialnational central bank rates previously used asreference rates in certain legislation andcontracts in some Member States. Second, theGoverning Council had to consider thepossibility that market participants may needsome time to get used to the new environmentfor monetary policy. By setting a relativelynarrow interest rate corridor of 50 basis pointson the standing facilities between 4 and21 January 1999, the Governing Council aimedat smoothing the adaptation of marketparticipants to the new environment of theeuro area money market during the initialdays of Monetary Union. The Governing Councilalso announced that the chosen narrow widthof the corridor represented a temporary andexceptional measure which would only beapplied during the first three weeks of StageThree.
1 8 15January
1999
1.0
1.5
2.0
2.5
3.0
3.5
4.0
4.5
5.0
1.0
1.5
2.0
2.5
3.0
3.5
4.0
4.5
5.0
Marginal lending rateDeposit rate
Main refinancing rateOvernight rate (EONIA)
ECB interest rates and the overnight rate(percentages per annum; daily data)
Chart 1
Source: ECB.

ECB Month l y Bu l l e t i n • January 199918
Given the many novelties associated with themove to the new monetary policy environmentin Stage Three, it was regarded as important tocontain the volatility of interest rates at thebeginning of Stage Three by means of a narrowcorridor. A narrow corridor has the effect, inparticular, of limiting the costs for those creditinstitutions which, owing to technical problemsor insufficient information, would have beenunable to receive or place funds in the interbankmarket at the start of Stage Three. Such anarrow corridor is, however, not a desirablefeature for the longer term, since it may hamperthe development of an efficiently functioningeuro area money market, limits incentives forcredit institutions to carefully plan the fulfilmentof their reserve requirements and complicatesthe liquidity management of the Eurosystem.
For this reason, the Governing Council alreadyannounced on 22 December 1998 that itintended to terminate this measure followingits meeting on 21 January 1999.
On 5 January 1999 the Eurosystem announcedthe allotment of its first main refinancingoperation. A total amount of €75.0 billion wasallotted, which was spread across 944 biddingcredit institutions in proportion to the bidsthey had submitted. The allotment decision wasmade on the basis of the liquidity needs of theeuro area as a whole, so as to relatively rapidlyprovide the amounts needed by the creditinstitutions to fulfil their reserve requirementswithin the first reserve maintenance period,while paying due attention to the uncertaintiesconnected to the phasing-in of the new system.
Box 1The monetary policy operational framework of the Eurosystem: a brief introduction
In order to achieve its monetary policy objectives, the Eurosystem conducts open market operations, offers standing
facilities and requires credit institutions to hold minimum reserves on accounts with the national central banks. Open
market operations play an important role in the monetary policy of the Eurosystem for the purposes of steering
short-term interest rates, managing the liquidity situation in the money market and signalling the stance of monetary
policy. Standing facilities are aimed at providing and absorbing overnight liquidity and at providing a general signal
regarding monetary policy intentions over the medium term. The minimum reserve system primarily serves the
purpose of stabilising money market interest rates and creating (or enlarging) a structural liquidity shortage.
Among the open market operations, the “main refinancing operation”, i.e. a weekly tender with a two-week
maturity, plays a pivotal role in the Eurosystem’s monetary policy framework. Indeed, it is mainly through
this operation that the Eurosystem steers movements in short-term market interest rates and refinances the
banking system. In addition, the Eurosystem also regularly conducts “longer-term refinancing operations”.
These are monthly tender operations which have a three-month maturity. By contrast with the weekly tender,
in the monthly tender the Eurosystem does not, as a rule, intend to send signals to the market. Other types of
open market operations which the Eurosystem could conduct, when deemed necessary, include fine-tuning
operations, which are aimed, in particular, at smoothing the effects of unexpected liquidity fluctuations in the
market. Furthermore, the Eurosystem has the possibility of using open market operations (such as the issuance
of ECB debt certificates) to adjust the structural position of the Eurosystem vis-à-vis the financial sector. Since
the start of Stage Three the ECB has not, however, seen any need to carry out such “structural” operations.
While open market operations are conducted on the initiative of the Eurosystem, in the case of the standing facilities
the initiative lies with those credit institutions which are the Eurosystem’s counterparties. Eligible counterparties
have access to two standing facilities of the Eurosystem: the marginal lending facility allows them to obtain overnight
liquidity from the national central banks and the deposit facility allows them to make overnight deposits at the national
central banks. Under normal circumstances there is no limit on access to the standing facilities (with the exception
that access to the marginal lending facility, as for all credit operations of the Eurosystem, has to be backed by sufficient
eligible collateral). As a consequence, fluctuations in the overnight market interest rate are bounded by the corridor
set by the interest rates applied to these standing facilities.

ECB Month l y Bu l l e t i n • January 1999 19
In addition, each credit institution located in the euro area is subject to a reserve requirement. This requirement
is determined by applying a reserve ratio to selected liabilities of the balance sheet of credit institutions. The
reserve ratio was set at a level of 2% as from the start of Stage Three. A credit institution complies with its
obligations under the Eurosystem’s minimum reserve system if its average daily reserve holdings, as computed
over a reserve maintenance period normally running from the 24th day of each month to the 23rd day of the
following month, is at least equal to its reserve requirement. Holdings of required reserves are remunerated at
the rate of the Eurosystem’s main refinancing operation. The mechanism for the fulfilment of the reserve
requirement over a period longer than one day – a period of precisely one month in the case of the
Eurosystem’s minimum reserve system – is known as the averaging provision. As the averaging provision
provides flexibility in the banking system’s management of its liquidity, credit institutions will be able to
accommodate day-to-day changes in the provision of liquidity and to exploit short-term arbitrage possibilities
in the money market. In this way, the averaging provision can be expected to contribute to a stabilisation of the
overnight rate over the course of the maintenance period.
Finally, as regards the inception of the Eurosystem’s operations, the standing facilities have been accessible to
credit institutions as from 4 January 1999, the first business day of Stage Three. The first weekly tender was
settled on 7 January 1999 and the settlement date of the first monthly tender was 14 January 1999. With a view
to contributing to a smooth transition to the Eurosystem’s monetary policy framework, participating national
central banks agreed to let the open market operations they conducted towards the end of Stage Two mature
gradually in the course of the first half of January 1999. Furthermore, as a transitional provision for the
Eurosystem’s minimum reserve system, the first maintenance period will run from 1 January 1999 until
23 February 1999.
A detailed description of the Eurosystem’s monetary policy framework is presented in the ECB report entitled
“The single monetary policy in Stage Three: General documentation on ESCB monetary policy instruments
and procedures” (September 1998).
Monetary growth compatible withprice stability
The stability-oriented monetary policy strategyof the Eurosystem assigns a prominent role tomoney, founded on the essentially monetarynature of inflation in a medium and long-runperspective (see the article entitled “Thestability-oriented monetary policy strategy ofthe Eurosystem” in this issue of the Bulletin).The Governing Council of the ECB decided on1 December 1998 to set the first referencerate for the annual growth of a broad monetaryaggregate M3 in the euro area at 4½%. Monetarydevelopments will be monitored against thisreference value on the basis of the three-monthmoving average of the 12-month growth rate ofM3, in order to prevent erratic monthlyoutturns from unduly distorting the informationcontained in the data. In addition to M3,attention will be paid to narrower definitions ofmoney (M1 and M2) and to the counterparts ofM3, particularly lending to the private sector
(see Box 2 for an overview of definitions ofmonetary aggregates for the euro area).
The data available show that M3 grew at a paceof between 3.5% and 5.0% over the past twoyears. This was broadly compatible with pricestability and sustainable economic growth in theeuro area. During this period, the pace ofgrowth of the narrow aggregate M1 wassignificantly higher than that of M3 (seeChart 2); this reflected entirely the high rate ofgrowth of overnight deposits. Shifts towardsthis component of narrow money in the courseof 1998 were stimulated by the decline ininterest rates in the euro area, which reducedthe opportunity cost of holding overnightdeposits. Furthermore, investment in thiscomponent of narrow money benefited fromthe fall in inflation rates in several countries aswell as from the expected establishment ofMonetary Union and a stable single currency.Moreover, in some countries overnight depositsmay have played a buffer role in a portfolio

ECB Month l y Bu l l e t i n • January 199920
reallocation process leading to significant shiftstoward mutual funds and equities during 1998.On the whole, it therefore appears that, apartfrom reflecting the pace of economic expansion,most of the strong growth of narrow moneyresults from the adjustments to low inflationrates in some euro area countries or portfolioshifts which do not signal any inflationary risks.
The decline in the rate of growth of M3between October and November 1998 mainlyreflected a slower pace of growth inmarketable instruments included in M3. Inparticular, the demand for repurchaseagreements contracted substantially, and thatfor debt securities issued with a maturity ofup to two years decelerated. The subdueddemand for marketable instruments inNovember reversed a movement observedin October and must be seen against thebackground of an exceptionally high degreeof volatility in financial markets in October,which was followed by a gradual return tonormality in November.
Overnight deposits grew at an annual rate of11.5% in November, compared with 10.7% inOctober. Deposits redeemable at notice of upto three months grew at an annual pace of 6.3%in November, while deposits with an agreedmaturity of up to two years contracted by 3.8%on a 12-month basis.
Counterparts of M3 support themonetary analysis
In the context of the monetary policy strategyof the Eurosystem, an analysis of the so-calledcounterpart items of M3 in the consolidatedbalance sheet of the MFI sector contributesto a deeper understanding of monetarydevelopments. These counterparts belong tothe wide range of economic variables that aremonitored and analysed mainly in terms of theirleading indicator properties regarding futureprice developments.
On the assets side of the balance sheet thetotal amount of credit to the private sector(defined as the sum of MFI loans to the privatesector and holdings of securities issued by euroarea residents other than general government)has been growing at a considerably faster pacethan M3 during recent months. On an annualbasis it increased by 8.8% and 9.2% in Octoberand November respectively. According torecent MFI balance sheet data, the 12-monthincrease in the outstanding stock of loans tohouseholds and non-financial enterprises (which
1997 19980
2
4
6
8
10
12
0
2
4
6
8
10
12
M1 M2 M3
Monetary aggregates in the euro area(annual percentage changes)
Chart 2
Source: ECB.
Looking at more recent monetarydevelopments, the data for November 1998show that M3 grew at an annual pace of 4.5%,which was 0.5 percentage point lower thanthe 12-month growth rate recorded in theprevious month. The three-month movingaverage of the 12-month growth rate of M3(covering the period from September toNovember 1998) was broadly stable at 4.7%,a level which is very close to the referencevalue set by the Governing Council of theECB. The annual rate of growth of M1increased from 8.7% in October 1998 to 9.2%in November, while that of M2 acceleratedto 5.0% in November 1998, from 4.6% inOctober 1998.
ECB Month l y Bu l l e t i n • January 1999 21
Box 2Definitions of monetary aggregates for the euro area
In the course of Stage Two of Economic and Monetary Union (EMU) the national central banks, the European
Monetary Institute (EMI) and, subsequently, the ECB have devoted considerable effort to developing
harmonised euro area monetary statistics. This has resulted in the compilation of a consolidated balance sheet
of the Monetary Financial Institutions sector (MFI sector), on the basis of which the monetary aggregates for
the euro area are derived. The MFI sector comprises those institutions whose liabilities may be of a monetary
nature: they include the national central banks, the ECB, credit institutions and other financial institutions,
mainly money market funds (MMFs). The MFIs resident in the euro area are collectively defined as the
“money-issuing” sector in the euro area.
For the purpose of defining monetary aggregates, the “money-holding” sector comprises all non-MFI euro
area residents, excluding central government. This sector principally includes households, non-financial
corporations, insurance corporations and pension funds and other non-MFIs located in the euro area, as well as
state and local government authorities and social security funds in the euro area. Central governments are
considered to be a “money-neutral” sector, with one exception: central government deposit liabilities with a
monetary character (post office accounts, national savings accounts and treasury accounts) are included in the
definition of the monetary aggregates of the Eurosystem.
Different types of MFI liabilities are included in the monetary aggregates for the euro area. Currency in
circulation and overnight deposits are the most liquid instruments and form the narrow definition of money,
referred to as M1. Adding other short-term deposits to M1 (namely deposits with an agreed maturity of up to
two years and deposits redeemable at notice of up to three months) gives the monetary aggregate M2. Finally,
the broad monetary aggregate M3 is obtained by summing M2 with specific marketable liabilities of the MFI
sector (repurchase agreements, money market fund shares/units and money market paper, together with debt
securities issued with an original maturity of less than two years).
In quantitative terms, M1 accounted for around 39% of M3 in November 1998, with currency representing 7%
and overnight deposits 32%. Deposits redeemable at notice of up to three months and deposits with an agreed
maturity of up to two years accounted for around 27% and 20% respectively; thus the aggregate M2 accounted
for 86% of M3. Marketable instruments accounted for the remaining 14% (with money market fund shares/
units and money market paper at 7%, repurchase agreements at 5% and debt securities issued with an original
maturity of up to two years at 2%).
Data on the consolidated balance sheet of the MFI sector and the monetary aggregates for the euro area
(covering all 11 euro area countries) have been compiled as from September 1997. This has made it possible to
obtain 12-month growth rates for all balance sheet items from September 1998 onwards. For monetary
aggregates, however, longer-term series have been estimated. Statistics on month-to-month flows representing
actual financial transactions are not available as yet; consequently, growth rates are calculated on the basis of
statistics for stocks. This method of calculation may neglect the influence of distorting factors, such as the
variation of market prices (for securities included in M3 for which there is a secondary market), exchange rate
movements and reclassifications. Furthermore, the data are to some extent still based on estimates as some
changes to the reporting systems in individual euro area countries have yet to be completed. However, at this
point in time these data represent the most comprehensive and reliable source of monetary information in the
euro area. This notwithstanding, some caution should be exercised when evaluating monetary statistics for
monetary policy purposes.
Conceptual and empirical aspects of the euro area monetary aggregates will be discussed in more detail in an
article which is to appear in the February 1999 Monthly Bulletin.

ECB Month l y Bu l l e t i n • January 199922
accounts for around 91% of total MFI credit tothe private sector) was 8.5% in November(compared with 8.2% in October 1998).Securitised MFI lending to the private sectorexpanded at a relatively high 12-month growthrate of 16.2% in November, although thisdevelopment should not be overstated sincethis item accounts for less than 10% of totalMFI credit to the private sector. The strongrate of growth of MFI financing to the privatesector appears to be related to the economicexpansion in the euro area in 1998 and tofavourable financing conditions for non-financialcorporations and households, given the currentlow level of retail bank lending interest rates(see Table 2.8 in the “Euro area statistics”section).
MFI credit to general government, by contrast,increased at a very slow pace in November1998; in particular, loans extended to generalgovernment declined at a 12-month rate of 1.5%.The annual rate of growth of MFI holdings ofgeneral government debt securities was 3.8% inNovember.
On the liabilities side of the balance sheetthe longer-term financial liabilities of MFIs(comprising longer-term deposits and debtsecurities issued plus MFIs’ capital andreserves), are financial instruments outsidethe scope of the definition of broad money.Under certain circumstances, they mayprovide alternative investment opportunitiesto the instruments included in M3. InNovember 1998 longer-term financialliabilities accounted for around 30% of totalMFI liabilities (for comparison, componentsof M3 accounted for some 41% of total MFIliabilities). This counterpart item grew at anannual rate of around 3% in November 1998,which was slightly less than in October 1998(3.4%). The subdued growth of thiscomponent may have been influenced by thefalling spread between long-term and short-term interest rates in recent months (seeBox 4 below).
The net external position of MFIs in the euroarea tended to deteriorate in 1998. The12-month growth of external liabilities reached
14.9% in November, compared with acorresponding growth rate of 4.6% for externalassets.
Money market rates on a decliningtrend in recent months
While the average three-month interest ratefor the euro area was still just above 4% inMay 1998, when the euro area countries wereselected, it gradually declined during thecourse of the year. To a large extent, thisreduction in short-term interest ratesreflected the process of convergence ininterest rates recorded in the euro area in1998. While significant differentials in moneymarket rates existed across euro areacountries in early 1998, these spreadsnarrowed over time through the reductionof central bank interest rates in thosecountries with relatively high short-terminterest rates. This resulted in a process ofconvergence towards the levels prevailing inthe euro area countries with the lowestinterest rates. By the end of November 1998the average three-month market rate hadreached a level of 3.6%.
A further pronounced fall in the euro areaaverage of three-month interest rates tookplace immediately after 3 December 1998when all the national central banks of the11 Member States adopting the euro as fromthe start of Stage Three decided in a co-ordinated manner to lower their key centralbank rates to 3% (with the exception of onecentral bank, which initially only reduced itskey rate to 3.5%, subsequently reducing it to3% on 23 December 1998). As explained bythe ECB at the time, this joint reduction ininterest rates had to be seen as a de factodecision on the starting level of thecorresponding ECB interest rate. Atend-December 1998 the level of the euroarea three-month interest rate was equalto 3.25%, i.e. around 35 basis points lowerthan at end-November 1998 and about80 basis points below the level of May 1998(see Chart 3).

ECB Month l y Bu l l e t i n • January 1999 23
In the first week of January 1999 the overallconditions prevailing in the euro area moneymarket were stable. The one-month and three-month interest rates were both quoted at levelsof around 3.2%. The overnight rate, as measuredby the EONIA (“euro overnight index average”,i.e. the weighted average of the rates onunsecured overnight contracts reported by apanel of major banks in the euro area) was alsoclose to 3.2% between 4 and 7 January 1999.
Although some minor problems of a technicalnature could not be avoided, the changeover tothe euro and the experience of the functioningof the ESCB’s payment system (TARGET)and the euro area money market in the firstfew days of Monetary Union were generallyencouraging (see Box 3). Short-term interestrate differentials across participating countriesnarrowed quickly. This indicates that creditinstitutions throughout the euro area appear tobe adapting rapidly to the new environment byengaging in cross-border business in order tomake use of arbitrage possibilities in the singlemoney market. At the same time, theEurosystem observed relatively intensiverecourse by credit institutions not only to itsmarginal lending facility, but also to its depositfacility in the first few days of Monetary Union.While the recourse to the marginal lendingfacility has to be seen in the light of the fact thatthe spread between the rate on this facility andthe overnight market rate was relatively smallduring those first few days, implying a lowopportunity cost for banks to use the marginallending facility, the significant level of recourseto the deposit facility indicates that, at the startof Stage Three, not all banks used excessliquidity to place loans in the money market.With the envisaged widening of the corridorbetween the rates on the Eurosystem’s standingfacilities, however, there will be noticeablygreater incentives for all credit institutions toparticipate in the money market.
Q2 Q3 Q41998 1999
3.00
3.25
3.50
3.75
4.00
4.25
3.00
3.25
3.50
3.75
4.00
4.25
Chart 3
Short-term interest rate in the euro area(percentages per annum; daily data)
Source: ECB.Note: Euro area average of national three-month interbankrates until 29 December 1998; three-month EURIBOR from30 December 1998 onwards.
Box 3The changeover to the euro
Financial markets and payment and settlement systems opened in the morning of 31 December 1998 with low
liquidity and only few transactions, as expected, while all stock exchanges in the euro area were closed. In the
early afternoon, after the Council of the European Union had adopted the irrevocable conversion rates of the
euro against the participating currencies, the changeover activities of the public and private financial sectors
got under way. During the following three and a half days (known as the “changeover weekend”), the bulk of
the public debt of the participating Member States was redenominated in euro, databases containing billions of
electronic records were converted from the national currencies to the euro, and systems and procedures were
adapted to function in the new currency. Conversion activities were practically concluded by late afternoon on
3 January 1999. The global financial and foreign exchange market opened in euro in Sydney at
6 p.m. C.E.T. on 3 January, while all segments of the financial markets in the euro area opened in euro on
4 January. The TARGET system closed at 7.30 p.m. on 4 January, after the financial community in the euro
area had operated in the new currency for a full day. This allowed the Eurosystem to announce its first main
refinancing operation in an environment fully operational in the new currency on the same day. Only five days

ECB Month l y Bu l l e t i n • January 199924
had passed between the opening of the markets in national currencies on 31 December 1998 and the close of
business in euro on 4 January 1999.
The changeover weekend went smoothly, without any serious incident affecting the launch of the single currency,
thanks to the commitment and hard work of a very large number of institutions. Sources in the media reported that a
workforce of 50,000 was directly involved in the changeover during the weekend – not only in the euro area, but also
in other major financial centres.
Within the Eurosystem preparations had been ongoing for some time. The first plan of action for the changeover
weekend had already been approved by the Council of the European Monetary Institute in March 1998. After the
establishment of the ECB, the Governing Council of the ECB examined reports on the changeover at four of its
meetings. During the changeover weekend several thousand staff members were at work or on call at the ECB and at
the national central banks.
The Eurosystem played a key role. It helped to compute, promulgate and publish the irrevocable conversion rates of the
euro vis-à-vis the participating currencies; it co-ordinated the orderly transition to the new currency at the ECB and at the
national central banks; it conducted final tests, when required, of the new infrastructure; it launched the new infrastructure
for payment and securities settlement, including TARGET; it issued recommendations to credit institutions and securities
settlement systems; and it participated in working groups and tests at the local level, together with representatives of the
banking community. The Eurosystem also identified a number of systems and players – defined as the “core
infrastructure” – with which it created ad hoc links for the exchange of information during the changeover weekend;
these included payment systems, securities settlement systems, stock exchanges, global custodians and financial data
providers. A “Changeover Weekend Committee” and a network of “central communication points” were created to
gather and share information. A mechanism was set up to monitor 240 relevant steps in the conversion process which
might impinge upon the smooth launch of the euro and the functioning of the monetary system (the so-called
“milestones”). Contact was established with the central banks of the non-participating countries, of the G-10 countries
and of other nations, with the European Commission and with a parallel network of institutions organised by the Banking
Supervision Committee. The decision-making bodies of the ECB stood ready to gather in extraordinary teleconference
meetings, if necessary. Information was exchanged continuously, both prior to and during the weekend; in particular,
the state of advancement of the conversion activities was discussed during three teleconferences before the weekend
and eight during the weekend among the central communication points at the ECB and at the national central banks.
The major concern of the Eurosystem was to avoid a breakdown in the transition to the euro – at the ECB, at any
national central bank or within any of the systems of the above-mentioned “core infrastructure” – hampering the
functioning of the monetary system, perpetuating the pre-existing segmentation of money markets or confronting
the monetary authorities with risks for financial stability at the very start of Monetary Union.
The conversion of the national currencies to the euro during the changeover weekend had all the features of a major
engineering endeavour. It imposed a unique co-ordination effort upon the Eurosystem as well as upon the banking
and financial community of the euro area and beyond. It was a test of the capacity of the European financial industry
to work under extreme pressure. The satisfactory outcome of the changeover process is a sign of the quality of the
preparatory work conducted over the past two years by the banking community and by other financial market operators
in the euro area.
Long-term government bond yieldsat historically low levels
Towards the end of December 1998 long-termgovernment bond yields in the euro areareached historically low levels of well
below 4% (see Chart 4). This represented asignificant decline of around 150 basis points,compared with the situation at end-1997, andmay be seen as a continuation of the longer-term trend of declining long-term interest ratesin the euro area which has been firmly in place

ECB Month l y Bu l l e t i n • January 1999 25
since early 1995. This favourable developmentin euro area bond markets is a reflection of themore or less continuous decline in euro arearates of inflation since early 1995, as well as of acorresponding decline in longer-term inflationexpectations. Furthermore, it reflects the effortsmade towards fiscal consolidation in the euroarea in preparation for the move to Stage Threeand the gradual disappearance of exchange raterisk premia.
In the course of 1998 this process of declininglong-term bond yields accelerated in anenvironment of exceptional turbulence ininternational financial markets which saw “safe-haven” flows from emerging markets to thecapital markets of industrialised countries aswell as a shift in investors’ attitudes towardsrisk. This shift in risk attitudes prompted ageneralised “flight to safety” in global financialmarkets, from stock markets to the bondmarkets of industrialised countries. All in all,this resulted in an increased volatility in bond,stock and foreign exchange markets in theautumn. However, as volatility subsequentlyreturned to normal levels, long-termgovernment bond yields in the euro areacontinued to decline. This was a notabledevelopment, which indicated that the “flight tosafety” was not the only source of the declinein bond yields and that domestic factors, suchas a further decline in inflation and an easing ofrisks for price stability, had also played a keyrole.
The co-ordinated round of central bank interestrate cuts in the euro area on 3 December 1998was reflected in an immediate further decline inlong-term bond yields, while the differentialbetween 10-year bond yields in the UnitedStates and comparable yields in the euro areawidened slightly. Overall, despite a temporary
Q2 Q3 Q41998 1999
3.0
3.5
4.0
4.5
5.0
5.5
6.0
3.0
3.5
4.0
4.5
5.0
5.5
6.0
Euro area United States
Chart 4
Long-term government bond yields in the euro area and the United States(percentages per annum; daily data)
Sources: ECB and BIS.Note: Long-term government bond yields refer to 10-year bondsor closest available bond maturity.
upturn related to a sharp increase in Japanesebond yields, 10-year bond yields in the euroarea declined by almost 20 basis points in thecourse of December, while further declineswere observed in early January. This compareswith a slight increase in comparable yields in theUnited States and a substantial increase of morethan 70 basis points in Japanese yields in theperiod between 3 December 1998 and 7 January1999. These developments, together with a euroarea yield curve downward shift at all maturities(see Box 4) following both the cuts in centralbank rates and the announcement concerningthe standing facilities corridor, indicate that thesingle monetary policy has already achieved ahigh degree of credibility in the eyes of thefinancial markets.

ECB Month l y Bu l l e t i n • January 199926
Box 4Yield curve developments since July 1998
The yield curve can, under certain assumptions, reflect market participants’ expectations regarding the future
direction of short-term interest rates. At the same time, it can provide useful information on market participants’
expectations with regard to future developments in inflation and the pace of real economic activity. The
following analysis considers developments in the yield curve, as measured using the interest rates observed on
the fixed side of interest rate swap contracts. An interest rate swap is an agreement to exchange a flow of fixed
interest payments in return for a variable rate of interest.
The shape of the euro area swap yield curve has changed significantly over the course of the past six months.
Reflecting the decline in both short-term and long-term interest rates, the euro area yield curve has shifted
downwards along the entire maturity spectrum. In addition, since these declines were slightly larger at the long
end of the maturity spectrum than at the very short end, a slight flattening of the spot yield curve was observed,
with the spread of 10-year swap yields over three-month money market interest rates narrowing slightly.
Although safe-haven flows related to the turbulence in international markets may at times have played a role
in developments in long-term interest rates, this levelling-off of the yield curve slope might also indicate a
reduction in the long-term outlook for inflation in the euro area.
The chart below shows how the pattern of implied forward euro area overnight interest rates derived from the
term structure of interest rates has changed over the past six months. As may be seen from the chart,
abstracting from risk premia considerations related to the term to maturity, in early July 1998 financial
markets expected overnight interest rates in the euro area to be at a level just below 4% at the beginning of
1999, and to increase gradually thereafter. The configuration of implied forward overnight interest rates
observed in early January 1999, by contrast, shows a change in these expectations, which partly reflects the
convergence of short-term interest rates within the euro area to below the levels of those countries which
previously had the lowest short-term interest rates.
In early January 1999 market participants expected a very slight decline in overnight rates in the months to
come. Subsequently, overnight rates were expected to rise again. This pattern in the yield curve could also be
observed in futures markets. In early January 1999 the three-month interest rates implicit in the futures
contracts on euro deposits maturing in mid-March and mid-June 1999 were slightly lower than the three-
month spot interest rate.
Source: ECB estimation using the method outlined in the article entitled “Estimating and interpreting forward interest rates:Sweden 1992-94” by L. E. O. Svensson (1994), IMF WP/94/114, Washington, DC. The data used in the estimation are derived fromswap contracts.
Implied forward euro area overnight interest rates(percentages per annum; daily data)
3.00
3.50
4.00
4.50
5.00
5.50
6.00 6 July 1998 27 Nov. 1998 6 Jan. 1999
1999 2000 2001 2002 2003 2004 2005 2006 2007 2008

ECB Month l y Bu l l e t i n • January 1999 27
Heightened levels of volatility instock markets
In recent months stock prices in the euro areahave been significantly influenced by theturbulence in international financial markets. Asmeasured by the Dow Jones EURO STOXXindex, they showed a substantial decline ofalmost 35% from their peak in mid-July 1998 toa trough in early October, before climbing againby more than 35% until end-1998. Yet, reflectingthe strength of euro area stock markets duringthe first half of 1998, by end-December stockprices were 30% above levels observed at theend of 1997. In early January stock prices in theeuro area continued to show increases.
The recent high level of volatility in euro areastock markets, which was also apparent in thestock markets of both the United States andJapan (see Chart 5), appeared to reflect twomain factors. First, concern about the economicsituation in Russia, Asia and Latin America ledto a downward reassessment of the prospectsfor global economic growth. This, in turn,appeared to lead to downward revisions ofexpectations for exports and corporateearnings. A second factor was a heightened levelof uncertainty, which saw volatility in stockmarkets reach exceptionally high levels. Thismay, in part, have reflected a reassessment bymarket participants of the risks inherent inequity market investment generally.Nonetheless, as markets may subsequently haveconsidered this reassessment of the globaleconomic outlook to be unduly pessimistic,stock markets in the euro area recovered. Thisrecovery was also linked to a recovery in stockmarkets in the United States. However, volatilityin euro area stock markets has yet to returnfully to the lower levels observed in early 1998,prior to the outbreak of financial marketturbulence.
Turning to sectoral developments in euro areastock markets, considerable differences inperformances have been observed in recentmonths. When stock market values declined in
the autumn months, the largest downturns, ofmore than 40%, were observed in theautomobile, banking and technology sectors. Inthe case of the euro area banking sector thekey factors in this development, apart fromglobal stock market influences, appeared to beconcerns about the exposure of euro areafinancial institutions to emerging markets.Nonetheless, in line with the general trend,some recovery was later seen in these threesectors, where prices at end-1998 were only20-25% below previous peaks, but stillsignificantly above their end-1997 levels. Othersectors, such as the retail and utilities sectors,remained remarkably resilient throughout thestock market turbulence, with prices at end-1998 close to their earlier peaks in mid-July1998. These sectoral developments show that,although sectors which were exposed to theinternational environment tended to performadversely, those which depended to a largerextent on the strength of domestic demandremained relatively buoyant.
Sources: Reuters for euro area; BIS for United States and Japan.Note: Dow Jones EURO STOXX broad (stock price) index forthe euro area, Standard and Poor’s 500 for the United Statesand Nikkei 225 for Japan.
Chart 5
Q2 Q3 Q41998 1999
75
80
85
90
95
100
105
110
115
120
75
80
85
90
95
100
105
110
115
120
Euro areaUnited States
Japan
Stock price indices in the euro area, the United States and Japan(1 May 1998 = 100; daily data)

ECB Month l y Bu l l e t i n • January 199928
2 Price developments
Consumer price increases edgeddownwards
Recent consumer price increases in the euroarea edged downwards further, while remainingin line with the quantitative definition of pricestability adopted by the Eurosystem. Asmeasured by the Harmonised Index ofConsumer Prices (HICP), the annual percentagechange in consumer prices in the euro area was0.9% in November 1998, i.e. 0.1 percentagepoint lower than in September and October.Since the second quarter of 1998, when theannual increase in the HICP for the euro areareached 1.4%, it has decreased by 0.5 percentagepoint.
A breakdown of developments in the HICP forthe euro area shows that the trends whichwere mainly accountable for the decrease inrecent months continued in November. In
particular, unprocessed food price increasesmoderated further to 0.6% and the fall in energyprices accelerated to -4.3% (see Table 1). Withregard to unprocessed food prices, whichgenerally show a fair degree of volatility,increases have moderated since April 1998 asthe upward effects resulting from temporarysupply shortages in the course of 1997 droppedout of the 12-month rates. The furtherreduction in energy prices reflected a continuedfall in oil prices, which, in ECU terms, reached alevel in December of around 45% below thatrecorded at the end of 1997. Moreover,commodity prices (excluding energy) remainedconsiderably below the levels recorded in 1997.With regard to the other sub-indices, modestprice increases continued in the case ofprocessed food and non-energy industrial goodsprice increases were broadly unchanged at 1.0%,while services prices continued to increase byaround 2%.
Chart 6
Breakdown of HICP inflation in the euro area by components(annual percentage changes)
Q1 Q2 Q3 Q4 Q1 Q2 Q3 Q4 Q1 Q2 Q3 Q41996 1997 1998
-5
-4
-3
-2
-1
0
1
2
3
4
5
6
-5
-4
-3
-2
-1
0
1
2
3
4
5
6
Total HICPServices
Unprocessed foodProcessed food
Non-energy industrial goodsEnergy
Source: Eurostat.Note: For further information on the data used, see the respective tables and charts in the “Euro area statistics” section of this Bulletin.Latest observation: Total HICP: 0.9% (Nov. 1998); services: 2.1% (Nov. 1998); unprocessed food: 0.6% (Nov. 1998); processedfood: 1.3% (Nov. 1998); non-energy industrial goods: 1.0% (Nov. 1998); energy: -4.3% (Nov. 1998).

ECB Month l y Bu l l e t i n • January 1999 29
Table 1Price and cost developments in the euro area(annual percentage changes, unless otherwise indicated)
Sources: Eurostat, national data, HWWA and ECB calculations.Note: For further information on the data used, see the respective tables and charts in the “Euro area statistics” section of thisBulletin.1) Excluding construction.2) Whole economy.3) Brent Blend (for one-month forward delivery).4) Excluding energy.
A number of other cost and price indicatorssupport the general picture of price stability inthe euro area (see Table 1; for methodologicalremarks concerning price and cost statistics,see Box 5). Notably, producer price increaseshave slowed down gradually since the end of1997 – mainly as a result of falling intermediategoods prices – and, after turning negative inMay, producer prices were 1.9% lower inOctober 1998 than a year earlier. In addition,labour cost increases appear to have remained
subdued throughout the first half of 1998. Inparticular in the first quarter of the year, growthin unit labour costs was negative as strongereconomic activity led to higher productivitygrowth and the increase in compensation peremployee slowed. Thereafter, as lowerproductivity growth was matched by continuedwage moderation, unit labour costs remainedbroadly unchanged in the second quartercompared with a year earlier.
Box 5Non-financial statistics supporting the analysis of euro area-wide economic developments
To assess macroeconomic developments in the euro area, a comprehensive set of reliable and up-to-date euro
area-wide statistics is needed. In particular, these statistics must have a sufficient coverage of euro area-wide
developments and country data should, to a high degree, be comparable. However, at this juncture much of the
data, particularly longer time series, are available only on a non-harmonised basis. The definition and
collection of statistics has been the responsibility of individual countries and, in the past, the need for
harmonised data was limited. International definitions and standards have been developed over time, while
only recently have more systematic efforts been made, not least in response to certain legal obligations, to work
towards a harmonised statistical base within Europe. This box briefly describes the set of euro area-wide
1996 1997 1998 1998 1998 1998 1998 1998 1998 1998 1998 1998 1998
Q1 Q2 Q3 Q4 July Aug. Sep. Oct. Nov. Dec.
Harmonised Index of Consumer Prices (HICP) and its components
HICP 2.2 1.6 . 1.2 1.4 1.2 . 1.4 1.2 1.0 1.0 0.9 . of which:
Processed food 2.0 1.5 . 1.3 1.6 1.5 . 1.6 1.5 1.3 1.3 1.3 .
Unprocessed food 1.9 1.5 . 2.3 2.9 2.1 . 2.4 2.3 1.5 1.0 0.6 .
Non-energy industrial goods 1.5 0.5 . 0.6 1.0 1.1 . 1.0 1.1 1.1 1.0 1.0 .
Energy 2.4 2.6 . -1.5 -1.3 -3.2 . -1.9 -3.8 -3.8 -4.0 -4.3 .
Services 3.1 2.4 . 2.0 2.0 2.0 . 2.0 2.1 2.0 2.1 2.1 .
Other price and cost indicators
Industrial producer prices 1) 0.7 1.1 . 0.5 -0.2 -1.3 . -0.8 -1.4 -1.6 -1.9 . .
Unit labour costs 2) 1.8 0.6 . -2.3 -0.5 . . - - - - - -
Compensation per employee 2) 3.4 2.6 . 1.0 1.2 . . - - - - - -
Labour productivity 2) 1.6 2.1 . 3.4 1.7 . . - - - - - -
Oil prices (ECU per barrel) 3) 15.9 17.1 12.0 13.6 12.8 11.7 10.0 11.9 11.3 11.9 11.1 10.2 8.7
Commodity prices (ECU) 4) -6.9 13.0 -12.5 -0.1 -10.7 -18.1 -20.5 -14.4 -19.0 -20.9 -23.6 -18.4 -19.5

ECB Month l y Bu l l e t i n • January 199930
statistics on prices and costs, on output and demand and on the labour market that are currently available and indicates
where improvements are likely in the near future (see also the “Euro area statistics” section in this Bulletin).
The ECB and its predecessor, the European Monetary Institute (EMI), have strongly supported initiatives at
the European level which have aimed at providing the statistical basis for the single monetary policy. While an
important impetus in this process was the provision of comparable statistics for the purpose of assessing
convergence, the ECB data requirements are broader and at the same time more detailed. Moreover, the
timeliness of the euro area results is crucial for their use for monetary policy purposes. These issues were
recognised in a number of EU Regulations on statistics which have been enacted by the Council of the
European Union on the proposal of the European Commission over the past few years (see below). Moreover,
there are supplementary initiatives which will contribute to the euro area-wide statistical basis, such as the
agreement between the Statistical Office of the European Communities (Eurostat) and all EU national
statistical institutes (NSIs) to provide a set of existing key variables in a very timely fashion. The result of
these initiatives is that the data situation has improved significantly and further improvements are expected in
some areas in the course of 1999.
However, where harmonised data are not yet available in a timely fashion, it is necessary to use the best
estimates which can be derived from national sources. These estimates are generally compiled on the basis of
data for most, but not all, countries.
Price and cost statistics
For the conduct of monetary policy the Harmonised Index of Consumer Prices (HICP) for the euro area is of
crucial importance. Eurostat provides, on a timely basis, the HICP and its sub-components on the basis of
harmonised measures with respect to coverage, standards for the procedures for quality adjustment and
numerous technical details. Further harmonisation and broadening of the coverage, for example to include
expenditures on education and health services, are planned for the next two years. However, these series are
considered to already meet the requirements of the ECB for policy analysis in terms of reliability, timeliness
and comparability.
National accounts deflators, producer price statistics and labour costs are other indicators used for the analysis
of price developments. They are not yet based on fully harmonised data and have a varying degree of coverage
and comparability. Most of the data used in this context are provided by Eurostat and improvements can be
expected as a result of the Regulation on the European System of National and Regional Accounts 1995
(ESA 95) in the second quarter of 1999 and of the Regulation on short-term statistics from 1999 onwards. In
addition, a further initiative was launched to harmonise measures of real GDP in the context of the Stability
and Growth Pact. Concerning the current situation, while national accounts deflators at the aggregate level
provide a reasonable basis for analysis, they contain data which are estimated for several smaller countries that
do not yet report quarterly national accounts. Producer price statistics vary to some degree in terms of the
definitions used. Standardised labour cost measures are currently not available for all countries at a quarterly
frequency, but are expected to be available as from spring 1999.
Output and demand statistics
Data on euro area GDP and its expenditure components are published by Eurostat. The quarterly statistics
include an estimate for those Member States which do not yet produce quarterly accounts. Euro area-wide
estimates of GDP are also constructed by the ECB on the basis of national data (not presented in the section on
“Euro area statistics”). Differences between aggregates published by Eurostat and estimates based on national
data can occur owing to the treatment of working days and seasonal adjustment in the respective sources,
notably for German data. As mentioned above, the implementation of the ESA 95 will broaden the availability
of national accounts data during 1999.

ECB Month l y Bu l l e t i n • January 1999 31
In addition, both quantitative and qualitative short-term indicators, namely industrial production and survey
data (for example, on confidence in the consumer, industrial and construction sectors) are available on a
monthly basis in all Member States. Many of the quantitative data examined by the ECB are covered by the
EU Regulation on short-term statistics, and improvements in data provision at the euro area level are expected.
The coverage of countries, the comparability of the data and the timeliness of data releases in the Member
States are the main concerns in respect of the industrial output data. This is also the case for retail trade
turnover and other kinds of information on activity in the services sector. Thus national data currently provide
valuable supplementary information.
Labour market statistics
As regards employment statistics, quarterly and sometimes monthly data are available for most countries. The
data are derived from different sources (surveys, registers) and are therefore not yet fully comparable. A
reliable, timely and high frequency sectoral breakdown of employment is not yet available. Data on
unemployment are published by Eurostat on a standardised basis, and may therefore differ from results quoted
at the national level. A breakdown of short-term and long-term unemployment on a standardised basis at
monthly frequency, though desirable, is not currently possible. Besides the two EU Regulations mentioned
above, the results of the new regular labour force surveys, also introduced by EU Regulations, will improve
the data available in the near future.
3 Output, demand and labour market developments
Slower output growth in the thirdquarter
Data available at this juncture suggest slowereuro area-wide output growth in the secondhalf of 1998, following robust growththroughout the first half of the year. (Formethodological remarks on the data used foranalysing output, demand and the labour market,see Box 5.) This is consistent with expectationsthat the deterioration in the externalenvironment would eventually also have someeffect on activity in the euro area. A firstestimate by Eurostat for the third quarter of1998 indicates a rise in euro area-wide realGDP of 2.4%, compared with the same period ayear earlier (see Table 2). This compares withan average rate of year-on-year growth of 3.1%in the first half of 1998. The first half of 1998 asa whole may serve as the most appropriatepoint of reference, rather than the quarterlyprofile of GDP growth, as it takes into accountthe fact that the first two quarters were heavilyinfluenced by calendar effects related to thetiming of Easter. As the published quarterly dataare not corrected for the effect of the differentnumber of working days, they suggest, prima
facie, a substantial decrease in GDP growth to2.5% in the second quarter, and thus only amarginal further slowdown in the third quarter.
The pattern of a more moderate economicexpansion since the spring of 1998 is reflectedin slower growth in industrial production.Compared with a year earlier, the overall indexof industrial production increased by 4.0% inthe third quarter of 1998, following increases of4.4% in the second quarter and 6.3% in the firstquarter. Figures released by national authoritiesare in some cases available up to October andpoint to a further deceleration in productiongrowth. Output in manufacturing, in whichconjunctural variations are typically moststrongly reflected, saw a decline in growth from7.3% in the first quarter of 1998 to 5.0% in thesecond and 4.3% in the third quarter, primarilyowing to a slowdown in industries producingintermediate goods. Industries producing capitalgoods also saw lower growth rates afterthe strong first quarter. However, theymaintained robust production growth ofaround 7%, most of which was due to vehicleproduction. Judging from the average increasein new passenger car registrations in October

ECB Month l y Bu l l e t i n • January 199932
Table 2Output, demand and labour market developments in the euro area(annual percentage changes, unless otherwise indicated)
Sources: Eurostat, European Commission Business and Consumer Surveys, ACEA/A.A.A., national data and ECB calculations.Note: For further information on the data used, see the respective tables and charts in the “Euro area statistics” section of thisBulletin. All data are seasonally adjusted, apart from industrial production (working day adjusted), retail sales and new passengercar registrations.1) Data are collected in January, April, July and October of each year. The quarterly figures shown are the average of two
successive surveys, i.e. the surveys conducted at the beginning of the quarter in question and at the beginning of the followingquarter.
2) Percentage balances; data shown are calculated as deviations from the average over the period since January 1985.
and November, this positive influence may havecontinued in the fourth quarter. Finally,production in consumer goods also expandedat a fairly stable rate of around 3.5% over thepast three quarters.
Variations in the indicator of industrialconfidence, as reported in the EuropeanCommission survey, are largely due to changesin the assessments for order books and changingproduction expectations. In the manufacturingsector, in line with the deterioration in theglobal environment, assessments of order bookssuccessively worsened in the months fromAugust to November after having remainedbroadly unchanged during the first half of1998. The deterioration was slightly morepronounced in the case of export orders thanin that of domestic orders. In addition,
production expectations became morepessimistic. Overall, this led to a worseningin industrial confidence which, whenmeasured on the basis of a three-monthcentred moving average, declined significantlytowards the end of the year to a level closeto its average over the past ten years. Asdevelopments in industrial confidencehave typically provided a fairly reliableguide to near-term developments inproduction and business fixed investment,recent trends would suggest that there mayhave been a further reduction in the growthrate of real GDP towards the end of 1998(see Chart 7).
On a seasonally adjusted basis, capacityutilisation declined by 0.3 percentage point inthe third quarter of last year but, at 83.3%,
1995 1996 1997 1997 1998 1998 1998 1998 1998 1998 1998 1998 1998
Q4 Q1 Q2 Q3 May June July Aug. Sep. Oct.
3-month centred moving averages
Real gross domestic product 2.2 1.6 2.5 3.2 3.8 2.5 2.4 - - - - - -
Industrial production excl. construction 3.4 0.0 4.1 5.7 6.3 4.4 4.0 4.4 4.7 4.0 4.0 . . of which:
Manufacturing 3.5 -0.2 4.7 6.4 7.3 5.0 4.3 5.0 5.3 4.4 4.3 . . by main industrial groupings:
Intermediate goods 2.5 -0.6 5.4 7.2 7.3 4.3 3.3 4.3 4.3 3.6 3.3 . .
Capital goods 7.3 1.7 4.2 6.1 9.2 6.6 7.0 6.6 7.5 6.7 7.0 . .
Consumer goods 1.0 -0.6 1.9 3.0 3.4 3.8 3.5 3.8 4.4 3.5 3.5 . .
Construction 0.0 -2.3 -1.2 -0.1 3.0 0.0 -1.9 0.0 0.7 -0.6 -1.9 . .
Capacity utilisation (%) 1) 82.6 80.3 81.6 82.7 83.1 83.6 83.3 - - - - - -
Economic sentiment index 0.6 -2.5 2.7 3.7 3.9 4.5 3.1 4.5 4.3 3.7 3.1 2.2 1.9
Consumer confidence indicator 2) -1 -8 -3 1 4 7 7 7 7 7 7 8 9
Industrial confidence indicator 2) 6 -8 3 8 10 10 7 10 9 8 7 5 3
Construction confidence indicator 2) -3 -13 -10 -8 -1 2 10 2 4 7 10 9 9
Retail sales, constant prices 2.0 1.1 0.9 2.2 2.7 1.8 3.0 1.8 2.7 2.9 3.0 . .
New passenger car registrations 0.3 6.6 3.9 11.2 12.6 3.3 7.5 3.3 6.5 6.6 7.5 5.1 7.8
Employment (whole economy) 0.4 0.2 0.3 0.5 1.0 1.1 1.4 - - - - - -
Unemployment (annual change in 000s) -306 422 105 -28 -417 -699 -901 -699 -797 -864 -901 -961 -1008
Unemployment (% of labour force) 11.4 11.6 11.7 11.6 11.3 11.1 11.0 11.1 11.1 11.0 11.0 10.9 10.9

ECB Month l y Bu l l e t i n • January 1999 33
remained 1½ percentage points above its long-term average and also above the peak levelrecorded in mid-1995. Up to the third quarterof 1998 equipment had been run at above-average levels of capacity for a year withoutinducing a strong pick-up in fixed capitalformation in order to ease capacity constraints.The explanation may be that expectations aboutthe order position and about production relatedmore to the immediate future, while investmentdecisions are typically taken on the basis ofconsiderations that take a longer time horizoninto account.
Concerning the construction sector, productiongrowth declined noticeably in the secondquarter of 1998 and turned negative in the third.However, confidence in the construction sectorstarted to increase in early 1998 and in thesecond half of the year exceeded somewhat thelevels seen during the short-lived recovery atthe end of 1994. While output developmentsover the first half of the year, taking into accountweather conditions, appeared to be in line with
a continuation of the gradual recovery thatstarted in the second half of 1997, third-quarterdata seem to indicate renewed weakness.Nevertheless, given sustained confidence, themost recent output data in this sector mightcontain temporary components.
An encouraging sign is that there has been noevidence as yet of a slowdown in consumptiondemand. Following a period of broadlyunchanged consumer confidence during thesummer months of last year, there was arenewed increase in optimism up to November,with confidence reaching a level that was onlymarginally below the highest level reached inthe past ten years. Actual and expectedincreases in employment as well as increases inpurchasing power owing to the fall in energyprices may have contributed to continuedimprovements in consumer confidence, asreported in recent European Commissionsurveys. Also, after taking into account theeffects of an increase in indirect taxes on thequarterly pattern in the first and second quarters
Sources: Eurostat and European Commission Business and Consumer Surveys.Note: For further information on the data used, see the respective tables and charts in the “Euro area statistics” section of this Bulletin.All data are seasonally adjusted; data for industrial production (total, excluding construction) and industrial confidence arethree-month centred moving averages.Latest observation: Real GDP: 2.4% (Q3 1998); industrial production (three-month centred moving average): 4.0% (Aug. 1998);industrial production (monthly): 3.4% (Sep. 1998); industrial confidence (three-month centred moving average): -5 (Oct. 1998).
Chart 7
Output and industrial confidence in the euro area(annual percentage changes; percentage balances for industrial confidence)
-8
-6
-4
-2
0
2
4
6
8
-35
-30
-25
-20
-15
-10
-5
0
5
Real GDP (left-hand scale)Industrial production (left-hand scale)
Industrial production, monthly (left-hand scale)Industrial confidence (right-hand scale)
1993 1994 1995 1996 1997 1998

ECB Month l y Bu l l e t i n • January 199934
of 1998, retail sales volumes appear to haveexpanded at a fairly stable rate of over 2%during the first half of the year. When measuredon the basis of three-month moving averages,latest data available for 1998 point to anacceleration.
Employment continued to increase
Notwithstanding recent signs of a weakening ineconomic activity, euro area employmentcontinued to improve during the autumn. Usingnational data, total employment in the euroarea is estimated to have risen by 0.4% in thethird quarter of 1998 compared with theprevious quarter. Thus the rise in employmentobserved from spring 1997 onwards wasconsolidated over the first three quarters of1998, with yearly growth rates rising above 1%(see Table 2). Employment in the manufacturingsector, which represents around one-fifth oftotal employment, also continued to increase inthe third quarter, albeit at a slower pace (0.4%quarter-on-quarter, compared with 0.8% and1.2% in the second and first quartersrespectively), reflecting the slowdown in activityin this sector. In turn, employment growth inother sectors, notably the services sector,appears to have accelerated somewhat.
Unemployment declined at a gradualpace
Reflecting recent increases in employment,unemployment in the euro area has declined sinceOctober 1997. However, the decline in thestandardised unemployment rate has been verygradual and the reduction, as measured bypublished data, has repeatedly stalled. This wasagain the case in November 1998, when theunemployment rate was estimated by Eurostatto have remained unchanged from the previousmonth at 10.8%, compared with 10.9%in September and 11.6% a year earlier. Onepossible explanation for the slow pace ofdecline in the unemployment rate is that morepeople may have been registering with labouroffices as a result of a growing perception thatjob prospects have been improving.
In terms of absolute levels, the number of joblessin the euro area is estimated to have fallen byjust over 1 million in the 12 months to November1998. This is approximately twice as much asthe fall in unemployment observed during theshort-lived upturn in 1994-95. According toEurostat data on unemployment by age, therecovery in net job creation appears to havebeen to the benefit of, in particular, people under25 years of age.
4 Exchange rate and balance of payments developments
Foreign exchange marketdevelopments reflect globaluncertainties
Even though financial markets in most partsof the world recovered towards the endof 1998, indicators of global economicconditions remained mixed, and the risksassociated with growth in world output andtrade continued to be predominantly on thedownside. As a result, foreign exchangemarkets remained relatively volatile inDecember.
Starting from a level of USD 1.15 at end-November, the ECU appreciated against the
dollar in the first half of December to reach alevel of USD 1.18, inter alia amid some leadingindicators and corporate profit developmentspointing to a slowdown in the US economy.However, subsequent data releases showedsolid growth of the US economy in the thirdquarter of 1998 and a number of indicatorssuggested continued strong consumerexpenditures. As a result, later in Decemberthe ECU depreciated somewhat and, atUSD 1.17, ended the month slightly above itsend-November level. The euro, after the firstfew days of trading, stood at USD 1.16 at theend of the reporting period, i.e. on 7 January1999.

ECB Month l y Bu l l e t i n • January 1999 35
Latest observation: Nominal effective: 94.0 (Dec. 1998); real effective: 93.6 (Dec. 1998).
Source: BIS.1) Data shown are bilateral exchange rates against the ECU up to the end of 1998. From the start of 1999 data are euro exchange
rates. For the first week of January 1999, data are the average values for the period from 4 to 7 January 1999.2) BIS calculations; data are weighted averages of euro area countries’ effective exchange rates against the euro area’s trading
partners (see Table 10 in the “Euro area statistics” section of this Bulletin). An upward movement of the index represents acurrency appreciation for the euro area. Horizontal lines are averages over the period shown.
Patterns in exchange rates 1)
(weekly averages)
1995 1996 1997 19981.00
1.10
1.20
1.30
1.40
1.50
0.600.650.700.750.800.850.90
USD/EUR (left-hand scale) GBP/EUR (right-hand scale)
Latest observation: USD/EUR: 1.17 (4 Jan. to 7 Jan. 1999); GBP/EUR: 0.71 (4 Jan. to 7 Jan. 1999).
1999
1995 1996 1997 1998110120130140150160170
1.5
1.6
1.7
1.8
1.9
2.0JPY/EUR (left-hand scale) CHF/EUR (right-hand scale)
Latest observation: JPY/EUR: 131.39 (4 Jan. to 7 Jan. 1999); CHF/EUR: 1.61 (4 Jan. to 7 Jan. 1999).
1999
1990 1991 1992 1993 1994 1995 1996 1997 199885
90
95
100
105
110
85
90
95
100
105
110Nominal Real, CPI
Effective exchange rates of the euro area; index 1990 = 100 2)
(monthly averages)
Chart 8

ECB Month l y Bu l l e t i n • January 199936
Against the Japanese yen the ECU depreciatedsignificantly during December, falling fromJPY 142 at end-November to a level of JPY 133at end-December. This primarily reflected thestrong appreciation of the yen against the dollar,which was seen by the markets as mainly relatedto repatriation flows to Japan rather than tofundamental improvements in the economicoutlook for the Japanese economy. Accordingto the Bank of Japan’s quarterly “Tankan”survey, business sentiment actually worsenedslightly in December, compared with thesituation three months earlier. On 7 January1999 the euro was quoted at JPY 129.
Vis-à-vis the currencies of the other majortrading partners, the United Kingdom andSwitzerland, the ECU closely followed thepattern vis-à-vis the US dollar in the case of thepound sterling, while remaining broadlyunchanged against the Swiss franc. At the end ofthe reporting period, the euro exchange rateagainst the pound sterling was GBP 0.71. Againstthe Swiss franc, the euro stood at CHF 1.62.
Euro area effective exchange ratestable
Owing to roughly offsetting movements vis-à-visthe US dollar and the pound sterling, on the onehand, and the yen, on the other, the nominaleffective exchange rate of the euro areacurrencies, as measured by the Bank forInternational Settlements (BIS), remained broadly
unchanged in December from the month before(see Chart 8). Its December 1998 average levelwas, however, around 4% higher than thatrecorded on average in the first half of 1998. Itthereby made up ground lost in the course of1997, while remaining somewhat below theaverage level observed during the 1990s.In real terms, deflated by the relative CPIs, theeffective exchange rate of the euro area inDecember 1998 was estimated at around 3.5%above its average level in the first half of 1998,while also remaining below its long-termaverage level. During the first few daysof January 1999 the nominal effectiveexchange rate of the euro area remainedbroadly unchanged.
Cumulative trade balance surplusalmost unchanged
Little information is available as yet on overallbalance of payments developments for the euroarea (see Box 6). Against this background,remarks are made only on external trade dataproduced by Eurostat, based on gross data forexports and imports between the euro areaand the rest of the world, excluding intra-euroarea transactions. Balance of payments data willbecome available in the course of 1999.
In summary, the trade balance surplus for theeuro area in September 1998 (the latest monthfor which data are available) was ECU 5.2 billion,i.e. ECU 1.6 billion lower than in the
Table 3Trade in goods of the euro area
Source: Eurostat.1) In the year to date.
1996 1997 1997 1997 1997 1997 1998 1998 1998 1998 1998Q1 Q2 Q3 Q4 Q1 Q2 Q3 Aug. Sep.
ExportsECU billions 663.9 754.4 168.6 189.7 191.7 204.4 192.6 202.6 193.5 55.8 65.6Annual percentage changes 7.3 13.6 7.3 15.1 18.6 13.4 14.3 6.8 1.0 1.8 -3.2
ImportsECU billions 590.5 666.8 156.7 166.2 165.7 178.3 180.1 178.3 168.7 49.5 60.4Annual percentage changes 5.7 12.9 6.3 13.3 18.0 14.3 15.0 7.3 1.8 1.7 -1.0
Trade balanceECU billions 73.5 87.6 11.9 23.6 26.0 26.1 12.5 24.3 24.8 6.3 5.2ECU billions, cumulative 1) 73.5 87.6 11.9 35.5 61.5 87.6 12.5 36.9 61.7 56.5 61.7
ECB Month l y Bu l l e t i n • January 1999 37
corresponding month in 1997. Focusing on thethird quarter of 1998, the value of exports, atECU 194 billion, was only marginally higher thanin the third quarter of 1997. Imports of goodslikewise increased only modestly, fromECU 166 billion to ECU 169 billion, over thesame period. This contrasts sharply with thehigh growth rates seen for imports and exportsin the period up to early 1998, i.e. before the
world economy was adversely affected bydevelopments in Asia and Russia. Over the firstnine months of the year the cumulative surplusin the trade balance reached ECU 61.7 billion, afigure virtually unchanged in nominal terms fromthat for the same period in 1997. Underlyingthese developments were declining commodityprices, on the one hand, and weaker demandfor exports, on the other.
Box 6The balance of payments for the euro area: methodological issues
The production of overall balance of payments figures for the euro area is undergoing a major methodological
revision. Euro area balance of payments aggregates could be compiled, in principle, by adding up the net
balances of payments of the individual Member States involved. In theory, such a method should yield
accurate estimates of the net balance of payments of the 11 participating countries vis-à-vis the rest of the
world, since the addition of national data would imply the netting-out of intra-euro area transactions. In
practice, however, bilateral data do not fully match, resulting in discrepancies at the euro area level.
In order to overcome such problems, for data starting from January 1999 onwards, and for historical data, each
Member State will provide balance of payments data which are compiled using an alternative common
methodology. The euro area balance of payments statistics will be compiled by aggregating – on a gross
basis – the extra-euro area balance of payments data reported by the 11 participating countries. As from April
1999 the ECB will publish monthly balance of payments figures using this methodology.
As from July 1999 the ECB will also publish, in co-operation with the Statistical office of the European
Commission (Eurostat), a quarterly balance of payments for the euro area with a more detailed breakdown of
the main items of the financial account (direct investment, portfolio investment, financial derivatives, other
investment and reserve assets) as well as investment income.

ECB Month l y Bu l l e t i n • January 199938

39ECB Month l y Bu l l e t i n • January 1999
The stability-oriented monetary policystrategy of the Eurosystem
In October and December 1998, the Governing Council of the European Central Bank (ECB) announced themain elements of its stability-oriented monetary policy strategy to the public. This strategy is designed to maintainprice stability in the euro area, thereby fulfilling the mandate given to the European System of Central Banks(ESCB) by the Treaty establishing the European Community (the “Treaty”). The strategy will guide the singlemonetary policy of the Eurosystem, i.e. the ECB and the national central banks (NCBs) of the 11 MemberStates which adopted the euro from the start of Stage Three of Economic and Monetary Union (EMU) (see“The Eurosystem and the European System of Central Banks (ESCB)” in this Bulletin). The stability-orientedstrategy of the Eurosystem consists of three main elements: a quantitative definition of the Eurosystem’s primaryobjective, namely price stability, and the “two pillars” of the strategy used to achieve this objective. These pillarsare a prominent role for money, as signalled by the announcement of a quantitative reference value for thegrowth rate of a broad monetary aggregate, and a broadly based assessment of the outlook for pricedevelopments and risks to price stability in the euro area as a whole.
1 Price stability and its importance
The Treaty states that “the primary objective of theESCB shall be to maintain price stability” (see Box 1:The Eurosystem’s mandate: Key excerpts fromthe Treaty). In order to fulfil this clearly definedmandate, the Treaty accords the ESCB and, byimplication, the Eurosystem a considerabledegree of institutional independence, albeitsupplemented by extensive obligationsconcerning transparency and accountability.
The logic of the Treaty is clear. Byunambiguously assigning the primary objective
of price stability to an independent central bank,the Treaty recognises that focusing monetarypolicy on the maintenance of price stability inthe euro area ensures that it will make the bestpossible contribution to the broader economicobjectives of the European Union and itscitizens. This view is rooted in the belief –confirmed by decades of practical experienceand a substantial body of empirical economicresearch – that a monetary policy that maintainsprice stability in a credible and lasting way willmake the best overall contribution to improving
Box 1The Eurosystem’s mandate: Key excerpts from the Treaty
Article 105 (1)
The primary objective of the ESCB shall be to maintain price stability. Without prejudice to the objective of
price stability, the ESCB shall support the general economic policies in the Community with a view to
contributing to the objectives of the Community as laid down in Article 2.
Article 2
The Community shall have as its task … to promote throughout the Community a harmonious and balanced
development of economic activities, sustainable and non-inflationary growth respecting the environment, a
high degree of convergence of economic performance, a high level of employment and of social protection,
the raising of the standard of living and quality of life, and economic and social cohesion and solidarity among
Member States.
Article 3a
For the purposes set out in Article 2, the activities of the Member States and the Community shall include …
the definition and conduct of a single monetary policy and exchange-rate policy the primary objective of both
of which shall be to maintain price stability and, without prejudice to this objective, to support the general
economic policies in the Community.

ECB Month l y Bu l l e t i n • January 199940
economic prospects and raising living standards.Box 2 reviews the main arguments why thebenefits of price stability for growth andemployment are substantial.
The Treaty also recognises that theEurosystem’s single monetary policy willinteract with policies implemented by otherinstitutions in the European Union. Given the
potential risk of political intervention in thedesign and implementation of the singlemonetary policy, the Treaty made the ECB andthe national central banks (NCBs) independentof national governments and politicalinterference. This institutional independenceallows the Eurosystem to pursue price stabilityin an appropriate medium-term framework andthereby significantly enhances the credibility of
Box 2The benefits of price stability
A large number of economic arguments point to the benefits of price stability. This box focuses specifically
on the benefits of price stability for real economic growth and employment prospects. Among the main
arguments are:
1. Price stability improves the transparency of the relative price mechanism, thereby avoiding distortions
and helping to ensure that the market will allocate real resources efficiently both across uses and across
time. A more efficient allocation will raise the productive potential of the economy. In this sense, price
stability creates an environment in which the necessary structural reforms implemented by national
governments to increase the flexibility and efficiency of markets can be most effective.
2. As discussed in the main text, stable prices minimise the inflation risk premium in long-term interest
rates, thereby lowering long-term rates and helping to stimulate investment and growth.
3. If the future price level is uncertain, real resources are diverted to hedging against inflation or deflation,
rather than being put to productive use. Credibly maintaining price stability avoids these costs and
provides the environment for efficient real investment decisions. Price stability also eliminates the real
costs entailed when inflation or deflation exacerbates the distortionary effects of the tax and welfare
system on economic behaviour.
4. Maintaining price stability avoids the large and arbitrary redistribution of wealth and incomes that arises
in inflationary as well as deflationary environments, and therefore helps to maintain social cohesion and
stability.
These arguments collectively suggest that maintaining price stability in itself contributes to the achievement
of output or employment goals. The logic underlying both the Treaty and the Eurosystem’s stability-
oriented monetary policy strategy is therefore that output and employment goals are best served by a
monetary policy that focuses on price stability.
In addition, the empirical evidence strongly suggests that the benefits of price stability for real economic
performance are significant. Several studies have shown that, across a large number of countries, nations
with lower inflation appear, on average, to grow more rapidly (for example, Robert J. Barro demonstrates
this in Determinants of economic growth, MIT Press, 1997). Furthermore, empirical estimates of the
benefits of price stability can be very substantial. A number of studies have shown that the costs incurred
when inflation exacerbates the distortions inherent in tax and benefit systems are considerable (see, for
example, Martin S. Feldstein, Costs and benefits of price stability, Chicago University Press, to be published
in 1999). Extension of this analysis to several euro area countries suggests that the benefits of maintaining
price stability in these contexts may be even higher than in the United States.

41ECB Month l y Bu l l e t i n • January 1999
monetary policy. It is widely recognised that acentral bank lacking independence issusceptible to short-term pressures that maybe prejudicial to the maintenance of pricestability. The Eurosystem’s institutionalindependence, as guaranteed in the Treaty,therefore serves the interests of the public,which benefits from the resulting environmentof stable prices.
Price stability and the exchangerate
However, institutional independence does notmean isolation. The Eurosystem will interactwith other policy-makers, for example withregard to exchange rate policy. Since exchangerate policy must be consistent with monetarypolicy, the Treaty states that the primaryobjective of the Community’s exchange ratepolicy is the maintenance of price stability. Inthis context, the Treaty assigns the Eurosystemthe “basic task” of conducting “foreignexchange operations consistent with theprovisions of Article 109”. Article 109 foreseesthat the Council of Ministers (in thecomposition of the Ministers of Finance), actingwith unanimity, may conclude “formalagreements on an exchange rate system for theeuro in relation to non-Community currencies”.In addition, it notes that, acting with a qualifiedmajority, the Council of Ministers can also issue“general orientations” to the Eurosystemconcerning exchange rate policy. Regarding theformer issue, the Council of Ministers clarifiedin a report to the European Council inDecember 1997 that, in all likelihood, a formalexchange rate system of this type will not beestablished in the foreseeable future. In thesame report, the Council of Ministersannounced, albeit in a not legally binding form,that they will only issue “orientations” inexceptional circumstances, for example in thecase of a clear misalignment.
In the present circumstances – in which thereis neither a formal exchange rate agreementnor a general orientation – the euro exchangerate is the outcome of current and expectedmonetary and other policies in both the euroarea and elsewhere, and of the perception of
these policies by market participants. As theEurosystem’s monetary policy strategy does notembody an exchange rate target for the euro,the task of focusing on the maintenance ofprice stability in the euro area is facilitated.
Monetary policy and support forgeneral economic policies
Reflecting the broad need for mutual co-operation and dialogue among policy-makers inan interdependent environment, the Treatyrequires the Eurosystem to “support the generaleconomic policies in the Community with a view tocontributing to the objectives of the Communitylaid down in Article 2”. At the same time, infurther recognition of the dangers of politicalinterference in monetary policy, the Treatystates that the Eurosystem’s actions must be“without prejudice to the objective of pricestability”. Both the logic of the Treaty and theargumentation in Box 2 strongly suggest thatthe best contribution the single monetarypolicy can make in this supportive role is tofocus unambiguously on maintaining pricestability over the medium term and therebycreating the stable environment in which otherpolicies can be most effective. In the absenceof such recognition, the danger exists that thepublic would come to doubt the Eurosystem’scommitment to maintaining price stability.Inflation expectations and risk premia wouldrise, increasing longer-term interest rates andraising the cost of investment required toproduce sustainable and lasting increases in thestandard of living.
In this respect, the Governing Council of theECB is highly concerned about the current highlevel of unemployment in the euro area.However, this problem is overwhelminglystructural in origin. It is caused mainly by theinflexibility of euro area labour and goodsmarkets resulting, in part, from excessive orinappropriate regulation in these markets.Structural economic reforms aimed at reducingthese inflexibilities are the appropriate policyresponse. In those euro area countries wheresuch reforms have been implemented,unemployment has fallen substantially. Effectiveeuro area-wide structural policies would lead

ECB Month l y Bu l l e t i n • January 199942
to higher trend real growth. Within itsmonetary policy strategy, the Eurosystemwould naturally take account of such highergrowth. However, attempting to reduceunemployment by implementing an inflationarymonetary policy would ultimately be self-defeating, since such a policy would onlyundermine price stability over the mediumterm, which is the basis for lasting andsustainable employment growth.
Transparency and accountability
All central banks operate in a certain social,
political and institutional environment. In ademocratic context, it is vital that anindependent central bank is open, transparentand clear about the reasoning for its actions,and accountable for its performance.Recognising the importance of these issues inthe euro area, the Treaty imposes on theEurosystem some of the most stringentreporting obligations required of any centralbank. In practice, the Eurosystem has alreadycommitted itself to exceeding even thesestringent requirements (see Box 3:Transparency and accountability of theEurosystem).
Box 3Transparency and accountability of the Eurosystem
In general, central banks should be open, transparent and accountable, reporting fully to the public on their
activities, including their conduct of monetary policy. A transparent and accountable central bank reinforces
its credibility by communicating clearly with the public and thereby signalling that its monetary policy is
appropriately oriented to the maintenance of price stability. In this regard, the Eurosystem meets or exceeds
the best practices of any central bank.
The President of the ECB will hold a press conference immediately after the first Governing Council
meeting of every month. On these occasions, the President will present an extensive statement of the
Council’s view of the economic situation and the outlook for price developments, followed by a question
and answer session. The schedule for these meetings and conferences has already been announced for 1999.
This regular statement will be supplemented by the publication of a Monthly Bulletin. The Monthly Bulletin
is intended to provide the general public and financial markets with a thorough assessment of the economic
environment, as well as with articles about the economy’s structure and topical issues important for the
single monetary policy.
Furthermore, the Eurosystem’s balance sheet will be published weekly. An annual report on the activities of
the Eurosystem must be produced, supplemented by the production of quarterly reports. These reports are to
be submitted to the European Parliament, the Council of Ministers and the Commission of the European
Communities. The European Parliament will hold a general debate on the reports that it receives. The ECB
President and Executive Board members have to answer questions posed by the European Parliament’s
committees. The President will appear before the parliamentary committee five times each year, following
the submission of the quarterly and annual reports mentioned above.
In speeches, members of the Governing Council will also inform the public about monetary policy and the
economy. Working papers and technical analysis by ECB staff will be published for professional review and
scientific assessment. These articles and other presentations will address not only the central issue of
monetary policy and the monetary transmission mechanism, but also the major economic problems facing
Europe, not least the problem of the high level of unemployment.
Through all these media, the ECB is committed to communicating with the public in a clear and transparent
manner. Against this background, the Eurosystem clearly demonstrates high levels of transparency and
accountability.

43ECB Month l y Bu l l e t i n • January 1999
2 The role of a monetary policy strategy
The primary objective of the single monetarypolicy is the maintenance of price stability.However, the Eurosystem, like all centralbanks, cannot control the price level directlyby using the monetary policy instruments at itsdisposal. Instead, central banks face a complextransmission process from their own monetarypolicy actions to changes in the general pricelevel. This transmission mechanism ofmonetary policy is characterised by theexistence of several distinct channels, eachwith long, variable and not fully predictablelags. Moreover, the transmission mechanismitself is continuously evolving in response tochanges in economic behaviour andinstitutional structure.
Because the transmission mechanism iscomplex, the preparation, discussion andpresentation of monetary policy decisionsmust be placed in a coherent clarifyingframework. This is the role of the monetarypolicy strategy. The strategy fulfils two crucialtasks.
• First, the strategy imposes a clear structureon the policy-making process itself. Thestrategy must ensure that the GoverningCouncil has the information and analysis itrequires to take effective monetary policydecisions that will maintain price stability.The Governing Council must work within acoherent analytical framework that allowsdevelopments in the economicenvironment to be mapped intoappropriate decisions on the terms offeredin the Eurosystem’s open marketoperations and on its standing facilities.Using these instruments, the Eurosystemcan exercise considerable operationalcontrol over short-term market interestrates, which then feed through to othereconomic variables and, ultimately, theprice level.
• Second, the Eurosystem’s monetary policystrategy is a vehicle for communicating withthe public. Monetary policy is mosteffective when it is credible – that is, whenthe public is completely confident thatmonetary policy is fully committed to theobjective of price stability and is beingimplemented in a manner that willeffectively achieve this goal. Therefore, themonetary policy strategy must not onlysignal the overriding objective of monetarypolicy, but must also convince the publicthat this objective will be achieved.
In designing a monetary policy strategy to fulfilthese two complementary roles, knowledgeabout how the economy works is essential. Inparticular, an awareness is required regardingthe information about future threats to pricestability that can be extracted from observingcurrent developments in the economicsituation; that is, the indicator properties ofmonetary, financial and other economicvariables for price developments must beanalysed.
Moreover, it is vital to understand broadlyhow monetary policy, through short-termnominal interest rates, will affect the economyin general and, ultimately, the price level.Understanding the transmission mechanismwill help to allow judgements to be formedabout whether the policy measures taken areappropriate to address the threats to pricestability revealed by the indicator variables.
A monetary policy strategy is therefore acoherent and structured description of howmonetary policy decisions will be made in thelight of the behaviour of economic indicators,in order to achieve the overriding objective ofprice stability.

ECB Month l y Bu l l e t i n • January 199944
3 Criteria for selecting the monetary policy strategy of the Eurosystem
General criteria
In order to fulfil the aims described above, theEurosystem’s monetary policy strategy mustsatisfy certain general criteria. Foremostamong these criteria is the principle ofeffectiveness. The best monetary policy strategyfor the Eurosystem is the one which bestensures the achievement of, and signals acredible and realistic commitment to, theprimary objective of price stability.
As discussed above, for a monetary policystrategy to be effective, it must be credible. Inother words, the public in general, and thefinancial markets in particular, must beconvinced that the Governing Council of theECB is committed to maintaining price stability,has the instruments and expertise to do so,and is implementing monetary policy with thisobjective in mind.
In order to build a good reputation, andthereby the necessary credibility to implementthe single monetary policy successfully andeffectively, the Eurosystem’s monetary policystrategy has to satisfy a number of othercriteria.
♦ The strategy must be clear andunderstandable. If there is ambiguity aboutthe objective of monetary policy or howthis objective will be achieved,unnecessary uncertainty will be created inthe minds of the public.
♦ Furthermore, the strategy must betransparent. The public must be presentedex ante with information about howmonetary policy decisions are being madeby the Governing Council and theeconomic rationale on which they arebased.
♦ The strategy must ensure that theEurosystem is accountable both for itspolicy actions and for its performance inachieving the primary objective of pricestability. In the view of the Governing
Council, this entails the publication of aquantified objective against which thepublic can sensibly judge the performanceof the Eurosystem and its single monetarypolicy.
♦ Finally, the strategy must be consistent withthe Eurosystem’s institutional independence.
The specific environment at the startof Monetary Union
In addition to the general criteria outlinedabove, certain important characteristics of thespecific environment faced by the Eurosystemat the start, and in the early years, of StageThree have also had to be taken into account.
Building credibility is particularly important forthe ECB at the outset of Stage Three since it isa new institution, lacking an independent trackrecord or reputation of its own. Theparticipating NCBs that are components of theEurosystem have, over the years, built up astrong reputation for maintaining pricestability. By ensuring as much continuity aspossible with the objectives and successfulperformance of the NCBs prior to MonetaryUnion, the Eurosystem can inherit thisreputation, to the benefit of its credibility inthe future.
However, the Eurosystem faces a uniquesituation at the start of Monetary Union. Ofparticular concern to the Eurosystem in thesespecial circumstances are those uncertaintiesthat inevitably arise as a result of the move toStage Three itself. These relate, in particular,to the way in which the transition to StageThree of EMU will affect economic behaviour,institutional structures and statistical series inthe euro area.
The adoption of the single monetary policymarks a significant regime shift. Thetransformation of the institutional arrangementsfor deciding and implementing monetary policywill change the structure of important sectors

45ECB Month l y Bu l l e t i n • January 1999
of the economy, especially the financial system.Moreover, the regime shift is likely to changethe way expectations are formed in the euroarea. This may already have been seen in recentyears in many countries, where the adoption ofa credible and lasting commitment to pricestability has been stabilising longer-terminflation expectations at new, low levels.
As a consequence, empirical relationshipsbetween economic variables that have beenestimated using data from the past maybecome unstable should behaviour change inthis new environment. These changes maycomplicate the Eurosystem’s assessment ofeconomic conditions because the indicatorproperties of monetary, financial and othereconomic variables for future pricedevelopments may be altered.
As regards the structure of the euro areaeconomy, behavioural changes at the outset ofStage Three might be particularly pronouncedin the financial sector, where the impact ofMonetary Union may be most immediate. Forexample, the behaviour of monetary aggregates– which consist largely of bank deposits – mightbe affected by the transition to Stage Three.The introduction of the euro could also lead tochanges in the banking system and to privateportfolio shifts between monetary and non-monetary assets.
However, structural and institutional changewill not be limited to the financial system. Inconjunction with the single market programme,the elimination of currency risk in the euroarea will increase the transparency of pricing ingoods and labour markets and thereby probably
raise the intensity of competition andinnovation. More generally, consumption andinvestment behaviour may be affected by theregime shift to an environment of stable prices.In these circumstances, conductingmacroeconomic analyses and forecasts will alsobe complicated, since the historical empiricalrelationships on which they are largely basedmay begin to break down.
These uncertainties – arising directly from thetransition to Stage Three itself – will be bothcompounded by and inter-related with thebroader economic context in which MonetaryUnion will be established. The increasinginternationalisation of the global economy, andthe current rapid pace of technologicalchange, have affected all sectors of theeconomy. All these effects may change theproperties of key indicator variables, whichwill therefore have to be interpreted withspecial caution and care.
Furthermore, in many respects, MonetaryUnion has created an entirely new economicarea for which comprehensive and harmoniseddata have not been collected in the past. Anumber of fully, or almost fully, harmonisedseries are now available. These include theeuro area monetary data, the balance ofpayments data and the Harmonised Index ofConsumer Prices (HICP). However, theseeuro area-wide statistics are based, in part, onnew concepts, and the properties of the seriesare not yet well known. Therefore, theuncertainty facing policy-makers concerningthe indicator properties of the available euroarea statistics is larger than has typically beenthe case in national contexts in the past.
4 The stability-oriented monetary policy strategy of the Eurosystem
Having considered various options on the basisof the criteria and considerations outlinedabove, the Governing Council of the ECBannounced the Eurosystem’s stability-orientedmonetary policy strategy to guide its monetarypolicy decisions in Stage Three of EMU. Themain elements of this strategy were presentedto the public on 13 October 1998, and have
subsequently been elaborated in speeches andstatements by the President of the ECB andother members of the Governing Council. Thestrategy consists of three main elements:
♦ a quantitative definition of the primaryobjective of the single monetary policy,namely price stability; and

ECB Month l y Bu l l e t i n • January 199946
♦ the “two pillars” of the strategy used toachieve this objective:• a prominent role for money, as signalled
by the announcement of a referencevalue for the growth of a broad monetaryaggregate; and
• a broadly based assessment of theoutlook for future price developmentsand the risks to price stability in the euroarea as a whole.
The quantitative definition ofprice stability
The definition
The Governing Council has decided to publisha quantitative definition of price stability. Apublished definition gives clear guidance toexpectations of future price developments,helping to build up the credibility of the newstrategy. The publication of the Eurosystem’sdefinition of price stability also provides thepublic with a clear indication for making itsassessment of the success of the singlemonetary policy, thereby making theEurosystem and its stability-oriented monetarypolicy strategy transparent and accountable.
Against this background, the GoverningCouncil of the ECB has adopted the followingdefinition: “price stability shall be defined as ayear-on-year increase in the Harmonised Index ofConsumer Prices (HICP) for the euro area of below2%”. Price stability according to this definition“is to be maintained over the medium term”.
The phrase “below 2%” clearly delineates theupper bound for the rate of measured inflationin the HICP which is consistent with pricestability. At the same time, the use of the word“increase” in the definition clearly signals thatdeflation, i.e. prolonged declines in the level ofthe HICP index, would not be deemedconsistent with price stability.
It should be noted that the Eurosystem’sdefinition of price stability is in line with thedefinitions used by most NCBs in the euro areaprior to the transition to Monetary Union,
ensuring an important element of continuitywith their successful monetary policy strategies.
The HICP index
The chosen definition identifies the HICP asthe price index that should be used in theassessment of whether price stability has beenachieved and maintained. This index was initiallycreated for the assessment of priceconvergence in Stage Two and is largelyharmonised across the various countries in theeuro area. Use of the HICP is also consistentwith the public’s usual focus on consumer pricesin its assessment of developments in the pricelevel.
Among economists in academic, financial andcentral banking circles, there is a broadconsensus that various forms of so-called“measurement bias” can exist in consumer priceindices (CPIs). These biases arise mainly fromchanging spending patterns and qualityimprovements in those goods and services thatare included in the basket used to define aspecific price index. Such biases cannot alwaysbe fully corrected in the construction of priceindices. The measurement bias typically causesCPIs to overstate slightly the “true” rate ofinflation.
The HICP for the euro area is a relatively newconcept and long runs of back data do notexist. Therefore, studies of the magnitude ofthe HICP measurement bias are preliminaryand inconclusive. Eurostat has expendedconsiderable effort to reduce or eliminate themeasurement bias in the HICP. It is thereforeprobable that the bias in the HICP is smallerthan that observed in national CPIs of thecountries comprising the euro area. Moreover,the available empirical evidence suggests thatthe measurement bias in national CPIs for euroarea countries is smaller than that which hasbeen estimated in a number of prominentstudies of consumer price indices in othercountries.
The success of these attempts to minimise themeasurement bias in the HICP is as yetunknown. Furthermore, the size of the

47ECB Month l y Bu l l e t i n • January 1999
measurement bias is likely to change over timeas the structure of the economy evolves andstatistical methods change, partly in responseto these changes in economic structure.Therefore, the definition has avoided explicitlyembodying specific estimates of the HICPmeasurement bias, while allowing for such biasby not setting the lower bound for measuredprice level increases at zero.
Finally, the Governing Council explained that,by defining price stability in terms of the HICPfor the euro area, it has made clear that itsdecisions will be based on an assessment ofdevelopments in the euro area as a whole.With a unified monetary policy, policydecisions must be made in a manner thatreflects conditions across the euro area in itsentirety, rather than specific regional ornational developments.
Medium-term orientation
The statement that “price stability is to bemaintained over the medium term” reflects theneed for monetary policy to have a forward-looking, medium-term orientation. It alsoacknowledges the existence of short-termvolatility in prices, resulting from non-monetaryshocks to the price level that cannot becontrolled by monetary policy. The effects ofindirect tax changes or variations in internationalcommodity prices are good examples. TheEurosystem cannot be held responsible for theseshort-term shocks to the price level, over whichit has little control. Rather, assessing theperformance of the Eurosystem’s singlemonetary policy over the medium term ensuresgenuine and meaningful accountability.
Furthermore, in response to some types ofunforeseen economic disturbance with animpact on the price level that may threatenprice stability, a medium-term orientation ofmonetary policy is important in order topermit a gradualist and measured response.Such a central bank response will notintroduce unnecessary and possiblyself-sustaining uncertainty into short-terminterest rates or the real economy, whilenevertheless ensuring that price stability –
and the benefits that it brings – is maintainedover the medium term.
The two pillars of the strategy
The reference value – a prominent role formoney
Inflation is ultimately a monetary phenomenon.The Governing Council therefore recognisedthat giving money a prominent role in theEurosystem’s strategy was important. Moneyconstitutes a natural, firm and reliable “nominalanchor” for monetary policy aiming at themaintenance of price stability. The importantrole played by money in the overall stability-oriented strategy also emphasises theresponsibility of the Eurosystem for themonetary impulses to inflation, which a centralbank can control more readily than inflationitself.
To signal the prominent role it has assigned tomoney, the Governing Council has announceda quantitative reference value for monetarygrowth as one pillar of the overall stability-oriented strategy. The reference value isintended to help the Governing Councilanalyse and present the information containedin the monetary aggregates in a manner thatoffers a coherent and credible guide formonetary policy aimed at price stability.
Two characteristics of the quantitativereference value for monetary growth shouldbe emphasised.
♦ First, the reference value was derived in amanner that is consistent with – and servesthe achievement of – price stability. Toensure that the reference value isconsistent with the maintenance of pricestability over the medium term, moneymust have a stable relationship with theeuro area price level at this horizon. Thestability of this relationship is typicallyassessed in the context of a money demandfunction, where a specific monetaryaggregate is related to the price level andother macroeconomic variables, such asreal income and interest rates.

ECB Month l y Bu l l e t i n • January 199948
♦ Second, substantial or prolonged deviationsof monetary growth from the referencevalue would, under normal circumstances,signal risks to price stability over themedium term. This feature requires boththat a stable relationship between moneyand the price level exists and that monetarygrowth is a leading indicator ofdevelopments in the price level.
However, the concept of a reference valuedoes not entail a commitment on the part ofthe Eurosystem to correct deviations ofmonetary growth from the reference valueover the short term. Interest rates will not bechanged “mechanistically” in response to suchdeviations in an attempt to return monetarygrowth to the reference value. Therefore, theeuro area monetary aggregate for which thereference value is announced does not need tobe controllable in the short run, using a short-term nominal interest rate influenced closelyby the Eurosystem. This is one of the maindifferences between setting a reference valueand announcing an intermediate monetarytarget.
The available empirical evidence suggests thatbroad monetary aggregates (i.e. measures ofmoney that include a wide spectrum ofdeposits, embracing time and savings deposits,as well as close substitutes for them, such asmarketable short-term bank liabilities) exhibitthe properties required for the announcementof a reference value. In the past, the demandfor euro area broad money has been stableover the long run. Broad aggregates have beenleading indicators of developments in the pricelevel. This contrasts with the empiricalproperties of euro area narrow money, which,although controllable using short-term nominalinterest rates, exhibited neither stability withnor significant indicator properties for the pricelevel. Of course, this evidence has to be treatedwith some caution, given the statistical andeconomic uncertainties highlighted above.Nevertheless, the empirical evidence has beenjudged strong and robust enough for areference value to be announced for a broadmonetary aggregate. The Governing Councilhas chosen to announce a reference value for
the aggregate M3, defined in an encompassingmanner to include not only currency incirculation and the conventional depositcomponents of broad money, but also both theshares/units of money market funds (MMFs)and debt securities issued by monetary financialinstitutions (MFIs). Conceptual and empiricalaspects of the euro area monetary aggregatesare discussed in more detail in an article toappear in the February 1999 Monthly Bulletin.
Against this background, the reference valuefor monetary growth has been derived usingthe well-known relationship between money,on the one hand, and prices, real gross domesticproduct (GDP) and the velocity of circulation,on the other. For prices, the derivation of thereference value has to be based on theEurosystem’s published definition of pricestability. Furthermore, in view of the medium-term orientation of monetary policy, it isappropriate to base the derivation of thereference value on assumptions about medium-term developments in both real GDP and thevelocity of circulation. In this respect, assumingtrend growth for real GDP would tend toimpart a counter-cyclical property to monetarypolicy, as GDP growth below trend wouldnormally be associated with lower monetarygrowth relative to a reference value derivedusing trend output.
On 1 December 1998 the Governing Councilannounced its reference value for M3 growth.The derivation of the reference value wasbased on the following medium-termassumptions.
♦ Price stability must be maintainedaccording to the Eurosystem’s publisheddefinition, so that year-on-year increasesin the HICP for the euro area are below2%.
♦ The trend of real gross domestic product(GDP) growth lies in the range 2-2½% perannum.
♦ Over the medium term, the decline in thevelocity of circulation of M3 is in theapproximate range ½-1% each year.

49ECB Month l y Bu l l e t i n • January 1999
In setting the reference value for monetarygrowth, the Governing Council emphasisedthat the Eurosystem’s published definition ofprice stability limits increases in the HICP forthe euro area to “below 2%”. Furthermore, theactual trend decline in velocity is likely to liesomewhat below the upper bound of its ½-1%range. Taking account of these two factors, theGoverning Council decided to set its referencevalue for M3 growth at 4½% per annum.
The Governing Council decided to announce aspecific reference rate for monetary growth,rather than a reference range, on the basis thatannouncing a reference range might be falselyinterpreted by the public as implying thatinterest rates would be changed automaticallyif monetary growth were to move outside theboundaries of the range, something that wouldbe contrary to the role of the reference valuein the overall strategy.
The reference value will help to inform andpresent interest rate decisions aimed atmaintaining price stability over the mediumterm. Therefore, in the first instance, adeviation of monetary growth from thereference value will prompt further analysis toidentify and interpret the economic disturbancethat caused the deviation. If this analysissuggests that the disturbance identified indeedpoints to a threat to price stability, monetarypolicy would respond in a manner appropriateto counter this risk. The relationship betweenactual monetary growth and the reference valuewill therefore be regularly and thoroughlyanalysed by the Governing Council. The resultsof this analysis and its impact on monetarypolicy decisions will be explained to the public.Through this process monetary policy decision-making will be made both clearer and moretransparent.
While the presentation of monetary analysis tothe public will naturally focus on developmentsin the “key” broad monetary aggregate M3 inrelation to the published reference value formonetary growth, developments in othermonetary aggregates, in the variouscomponents of M3, and in the counterparts toall these aggregates in the consolidated MFI
balance sheet will also be thoroughly assessedon an ongoing basis. Such analysis providesuseful background information that helps theassessment of developments in M3.
A broadly based assessment of the outlookfor price developments
Although the monetary data containinformation vital to informed monetary policy-making, on their own they will not constitute acomplete summary of all the information aboutthe economy required to set an appropriatemonetary policy for the maintenance of pricestability. Therefore, in parallel with the analysisof monetary growth in relation to thereference value, a broadly based assessment ofthe outlook for price developments and therisks to price stability in the euro area will playa major role in the Eurosystem’s strategy. Thisassessment will be made using a wide range ofeconomic indicators.
This wide range of indicators will include manyvariables that have leading indicator propertiesfor future price developments. These variablesinclude, inter alia, wages, the exchange rate,bond prices and the yield curve, variousmeasures of real activity, fiscal policy indicators,price and cost indices and business andconsumer surveys. Obviously, it will also beuseful to look at inflation forecasts derived usingall these variables when assessing whether themonetary policy stance is appropriate. In thisrespect, the Eurosystem will evaluate the fullrange of inflation forecasts produced byinternational organisations, other authorities,market participants, etc., and will also produceits own assessment of the future inflationoutlook.
However, given behavioural, institutional andstructural uncertainties, forecasting pricedevelopments in the euro area is inevitablydifficult. Inflation forecasts will have to beinterpreted with caution and care. Moreover, aforecast cannot encompass all the indicatorvariables that are important for monetary policy.Nor can it always incorporate indicators in atimely manner. Therefore, a thorough analysisof individual indicator variables plays an

ECB Month l y Bu l l e t i n • January 199950
important role in the overall broadly basedassessment of the outlook for pricedevelopments, in addition to any role thesevariables may have in the forecast. Bothforecasts and the analysis of individual indicatorswill help to inform the Governing Council aboutthe specific nature of the macroeconomicenvironment and the disturbances to theeconomy, on which monetary policy decisionswould normally depend.
Based on its strategy, the Governing Councilhas undertaken to offer full and promptexplanations of its assessment of overalleconomic conditions, including the economicrationale on which it is based. This will presentthe public with a transparent view of monetarypolicy-making.
5 Concluding remarks
The Eurosystem’s stability-oriented monetarypolicy strategy, as described above, is a newand distinct strategy, which reflects the uniquecircumstances and institutional environmentthat will face the Eurosystem.
The stability-oriented strategy emphasises theoverriding priority attached to the maintenanceof price stability according to a quantitativedefinition published by the Eurosystem. Thestrategy aims to identify those economicdisturbances that threaten price stability, and toprompt a monetary policy response whichaddresses these threats and which is appropriateto both the prevailing economic circumstancesand the nature of the threat. The strategyrecognises that reliance on a single indicatorvariable or intermediate target is unlikely toprompt the appropriate response in allcircumstances. In particular, mechanicalresponses to a small number of indicators orforecasts at the start of Stage Three may beespecially misguided, given the inevitableuncertainties about economic relationshipsprompted by the regime shift associated withthe transition to Monetary Union.
The stability-oriented monetary policy strategytherefore eschews “mechanistic” monetarypolicy responses to deviations from a specific
target or developments in a specific indicatorvariable. Instead, a thorough analysis of themonetary data in relation to the quantitativereference value for monetary growth and abroadly based assessment of other economicdata will be conducted, with the aim ofidentifying the economic developments anddisturbances that pose a threat to pricestability. This analysis will then inform theselection of an appropriate monetary policyresponse geared to the maintenance of pricestability over the medium term.
This strategy requires considerable effort onthe part of the Eurosystem to explain itsassessment of the economic situation. TheGoverning Council is committed to exceedingthe reporting and communicationrequirements outlined in the Treaty, which arealready among the most stringent imposed onany central bank.
Against this background, the Eurosystem’sstability-oriented monetary policy strategy willensure that price stability over the mediumterm is maintained in a credible and lastingmanner throughout the euro area. This is thebest contribution that the single monetarypolicy can make to raising the standard of livingof Europe’s citizens.

ECB Month l y Bu l l e t i n • January 1999 1*
Euro area statistics

ECB Month l y Bu l l e t i n • January 19992*
ECB Month l y Bu l l e t i n • January 1999 3*
Statistics
1 Monetary policy statistics1.1 Consolidated financial statement of the Eurosystem 4*1.2 ECB interest rates on standing facilities 6*1.3 Eurosystem monetary policy operations executed through tenders 6*1.4 Minimum reserve statistics 7*
2 Monetary and financial developments in the euro area2.1 Aggregated balance sheet of the Eurosystem 9*2.2 Aggregated balance sheet of the other euro area MFIs (excluding the Eurosystem) 10*2.3 Consolidated balance sheet of the euro area MFIs (including the Eurosystem) 11*2.4 Monetary aggregates 12*2.5 Money market interest rates 14*2.6 Government bond yields 15*2.7 Stock market indices 16*2.8 Retail bank interest rates 17*
3 Securities market issues and redemptions in the euro area (not included in this issue)
4 HICP and other prices in the euro area4.1 Harmonised Index of Consumer Prices 18*4.2 Selected other price and cost indicators 19*
5 Real economy indicators in the euro area5.1 Output and demand indicators 20*5.2 Labour market indicators 21*5.3 Opinion surveys 21*
6 Saving, investment and financing in the euro area 22*
7 General government fiscal position in the euro area and in the euro area countries7.1 General government fiscal position 23*7.2 General government deficit 24*7.3 General government debt and current expenditure 24*
8 Balance of payments of the euro area (not included in this issue)
9 Trade in goods of the euro area9.1 Exports 25*9.2 Imports 26*9.3 Trade balance 27*
10 Exchange rates 28*
11 Economic and financial developments in the other EU Member States 29*
12 Economic and financial developments outside the EU12.1 Economic and financial developments 30*12.2 Saving, investment and financing 31*
General notes 33*
Contents

ECB Month l y Bu l l e t i n • January 19994*
1 Monetary policy statistics
Table 1.1Consolidated financial statement of the Eurosystem(EUR millions)
1. Assets
2. Liabilities
1999 1 Jan. 99,598 230,342 6,704 8,939 185,120 144,924 24,698 6,680
Gold and goldreceivables
Claims on non-euro area
residents inforeign currency
Claims on euroarea residents inforeign currency
Claims on non-euro arearesidents
in euro
Lending tofinancial sector
counterparties inthe euro area
Mainrefinancingoperations
Longer-termrefinancingoperations
Fine-tuningreverse
operations1 2 3 4 5 6 7 8
Source: ECB.
1999 1 Jan. 341,708 87,308 84,437 973 1,886 0 12 13,835
Banknotes incirculation
Liabilities tofinancial sector
counterpartiesin the euro area
in euro
Debt certificatesissuedCurrent accounts
(covering theminimum
reserve system)
Deposit facility Fixed-termdeposits
Fine-tuningreverse
operations
Deposits related to
margin calls
1 2 3 4 5 6 7 8

ECB Month l y Bu l l e t i n • January 1999 5*
Total liabilities
Liabilities toother euro area
residentsin euro
Liabilities tonon-euro area
residentsin euro
Liabilities toeuro area
residents inforeign currency
Liabilities tonon-euro area
residentsin foreigncurrency
Counterpart ofspecial drawingrights allocated
by the IMF
Capital and reserves
Other liabilities
9 10 11 12 13 14 15 16
0 6,372 26 2,420 21,650 60,125 84,683 697,160 1999 1 Jan.
61,477 9,969 595 3,314 5,765 112,498 60,690 697,160 1999 1 Jan.
Total assets
Securities ofeuro arearesidents
in euro
Generalgovernment debt
in euro
Other assets
Structuralreverse
operations
Marginallending facility
Credits relatedto margin calls
Other lending
9 10 11 12 13 14 15 16

ECB Month l y Bu l l e t i n • January 19996*
Main refinancing operations
Date of settlement Type of Bids Allotment Fixed rate tenders Variable rate tenders
operation (amount) (amount) Fixed rate Marginal rate Weightedaverage rate
Running for[...] days
1 2 3 4 5 6 7
Other tender operations
Date of settlement Type of Bids Allotment Fixed rate tenders Variable rate tenders
operation (amount) (amount) Fixed rate Marginal rate Weightedaverage rate
Running for[...] days
1 2 3 4 5 6 7
Deposit facility Marginal lending facilityLevel
1Change
2Level
3Change
4
Table 1.2ECB interest rates on standing facilities(levels in percentages per annum; changes in percentage points)
1999 1 Jan. 2.00 - 4.50 -4 Jan. 1) 2.75 0.75 3.25 -1.25
Source: ECB.1) On 22 December 1998 the ECB announced that, as an exceptional measure between 4 and 21 January 1999, a narrow corridor of
50 basis points would be applied between the interest rates for the marginal lending facility and the deposit facility, aimed at facilitating thetransition to the new regime by market participants.
Table 1.3Eurosystem monetary policy operations executed through tenders(EUR millions; interest rates in percentages per annum)
1999 7 Jan. Fixed rate 481,625 75,000 3.00 13
Fixed rate1999
1999
Source: ECB.
Longer-term refinancing operations
Date of settlement Type of Bids Allotment Fixed rate tenders Variable rate tenders
operation (amount) (amount) Fixed rate Marginal rate Weightedaverage rate
Running for[...] days
1 2 3 4 5 6 7

ECB Month l y Bu l l e t i n • January 1999 7*
Table 1.4Minimum reserve statistics
1. Reserve base of credit institutions subject to reserve requirements 1) 2)
(EUR millions)
1999 1 Jan. . . . . . . .
Source: ECB.1) Liabilities vis-à-vis other credit institutions subject to the minimum reserve system, the ECB and participating national central banks are
excluded from the reserve base. If a credit institution cannot provide evidence of the amount of its issues of debt securities with a maturity of up to2 years and of money market paper held by the institutions mentioned above, it may deduct 10% of these liabilities from its reserve base.
2) The reserve base of credit institutions as at 1 January 1999 is used to calculate the minimum reserves for the maintenance period starting on1 January 1999 and ending on 23 February 1999. The relevant aggregated data will be reported to the ECB by the end of February 1999.
2. Reserve maintenance 1)
(EUR millions; interest rates as annual percentages)
1999 Feb. . . . . .
Source: ECB.1) This table will contain data for completed maintenance periods. The first maintenance period of the minimum reserve system ends on
23 February 1999.2) The amount of reserve requirement of each individual credit institution is first calculated by applying the reserve ratio for the corresponding
categories of liabilities to the eligible liabilities, using the balance sheet data as at the end of each calendar month; subsequently, each creditinstitution deducts from this figure a lump-sum allowance of EUR 100,000. The resulting reserve requirements for each credit institution are thenaggregated at the euro area-wide level.
3) Aggregate average daily holdings of credit institutions subject to minimum reserve requirements on their reserve accounts over the maintenanceperiod.
4) Average actual reserve holdings over the maintenance period in excess of the required reserves, computed on the basis of those credit institutionsthat have fulfilled the reserve requirement.
5) Average shortfalls of actual reserve holdings from required reserves over the maintenance period, computed on the basis of those credit institutionsthat have not fulfilled the reserve requirement.
6) This rate equals the average, over the maintenance period, of the ECB’s rate (weighted according to the number of calendar days) on theEurosystem’s main refinancing operations (see Table 1.3).
Reservebaseas at:
Total Liabilities to which a 2% reserve coefficient is applied Liabilities to which a 0% reserve coefficient is appliedDeposits
(overnight, up to2 years agreed
maturity andnotice period)
Debt securities upto 2 years agreed
maturity
Money marketpaper
Deposits (over2 years agreed
maturityand notice period)
Repos Debt securitiesover 2 years
agreed maturity
1 2 3 4 5 6 7
Maintenanceperiodending in:
Requiredreserves 2)
Actualreserves 3)
Excessreserves 4)
Deficiencies 5) Interest rate onminimumreserves 6)
1 2 3 4 5

ECB Month l y Bu l l e t i n • January 19998*
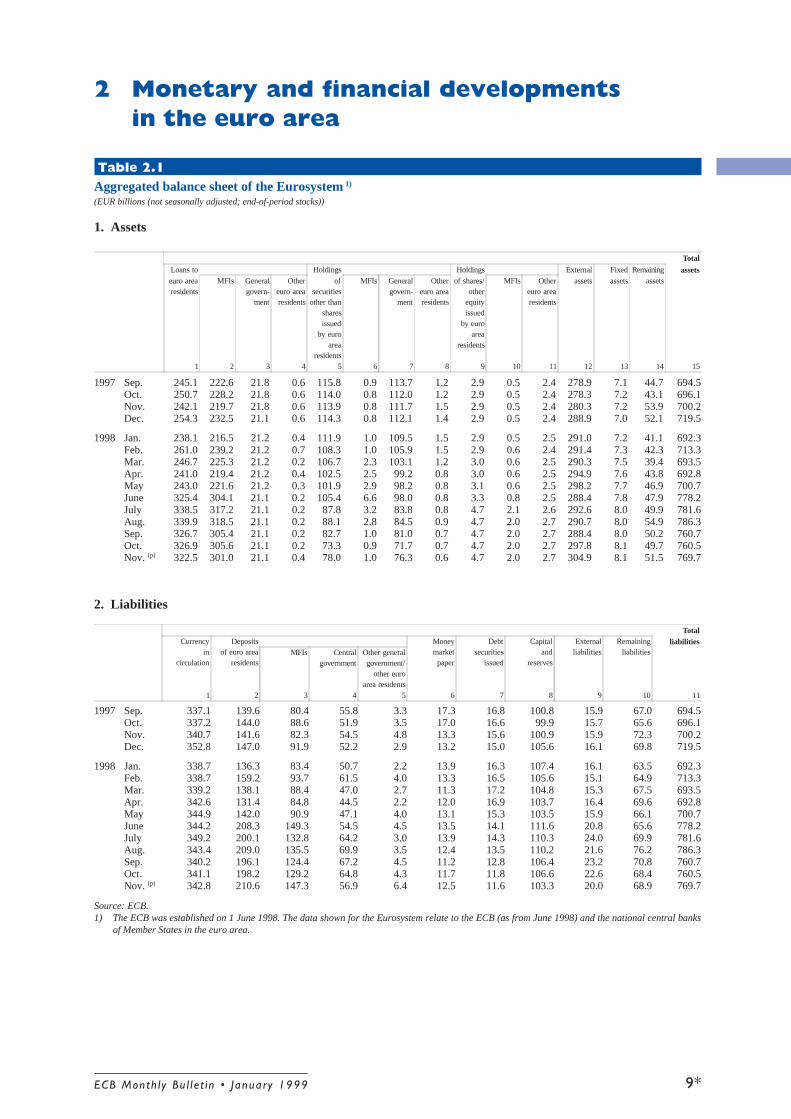
ECB Month l y Bu l l e t i n • January 1999 9*
TotalLoans to Holdings Holdings External Fixed Remaining assetseuro arearesidents
MFIs Generalgovern-
ment
Other euro area
residents
ofsecurities
other thansharesissued
by euroarea
residents
MFIs Generalgovern-
ment
Othereuro arearesidents
of shares/other
equityissued
by euroarea
residents
MFIs Othereuro arearesidents
assets assets assets
1 2 3 4 5 6 7 8 9 10 11 12 13 14 15
TotalCurrency
incirculation
Depositsof euro area
residents
Moneymarket
paper
Debtsecurities
issued
Capitaland
reserves
Externalliabilities
Remainingliabilities
liabilitiesMFIs Central
governmentOther generalgovernment/
other euroarea residents
1 2 3 4 5 6 7 8 9 10 11
Table 2.1Aggregated balance sheet of the Eurosystem 1)
(EUR billions (not seasonally adjusted; end-of-period stocks))
1. Assets
2. Liabilities
2 Monetary and financial developmentsin the euro area
Source: ECB.1) The ECB was established on 1 June 1998. The data shown for the Eurosystem relate to the ECB (as from June 1998) and the national central banks
of Member States in the euro area.
1997 Sep. 245.1 222.6 21.8 0.6 115.8 0.9 113.7 1.2 2.9 0.5 2.4 278.9 7.1 44.7 694.5Oct. 250.7 228.2 21.8 0.6 114.0 0.8 112.0 1.2 2.9 0.5 2.4 278.3 7.2 43.1 696.1Nov. 242.1 219.7 21.8 0.6 113.9 0.8 111.7 1.5 2.9 0.5 2.4 280.3 7.2 53.9 700.2Dec. 254.3 232.5 21.1 0.6 114.3 0.8 112.1 1.4 2.9 0.5 2.4 288.9 7.0 52.1 719.5
1998 Jan. 238.1 216.5 21.2 0.4 111.9 1.0 109.5 1.5 2.9 0.5 2.5 291.0 7.2 41.1 692.3Feb. 261.0 239.2 21.2 0.7 108.3 1.0 105.9 1.5 2.9 0.6 2.4 291.4 7.3 42.3 713.3Mar. 246.7 225.3 21.2 0.2 106.7 2.3 103.1 1.2 3.0 0.6 2.5 290.3 7.5 39.4 693.5Apr. 241.0 219.4 21.2 0.4 102.5 2.5 99.2 0.8 3.0 0.6 2.5 294.9 7.6 43.8 692.8May 243.0 221.6 21.2 0.3 101.9 2.9 98.2 0.8 3.1 0.6 2.5 298.2 7.7 46.9 700.7June 325.4 304.1 21.1 0.2 105.4 6.6 98.0 0.8 3.3 0.8 2.5 288.4 7.8 47.9 778.2July 338.5 317.2 21.1 0.2 87.8 3.2 83.8 0.8 4.7 2.1 2.6 292.6 8.0 49.9 781.6Aug. 339.9 318.5 21.1 0.2 88.1 2.8 84.5 0.9 4.7 2.0 2.7 290.7 8.0 54.9 786.3Sep. 326.7 305.4 21.1 0.2 82.7 1.0 81.0 0.7 4.7 2.0 2.7 288.4 8.0 50.2 760.7Oct. 326.9 305.6 21.1 0.2 73.3 0.9 71.7 0.7 4.7 2.0 2.7 297.8 8.1 49.7 760.5Nov. (p) 322.5 301.0 21.1 0.4 78.0 1.0 76.3 0.6 4.7 2.0 2.7 304.9 8.1 51.5 769.7
1997 Sep. 337.1 139.6 80.4 55.8 3.3 17.3 16.8 100.8 15.9 67.0 694.5Oct. 337.2 144.0 88.6 51.9 3.5 17.0 16.6 99.9 15.7 65.6 696.1Nov. 340.7 141.6 82.3 54.5 4.8 13.3 15.6 100.9 15.9 72.3 700.2Dec. 352.8 147.0 91.9 52.2 2.9 13.2 15.0 105.6 16.1 69.8 719.5
1998 Jan. 338.7 136.3 83.4 50.7 2.2 13.9 16.3 107.4 16.1 63.5 692.3Feb. 338.7 159.2 93.7 61.5 4.0 13.3 16.5 105.6 15.1 64.9 713.3Mar. 339.2 138.1 88.4 47.0 2.7 11.3 17.2 104.8 15.3 67.5 693.5Apr. 342.6 131.4 84.8 44.5 2.2 12.0 16.9 103.7 16.4 69.6 692.8May 344.9 142.0 90.9 47.1 4.0 13.1 15.3 103.5 15.9 66.1 700.7June 344.2 208.3 149.3 54.5 4.5 13.5 14.1 111.6 20.8 65.6 778.2July 349.2 200.1 132.8 64.2 3.0 13.9 14.3 110.3 24.0 69.9 781.6Aug. 343.4 209.0 135.5 69.9 3.5 12.4 13.5 110.2 21.6 76.2 786.3Sep. 340.2 196.1 124.4 67.2 4.5 11.2 12.8 106.4 23.2 70.8 760.7Oct. 341.1 198.2 129.2 64.8 4.3 11.7 11.8 106.6 22.6 68.4 760.5Nov. (p) 342.8 210.6 147.3 56.9 6.4 12.5 11.6 103.3 20.0 68.9 769.7

ECB Month l y Bu l l e t i n • January 199910*
2. Liabilities
TotalCurrency Deposits Money Debt Money Capital External Re- liabilities
incirculation
of euroarea
residents
MFIs Central Other marketfund
shares/units
securitiesissued
marketpaper
andreserves
liabilities mainingliabilitiesgovern-
mentgeneralgovern-
ment/othereuroarea
residents
Over-night
Withagreed
maturity
Redeem-able atnotice
Repur-chaseagree-ments
1 2 3 4 5 6 7 8 9 10 11 12 13 14 15 16
Source: ECB.
TotalLoans to Holdings Money Holdings External
assetsFixedassets
Re-maining
assets
assetseuro arearesidents
MFIs Generalgovern-
ment
Othereuro arearesidents
ofsecurities
otherthan
sharesissued
by euroarea
residents
MFIs Generalgovern-
ment
Othereuro arearesidents
marketpaper
of shares/other
equityissued
by euroarea
residents
MFIs Othereuro arearesidents
1 2 3 4 5 6 7 8 9 10 11 12 13 14 15 16
Table 2.2Aggregated balance sheet of the other euro area MFIs (excluding the Eurosystem)(EUR billions (not seasonally adjusted; end-of-period stocks))
1. Assets
1997 Sep. 8,132.5 2,730.0 813.4 4,589.1 1,879.1 625.7 1,067.2 186.2 102.0 307.0 90.5 216.5 1,571.8 234.8 751.1 12,978.4Oct. 8,199.6 2,766.6 817.9 4,615.2 1,882.1 630.2 1,066.4 185.6 102.9 311.8 91.7 220.1 1,578.7 237.7 764.5 13,077.3Nov. 8,297.8 2,826.4 830.1 4,641.3 1,894.0 634.4 1,071.7 187.9 100.7 316.6 92.5 224.1 1,633.3 240.2 797.5 13,280.1Dec. 8,426.6 2,899.3 820.7 4,706.5 1,856.5 628.5 1,048.6 179.4 95.6 329.8 94.2 235.6 1,617.1 235.1 765.3 13,325.9
1998 Jan. 8,475.5 2,950.5 806.5 4,718.5 1,900.2 641.4 1,072.7 186.1 101.0 351.1 102.2 248.9 1,631.7 232.4 801.8 13,493.7Feb. 8,513.9 2,967.7 805.6 4,740.6 1,921.1 644.9 1,084.9 191.2 102.5 363.6 104.6 259.0 1,656.0 232.7 807.5 13,597.3Mar. 8,552.8 2,973.9 804.8 4,774.1 1,946.4 648.1 1,102.7 195.7 101.2 384.4 108.9 275.4 1,693.7 234.2 785.6 13,698.2Apr. 8,593.8 2,980.4 807.9 4,805.6 1,967.1 657.7 1,113.5 195.9 102.2 396.0 112.1 284.0 1,665.6 234.3 803.4 13,762.5May 8,602.8 2,982.8 799.2 4,820.8 1,988.6 664.4 1,125.0 199.2 102.7 403.9 114.4 289.5 1,656.3 243.1 817.9 13,815.2June 8,736.7 3,056.9 805.5 4,874.4 1,992.6 673.5 1,126.8 192.3 101.5 401.5 115.2 286.4 1,691.8 240.1 824.6 13,988.7July 8,714.1 2,994.7 801.8 4,917.6 2,007.1 687.6 1,124.7 194.8 101.7 393.2 115.1 278.0 1,650.4 235.0 814.5 13,916.0Aug. 8,737.1 3,019.1 803.9 4,914.1 2,026.4 698.8 1,132.3 195.3 100.5 387.6 116.1 271.5 1,650.7 236.1 761.7 13,899.9Sep. 8,807.5 3,039.6 806.4 4,961.5 2,027.9 702.3 1,131.2 194.5 99.9 381.4 107.9 273.5 1,641.6 236.9 780.9 13,976.1Oct. 8,925.8 3,119.6 813.5 4,992.7 2,051.7 704.9 1,148.1 198.7 99.6 387.0 112.3 274.7 1,635.4 238.8 792.5 14,130.7Nov. (p) 9,057.4 3,201.3 818.4 5,037.7 2,069.0 722.5 1,152.0 194.5 109.4 400.3 115.0 285.3 1,697.0 241.2 750.1 14,324.5
1997 Sep. 0.4 7,467.0 2,843.8 96.0 4,527.2 1,137.1 1,895.4 1,287.4 207.3 226.9 1,906.8 143.6 677.1 1,331.2 1,225.4 12,978.4Oct. 0.4 7,533.1 2,894.1 99.9 4,539.1 1,139.3 1,904.2 1,288.5 207.2 222.1 1,913.2 146.6 675.5 1,344.1 1,242.3 13,077.3Nov. 0.4 7,627.8 2,966.5 88.9 4,572.3 1,165.4 1,899.3 1,291.8 215.8 224.4 1,923.9 145.6 677.7 1,393.2 1,287.2 13,280.1Dec. 0.4 7,749.7 2,992.3 102.4 4,655.0 1,224.3 1,897.0 1,328.4 205.3 215.3 1,925.1 138.8 687.5 1,391.3 1,217.8 13,325.9
1998 Jan. 0.4 7,777.9 3,029.6 95.6 4,652.7 1,178.0 1,915.3 1,341.9 217.5 220.2 1,944.5 145.2 690.8 1,434.5 1,280.1 13,493.7Feb. 0.4 7,825.4 3,066.3 98.4 4,660.7 1,179.8 1,919.4 1,345.2 216.3 221.3 1,967.8 147.2 696.0 1,468.7 1,270.5 13,597.3Mar. 0.4 7,832.1 3,076.9 92.8 4,662.4 1,208.8 1,894.8 1,346.5 212.3 221.2 1,985.1 149.5 710.3 1,520.0 1,279.5 13,698.2Apr. 0.4 7,862.6 3,079.7 97.2 4,685.7 1,223.2 1,909.9 1,346.1 206.6 223.9 1,999.4 156.3 702.6 1,491.3 1,325.9 13,762.5May 0.4 7,885.7 3,092.8 88.2 4,704.8 1,240.0 1,908.6 1,348.0 208.2 226.4 2,012.1 150.9 712.2 1,483.8 1,343.6 13,815.2June 0.4 7,989.6 3,167.2 94.4 4,728.0 1,287.7 1,889.6 1,347.1 203.6 225.0 2,042.4 145.9 718.9 1,494.2 1,372.3 13,988.7July 0.4 7,946.0 3,147.5 92.2 4,706.3 1,248.5 1,894.8 1,346.8 216.2 225.3 2,062.9 152.8 720.3 1,470.1 1,338.1 13,916.0Aug. 0.4 7,973.3 3,175.7 95.5 4,702.1 1,239.2 1,905.7 1,348.7 208.5 228.1 2,072.4 152.9 719.8 1,469.6 1,283.5 13,899.9Sep. 0.4 8,010.0 3,210.9 96.4 4,702.7 1,264.0 1,883.6 1,347.0 208.2 224.9 2,073.9 153.2 718.3 1,481.1 1,314.2 13,976.1Oct. 0.4 8,097.2 3,281.0 96.2 4,720.1 1,268.3 1,884.7 1,350.4 216.7 223.8 2,074.9 160.2 720.2 1,523.3 1,330.8 14,130.7Nov. (p) 0.4 8,207.2 3,367.8 97.4 4,742.1 1,309.9 1,881.0 1,352.3 198.8 255.5 2,087.7 168.6 724.2 1,599.3 1,281.6 14,324.5

ECB Month l y Bu l l e t i n • January 1999 11*
TotalLoans to Holdings of Holdings of External Fixed Remaining assetseuro arearesidents
Generalgovernment
Othereuroarea
residents
securitiesother than
sharesissued byeuro area residents
Generalgovernment
Othereuro arearesidents
shares/otherequity
issued byother
euro arearesidents
assets assets assets
1 2 3 4 5 6 7 8 9 10 11
TotalCurrency Deposits Deposits Money Debt Capital External Re- Excess liabilities
incircula-
tion
of centralgovern-
ment
of othergeneralgovern-
ment/othereuroarea
residents
Over-night
Withagreed
maturity
Redeem-able atnotice
Repur-chaseagree-ments
marketfund
shares/units and
moneymarket
paper
securitiesissued
andreserves
liabilities mainingliabilities
of inter-MFI
liabilities
1 2 3 4 5 6 7 8 9 10 11 12 13 14
Table 2.3Consolidated balance sheet of the euro area MFIs (including the Eurosystem 1))(EUR billions (not seasonally adjusted; end-of-period stocks))
1. Assets
2. Liabilities
Source: ECB.1) The ECB was established on 1 June 1998. The data shown for the Eurosystem relate to the ECB (as from June 1998) and the national central banks
of Member States in the euro area.
1997 Sep. 5,425.0 835.2 4,589.7 1,368.3 1,180.9 187.5 218.9 1,822.6 242.0 795.8 9,872.5Oct. 5,455.5 839.7 4,615.8 1,365.1 1,178.3 186.8 222.5 1,829.2 244.9 807.5 9,924.7Nov. 5,493.8 851.9 4,641.9 1,372.8 1,183.4 189.4 226.5 1,885.4 247.3 851.4 10,077.2Dec. 5,549.0 841.9 4,707.1 1,341.5 1,160.7 180.8 238.0 1,871.2 242.1 817.4 10,059.2
1998 Jan. 5,546.6 827.6 4,719.0 1,369.7 1,182.2 187.5 251.4 1,893.8 239.6 842.8 10,143.9Feb. 5,568.0 826.7 4,741.3 1,383.5 1,190.8 192.7 261.4 1,918.8 240.0 849.8 10,221.6Mar. 5,600.3 826.0 4,774.3 1,402.6 1,205.7 196.9 277.9 1,954.8 241.7 825.0 10,302.3Apr. 5,635.0 829.0 4,806.0 1,409.4 1,212.7 196.7 286.4 1,931.1 241.9 847.1 10,350.9May 5,641.4 820.4 4,821.0 1,423.2 1,223.3 199.9 292.0 1,925.2 250.8 864.7 10,397.3June 5,701.1 826.5 4,874.6 1,417.9 1,224.8 193.0 288.9 1,949.8 247.9 872.5 10,478.0July 5,740.7 822.8 4,917.9 1,404.1 1,208.5 195.6 280.7 1,912.9 243.0 864.4 10,445.8Aug. 5,739.3 825.0 4,914.3 1,412.9 1,216.8 196.1 274.2 1,911.2 244.1 816.6 10,398.3Sep. 5,789.2 827.5 4,961.7 1,407.3 1,212.1 195.1 276.2 1,900.0 244.9 831.1 10,448.7Oct. 5,827.5 834.6 4,992.9 1,419.1 1,219.8 199.4 277.4 1,903.9 246.8 842.1 10,516.9Nov. (p) 5,877.6 839.5 5,038.1 1,423.5 1,228.3 195.2 288.0 1,972.1 249.3 801.4 10,611.9
1997 Sep. 309.3 151.8 4,530.5 1,140.3 1,895.4 1,287.4 207.4 285.8 1,297.1 687.0 1,347.1 1,292.4 -28.4 9,872.5Oct. 309.8 151.8 4,542.6 1,142.6 1,904.3 1,288.5 207.2 282.8 1,298.9 683.3 1,359.8 1,307.9 -12.2 9,924.7Nov. 312.9 143.4 4,577.1 1,170.0 1,899.5 1,291.8 215.8 282.5 1,304.3 685.6 1,409.0 1,359.5 2.9 10,077.2Dec. 318.4 154.7 4,657.9 1,227.3 1,897.0 1,328.4 205.3 271.7 1,310.8 698.4 1,407.4 1,287.6 -47.7 10,059.2
1998 Jan. 310.2 146.3 4,654.9 1,180.2 1,915.3 1,341.9 217.5 278.2 1,318.4 695.6 1,450.6 1,343.6 -53.9 10,143.9Feb. 310.5 160.0 4,664.7 1,183.7 1,919.4 1,345.2 216.3 279.3 1,338.4 696.5 1,483.8 1,335.4 -47.0 10,221.6Mar. 310.6 139.8 4,665.1 1,211.5 1,894.8 1,346.5 212.3 280.8 1,351.9 705.6 1,535.3 1,347.0 -33.8 10,302.3Apr. 313.6 141.7 4,687.9 1,225.4 1,909.9 1,346.1 206.6 290.0 1,356.0 693.7 1,507.7 1,395.6 -35.3 10,350.9May 315.9 135.3 4,708.8 1,244.0 1,908.6 1,348.0 208.2 287.7 1,360.2 700.7 1,499.7 1,409.7 -20.7 10,397.3June 314.2 148.9 4,732.5 1,292.2 1,889.6 1,347.1 203.6 283.0 1,376.4 714.5 1,515.0 1,437.9 -44.5 10,478.0July 319.4 156.4 4,709.3 1,251.5 1,894.8 1,346.8 216.2 290.2 1,386.4 713.4 1,494.1 1,408.0 -31.5 10,445.8Aug. 313.7 165.4 4,705.6 1,242.7 1,905.7 1,348.7 208.5 292.9 1,384.3 711.9 1,491.2 1,359.7 -26.3 10,398.3Sep. 310.6 163.6 4,707.3 1,268.5 1,883.6 1,347.0 208.2 289.4 1,383.4 714.8 1,504.3 1,385.0 -9.7 10,448.7Oct. 312.1 160.9 4,724.4 1,272.5 1,884.7 1,350.4 216.7 296.2 1,380.9 712.5 1,545.9 1,399.0 -15.1 10,516.9Nov. (p) 313.4 154.3 4,748.4 1,316.2 1,881.0 1,352.3 198.9 327.2 1,375.7 710.4 1,619.4 1,350.4 12.7 10,611.9

ECB Month l y Bu l l e t i n • January 199912*
M2 Repurchase Money DebtTotal Annual agreements market securities
M1 Deposits Deposits percentage fund shares/ up toTotal Annual
percentagewith agreedmaturity up
redeemableat notice up
change 2) unitsand money
2 years
Currency incirculation
Overnightdeposits
change 2) to 2 years to 3 months marketpaper
1 2 3 4 5 6 7 8 9 10 11
Table 2.4Monetary aggregates1)
(EUR billions (not seasonally adjusted; end-of-period stocks) and annual percentage changes)
Source: ECB.1) Monetary aggregates comprise monetary liabilities of MFIs and central government (Post Office, Treasury) vis-à-vis non-MFI euro area residents,
excluding central government.2) Calculated in this issue from amounts outstanding adjusted for incomplete coverage of the data before September 1997. In the near future, the
difference in levels will be adjusted for reclassifications, other revaluations and any other changes which do not arise from transactions.3) The growth rate of M3 for November 1998 has been adjusted to reflect the fact that at present data on money market funds in one Member State are
available only for that month.
1997 Sep. 309.3 1,204.8 1,514.1 8.7 898.7 1,121.9 3,534.7 3.9 207.4 285.8 70.4Oct. 309.8 1,208.7 1,518.5 9.3 905.1 1,123.8 3,547.4 4.2 207.2 282.8 72.1Nov. 312.9 1,238.6 1,551.5 8.3 899.5 1,127.4 3,578.4 3.9 215.8 282.5 69.5Dec. 318.4 1,296.8 1,615.2 6.5 890.3 1,161.7 3,667.2 3.1 205.3 271.7 73.3
1998 Jan. 310.2 1,251.3 1,561.5 8.3 902.4 1,177.6 3,641.5 3.8 217.5 278.2 74.5Feb. 310.5 1,251.8 1,562.4 8.7 898.4 1,181.7 3,642.4 4.0 216.3 279.3 79.3Mar. 310.6 1,281.4 1,592.0 9.3 872.5 1,183.5 3,648.0 4.1 212.3 280.8 85.5Apr. 313.6 1,293.4 1,607.0 10.7 886.3 1,185.3 3,678.5 4.8 206.6 290.0 86.0May 315.9 1,310.4 1,626.3 10.5 882.6 1,189.3 3,698.3 4.9 208.2 287.7 89.1June 314.2 1,359.3 1,673.5 10.0 863.8 1,189.6 3,726.8 4.9 203.6 283.0 88.7July 319.4 1,319.0 1,638.4 8.5 866.8 1,190.4 3,695.6 4.2 216.2 290.2 94.1Aug. 313.7 1,309.7 1,623.4 8.6 873.4 1,193.5 3,690.3 4.2 208.5 292.9 88.9Sep. 310.6 1,334.1 1,644.7 8.6 861.5 1,192.6 3,698.7 4.6 208.2 289.4 85.3Oct. 312.1 1,337.9 1,650.0 8.7 865.9 1,196.3 3,712.2 4.6 216.7 296.2 89.1Nov. (p) 313.4 1,381.2 1,694.6 9.2 865.2 1,198.0 3,757.8 5.0 198.9 327.2 80.4

ECB Month l y Bu l l e t i n • January 1999 13*
M3 Memo: Non-monetary liabilities of MFIsTotal Annual 3-month
percentage movingchange 2) 3) average
(centered)Total
Deposits Debt CapitalWith agreed Redeemable securities and
maturity at notice over over 2 years reservesover 2 years 3 months
12 13 14 15 16 17 18 19 20
4,098.3 4.0 4.1 1,214.0 997.3 216.6 1,226.7 687.0 3,127.6 1997 Sep.4,109.6 4.2 4.2 1,215.8 999.8 216.0 1,226.7 683.3 3,125.8 Oct.4,146.2 4.3 4.1 1,216.6 1,000.5 216.1 1,234.8 685.6 3,137.1 Nov.4,217.5 3.9 4.2 1,227.0 1,007.3 219.8 1,237.5 698.4 3,162.9 Dec.
4,211.6 4.4 4.3 1,231.3 1,013.6 217.7 1,244.0 695.6 3,170.9 1998 Jan.4,217.4 4.3 4.4 1,239.2 1,021.7 217.5 1,259.1 696.5 3,194.7 Feb.4,226.6 4.4 4.5 1,239.7 1,022.9 216.8 1,266.4 705.6 3,211.7 Mar.4,261.2 4.9 4.6 1,239.0 1,024.3 214.7 1,270.0 693.7 3,202.8 Apr.4,283.3 4.6 4.7 1,239.5 1,026.5 213.0 1,271.0 700.7 3,211.3 May4,302.1 4.7 4.6 1,238.5 1,026.5 212.0 1,287.7 714.5 3,240.7 June4,296.1 4.4 4.5 1,239.2 1,028.4 210.8 1,292.3 713.4 3,244.9 July4,280.7 4.2 4.4 1,242.7 1,032.8 209.9 1,295.3 711.9 3,249.9 Aug.4,281.6 4.5 4.6 1,231.9 1,022.6 209.3 1,298.1 714.8 3,244.9 Sep.4,314.2 5.0 4.7 1,228.4 1,019.3 209.1 1,291.8 712.5 3,232.6 Oct.4,364.3 4.5 . 1,225.7 1,016.2 209.5 1,295.3 710.4 3,231.4 (p) Nov.

ECB Month l y Bu l l e t i n • January 199914*
Table 2.5Money market interest rates1)
(percentages per annum; end of period)
Sources: Reuters and ECB.1) Interbank deposit bid rates.2) Prior to 4 January 1999, synthetic euro area rates were calculated on the basis of national rates weighted by GDP.
Euro area 2) United States JapanOvernight 1-month 3-month 6-month 12-month 3-month 3-month
deposits deposits deposits deposits deposits deposits deposits1 2 3 4 5 6 7
1994 5.24 6.12 6.38 6.83 7.34 6.37 2.341995 5.62 5.57 5.49 5.62 5.42 5.44 0.501996 4.04 4.08 4.08 4.06 3.98 5.43 0.311997 3.98 3.94 4.01 4.05 4.15 5.62 0.361998 3.09 3.18 3.17 3.14 3.13 5.00 0.18
1997 Dec. 3.98 3.94 4.01 4.05 4.15 5.62 0.36
1998 Jan. 3.89 3.97 4.00 4.08 4.08 5.50 0.41Feb. 4.22 3.96 3.97 3.98 4.02 5.55 0.48Mar. 3.83 3.93 3.92 3.89 3.93 5.59 0.50Apr. 3.76 3.86 3.89 3.93 4.01 5.60 0.45May 3.79 3.85 3.86 3.89 3.98 5.59 0.37June 3.76 3.88 3.84 3.85 3.91 5.59 0.43July 3.77 3.74 3.80 3.82 3.85 5.56 0.34Aug. 3.78 3.80 3.81 3.72 3.69 5.50 0.37Sep. 3.81 3.73 3.73 3.64 3.55 5.20 0.12Oct. 3.66 3.61 3.63 3.53 3.44 5.12 0.68Nov. 3.40 3.62 3.51 3.43 3.36 5.12 0.68Dec. 3.09 3.18 3.17 3.14 3.13 5.00 0.18
4 Dec. 3.10 3.33 3.29 3.22 3.14 5.09 0.2011 3.13 3.32 3.23 3.14 3.16 5.14 0.1218 2.93 3.27 3.21 3.13 3.14 5.56 0.5625 2.81 3.27 3.14 3.19 3.06 5.18 0.28
1999 1 Jan. 3.09 3.18 3.17 3.14 3.13 5.00 0.18
Euro area money market rates(1, 3 and 12-month rates)
3-month money market rates(euro area, United States and Japan)
12-month rate1-month rate 3-month rate
JapanEuro area United States
3.00
4.00
5.00
6.00
7.00
8.00%
0.00
1.00
2.00
3.00
4.00
5.00
6.00
7.00
8.00%
1994 1995 1996 1997 1998 1994 1995 1996 1997 1998

ECB Month l y Bu l l e t i n • January 1999 15*
Table 2.6Government bond yields 1)
(percentages per annum)
Sources: Reuters, ECB, Federal Reserve and Bank of Japan.1) 2, 3, 5 and 7-year euro area yields are end-of-period values; 10-year yields are period averages.2) Euro area yields are calculated on the basis of harmonised national government bond yields weighted by GDP.
Euro area 2) United States Japan2 years 3 years 5 years 7 years 10 years 10 years 10 years
1 2 3 4 5 6 7
1994 8.08 8.52 8.91 9.08 8.18 7.21 4.241995 5.69 5.97 6.48 7.06 8.73 6.69 3.321996 4.17 4.41 5.06 5.82 7.23 6.54 3.031997 4.33 4.51 4.87 5.20 5.99 6.45 2.151998 3.16 3.22 3.38 3.67 4.71 5.33 1.30
1997 Dec. 4.33 4.51 4.87 5.20 5.46 5.89 1.65
1998 Jan. 4.11 4.27 4.61 4.95 5.22 5.63 1.69Feb. 4.08 4.24 4.55 4.84 5.12 5.65 1.71Mar. 4.17 4.32 4.61 4.86 5.01 5.73 1.56Apr. 4.26 4.44 4.75 4.97 5.00 5.72 1.57May 4.13 4.30 4.58 4.79 5.06 5.73 1.30June 4.08 4.24 4.50 4.73 4.91 5.58 1.22July 4.04 4.16 4.41 4.62 4.82 5.53 1.36Aug. 3.68 3.78 4.01 4.24 4.59 5.41 1.17Sep. 3.55 3.58 3.77 3.98 4.27 4.87 0.88Oct. 3.39 3.51 3.77 4.09 4.25 4.58 0.82Nov. 3.33 3.44 3.62 3.90 4.24 4.89 0.89Dec. 3.16 3.22 3.38 3.67 3.95 4.69 1.39
4 Dec. 3.25 3.31 3.50 3.76 4.00 4.67 1.0611 3.18 3.23 3.39 3.62 3.86 4.66 1.1718 3.20 3.15 3.35 3.63 3.90 4.63 1.3225 3.20 3.23 3.39 3.67 3.98 4.92 1.77
1999 1 Jan. 3.16 3.22 3.38 3.67 3.94 4.70 2.02
Euro area government bond yields(3, 5 and 7-year yields)
10-year government bond yields(euro area, United States and Japan)
JapanEuro area United States.......7-year yield3-year yield 5-year yield
3.00
4.00
5.00
6.00
7.00
8.00
9.00
10.00% p.a.
1994 1995 1996 1997 19980.00
1.00
2.00
3.00
4.00
5.00
6.00
7.00
8.00
9.00
10.00
1994 1995 1996 1997 1998
% p.a.

ECB Month l y Bu l l e t i n • January 199916*
Table 2.7Stock market indices(index levels in points; end of period)
Source: Reuters.
Dow Jones EURO STOXX indices United JapanBenchmark Main economic sectors StatesBroad 50 Basic
materialsConsumer
cyclicalConsumer
non-cyclical
Energy Financial Conglom-erates
Industrial Techno-logy
Utilities Standard& Poor’s
500
Nikkei225
1 2 3 4 5 6 7 8 9 10 11 12 13
1994 127.33 1,320.59 145.88 107.82 143.90 125.92 109.29 125.91 132.31 128.66 122.60 455.19 19,299.471995 138.37 1,506.82 137.78 111.06 181.13 145.46 117.66 133.05 136.18 145.57 152.09 614.57 19,417.951996 167.75 1,850.32 145.11 120.25 274.94 180.64 137.84 156.11 171.05 153.17 192.40 743.25 20,147.271997 229.86 2,531.99 166.33 159.82 324.06 249.22 188.87 210.33 204.75 248.37 225.11 962.37 15,917.071998 298.37 3,342.32 147.10 156.74 485.39 232.87 250.29 218.78 283.76 353.38 329.50 1,229.23 13,842.17
1997 Dec. 229.86 2,531.99 166.33 159.82 324.06 249.22 188.87 210.33 204.75 248.37 225.11 962.37 15,917.07
1998 Jan. 243.93 2,676.03 173.71 167.26 338.43 247.28 203.90 220.86 218.99 275.99 242.74 963.36 15,929.69Feb. 262.29 2,878.04 185.29 179.88 367.60 252.05 225.29 222.68 234.57 303.85 247.81 1,023.74 16,797.69Mar. 289.46 3,153.32 196.69 197.27 390.26 278.01 249.55 239.23 270.77 335.91 268.38 1,076.83 16,840.31Apr. 293.96 3,195.43 204.90 202.37 386.70 270.47 266.59 238.17 276.74 354.64 275.98 1,112.20 15,941.29May 307.44 3,357.77 211.08 207.22 401.14 280.40 276.07 248.87 302.71 378.82 285.79 1,108.42 15,514.28June 311.58 3,406.82 198.55 204.62 430.65 275.47 270.69 244.59 299.67 387.80 294.99 1,108.39 15,231.29July 318.06 3,480.63 182.52 195.81 436.13 255.90 291.41 226.39 301.26 417.31 305.08 1,156.58 16,370.17Aug. 277.73 3,050.59 151.13 167.11 413.58 217.55 240.10 194.28 262.30 360.33 279.30 1,074.62 15,243.98Sep. 246.31 2,670.97 131.62 137.37 379.55 230.22 187.86 182.29 240.51 279.90 277.86 1,020.64 14,140.69Oct. 263.49 2,887.11 138.21 147.48 419.19 223.71 206.17 197.45 250.98 300.39 295.80 1,098.67 13,564.51Nov. 291.73 3,232.44 147.95 153.01 442.91 237.51 236.66 208.39 270.40 339.22 306.30 1,176.46 14,883.70Dec. 298.37 3,342.32 147.10 156.74 485.39 232.87 250.29 218.78 283.76 353.38 329.50 1,229.23 13,842.17
4 Dec. 278.59 3,048.73 143.19 148.42 435.12 220.10 224.89 199.48 266.43 335.76 300.50 1,150.14 14,639.9711 273.85 3,044.56 141.25 143.08 446.41 218.90 227.98 197.59 261.65 321.45 301.58 1,165.02 14,405.6418 279.91 3,134.19 141.16 146.19 462.56 222.79 235.00 197.42 275.32 331.46 312.63 1,179.98 14,194.2925 294.21 3,301.32 147.53 151.85 477.04 231.32 244.25 208.97 282.58 350.20 320.76 1,226.27 13,797.95
1999 1 Jan. 298.37 3,342.32 147.10 156.74 485.39 232.87 250.29 218.78 283.76 353.38 329.50 1,229.23 13,842.17
Dow Jones EURO STOXX Broad, Standard & Poor’s 500 and Nikkei 225 re-based(base month: January 1994 = 100)
Nikkei 225Standard & Poor’s 500
Dow JonesEURO STOXX
0
50
100
150
200
250
300
1994 1995 1996 1997 1998

ECB Month l y Bu l l e t i n • January 1999 17*
Source: ECB.These euro area retail bank interest rates should be used with caution and for statistical purposes only, primarily for analysing their development overtime rather than their level. They are calculated as the weighted average of national interest rates provided by the national central banks. The nationalrates represent those rates that are currently available from national sources and which are judged to fit the standard categories. These national rateshave been aggregated to derive information for the euro area, in some cases relying on proxies and working assumptions due to the heterogeneityobserved in the national financial instruments across MU Member States. Furthermore, the national interest rates are not harmonised in terms of theircoverage (new business and/or outstanding amounts), the nature of the data (nominal or effective) or the compilation method. The country weightsfor the euro area retail bank interest rates are derived from the monthly MFI balance sheet statistics or close proxies. The weights reflect thecountry-specific proportions of the relevant instruments within the euro area, measured as outstanding amounts. The weights are adjusted monthly, sothat interest rates and weights always refer to the same month.
Table 2.8Retail bank interest rates(percentages per annum; lending interest rates are provisional)
Deposit interest rates Lending interest rates
Overnight With agreed maturity Redeemable at notice To enterprises To households
Up to1 year
Up to2 years
Over2 years
Up to3 months
Over3 months
Up to1 year
Over1 year
Consumerlending
For housepurchase
1 2 3 4 5 6 7 8 9 10
1996 1.94 4.07 4.68 5.03 3.01 3.16 8.90 . 11.03 7.761997 1.47 3.40 3.62 4.40 2.80 3.09 7.54 6.69 9.97 6.81
1997 Nov. 1.33 3.44 3.54 4.51 2.79 3.33 7.19 6.60 9.83 6.72Dec. 1.36 3.44 3.52 4.49 2.79 3.39 7.12 6.42 9.77 6.64
1998 Jan. 1.29 3.35 3.40 4.34 2.77 3.35 7.07 6.36 9.70 6.53Feb. 1.25 3.32 3.35 4.31 2.78 3.30 7.03 6.30 9.69 6.41Mar. 1.25 3.29 3.32 4.26 2.75 3.32 6.99 6.19 9.63 6.31Apr. 1.20 3.27 3.30 4.26 2.74 3.30 6.89 6.12 9.49 6.17May 1.12 3.24 3.25 4.27 2.73 3.33 6.81 6.09 9.46 6.15June 1.12 3.26 3.27 4.19 2.61 3.34 6.74 6.04 9.47 6.08July 1.08 3.25 3.26 4.15 2.58 3.29 6.61 6.00 9.39 5.94Aug. 1.05 3.23 3.23 4.06 2.56 3.30 6.58 5.91 9.40 5.88Sep. 1.05 3.17 3.17 3.88 2.54 3.21 6.56 5.78 9.37 5.75Oct. 1.04 3.13 3.13 3.76 2.52 3.14 6.45 5.65 9.15 5.58Nov. 0.94 3.06 3.06 3.71 2.52 3.12 6.34 5.57 9.03 5.52
Deposit interest rates Lending interest rates
Overnight Agreedmaturityup to 1 year
Agreedmaturityover 2 years
Up to 1 yearto enterprises
Consumerlending
To households for house purchase
0.00
2.00
4.00
6.00
8.00
10.00
12.00
1996 0.00
2.00
4.00
6.00
8.00
10.00
12.00
1996
% %
1997 1998 1997 1998

ECB Month l y Bu l l e t i n • January 199918*
Table 4.1
4 HICP and other prices in the euro area
Harmonised Index of Consumer Prices(annual percentage changes, unless otherwise indicated)
Source: Eurostat.1) Including alcoholic beverages and tobacco.2) Referring to index period 1998.3) Annual percentage changes in 1996 include France for the overall index, but do not cover France for all components of the HICP.
Total1996 = 100
Total
Goods Services
Food 1) IndustrialgoodsProcessed
food 1)
Unprocessedfood
Non-energyindustrial
goods
Energy
Weight inthe total (%) 2) 100.0 100.0 65.4 22.9 13.5 9.4 42.5 33.7 8.8 34.6
1 2 3 4 5 6 7 8 9 10
1995 97.9 - - - - - - - - -1996 3) 100.0 2.2 1.8 2.0 2.0 1.9 1.7 1.5 2.4 3.11997 101.6 1.6 1.1 1.5 1.5 1.5 0.9 0.5 2.6 2.4
1997 Q2 101.4 1.4 0.8 0.9 1.4 0.3 0.7 0.4 2.0 2.4Q3 101.8 1.6 1.1 1.5 1.5 1.5 0.9 0.3 3.0 2.5Q4 102.0 1.5 1.1 2.1 1.5 2.9 0.6 0.5 1.0 2.3
1998 Q1 102.2 1.2 0.7 1.7 1.3 2.3 0.2 0.6 -1.5 2.0Q2 102.8 1.4 1.1 2.1 1.6 2.9 0.5 1.0 -1.3 2.0Q3 103.0 1.2 0.7 1.7 1.5 2.1 0.2 1.1 -3.2 2.0
1997 Nov. 102.0 1.6 1.2 2.2 1.5 3.2 0.7 0.6 1.2 2.3Dec. 102.1 1.5 1.1 2.0 1.3 2.9 0.6 0.6 0.5 2.3
1998 Jan. 102.0 1.1 0.6 1.5 1.3 1.8 0.1 0.5 -1.4 2.1Feb. 102.3 1.2 0.7 1.7 1.3 2.2 0.2 0.6 -1.4 2.0Mar. 102.4 1.2 0.8 1.9 1.4 2.7 0.2 0.7 -1.7 1.9Apr. 102.6 1.4 1.1 2.1 1.4 3.1 0.5 0.9 -0.9 2.1May 102.9 1.4 1.1 2.1 1.7 2.7 0.5 1.0 -1.4 2.0June 102.9 1.4 1.1 2.1 1.6 2.8 0.5 1.0 -1.6 2.0July 103.0 1.4 0.9 1.9 1.6 2.4 0.4 1.0 -1.9 2.0Aug. 103.0 1.2 0.7 1.8 1.5 2.3 0.0 1.1 -3.8 2.1Sep. 102.9 1.0 0.5 1.4 1.3 1.5 0.1 1.1 -3.8 2.0Oct. 102.9 1.0 0.4 1.2 1.3 1.0 0.0 1.0 -4.0 2.1Nov. 102.9 0.9 0.3 1.0 1.3 0.6 -0.1 1.0 -4.3 2.1
-0.5
0.0
0.5
1.0
1.5
2.0
2.5
3.0
3.5
4.0
1996 1997 1998
Total HICP Food 1)
Industrial goods Services

ECB Month l y Bu l l e t i n • January 1999 19*
Table 4.2Selected other price and cost indicators(annual percentage changes, unless otherwise indicated)
Sources: Eurostat, except columns 10 and 11 (HWWA-Institut für Wirtschaftsforschung, Hamburg), columns 12 to 16 (ECB calculations based ondeflators in national currency) and columns 17 to 19 (ECB calculations based on non-harmonised national data).1) Residential buildings, based on non-harmonised data.
Deflators of GDP (s.a.) Unit labour costsin wholeeconomy
Compensationper employee
in wholeeconomy
Earnings peremployee in
manufacturingGDP
1995 = 100GDP Private
consumptionGovernmentconsumption
Gross fixedcapital formation
12 13 14 15 16 17 18 19
2. Deflators of gross domestic product and indicators of labour costs
1. Industry and commodity prices
Industrial producer prices World market prices ofraw materials (ECU)
Totalindustry
excludingcon-
struction1995 = 100
Totalindustry
excludingcon-
struction
Manu-facturing
Inter-mediate
goods
Capitalgoods
Consumergoods
Con-struction 1)
Total Totalexcluding
energyDurable
consumergoods
Non-durable
consumergoods
1 2 3 4 5 6 7 8 9 10 11
1995 100.0 3.7 3.9 5.2 1.8 2.1 1.4 2.5 . 0.2 2.11996 100.7 0.7 1.0 -0.6 1.3 1.7 1.3 1.8 1.2 6.5 -6.91997 101.7 1.1 0.6 1.1 0.2 1.0 0.2 1.4 1.4 10.0 13.01998 . . . . . . . . . -21.2 -12.5
1997 Q3 102.0 1.4 1.0 1.9 0.0 0.9 -0.2 1.4 1.7 12.3 19.7Q4 102.1 1.1 1.0 1.1 0.3 1.3 0.1 1.8 1.4 1.8 14.1
1998 Q1 101.7 0.5 0.6 -0.1 0.3 1.0 -0.2 1.6 0.4 -13.8 -0.1Q2 101.3 -0.2 0.0 -0.9 0.3 . . 1.0 0.2 -16.6 -10.7Q3 100.7 -1.3 -1.0 -2.6 0.5 . . 0.3 . -24.3 -18.1Q4 . . . . . . . . . -30.0 -20.5
1997 Dec. 102.0 1.0 1.0 0.7 0.3 1.3 0.1 1.8 - -3.7 12.31998 Jan. 101.9 0.6 0.8 0.1 0.3 1.2 -0.2 1.8 - -12.7 5.4
Feb. 101.8 0.5 0.6 -0.1 0.2 1.0 -0.3 1.6 - -12.8 -0.5Mar. 101.6 0.3 0.5 -0.3 0.3 0.9 -0.2 1.4 - -15.9 -4.8Apr. 101.5 0.1 0.4 -0.4 0.2 0.8 -0.2 1.2 - -12.2 -6.0May 101.3 -0.2 -0.1 -0.9 0.3 0.6 0.0 0.8 - -18.6 -12.8June 101.1 -0.5 -0.3 -1.3 0.3 . . 0.8 - -18.9 -13.3July 100.9 -0.8 -0.6 -1.9 0.5 . . 0.6 - -21.1 -14.4Aug. 100.7 -1.4 -1.2 -2.8 0.5 . . 0.3 - -26.3 -19.0Sep. 100.5 -1.6 -1.4 -2.9 0.4 . . -0.1 - -25.4 -20.9Oct. 100.3 -1.9 -1.7 -3.5 0.4 . . -0.3 - -30.6 -23.6Nov. . . . . . . . . - -28.6 -18.4Dec. . . . . . . . . - -30.8 -19.5
1995 100.0 2.7 2.6 3.0 2.1 1.7 3.5 3.71996 102.0 2.0 2.4 2.4 0.7 1.8 3.4 3.51997 103.4 1.4 1.8 2.0 0.9 0.6 2.6 3.0
1996 Q1 101.4 2.5 2.5 3.2 1.2 2.6 3.6 4.1Q2 101.7 2.0 2.6 1.9 0.7 2.0 3.3 3.2Q3 102.2 1.8 2.2 1.9 0.4 1.7 3.5 3.7Q4 102.6 1.6 2.1 2.0 0.4 1.5 3.3 2.8
1997 Q1 102.9 1.5 2.0 1.7 0.6 1.8 2.9 3.1Q2 103.3 1.5 1.6 2.1 0.8 0.3 2.9 3.4Q3 103.4 1.2 1.9 1.7 1.0 -0.1 2.4 2.7Q4 103.9 1.3 1.7 1.7 1.0 -0.4 2.1 2.8
1998 Q1 104.4 1.4 1.4 1.3 0.6 -2.3 1.0 2.2Q2 104.9 1.5 1.5 1.2 0.2 -0.5 1.2 2.8

ECB Month l y Bu l l e t i n • January 199920*
5 Real economy indicators in the euro area
1995 4,495.9 4,401.3 2,761.3 708.2 907.9 1,443.5 1,348.91996 4,567.9 4,450.2 2,812.7 720.1 912.1 1,509.8 1,392.11997 4,684.1 4,538.3 2,854.1 721.8 929.7 1,663.3 1,517.5
1997 Q3 1,177.6 1,137.6 714.5 180.7 233.2 428.7 388.6Q4 1,185.4 1,147.7 720.3 179.7 235.8 432.4 394.8
1998 Q1 1,195.1 1,162.9 725.2 181.2 239.9 434.3 402.0Q2 1,198.6 1,165.0 728.2 181.5 236.2 441.2 407.5Q3 (p) 1,206.3 1,170.8 733.3 180.3 237.7 444.3 408.8
1995 2.2 1.9 1.9 0.1 3.3 8.1 7.51996 1.6 1.1 1.9 1.7 0.5 4.6 3.21997 2.5 2.0 1.5 0.2 1.9 10.2 9.0
1997 Q3 2.8 2.1 1.3 0.3 1.7 13.0 11.7Q4 3.2 2.6 2.0 -0.5 2.7 11.4 10.4
1998 Q1 3.8 4.0 2.6 0.3 5.2 11.1 12.2Q2 2.5 2.7 2.2 0.4 1.5 7.3 8.4Q3 (p) 2.4 2.9 2.6 -0.2 1.9 3.6 5.2
1995 100.0 3.4 3.5 2.5 7.3 -0.7 1.7 0.0 2.0 0.31996 100.1 0.0 -0.2 -0.6 1.7 0.0 -0.8 -2.3 1.1 6.61997 104.2 4.1 4.7 5.4 4.2 1.0 2.2 -1.2 0.9 3.9
1997 Q3 105.2 4.9 5.4 6.3 5.7 1.4 2.1 -2.3 0.9 6.0Q4 106.5 5.7 6.4 7.2 6.1 3.5 2.8 -0.1 2.2 11.2
1998 Q1 107.6 6.3 7.3 7.3 9.2 8.6 1.3 3.0 2.7 12.6Q2 108.5 4.4 5.0 4.3 6.6 7.9 2.1 0.0 1.8 3.3Q3 109.4 4.0 4.3 3.3 7.0 7.7 1.9 -1.9 3.0 7.5
1997 Nov. 106.1 4.8 5.3 6.2 5.2 2.8 1.3 0.6 -0.8 9.9Dec. 106.9 6.5 7.8 8.4 6.4 4.6 4.4 -1.0 3.8 13.6
1998 Jan. 107.0 5.8 7.6 7.7 8.0 5.9 2.2 10.2 2.9 10.7Feb. 107.7 6.0 6.9 7.1 8.0 8.6 1.1 0.0 2.2 9.8Mar. 108.1 6.9 7.3 7.2 11.2 11.1 0.8 -0.2 3.1 16.5Apr. 108.2 3.2 3.7 3.5 4.9 5.5 0.8 -3.0 0.8 -1.8May 109.1 6.8 7.7 6.1 10.4 12.3 4.2 2.8 1.9 6.9June 108.2 3.3 3.7 3.3 4.7 6.3 1.5 0.3 2.7 5.3July 109.7 4.2 4.6 3.6 7.8 8.0 2.4 -0.9 3.6 7.3Aug. 109.7 4.8 5.2 4.0 8.0 8.9 2.4 -1.3 2.5 7.3Sep. 108.9 3.2 3.5 2.5 5.7 6.9 1.1 -3.3 2.8 7.9Oct. . . . . . . . . . 1.3Nov. . . . . . . . . . 15.5
Sources: Eurostat, except column 23 (ECB calculation based on non-harmonised national data) and column 24 (ACEA/A.A.A.).1) Components exclude changes in inventories.2) Exports and imports cover goods and services and include internal cross-border trade in the euro area.3) Adjusted for variations in the number of working days.
Table 5.1Output and demand indicators
1. Gross domestic product and its components(ECU billions, seasonally adjusted, at 1990 prices) 1)
(annual percentage changes) 1)
2. Selected other real economy indicators(annual percentage changes, unless otherwise indicated)
GDP Domestic demand Privateconsumption
Governmentconsumption
Gross fixedcapital formation
Exports 2) Imports 2)
1 2 3 4 5 6 7
GDP Domestic demand Privateconsumption
Governmentconsumption
Gross fixedcapital formation
Exports 2) Imports 2)
8 9 10 11 12 13 14
Industrial production 3) Retail salesat constant
prices
Newpassenger
carregistrations
Totalexcluding
construction1995 = 100
(s.a.)
Totalexcluding
construction
Manu-facturing
Intermediategoods
Capitalgoods
Durableconsumer
goods
Non-durableconsumer
goods
Construction
15 16 17 18 19 20 21 22 23 24

ECB Month l y Bu l l e t i n • January 1999 21*
Table 5.2Labour market indicators(seasonally adjusted)
Sources: ECB calculations based on available national non-harmonised data (columns 1 to 4 and 7 to 8), Eurostat (columns 5 to 6) and EuropeanCommission Business and Consumer Surveys (chart data).1) Quarterly results are based on available data from those countries which compile monthly or quarterly statistics.2) Calculated according to ILO recommendations.3) Manufacturing; data on capacity utilisation are collected in January, April, July and October and are shown as 2-quarter moving averages.
Employment 1) Unemployment 2) Labour productivity 1)
Whole economy Manufacturing Millions % of labourforce
Whole economyannual
percentagechanges
Manufacturingannual
percentagechanges
1995 = 100 Annualpercentage
changes
1995 = 100 Annualpercentage
changes1 2 3 4 5 6 7 8
1995 100.0 0.4 100.0 -0.8 14.400 11.4 1.8 4.41996 100.2 0.2 98.6 -1.4 14.822 11.6 1.6 1.21997 100.5 0.3 97.9 -0.8 14.927 11.7 2.1 5.6
1997 Q3 100.6 0.3 98.0 -0.3 14.962 11.7 2.5 5.6Q4 100.8 0.5 98.4 0.5 14.842 11.6 2.6 5.9
1998 Q1 101.1 1.0 99.6 2.2 14.523 11.3 3.4 4.8Q2 101.5 1.1 100.4 2.9 14.265 11.1 1.7 2.0Q3 102.0 1.4 100.9 2.9 14.061 11.0 . .
1997 Nov. - - - - 14.832 11.6 - -Dec. - - - - 14.775 11.5 - -
1998 Jan. - - - - 14.573 11.4 - -Feb. - - - - 14.537 11.3 - -Mar. - - - - 14.459 11.3 - -Apr. - - - - 14.336 11.2 - -May - - - - 14.279 11.2 - -June - - - - 14.179 11.1 - -July - - - - 14.108 11.0 - -Aug. - - - - 14.080 11.0 - -Sep. - - - - 13.994 10.9 - -Oct. - - - - 13.868 10.8 - -Nov. - - - - 13.802 10.8 - -
Chart 5.3Opinion surveys
Consumer and industrial confidence indicators(percentage balances; seasonally adjusted)
Capacity utilisation and order books(capacity utilisation, percentages; order books,percentage balances; seasonally adjusted)
Industrial confidence 3)
Consumer confidence
Order books (left-hand scale) 3)
Capacity utilisation (right-hand scale) 3)
-35
-30
-25
-20
-15
-10
-5
0
5
10
1990 1991 1992 1993 1994 1995 1996 1997 1998-60
-50
-40
-30
-20
-10
0
10
1990 1991 1992 1993 1994 1995 1996 1997 199876
77
78
79
80
81
82
83
84
85
86

ECB Month l y Bu l l e t i n • January 199922*
Table 6Saving, investment and financing(as a percentage of GDP, unless otherwise indicated)
6 Saving, investment and financing in theeuro area
Financing of private non-financial sectors 1) 2) Netfinancial
investment
(col. 6 - 14)
Financialinvestmentas a % of
grossinvestment(col. 6 / (4+6))
Netincurrence
of liabilitiesas a % offinancing
(col. 14 / (12+14))
Grosssaving
Netincurrence
of liabilitiesHouseholds Securities
otherthan shares
Shares Loans
Long-termsecurities
Long-termloans
12 13 14 15 16 17 18 19 20 21 22
Source: ECB.1) Selected items of financing and investment.2) Private non-financial sectors comprise non-financial corporations, households and non-profit institutions serving households.
Euro area saving and investment 1) Investment of private non-financial sectors 1) 2)
Grosssaving
Gross fixedcapital
formation
Net lendingto the rest
of the world
Gross fixedcapital
formation
Netacquisitionof financial
assets
Non-financial
corporations
Currencyand
deposits
Securitiesother
than shares
Shares Insurancetechnicalreserves
Long-termsecurities
1 2 3 4 5 6 7 8 9 10 11
1990 23.5 22.8 0.1 19.2 14.4 18.7 5.6 4.4 3.2 1.8 2.51991 21.9 22.9 -1.2 19.3 14.9 16.8 4.0 3.0 2.6 1.6 2.51992 20.9 22.1 -1.0 18.4 14.1 14.3 4.5 1.7 0.5 1.2 2.61993 20.0 20.2 0.5 16.5 12.7 13.0 5.4 0.6 1.1 1.3 2.91994 20.4 19.8 0.3 16.7 13.0 14.1 3.3 2.3 2.5 1.8 3.01995 21.3 20.0 1.0 17.0 13.3 13.2 4.8 1.9 1.7 1.1 3.21996 20.8 19.6 1.4 16.7 13.0 13.2 4.1 0.3 1.2 1.7 3.61997 21.4 19.0 2.1 16.7 12.9 12.1 2.1 -0.2 0.2 2.8 3.5
1990 22.7 12.9 14.2 0.6 0.3 1.8 10.4 3.8 4.4 49.3 38.51991 21.1 13.1 13.2 0.4 0.3 1.5 9.7 4.1 3.6 46.6 38.41992 20.8 13.1 10.7 0.7 0.6 1.4 7.4 4.1 3.6 43.7 33.91993 20.1 12.6 7.4 1.3 1.4 1.5 3.6 4.1 5.6 44.0 26.91994 20.1 11.7 10.0 1.1 1.2 1.8 4.2 3.5 4.1 45.7 33.11995 21.1 11.9 5.7 -1.7 -1.8 1.6 5.2 2.7 7.5 43.7 21.31996 20.6 11.7 8.7 0.2 0.1 1.8 5.1 3.2 4.5 44.1 29.71997 20.1 11.1 8.0 0.1 0.0 1.4 5.5 2.5 4.1 42.1 28.5
Currency and deposits
Gross fixed capital formation Shares Loans Gross saving
Net acquisition of financial assets Insurance technical reserves Long-term securities Net incurrence of liabilities
FinancingInvestment
(as a percentage of GDP)
Investment and financing of private non-financial sectors 1) 2)
-4
0
4
8
12
16
20
24
-4
0
4
8
12
16
20
24
1990 1991 1992 1993 1994 1995 1996 1997 1990 1991 1992 1993 19941995
1996 1997

ECB Month l y Bu l l e t i n • January 1999 23*
7 General government fiscal position in theeuro area and in the euro area countries
Table 7.1General government fiscal position(as a percentage of GDP)
2. Euro area 1) - deficit and debt
1. Euro area 1) - receipts and expenditure
Sources: European Commission (DG II and Eurostat) and ECB.1) The transactions among the euro area countries are not consolidated.2) Euro area excluding Luxembourg for 1990-95.3) Difference between the annual change in nominal gross consolidated debt and the deficit as a percentage of GDP.4) Annual change in nominal gross consolidated debt expressed as a percentage of GDP: [debt(t)-debt(t-1)] / GDP(t).
Current Current Net Deficit (-) /receipts 2) Direct
taxesIndirect
taxesSocial
contributionsexpenditure 2) Public
consumption Interest Transfers to
households capital
expenditure 2)
Investment surplus (+)
1 2 3 4 5 6 7 8 9 10 11
Primarydeficit (-) /surplus (+)
Cyclicallyadjusted
deficit (-) /surplus (+) 2)
Deficit/ debt
adjust-ment 3)
Change in debt 4) Gross nominal consolidated debt
Total Currency,deposits
and loans
Short-term
securities
Medium/long-termsecurities
Total Currency,deposits
and loans
Short-term
securities
Medium/long-termsecurities
12 13 14 15 16 17 18 19 20 21 22
3. Euro area countries - deficit (-) / surplus (+)
4. Euro area countries - gross nominal consolidated debt
BE DE ES FR IE IT LU NL AT PT FI
1 2 3 4 5 6 7 8 9 10 11
BE DE ES FR IE IT LU NL AT PT FI
12 13 14 15 16 17 18 19 20 21 22
1990 45.0 12.0 12.9 16.7 45.0 17.5 4.8 18.5 4.1 3.0 -4.11991 45.9 12.3 12.9 17.3 46.2 18.1 4.9 19.2 4.2 3.1 -4.41992 46.7 12.3 13.0 17.7 47.7 18.5 5.5 19.9 3.6 3.1 -4.61993 47.6 12.5 13.2 18.1 49.4 18.8 5.7 20.8 3.9 2.9 -5.61994 47.0 12.0 13.4 18.0 48.5 18.5 5.5 20.7 3.6 2.8 -5.11995 46.8 12.1 13.3 18.0 48.2 18.2 5.8 20.6 3.6 2.6 -5.01996 47.1 12.1 13.4 18.2 48.2 18.3 5.5 20.6 3.2 2.5 -4.21997 47.3 12.2 13.5 18.2 47.1 17.9 5.1 20.5 2.7 2.4 -2.5
1990 0.7 -5.7 1.5 5.6 1.3 1.0 3.3 58.4 18.8 9.4 30.21991 0.5 -5.9 0.7 5.2 1.2 0.0 4.0 58.3 18.4 8.5 31.41992 0.9 -5.6 2.2 6.8 1.7 0.8 4.2 61.8 19.0 8.9 33.91993 0.2 -4.9 2.5 8.0 1.5 -0.3 6.9 68.3 20.0 8.3 39.91994 0.4 -4.7 0.8 5.9 0.2 0.6 5.1 70.7 19.2 8.5 43.11995 0.8 -4.6 2.3 7.2 2.0 -0.2 5.5 74.6 20.3 7.8 46.51996 1.4 -3.5 -0.2 3.9 0.3 0.0 3.6 76.0 19.9 7.6 48.51997 2.6 -1.9 -0.3 2.2 0.0 -1.0 3.2 75.3 19.1 6.3 49.9
1990 -5.5 -2.1 -4.3 -1.6 -2.3 -11.1 5.0 -5.1 -2.4 -5.1 5.41991 -6.3 -3.1 -4.5 -2.1 -2.3 -10.1 1.9 -2.9 -3.0 -6.0 -1.51992 -6.9 -2.6 -4.1 -3.9 -2.5 -9.6 0.8 -3.9 -2.0 -3.0 -5.91993 -7.1 -3.2 -7.0 -5.8 -2.4 -9.5 1.7 -3.2 -4.2 -6.1 -8.01994 -4.9 -2.4 -6.3 -5.8 -1.7 -9.2 2.8 -3.8 -5.0 -6.0 -6.41995 -3.9 -3.3 -7.3 -4.9 -2.2 -7.7 1.9 -4.0 -5.1 -5.7 -4.71996 -3.2 -3.4 -4.7 -4.1 -0.4 -6.7 2.9 -2.0 -3.7 -3.3 -3.51997 -2.0 -2.7 -2.6 -3.0 0.9 -2.7 3.0 -0.9 -1.9 -2.5 -1.1
1990 125.7 43.8 44.8 35.5 96.0 98.0 4.7 79.1 57.9 65.3 14.51991 127.5 41.5 45.5 35.8 95.3 101.5 4.2 78.9 58.1 67.3 23.01992 129.0 44.1 48.0 39.8 92.3 108.7 5.1 79.9 58.0 60.1 41.51993 135.2 48.0 60.0 45.3 96.3 119.1 6.1 81.1 62.7 63.1 58.01994 133.2 50.2 62.6 48.5 88.2 124.9 5.7 77.9 65.4 63.8 59.61995 131.0 58.3 65.6 52.7 80.9 124.2 5.9 79.2 69.2 65.9 58.11996 126.8 60.8 70.2 55.7 71.4 124.0 6.6 77.1 69.6 64.9 57.81997 121.9 61.5 68.9 58.1 63.4 121.6 6.7 71.4 64.3 61.5 55.1

ECB Month l y Bu l l e t i n • January 199924*
Sources: European Commission (DG II and Eurostat) and ECB.1) Euro area excluding Luxembourg.
% of GDP Deficit Cyclically adjusted deficit
Debt (left-hand scale) Current expenditure (right-hand scale)
Chart 7.2
Chart 7.3
General government deficit 1)
General government debt and current expenditure 1)
-7.0
-6.0
-5.0
-4.0
-3.0
-2.0
-1.0
0.0
1.0
1981 1982 1983 1984 1985 1986 1987 1988 1989 1990 1991 1992 1993 1994 1995 1996 1997
1981 1983 1985 1987 1989 1991 1993 1995 1997
20.0
30.0
40.0
50.0
60.0
70.0
80.0
42.0
44.0
46.0
48.0
50.0
52.0
54.0% of GDP% of GDP

ECB Month l y Bu l l e t i n • January 1999 25*
9 Trade in goods of the euro area
Table 9.1Exports(ECU billions; f.o.b. value)
Total Food,drink,
tobacco
Rawmaterials
Energy Chemicals Othermanufactured
articles
Machinery,transport
equipment
Other
1 2 3 4 5 6 7 8
Source: Eurostat; the commodity breakdown is in accordance with the SITC Rev. 3.
1995 618.56 46.79 14.53 11.14 79.50 182.75 271.31 12.551996 663.94 48.65 13.71 12.97 85.08 194.25 293.46 15.821997 754.39 52.58 16.23 14.35 98.75 215.77 341.60 15.12
1996 Q1 157.17 11.48 3.43 3.08 20.46 46.11 68.71 3.91Q2 164.88 11.94 3.43 3.24 21.26 47.73 73.38 3.89Q3 161.58 11.92 3.25 3.15 21.69 48.39 69.34 3.84Q4 180.32 13.31 3.60 3.50 21.67 52.03 82.02 4.18
1997 Q1 168.57 11.93 3.80 3.63 22.53 48.56 74.37 3.75Q2 189.74 13.28 4.07 3.61 25.08 53.72 86.06 3.92Q3 191.67 12.99 4.15 3.42 25.60 55.54 86.29 3.68Q4 204.41 14.37 4.21 3.70 25.54 57.95 94.87 3.77
1998 Q1 192.64 13.13 4.12 3.40 26.52 54.29 87.37 3.81Q2 202.65 13.92 3.89 3.30 26.93 55.96 94.65 4.01Q3 193.49 . . . . . . .
1997 Aug. 54.85 3.94 1.28 1.09 7.89 15.63 23.90 1.10Sep. 67.76 4.71 1.49 1.15 8.78 19.54 30.81 1.28Oct. 72.54 5.23 1.54 1.26 9.27 21.22 32.65 1.36Nov. 65.62 4.63 1.34 1.18 8.20 18.71 30.33 1.23Dec. 66.25 4.51 1.33 1.25 8.07 18.02 31.89 1.18
1998 Jan. 57.93 4.04 1.25 1.17 8.36 16.16 25.77 1.18Feb. 63.27 4.30 1.36 1.01 8.59 17.99 28.76 1.25Mar. 71.44 4.79 1.51 1.21 9.57 20.15 32.84 1.38Apr. 67.52 4.68 1.31 1.11 9.16 18.82 30.97 1.47May 65.46 4.55 1.26 1.06 8.69 18.06 30.53 1.31June 69.67 4.70 1.32 1.12 9.08 19.08 33.14 1.23July 72.06 4.49 1.33 1.06 9.26 20.87 33.83 1.22Aug. 55.83 3.95 1.23 0.91 7.74 15.43 25.47 1.10Sep. 65.60 . . . . . . .
Percentage change compared with the corresponding period in the previous year
Aug. 1998 1.8 0.2 -4.2 -16.5 -1.9 -1.3 6.6 -0.2
CumulativeJan.-Aug. 1998 8.5 6.0 0.4 -8.9 9.3 6.0 11.8 0.7

ECB Month l y Bu l l e t i n • January 199926*
Table 9.2Imports(ECU billions; c.i.f. value)
Source: Eurostat; the commodity breakdown is in accordance with the SITC Rev. 3.
Total Food,drink,
tobacco
Rawmaterials
Energy Chemicals Othermanufactured
articles
Machinery,transport
equipment
Other
1 2 3 4 5 6 7 8
1995 558.78 46.03 39.81 62.09 52.13 163.71 177.36 17.651996 590.45 46.68 36.45 73.85 53.75 166.12 191.34 22.261997 666.79 49.42 41.19 80.91 61.59 187.01 226.90 19.76
1996 Q1 147.41 11.72 9.70 16.35 13.60 42.71 47.81 5.52Q2 146.66 11.64 9.42 17.53 13.75 40.22 48.69 5.42Q3 140.38 11.18 8.29 17.81 12.69 41.75 43.51 5.14Q4 156.00 12.13 9.04 22.16 13.71 41.44 51.32 6.19
1997 Q1 156.66 11.29 9.59 20.88 14.51 44.31 51.23 4.85Q2 166.17 12.57 11.01 18.62 15.92 46.27 56.98 4.79Q3 165.68 12.14 10.01 19.98 15.13 48.62 55.27 4.54Q4 178.27 13.43 10.59 21.42 16.03 47.81 63.42 5.57
1998 Q1 180.12 12.64 10.83 17.49 17.58 51.18 64.48 5.92Q2 178.32 12.54 11.12 15.87 17.21 50.03 65.76 5.80Q3 168.69 . . . . . . .
1997 Aug. 48.65 3.64 2.85 6.78 4.35 14.20 15.60 1.23Sep. 60.99 4.26 3.70 6.63 5.57 17.93 21.21 1.69Oct. 62.95 4.81 3.68 7.53 5.79 17.33 21.91 1.91Nov. 57.42 4.21 3.47 6.84 5.19 15.30 20.65 1.76Dec. 57.91 4.41 3.43 7.06 5.06 15.18 20.86 1.91
1998 Jan. 57.77 4.12 3.51 6.16 5.59 16.39 20.10 1.90Feb. 58.11 3.95 3.53 5.74 5.53 16.58 20.69 2.10Mar. 64.24 4.57 3.80 5.60 6.46 18.21 23.69 1.92Apr. 59.84 4.33 3.66 5.42 5.74 16.62 22.24 1.84May 56.98 4.03 3.55 5.52 5.56 15.74 20.88 1.71June 61.50 4.19 3.91 4.93 5.91 17.67 22.64 2.25July 58.78 4.29 3.56 4.91 5.86 17.65 20.75 1.75Aug. 49.49 3.68 2.78 4.69 4.66 14.72 17.54 1.43Sep. 60.42 . . . . . . .
Percentage change compared with the corresponding period in the previous year
Aug. 1998 1.7 1.1 -2.3 -30.8 7.0 3.6 12.4 16.2
CumulativeJan.-Aug. 1998 9.2 4.5 5.2 -18.7 13.3 10.1 18.5 19.3

ECB Month l y Bu l l e t i n • January 1999 27*
Table 9.3Trade balance(ECU billions; exports (f.o.b.) - imports (c.i.f.))
Total Food,drink,
tobacco
Rawmaterials
Energy Chemicals Othermanufactured
articles
Machinery,transport
equipment
Other
1 2 3 4 5 6 7 8
Source: Eurostat; the commodity breakdown is in accordance with the SITC Rev. 3.
1995 59.77 0.76 -25.29 -50.96 27.37 19.04 93.95 -5.111996 73.49 1.97 -22.74 -60.88 31.33 28.13 102.12 -6.441997 87.60 3.15 -24.96 -66.56 37.16 28.76 114.70 -4.64
1996 Q1 9.76 -0.25 -6.26 -13.27 6.86 3.40 20.89 -1.61Q2 18.21 0.30 -5.99 -14.29 7.51 7.50 24.69 -1.52Q3 21.19 0.74 -5.04 -14.66 8.99 6.63 25.83 -1.30Q4 24.32 1.18 -5.45 -18.66 7.96 10.59 30.70 -2.01
1997 Q1 11.91 0.64 -5.79 -17.26 8.02 4.25 23.14 -1.09Q2 23.57 0.72 -6.94 -15.01 9.16 7.45 29.07 -0.88Q3 25.99 0.86 -5.86 -16.57 10.47 6.92 31.03 -0.86Q4 26.14 0.94 -6.37 -17.72 9.50 10.14 31.45 -1.81
1998 Q1 12.52 0.49 -6.71 -14.10 8.94 3.11 22.89 -2.11Q2 24.33 1.38 -7.23 -12.58 9.72 5.93 28.89 -1.79Q3 24.80 . . . . . . .
1997 Aug. 6.19 0.31 -1.56 -5.69 3.54 1.42 8.30 -0.13Sep. 6.77 0.45 -2.21 -5.48 3.21 1.61 9.60 -0.41Oct. 9.59 0.43 -2.14 -6.26 3.48 3.89 10.74 -0.55Nov. 8.20 0.42 -2.13 -5.65 3.01 3.41 9.68 -0.53Dec. 8.34 0.10 -2.11 -5.81 3.02 2.83 11.03 -0.73
1998 Jan. 0.16 -0.08 -2.25 -4.98 2.77 -0.24 5.67 -0.73Feb. 5.16 0.35 -2.17 -4.73 3.07 1.41 8.07 -0.84Mar. 7.20 0.22 -2.29 -4.38 3.10 1.94 9.15 -0.53Apr. 7.68 0.35 -2.35 -4.31 3.42 2.20 8.73 -0.37May 8.48 0.52 -2.28 -4.46 3.13 2.32 9.66 -0.40June 8.17 0.51 -2.59 -3.81 3.17 1.41 10.50 -1.02July 13.28 0.20 -2.23 -3.85 3.39 3.23 13.08 -0.53Aug. 6.34 0.28 -1.55 -3.78 3.08 0.71 7.93 -0.33Sep. 5.18 . . . . . . .
Absolute change compared with the corresponding period in the previous year
Aug. 1998 0.1 0.0 0.0 1.9 -0.5 -0.7 -0.4 -0.2
CumulativeJan.-Aug. 1998 1.8 0.6 -1.3 9.0 0.7 -4.0 -0.9 -2.3

ECB Month l y Bu l l e t i n • January 199928*
10 Exchange rates
Table 10Exchange rates 1)
(period averages; units of national currency per ECU (bilateral); index 1990 = 100 (effective))
1994 1.625 2.002 9.17 957.0 1.810 31.44 4.02 93.2 94.11995 1.765 1.993 10.01 999.7 1.833 34.28 8.35 97.8 98.91996 1.623 1.847 9.68 1,007.9 1.765 34.39 9.52 98.2 99.31997 1.528 1.715 8.75 1,073.2 1.678 32.50 8.95 90.4 90.8
1997 Q4 1.621 1.820 8.69 1,291.1 1.795 35.15 9.07 90.4 90.51998 Q1 1.630 1.879 8.42 1,745.8 1.817 36.07 9.17 89.6 89.7
Q2 1.754 2.063 8.53 1,537.0 1.810 37.09 9.55 91.4 91.3Q3 1.867 2.199 8.67 1,486.8 1.935 38.71 10.62 93.5 93.6Q4 1.887 2.236 9.16 1,516.6 1.942 38.64 11.84 94.6 94.3
1997 Dec. 1.677 1.878 8.61 1,660.6 1.837 36.14 9.04 91.0 91.21998 Jan. 1.656 1.876 8.42 1,855.8 1.900 37.08 8.94 90.3 90.5
Feb. 1.615 1.867 8.43 1,773.8 1.798 35.89 9.26 89.5 89.7Mar. 1.619 1.892 8.41 1,615.8 1.757 35.30 9.30 88.9 89.0Apr. 1.673 1.971 8.47 1,520.2 1.749 36.07 9.29 89.6 89.5May 1.762 2.062 8.60 1,552.4 1.817 37.13 9.53 92.2 92.1June 1.824 2.151 8.53 1,539.8 1.866 38.06 9.83 92.2 92.2July 1.776 2.116 8.51 1,423.6 1.878 37.79 9.78 92.0 92.2Aug. 1.868 2.196 8.55 1,450.4 1.939 38.33 10.34 93.3 93.5Sep. 1.962 2.289 8.97 1,592.4 1.994 40.10 11.83 95.2 95.1Oct. 1.932 2.284 9.31 1,615.7 1.969 39.81 12.21 95.9 95.5Nov. 1.834 2.180 9.05 1,511.9 1.913 38.08 11.64 94.1 93.8Dec. 1.893 2.241 9.11 1,426.3 1.941 38.02 11.65 94.0 93.6
% ch. vs. 2) prev. month 3.2 2.8 0.7 -5.7 1.5 -0.2 0.0 -0.2 -0.2prev. year 12.9 19.3 5.8 -14.1 5.7 5.2 28.9 3.3 2.7
1994 1.190 121.3 1.621 0.776 9.16 7.54 288.0 8.37 1.6251995 1.308 123.0 1.546 0.829 9.33 7.33 303.0 8.29 1.7951996 1.270 138.1 1.568 0.814 8.51 7.36 305.5 8.20 1.7311997 1.134 137.1 1.644 0.692 8.65 7.48 309.3 8.02 1.569
1997 Q4 1.123 140.5 1.610 0.677 8.58 7.51 310.2 8.01 1.5811998 Q1 1.087 139.2 1.604 0.660 8.71 7.53 319.1 8.20 1.554
Q2 1.100 149.5 1.643 0.665 8.60 7.52 339.9 8.28 1.592Q3 1.118 156.3 1.642 0.676 8.95 7.50 332.7 8.54 1.690Q4 1.177 140.6 1.600 0.702 9.38 7.44 331.5 8.82 1.814
1997 Dec. 1.112 143.9 1.599 0.669 8.66 7.53 310.9 8.06 1.5851998 Jan. 1.088 140.8 1.604 0.665 8.72 7.53 312.3 8.16 1.566
Feb. 1.088 136.8 1.593 0.664 8.80 7.53 312.4 8.23 1.561Mar. 1.084 139.9 1.614 0.653 8.64 7.55 331.6 8.22 1.536Apr. 1.091 144.1 1.643 0.653 8.53 7.55 345.0 8.22 1.560May 1.109 149.7 1.639 0.677 8.54 7.50 340.3 8.26 1.603June 1.101 154.4 1.645 0.667 8.71 7.52 334.8 8.34 1.613July 1.098 154.3 1.661 0.668 8.77 7.52 328.7 8.37 1.630Aug. 1.102 159.4 1.646 0.675 8.96 7.50 331.6 8.51 1.688Sep. 1.154 155.3 1.617 0.687 9.12 7.48 337.9 8.74 1.756Oct. 1.194 144.2 1.596 0.705 9.37 7.44 336.5 8.88 1.842Nov. 1.164 140.1 1.612 0.701 9.31 7.44 329.1 8.68 1.793Dec. 1.172 137.4 1.594 0.702 9.45 7.45 328.8 8.91 1.807
% ch. vs. 2) prev. month 0.7 -2.0 -1.1 0.2 1.6 0.0 -0.1 2.7 0.8prev. year 5.4 -4.6 -0.3 4.9 9.2 -1.0 5.8 10.5 14.0
Bilateral ECU exchange ratesUS
dollarJapanese
yenSwissfranc
Poundsterling
Swedishkrona
Danishkrone
Greekdrachma
Norwegiankrone
Canadiandollar
1 2 3 4 5 6 7 8 9
Bilateral ECU exchange rates Effective exchange rateAustralian New Zealand Hong Kong Korean Singapore Taiwan Mexican (EER) of the euro area 3)
dollar dollar dollar won dollar dollar peso Nominal Real10 11 12 13 14 15 16 17 18
Source: BIS.1) From January 1999 onwards the table will continue with bilateral and effective exchange rates for the euro.2) A percentage change of the latest monthly observation is shown compared with the previous month and the same month of the previous year,
respectively. A positive change denotes an appreciation of the ECU.3) BIS calculations; based on weighted averages of the euro area countries’ effective exchange rates against the trading partners whose currencies are
shown in the table. Weights are based on 1990 manufactured goods trade and capture third market effects. Real rates are calculated using nationalCPIs. Where CPI data are not yet available, estimates are used.

ECB Month l y Bu l l e t i n • January 1999 29*
Table 11 Economic and financial developments(annual percentage changes, unless otherwise indicated)
HICP Generalgovern-
mentdeficit (-) /surplus (+)as a % of
GDP
Generalgovern-
ment grossdebt
as a % ofGDP
Long-termgovern-
ment bondyield 1)
as a %per
annum
Exchangerate 2)
as nationalcurrencyper ECU
Currentand new
capitalaccount 3)
as a % ofGDP
Unitlabourcosts 4)
RealGDP
Industrialproduction
index 5)
Standard-ised
unemploy-ment rateas a % of
labourforce (s.a.)
Broadmoney 6) 7)
3-monthinterest
rate 7)
as a %per
annum
1 2 3 4 5 6 7 8 9 10 11 12
Sources: Eurostat (columns 1, 8 and 10 (except Greece)); European Commission (DG II and Eurostat) (columns 2 and 3); Reuters (column 12); national data(columns 4, 5, 6, 7, 9, 10 (Greece) and 11).
1995 - -5.5 53.9 8.32 0.829 -0.5 1.7 2.8 1.7 8.7 9.9 6.561996 2.5 -4.7 54.7 7.94 0.814 -0.2 2.0 2.6 0.3 8.2 9.5 6.561997 1.8 -2.1 53.5 7.13 0.692 0.6 3.3 3.5 1.5 7.0 11.8 7.481998 . . . 5.58 0.676 . . . . . . 6.121997 Q4 1.9 - - 6.57 0.677 0.0 3.5 4.0 0.9 6.6 11.8 7.481998 Q1 1.5 - - 6.10 0.660 -1.6 3.1 3.7 0.3 6.4 9.7 7.47
Q2 1.8 - - 5.89 0.665 . . 3.0 0.2 6.3 9.2 7.59Q3 1.4 - - 5.57 0.676 . . 2.3 . 6.2 9.1 7.27Q4 . - - 4.75 0.702 . . . . . . 6.12
1998 June 1.7 - - 5.87 0.667 - - - 0.0 6.2 9.2 7.59July 1.5 - - 5.92 0.668 - - - -0.6 6.3 10.2 7.65Aug. 1.3 - - 5.63 0.675 - - - . 6.2 8.8 7.50Sep. 1.5 - - 5.16 0.687 - - - . 6.2 9.1 7.27Oct. 1.3 - - 4.99 0.705 - - - . . 9.1 7.12Nov. 1.4 - - 4.93 0.701 - - - . . . 6.62Dec. . - - 4.33 0.702 - - - . . . 6.12
United Kingdom
1995 - -7.0 78.0 10.24 9.33 . . 3.9 12.6 8.8 2.7 8.371996 0.8 -3.5 77.2 8.02 8.51 . . 1.3 3.1 9.6 11.4 3.931997 1.8 -0.8 76.9 6.62 8.65 2.7 . 1.8 8.1 9.9 1.3 4.681998 . . . 4.99 8.92 . . . . . . 3.421997 Q4 2.7 - - 6.18 8.58 2.1 . 3.3 9.1 9.1 1.3 4.681998 Q1 1.9 - - 5.51 8.71 3.1 . 2.9 4.2 8.7 -0.6 4.50
Q2 1.4 - - 5.13 8.60 1.2 . 2.3 6.6 8.6 2.8 4.12Q3 0.6 - - 4.82 8.95 2.4 . 3.5 4.5 8.1 4.8 4.12Q4 . - - 4.50 9.38 . . . . . . 3.42
1998 June 1.4 - - 4.97 8.71 - - - 7.5 8.0 2.8 4.12July 1.3 - - 4.88 8.77 - - - 7.2 8.5 5.5 4.12Aug. 0.6 - - 4.80 8.96 - - - 6.3 8.2 3.9 4.19Sep. -0.1 - - 4.79 9.12 - - - 1.2 7.6 4.8 4.12Oct. 0.1 - - 4.72 9.37 - - - 4.3 7.5 5.9 3.93Nov. 0.1 - - 4.55 9.31 - - - . 7.6 . 3.50Dec. . - - 4.22 9.45 - - - . . . 3.42
Sweden
Denmark
1995 - -2.4 73.1 8.27 7.33 1.1 1.7 3.0 4.4 7.2 4.1 4.601996 2.1 -0.7 68.4 7.19 7.36 1.7 1.0 3.3 1.4 6.8 7.2 3.561997 1.9 0.5 64.1 6.26 7.48 0.9 2.8 3.1 4.5 5.5 5.2 3.831998 . . . . 7.50 . . . . . . 4.001997 Q4 1.6 - - 5.96 7.51 -1.3 3.1 3.3 6.8 5.1 5.2 3.831998 Q1 1.6 - - 5.30 7.53 -0.7 2.2 4.0 5.6 5.0 2.9 3.75
Q2 1.4 - - 5.12 7.52 . 2.0 1.1 -1.1 4.6 3.5 4.00Q3 1.2 - - 4.82 7.50 . 3.5 3.4 2.4 4.5 8.4 4.62Q4 . - - . 7.44 . . . . . . 4.00
1998 June 1.2 - - 4.99 7.52 - - - 5.0 4.5 3.5 4.00July 1.4 - - 4.91 7.52 - - - 3.1 4.6 5.3 4.06Aug. 1.1 - - 4.81 7.50 - - - 4.9 4.5 6.2 4.25Sep. 1.1 - - 4.74 7.48 - - - -0.8 4.3 8.4 4.62Oct. 1.1 - - 4.67 7.44 - - - 1.6 4.2 4.0 4.43Nov. 1.1 - - 4.59 7.44 - - - . . 4.1 4.12Dec. . - - . 7.45 - - - . . . 4.00
1995 - -10.6 110.1 . 303.0 -2.5 11.6 2.1 2.1 7.1 10.2 14.701996 7.9 -7.5 112.2 . 305.5 -3.7 10.6 2.7 0.6 7.5 9.2 12.201997 5.4 -4.0 109.5 9.92 309.3 . 7.1 3.5 1.0 7.9 9.7 12.501998 . . . 8.48 330.7 . . . . . . 11.401997 Q4 4.7 - - 10.18 310.2 . . . 2.8 7.9 9.7 12.501998 Q1 4.2 - - 10.45 319.1 . . . 2.9 8.1 4.8 10.85
Q2 5.0 - - 7.90 339.9 . . . 6.0 10.3 2.7 12.20Q3 4.8 - - 7.83 332.7 . . . 3.1 11.7 1.1 12.25Q4 . - - 7.76 331.5 . . . . . . 11.40
1998 June 4.9 - - 7.74 334.8 - - - 6.6 11.1 2.7 12.20July 4.8 - - 7.67 328.7 - - - 8.3 11.2 2.3 12.00Aug. 4.7 - - 7.56 331.6 - - - 3.2 12.1 2.2 14.00Sep. 5.0 - - 8.25 337.9 - - - -1.4 11.9 1.1 12.25Oct. 4.5 - - 8.45 336.5 - - - 1.0 10.4 2.4 11.70Nov. 3.9 - - 7.65 329.1 - - - . . 5.4 11.45Dec. . - - 7.17 328.8 - - - . . . 11.40
Greece
11 Economic and financial developments inthe other EU Member States
5) Manufacturing; adjusted for working days.6) M3; M4 for the United Kingdom.7) End-of-period values.
3) BPM4; BPM5 for Sweden.4) Whole economy; data for the United Kingdom
exclude employers’ contribution to social security.
1) Average-of-period values.2) For more information, see Table 10.

ECB Month l y Bu l l e t i n • January 199930*
12 Economic and financial developmentsoutside the EU
Consumerprice index
Unit labourcosts 1)
Real GDP Industrialproduction
index 1)
Standard-ised
unemploy-ment rate
as a % oflabour force
(s.a.)
M2 2) 3-monthinterbank
deposit bidrate 3)
as a %per annum
10-yeargovernment
bondyield 3)
as a %per annum
Exchangerate 4)
as nationalcurrencyper ECU
Fiscaldeficit (-) /surplus (+)as a % of
GDP
Grosspublicdebt 5)
as a % ofGDP
1 2 3 4 5 6 7 8 9 10 11
Table 12.1Economic and financial developments(annual percentage changes, unless otherwise indicated)
Japan
Sources: National data (columns 1, 2 (United States), 3, 4, 6, 9 and 11); OECD (column 2 (Japan)); Eurostat (column 5 and euro area chart data),Reuters (column 7); European Commission (DG II) (column 10).1) Manufacturing. 4) For more information, see Table 10.2) Average-of-period values, M2 and CDs for Japan. 5) Gross consolidated debt for the general government (end of period).3) For more information, see Tables 2.5 and 2.6.
United States1995 2.8 -1.6 2.3 5.4 5.6 2.1 5.44 6.69 1.308 -2.3 60.81996 2.9 -2.3 3.4 4.8 5.4 4.9 5.43 6.54 1.270 -1.2 59.91997 2.3 0.0 3.9 6.7 4.9 5.0 5.62 6.45 1.134 0.1 57.81998 . . . . . . 5.00 5.33 1.121 . .1997 Q4 1.9 0.7 3.8 7.3 4.7 5.7 5.62 5.99 1.123 . 57.81998 Q1 1.5 1.1 4.2 6.0 4.7 6.5 5.59 5.67 1.087 . 57.7
Q2 1.6 1.0 3.6 5.0 4.4 7.2 5.59 5.67 1.100 . 56.1Q3 1.6 1.4 3.5 3.2 4.6 7.4 5.20 5.27 1.118 . 55.2Q4 . . . . . . 5.00 4.72 1.177 . .
1998 June 1.7 - - 3.6 4.5 7.2 5.59 5.58 1.101 - -July 1.7 - - 2.9 4.5 7.3 5.56 5.53 1.098 - -Aug. 1.6 - - 3.7 4.5 7.2 5.50 5.41 1.102 - -Sep. 1.5 - - 2.9 4.6 7.9 5.20 4.87 1.154 - -Oct. 1.5 - - 2.9 4.5 8.5 5.12 4.58 1.194 - -Nov. 1.5 - - 2.0 . 8.8 5.12 4.89 1.164 - -Dec. . - - . . . 5.00 4.69 1.172 - -
1995 -0.1 -2.5 1.5 3.4 3.1 3.0 0.50 3.32 123.0 -3.6 .1996 0.1 -1.7 5.1 2.3 3.4 3.3 0.31 3.03 138.1 -4.3 .1997 1.7 -1.8 1.4 3.6 3.4 3.1 0.36 2.15 137.1 -3.3 .1998 . . . . . . 0.18 1.30 146.4 . .1997 Q4 2.1 1.8 -0.9 -0.7 3.4 3.3 0.36 1.68 140.5 . .1998 Q1 2.0 3.7 -3.5 -4.0 3.7 4.7 0.50 1.65 139.2 . .
Q2 0.3 7.1 -1.7 -8.5 4.2 3.7 0.43 1.36 149.5 . .Q3 -0.2 . -3.6 -8.6 4.3 3.7 0.12 1.14 156.3 . .Q4 . . . . . . 0.18 1.04 140.6 . .
1998 June 0.1 5.4 - -7.6 4.2 3.4 0.43 1.22 154.4 - -July -0.1 8.5 - -9.2 4.2 3.5 0.34 1.36 154.3 - -Aug. -0.3 8.3 - -9.1 4.3 3.8 0.37 1.17 159.4 - -Sep. -0.2 . - -7.6 4.3 3.8 0.12 0.88 155.3 - -Oct. 0.2 . - -7.9 . 3.9 0.68 0.82 144.2 - -Nov. 0.8 . - -5.5 . 4.4 0.68 0.89 140.1 - -Dec. . . - . . . 0.18 1.39 137.4 - -
Real gross domestic product(annual percentage changes)
Consumer price indices(annual percentage changes)
United States Japan
Euro area
United States Japan
Euro area
-5
-4
-3
-2
-1
0
1
2
3
4
5
6
7
8
-1
0
1
2
3
4
1996 1997 1998 1996 1997 1998

ECB Month l y Bu l l e t i n • January 1999 31*
Table 12.2Saving, investment and financing(as a percentage of GDP)
United States
Sources: ECB, Federal Reserve Board, Bank of Japan and Economic Planning Agency.1) Households including non-profit institutions serving households. For Japan, saving of non-profit institutions serving households is included under
saving of non-financial corporations.
National saving andinvestment
Investment and financing of non-financial corporations Investment and financing of households 1)
Grosssaving
Grosscapital
formation
Netlending tothe rest ofthe world
Grosscapital
formation
Netacquisi-tion of
financialassets
Grosssaving
Netincurrence
ofliabilities
Capitalexpend-
iture
Netacquisi-tion of
financialassets
Grosssaving
Netincurrence
ofliabilities
Grossfixed
capitalformation
Secur-ities and
shares
1 2 3 4 5 6 7 8 9 10 11 12 13
Japan
1994 15.5 17.5 -1.7 7.4 6.7 4.1 7.9 3.5 1.4 12.4 7.6 13.7 4.51995 16.3 17.4 -1.4 7.8 7.2 6.0 8.3 5.4 2.5 12.2 6.7 13.4 4.91996 16.6 17.8 -1.6 7.8 7.5 5.2 8.2 4.8 1.4 12.4 5.7 13.3 5.11997 17.3 18.4 -1.7 8.4 7.6 4.2 8.2 4.4 1.9 12.3 4.8 12.7 4.91997 Q1 17.0 18.1 -1.6 8.2 7.4 6.1 8.1 5.9 1.5 12.4 3.0 12.7 4.5
Q2 17.6 18.5 -1.5 8.8 7.5 2.4 8.3 2.9 1.4 12.2 5.7 13.2 4.7Q3 17.5 18.4 -1.7 8.3 7.7 4.8 8.4 5.2 2.0 12.3 5.7 12.8 5.4Q4 17.3 18.5 -2.0 8.4 7.7 3.7 8.1 3.6 2.5 12.3 4.8 12.1 4.9
1998 Q1 17.7 19.1 -2.1 8.9 7.9 5.9 8.2 7.2 2.3 12.5 4.3 11.5 5.6Q2 17.2 18.7 -2.5 8.4 8.0 4.4 8.1 5.1 2.7 12.8 6.5 11.5 5.6Q3 17.2 18.8 -2.7 8.6 7.9 4.1 8.1 4.8 2.1 12.8 3.8 11.0 5.5
1994 31.3 28.7 2.7 12.8 14.5 1.6 12.3 1.0 0.8 7.2 10.3 12.6 1.51995 30.8 28.6 2.1 14.9 14.9 3.1 13.5 2.3 0.5 5.3 10.3 13.1 1.91996 31.5 30.0 1.4 14.6 15.3 1.7 15.2 0.3 1.0 6.7 6.4 12.7 1.11997 30.9 28.7 2.2 15.5 16.1 3.3 15.2 1.2 0.1 5.6 7.1 12.3 0.71997 Q1 33.4 29.4 1.5 . . 0.6 . -8.1 -1.0 . -3.3 . -0.9
Q2 31.2 26.6 2.3 . . 2.6 . -1.9 1.4 . 10.7 . 0.7Q3 30.2 30.0 2.2 . . 3.0 . 3.1 0.4 . -0.3 . 1.5Q4 29.0 29.3 2.6 . . 6.6 . 10.7 -0.3 . 19.8 . 1.5
1998 Q1 33.2 27.9 2.4 . . 0.6 . -15.3 -2.6 . -5.4 . -2.3Q2 . 24.1 . . . -0.6 . 1.3 2.2 . 12.2 . 0.0Q3 . 26.7 . . . 3.7 . -2.2 0.5 . -2.6 . 0.5
Net lending of non-financial corporations(as a percentage of GDP)
Net lending of households 1)
(as a percentage of GDP)
United States Euro areaJapan
-12
-10
-8
-6
-4
-2
0
2
4
-2
0
2
4
6
8
10
12
14
1990 1991 1992 1993 1994 1995 1996 1997 1990 1991 1992 1993 1994 1995 1996 1997

ECB Month l y Bu l l e t i n • January 199932*

ECB Month l y Bu l l e t i n • January 1999 33*
The basis for the statistics compiled and published bythe European Central Bank (ECB) was laid down in thedocument entitled the “Statistical requirements for StageThree of Monetary Union (Implementation Package)”which was made available to banking associations andothers involved in statistical preparations for StageThree by the European Monetary Institute (EMI) andthe national central banks (NCBs) in July 1996. TheImplementation Package covers money and bankingstatistics, balance of payments statistics, internationalinvestment position statistics, financial accountsstatistics, price and cost and other economic statistics.1)
The focus of these statistics is the euro area as a whole.More detailed and longer runs of data, with furtherexplanatory notes, are to be published on the ECB’sWeb site (http://www.ecb.int), and new or expandeddata will appear in the ECB Monthly Bulletin as theybecome available.
Because the composition of the ECU does not coincidewith the currencies of the Member States adopting thesingle currency, amounts expressed in ECU areinfluenced by the market behaviour of the othercurrencies. To avoid this effect in the monetary statistics,the pre-1999 data in Tables 2.1 to 2.4 are expressed inunits converted from national currencies at theirrevocable fixed exchange rates announced on31 December 1998. Unless indicated otherwise, priceand cost statistics before 1999 are based on the dataexpressed in national currency terms.
Methods of aggregation and/or consolidation(including cross-country consolidation) have beenused as appropriate.
The cut-off date for the statistics included in thisissue was 7 January 1999.
Monetary policy and financial statistics
Tables 1.1 to 1.4 show the consolidated financialstatement of the Eurosystem, data on Eurosystemoperations and statistics relating to minimum reserves(not available for this first issue). Monetary data relating
1) Money and banking statistics are the responsibility of the ECBat the European level; responsibility for balance of payments,international investment position and financial accountsstatistics is shared with the European Commission (Eurostat);price and cost and other economic statistics are theresponsibility of the European Commission (Eurostat).
to Monetary Financial Institutions (MFIs), includingthe Eurosystem, are shown in Tables 2.1 to 2.3.Table 2.4 sets out monetary aggregates drawn from theconsolidated MFI balance sheet. Fuller quarterly datarelating to the MFI balance sheet and monetary statisticsare planned for the March issue. A complete list ofMFIs is published on the ECB’s Web site. Details ofthe sector definitions are set out in the “Moneyand Banking Statistics Sector Manual – Guidancefor the statistical classification of customers” (EMI,April 1998). The “Money and Banking StatisticsCompilation Guide” (EMI, April 1998) explainsrecommended practices to be followed by the NCBs.From 1 January 1999 the statistical information iscollected and compiled on the basis of the ECBRegulation concerning the consolidated balance sheetof the Monetary Financial Institutions sector(ECB/1998/16).
Statistics on money market interest rates, long-termgovernment bond yields and stock market indices(Tables 2.5 to 2.7) are produced by the ECB fromwire services. For details concerning the statisticson retail bank interest rates (Table 2.8), see thefootnote at the bottom of the relevant page.
Statistics on securities market issues andredemptions (Table 3) are expected to be availablein spring 1999.
Prices and real economy indicators
The data presented in the ECB Monthly Bulletin are,with a few exceptions, produced by the EuropeanCommission (mainly Eurostat) and national statisticalauthorities. Euro area results are obtained byaggregating data for individual countries. As far aspossible, the data are harmonised and comparable.However, the availability of comparable data differsamong the statistics and is, as a general rule, better forthe more recent periods than for earlier data. Theseasonally adjusted data are produced by Eurostat ornational sources.
The Harmonised Index of Consumer Prices (HICP) forthe euro area (Table 4.1) is available from 1995onwards. It is based on national HICPs that follow thesame methods in all euro area countries. Theimplementation of the 1998 EU Council Regulation onshort-term statistics will enlarge the range of available
General notes

ECB Month l y Bu l l e t i n • January 199934*
euro area data, including timely and comparable datafor retail trade turnover, for which, at present, anestimate based on national data is used (Table 5.1).
With regard to statistics on national accounts (Tables4.2 and 5.1), the implementation of the EuropeanSystem of National and Regional Accounts 1995(ESA 95) during 1999 and thereafter will pave the wayfor fully comparable data, including quarterly summaryaccounts, across the euro area.
Unemployment rates conform to International LabourOrganisation (ILO) guidelines. Data on employmentare derived from the most recent national sources usingsimilar, but not fully comparable definitions ofemployment (Table 5.2).
Opinion survey data (Chart 5.3) draw on the businessand consumer surveys of the European Commission.
Financial accounts statistics
The Implementation Package foresaw a need fordetailed information covering the financial transactionsand balance sheets for the euro area in order tocomplement monetary analysis and policy research. Theaim is to provide a fairly full, though not complete, setof financial accounts for the euro area based on moneyand banking, balance of payments, capital market,non-MFI financial corporation and government financestatistics, and drawing also on the ESA 95 nationalaccounts. Table 6 shows euro area aggregates based onnational capital and financial accounts.
A more detailed and further harmonised set of statisticspresenting financial accounts for the euro area isexpected to appear in the ECB Monthly Bulletin duringthe course of 1999.
General government fiscal position
Table 7.1 shows the euro area general government fiscalposition as a percentage of GDP. This is compatible withthe data notified by the Member States in the frameworkof the Excessive Deficit Procedure as laid down inthe Treaty establishing the European Community. Inaddition, government deficit and debt data are shown forindividual euro area countries due to their importance inthe framework of the Stability and Growth Pact.
Euro area receipts and expenditure, and the cyclicallyadjusted deficit, are compiled on the basis of countrydata provided by the European Commission (DG II).The aggregation is carried out by the ECB. While thedata on the deficit/surplus are harmonised, data onreceipts and expenditure are not. The breakdown ofdebt is compiled from data provided by NCBs.
Balance of payments, trade and exchangerate statistics
Balance of payments data for the euro area will bepublished for the first time in the April issue, andinternational investment position statistics in theautumn, conforming to the 5th edition of the IMF Balanceof Payments Manual (October 1993) and the ECBGuideline of 1 December 1998 on the statisticalreporting requirements of the European Central Bank(ECB/1998/17). Meanwhile, Tables 9.1 to 9.3 presentdata on euro area trade in goods only.
From January 1999 onwards, statistics on exchangerates (Table 10) will be produced on the basis of thedaily reference rates published by the ECB.
Other statistics
Statistics on other EU Member States (Table 11) followthe same principles as those for data relating to theeuro area. Data for the United States and Japan(Tables/Charts 12.1 and 12.2) are obtained fromnational sources. Saving, investment and financing datafor the United States and Japan (Table/Chart 12.2) arestructured in the same way as the capital and financialflows data shown for the euro area in Table/Chart 6.
Conventions used in the tables
“-” not applicable“.” not available“…” nil or negligible“billion” 109
(p) provisionals.a. seasonally adjusted

ECB Month l y Bu l l e t i n • January 1999 35*
Abbreviations
Countries
BE BelgiumDK DenmarkDE GermanyGR GreeceES SpainFR FranceIE IrelandIT ItalyLU LuxembourgNL NetherlandsAT AustriaPT PortugalFI FinlandSE SwedenUK United KingdomJP JapanUS United States
Others
ACEA/A.A.A. European Automobile Manufacturers’ AssociationBIS Bank for International SettlementsBPM4 IMF Balance of Payments Manual (4th edition)BPM5 IMF Balance of Payments Manual (5th edition)CDs Certificates of depositC.i.f. Cost, insurance and freight at the importer’s borderCPI Consumer Price IndexECB European Central BankECU European Currency UnitEMI European Monetary InstituteESA 95 European System of National and Regional Accounts 1995ESCB European System of Central BanksEU European UnionEUR EuroF.o.b. Free on board at the exporter’s borderGDP Gross domestic productHICP Harmonised Index of Consumer PricesILO International Labour OrganisationIMF International Monetary FundMFIs Monetary Financial InstitutionsNCBs National central banksRepos Repurchase agreementsSITC Rev. 3 Standard International Trade Classification (revision 3)
In accordance with Community practice, the EU countries are listed in this report using thealphabetical order of the country names in the national languages.

ECB Month l y Bu l l e t i n • January 199936*

ECB Month l y Bu l l e t i n • January 1999 37*
Chronology of monetary policymeasures of the Eurosystem
The monetary policy measures recorded below for the period up to 1 January 1999 refer to decisionsinvolving the Governing Council of the ECB with regard to the preparation of the monetary policy frameworkof the Eurosystem (comprising the ECB and the national central banks of the 11 Member States that haveadopted the euro as from the start of Stage Three).
1 June 1998
Establishment of the European Central Bank(ECB) and the European System of CentralBanks (ESCB).
7 July 1998
The Governing Council of the ECB adopts aRecommendation for a Council Regulation (EC)concerning the application of minimum reservesby the European Central Bank in Stage Three ofEconomic and Monetary Union. The mainprovisions of the recommended CouncilRegulation define the basis for the minimumamount of reserves which the ECB may requirecredit institutions to hold on their accountswith the national central banks. In addition, theyprovide the ECB with specific regulatory powersand specify the sanctions to be imposed in theevent of non-compliance. This ECBRecommendation was published in the OfficialJournal of the European CommunitiesNo. C 246 of 6 August 1998, page 6 ff.
The Governing Council further agrees on someof the key features of the minimum reservesystem to be applied as from the start of StageThree: the minimum reserve holdings aredefined to be within a range of 1.5-2.5% of therelevant liability base (after deducting a lump-sum allowance); interbank liabilities and liabilitiesvis-à-vis the Eurosystem will not be subject toreserve requirements; holdings of requiredreserves will be remunerated at the average,over the maintenance period, of the interestrate (weighted according to the number ofcalendar days) corresponding to that of theEurosystem’s main refinancing operations.
1 September 1998
The ECB and the national central banks of theMember States outside the euro area (Denmark,Greece, Sweden and the United Kingdom) agreeto lay down the operating procedures for anexchange rate mechanism in Stage Three ofEconomic and Monetary Union (the ERM IIAgreement). The ERM II Agreement specifiesthe procedure of intervention on the basis ofthe EU Council Resolution of 16 June 1997setting up an exchange rate mechanism as from1 January 1999. The ERM II Agreement waspublished in the Official Journal of the EuropeanCommunities No. C 345 of 13 November 1998,page 6.
11 September 1998
The Governing Council of the ECB endorsesthe Report entitled “The single monetary policyin Stage Three: General documentation on ESCBmonetary policy instruments and procedures”.The Report contains a detailed descriptionof the monetary policy instruments andprocedures to be applied by the ESCB(Eurosystem) in Stage Three of Economic andMonetary Union. The Report was published on18 September 1998.
26 September 1998
The ministers of the euro area Member States,the ECB and the ministers and central bankgovernors of Denmark and Greece, in acommon procedure involving the EuropeanCommission and after consultation of theMonetary Committee, welcome the decision ofthe governments of Denmark and Greece toextend their participation in the exchange ratemechanism from ERM I to ERM II, linking theircurrencies to the euro. They agree that theDanish krone will participate in ERM II with a

ECB Month l y Bu l l e t i n • January 199938*
fluctuation band around its central rate againstthe euro of ±2.25% and that the Greek drachmawill participate in ERM II with the standardfluctuation band around its central rate againstthe euro of ±15%. These agreements becameeffective from the opening of foreign exchangemarkets on 4 January 1999 (see also the ERM IIAgreement of 1 September 1998).
13 October 1998
The Governing Council of the ECB announcesthe main features of the stability-orientedmonetary policy strategy that the Eurosystemwill pursue in Stage Three of Economic andMonetary Union: the primary objective of pricestability shall be defined as a year-on-yearincrease in the Harmonised Index of ConsumerPrices (HICP) for the euro area of below 2%and is to be maintained over the medium term;a prominent role shall be assigned to money,with a reference value for the growth of abroad monetary aggregate; in parallel, a broadlybased assessment of the outlook for pricedevelopments shall play a major role in themonetary policy strategy.
Further to its decision on 7 July 1998, theGoverning Council announces the applicationof a minimum reserve ratio of 2% to a creditinstitution’s liability base of overnight deposits,deposits with an agreed maturity of up to twoyears, deposits redeemable at notice up to twoyears, debt securities issued with an agreedmaturity of up to two years and money marketpaper. A reserve ratio of 0% will apply torepurchase agreements, deposits with an agreedmaturity of more than two years and debtsecurities issued with an agreed maturity ofmore than two years. The lump-sum allowanceto be deducted from the reserve requirementof each institution is set at €100,000. If a creditinstitution cannot provide evidence of itsinterbank liabilities in the form of debt securitieswith a maturity of up to two years and moneymarket paper, it will be allowed to deduct astandardised 10% of these liabilities from itsliability base.
3 November 1998
The Governing Council of the ECB adopts twoGuidelines: one specifying general principles tobe followed by the national central banks whencarrying out operations in their domestic assetsand liabilities outside the scope of the singlemonetary policy; and one establishing thethresholds above which national central banksmust obtain the ECB’s approval for operationsin their remaining foreign reserve assets,including gold. In addition, the GoverningCouncil adopts a Guideline according to whichthe participating Member States will have togive advance notice to the ECB of anytransactions with their foreign exchangeworking balances which exceed a certainamount. These legal acts are based on provisionsof the Statute of the ESCB and are aimed atensuring the singleness of monetary policy andthe consistency of such transactions with theCommunity’s monetary and exchange ratepolicies.
1 December 1998
The Governing Council of the ECB agrees onthe remaining issues regarding the monetarypolicy strategy of the Eurosystem. The firstreference value for monetary growth is set at4½% and refers to the broad monetaryaggregate M3. The derivation of the referencevalue is based on the contributions to monetarygrowth resulting from assumptions made forprices (year-on-year increases in the HICP ofbelow 2%), the medium-term trend in real GDPgrowth (of 2-2½% per annum) and the medium-term trend decline in the velocity of circulationof M3 (in the approximate range of ½-1% eachyear). Monetary developments against thisreference value will be monitored on the basisof three-month moving averages of the monthly12-month growth rates for M3. In December1999 the Governing Council will review thereference value for monetary growth (see alsothe announcement of the Governing Councilon 13 October 1998).

ECB Month l y Bu l l e t i n • January 1999 39*
Further to its decisions on 7 July and13 October 1998, the Governing Council adoptsa Regulation on the application of minimumreserves. This ECB Regulation follows theCouncil Regulation (EC) No. 2531/98 of23 November 1998 concerning the applicationof minimum reserves by the European CentralBank and establishes minimum reserverequirements for credit institutions in the euroarea in the pursuance of monetary policyobjectives. The ECB Regulation entered intoforce on 1 January 1999 and was published inthe Official Journal of the EuropeanCommunities No. L 356 of 30 December 1998,page 1.
22 December 1998
The Governing Council of the ECB decides thatthe first main refinancing operation of theEurosystem will be a fixed rate tender offeredat an interest rate of 3%. This operation will beinitiated on 4 January 1999, while the allotmentdecision will be taken on 5 January 1999 andsettlement will take place on 7 January 1999. Inaddition, the first longer-term refinancingoperation will be announced on 12 January 1999(with a settlement date of 14 January 1999) andwill be conducted through a variable rate tenderusing the single rate allotment procedure.
The Governing Council furthermore decidesthat the interest rate for the marginal lendingfacility will be set at a level of 4.5% and theinterest rate for the deposit facility at a level of2% for the start of Stage Three, i.e. 1 January1999. As a transitional measure, between 4 and21 January 1999, the interest rate for themarginal lending facility will be set at a level of3.25% and the interest rate for the depositfacility at a level of 2.75%. The GoverningCouncil intends to terminate this transitionalmeasure following its meeting on 21 January1999.
31 December 1998
In accordance with Article 109l (4) of theTreaty establishing the European Community,the EU Council, acting with the unanimityof the Member States of the EuropeanCommunity without a derogation, upon aproposal from the European Commission andafter consultation of the ECB, adopts theirrevocable conversion rates for the euro, witheffect from 1 January 1999, 0.00 a.m. (localtime).
The ministers of the euro area Member States,the ECB and the ministers and central bankgovernors of Denmark and Greece decide, in acommon procedure involving the EuropeanCommission and after consultation of theMonetary Committee, to fix the central ratesagainst the euro for the currencies participatingin the exchange rate mechanism which comesinto operation on 1 January 1999. Further tothis decision on the euro central rates, theECB, Danmarks Nationalbank and the Bank ofGreece establish by common accord thecompulsory intervention rates for the Danishkrone and the Greek drachma. A fluctuationband of ±2.25% will be observed around theeuro central rate for the Danish krone. Thestandard fluctuation band of ±15% will beobserved around the euro central rate for theGreek drachma (see also the ERM II Agreementof 1 September 1998 and the agreement of26 September 1998).
7 January 1999
The Governing Council of the ECB decides thatfor the two main refinancing operations to beannounced on 11 and 18 January 1999respectively the same conditions will apply asfor the first such operation, which was settledon 7 January 1999, i.e. they will be fixed ratetenders conducted at an interest rate of 3%.The Governing Council confirmed its intentionto maintain the main refinancing rate at thislevel for the foreseeable future.
ECB Month l y Bu l l e t i n • January 199940*
Documents published by theEuropean Central Bank (ECB)
This list is designed to inform readers about selected documents published by the EuropeanCentral Bank. The publications are available to interested parties free of charge from thePress Division. Please submit orders in writing to the postal address given on the back of thetitle page.
For a complete list of documents published by the European Monetary Institute, please visitour Web site (http://www.ecb.int).
Monthly BulletinArticles published from January 1999 onwards:“The euro area at the start of Stage Three”, January 1999.“The stability-oriented monetary policy strategy of the Eurosystem”, January 1999.
Monetary policy“The single monetary policy in Stage Three: General documentation on ESCB monetarypolicy instruments and procedures”, September 1998.
“Report on electronic money”, August 1998.
Payment systemsTARGET brochure, July 1998.“The TARGET service level”, July 1998.
“Assessment of EU securities settlement systems against the standards for their use in ESCBcredit operations”, September 1998.
