monthly newbuilding market report
TRANSCRIPT

Monthly Newbuilding Market Report Issue: May 2021
Overview of Ordering Activity (per vessel type / Top Ranking of Contractors) page 1
Ordering Activity (No. of Units ordered, Dwt, Invested Capital) page 2
Overall - Greek Presence - Chinese Presence
Newbuilding Trends (Ordering Activity per Vessel Size for main segments) page 3 - 4
Overall – Greek Presence
Overview of Ordering Activity (Top Shipbuilding Countries) page 5 -6
Ordering Activity (No. of Units ordered, Dwt, Cbm, Teu)
China – Japan-Korea page 7
Newbuilding Trends (Ordering Activity per Vessel Size for main segments) page 8 -10
GOLDEN DESTINY RESEARCH & VALUATIONS
All the information contained in this report is given in good faith, but
without any guarantee from our part, and is based on our S&P Market
Reports and Insight Market Information provided and/or collected
from various sources. This report is presented for the sole and
exclusive information of its recipients and whilst every care has been
taken in the preparation of this report, no representation or
warranty, express or implied, is made by Golden Destiny S.A. in
respect of the accuracy, completeness or correctness of the
information contained herein. Neither our company nor its directors
or employees assumes or accepts any liability whatsoever for any
loss or damage incurred by any person whatsoever in relation to
and/or as a result of the use of and/or due to any person’s reliance
on the information contained in this report. Furthermore, no
responsibility is accepted in respect of any errors or inaccuracies
which may be contained in this report.
GOLDEN DESTINY established since 1994 SALE& PURCHASE-MARINE INSURANCE-SHIP VALUATIONS-MARKET RESEARCH
Website: www.goldendestiny.com Research & Valuations: [email protected] Sale & Purchase: [email protected] Marine Insurance: goldendestiny @nereusmarine.gr GOLDEN DESTINY PIRAEUS: 57 AKTI MIAOULI 18536 TEL: +30 210 4295000 FAX: +30 210 4292346
GOLDEN DESTINY RESEARCH SERVICES
WEEKLY PUBLICATIONS: Weekly S&P Market Report
MONTHLY PUBLICATIONS:
Monthly S&P Market Report Monthly Newbuilding Market Report
ANNUAL PUBLICATIONS: Annual S&P Statistics for the pace of shipping investments
SPECIAL EDITIONS:
Weekly S&P Market Trends Other Reports / Analysis concerning the outlook of Secondhand / Demolition / Newbuilding Transactions

GOLDEN DESTINY established in 1994 SALE& PURCHASE-MARINE INSURANCE-SHIP VALUATIONS-MARKET RESEARCH May 2021
Page 1 MONTHLY NEWBUILDING MARKET REPORT
NEWBUILDING MARKET Overview of Ordering Activity Per Vessel Type for Main Segments Top Ranking of Contractors
May-21 Previous Month m-o-m May-20 y-o-y
38% 310%
Greek Presence: 31% 183%
Chinese Presence: 33% 208%
No. of Vessels Ordered 164 119 40
40 30 13
17 13 6
Total New orders 164
Average Dwt Ordered: 89,840
Total Invested Capital: 10,700,000,000 23
Greek Presence:
Total New orders 17 10.37% share to the total Ordering Activity
Average Dwt Ordered: 65,212
Total Invested Capital: 1,071,400,000 5 NB deals reported at an undisclosed Contract Price
Chinese Presence:
Total New orders 40 24% share to the total Ordering Activity
Average Dwt Ordered: 106,030
Total Invested Capital: 2,369,300,000 4 NB deals reported at an undisclosed Contract Price
Per Vessel Type
Bulk Carriers
Average Dwt Ordered: 135,550 26% m-o-m 127% y-o-y
Total Invested Capital: 1,148,200,000 9 NB deals reported at an undisclosed Contract Price
Tankers
Average Dwt Ordered: 45,700 -33% m-o-m 25% y-o-y
Total Invested Capital: 568,300,000 6 NB deals reported at an undisclosed Contract Price
LNG Tankers
Average Cbm Ordered: 162,371 83% m-o-m 267% y-o-y
Total Invested Capital: 1,196,500,000 4 NB deals reported at an undisclosed Contract Price
LPG Tankers
Average Cbm Ordered: 67,111 -7% m-o-m - y-o-y
Total Invested Capital: 710,000,000 4 NB deals reported at an undisclosed Contract Price
Containers
Average TEU Ordered: 8,889 107% m-o-m 2025% y-o-y
Total Invested Capital: 7,077,000,000 0 NB deals reported at an undisclosed Contract Price
% change volume of activity
NB deals reported at an undisclosed Contract Price
GOLDEN DESTINY established in 1994 SALE& PURCHASE-MARINE INSURANCE-SHIP VALUATIONS-MARKET RESEARCH May 2021
Page 2 MONTHLY NEWBUILDING MARKET REPORT
NEWBUILDING MARKET
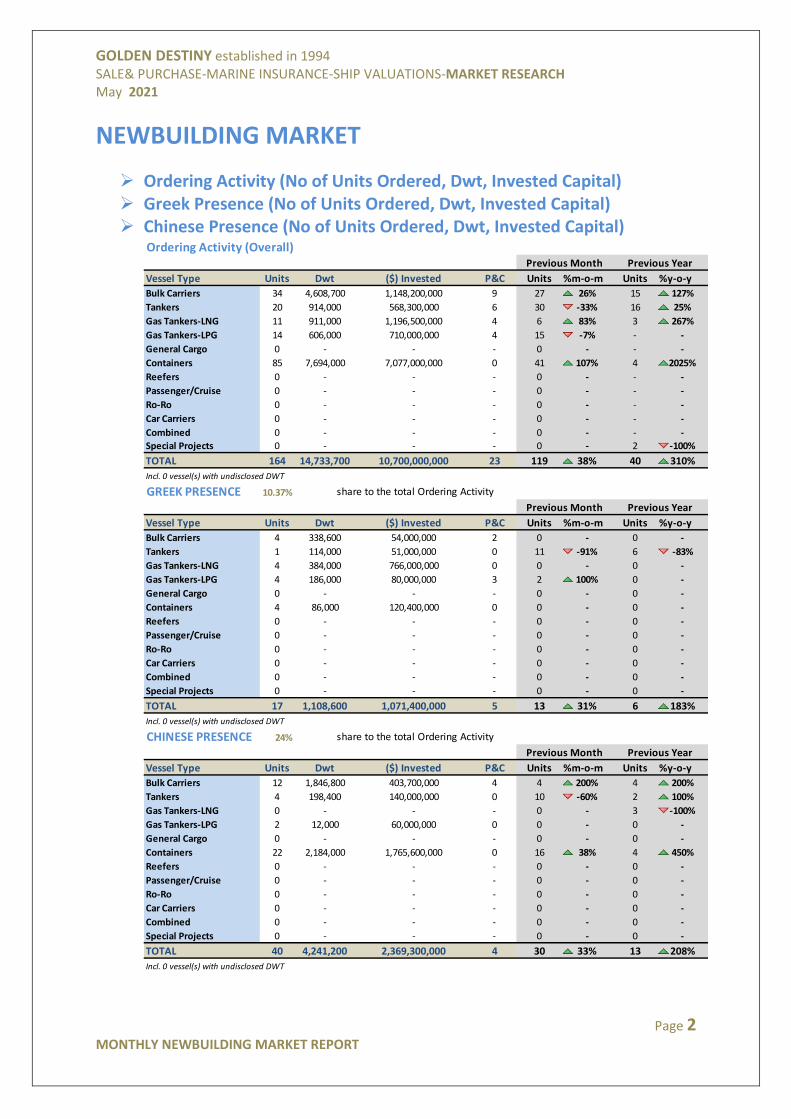
Ordering Activity (No of Units Ordered, Dwt, Invested Capital) Greek Presence (No of Units Ordered, Dwt, Invested Capital) Chinese Presence (No of Units Ordered, Dwt, Invested Capital)
Ordering Activity (Overall)
Vessel Type Units Dwt ($) Invested P&C Units %m-o-m Units %y-o-y
Bulk Carriers 34 4,608,700 1,148,200,000 9 27 26% 15 127%
Tankers 20 914,000 568,300,000 6 30 -33% 16 25%
Gas Tankers-LNG 11 911,000 1,196,500,000 4 6 83% 3 267%
Gas Tankers-LPG 14 606,000 710,000,000 4 15 -7% - -
General Cargo 0 - - - 0 - - -
Containers 85 7,694,000 7,077,000,000 0 41 107% 4 2025%
Reefers 0 - - - 0 - - -
Passenger/Cruise 0 - - - 0 - - -
Ro-Ro 0 - - - 0 - - -
Car Carriers 0 - - - 0 - - -
Combined 0 - - - 0 - - -
Special Projects 0 - - - 0 - 2 -100%
TOTAL 164 14,733,700 10,700,000,000 23 119 38% 40 310%
Incl. 0 vessel(s) with undisclosed DWT
GREEK PRESENCE 10.37% share to the total Ordering Activity
Vessel Type Units Dwt ($) Invested P&C Units %m-o-m Units %y-o-y
Bulk Carriers 4 338,600 54,000,000 2 0 - 0 -
Tankers 1 114,000 51,000,000 0 11 -91% 6 -83%
Gas Tankers-LNG 4 384,000 766,000,000 0 0 - 0 -
Gas Tankers-LPG 4 186,000 80,000,000 3 2 100% 0 -
General Cargo 0 - - - 0 - 0 -
Containers 4 86,000 120,400,000 0 0 - 0 -
Reefers 0 - - - 0 - 0 -
Passenger/Cruise 0 - - - 0 - 0 -
Ro-Ro 0 - - - 0 - 0 -
Car Carriers 0 - - - 0 - 0 -
Combined 0 - - - 0 - 0 -
Special Projects 0 - - - 0 - 0 -
TOTAL 17 1,108,600 1,071,400,000 5 13 31% 6 183%
Incl. 0 vessel(s) with undisclosed DWT
CHINESE PRESENCE 24% share to the total Ordering Activity
Vessel Type Units Dwt ($) Invested P&C Units %m-o-m Units %y-o-y
Bulk Carriers 12 1,846,800 403,700,000 4 4 200% 4 200%
Tankers 4 198,400 140,000,000 0 10 -60% 2 100%
Gas Tankers-LNG 0 - - - 0 - 3 -100%
Gas Tankers-LPG 2 12,000 60,000,000 0 0 - 0 -
General Cargo 0 - - - 0 - 0 -
Containers 22 2,184,000 1,765,600,000 0 16 38% 4 450%
Reefers 0 - - - 0 - 0 -
Passenger/Cruise 0 - - - 0 - 0 -
Ro-Ro 0 - - - 0 - 0 -
Car Carriers 0 - - - 0 - 0 -
Combined 0 - - - 0 - 0 -
Special Projects 0 - - - 0 - 0 -
TOTAL 40 4,241,200 2,369,300,000 4 30 33% 13 208%
Incl. 0 vessel(s) with undisclosed DWT
Previous Month Previous Year
Previous Month Previous Year
Previous Month Previous Year
GOLDEN DESTINY established in 1994 SALE& PURCHASE-MARINE INSURANCE-SHIP VALUATIONS-MARKET RESEARCH May 2021
Page 3 MONTHLY NEWBUILDING MARKET REPORT
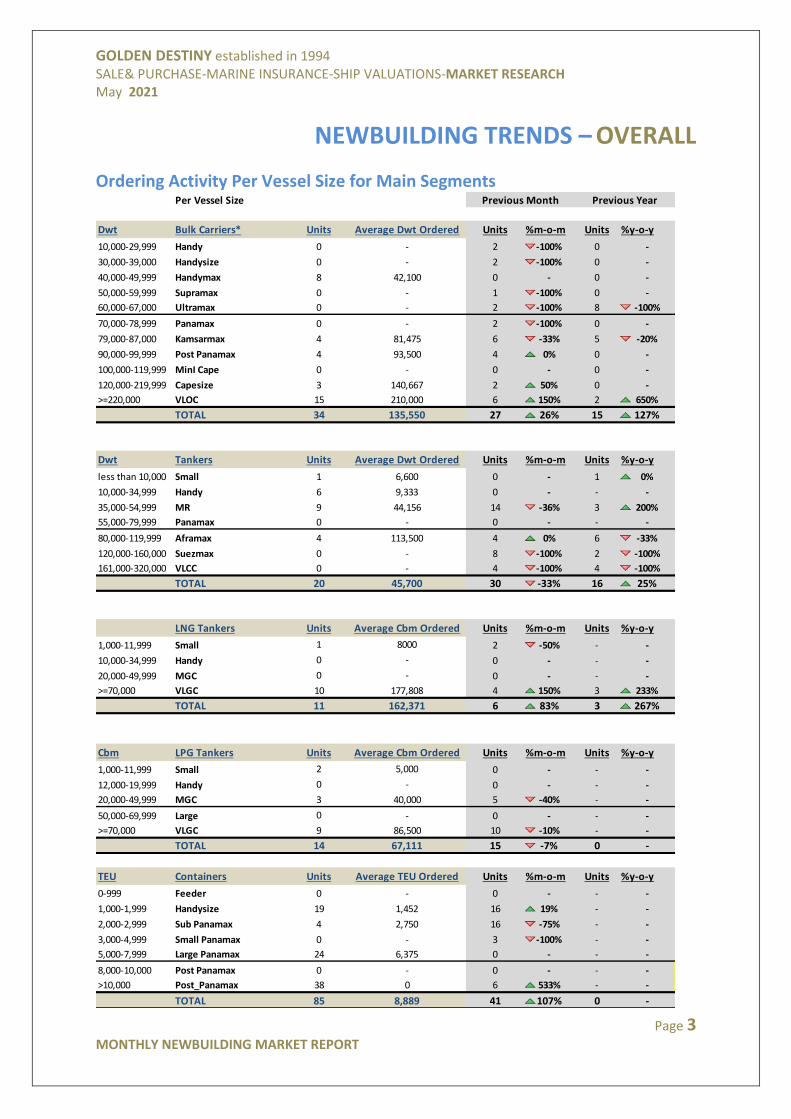
NEWBUILDING TRENDS – OVERALL
Ordering Activity Per Vessel Size for Main SegmentsPer Vessel Size
Dwt Bulk Carriers* Units Average Dwt Ordered Units %m-o-m Units %y-o-y
10,000-29,999 Handy 0 - 2 -100% 0 -
30,000-39,000 Handysize 0 - 2 -100% 0 -
40,000-49,999 Handymax 8 42,100 0 - 0 -
50,000-59,999 Supramax 0 - 1 -100% 0 -
60,000-67,000 Ultramax 0 - 2 -100% 8 -100%
70,000-78,999 Panamax 0 - 2 -100% 0 -
79,000-87,000 Kamsarmax 4 81,475 6 -33% 5 -20%
90,000-99,999 Post Panamax 4 93,500 4 0% 0 -
100,000-119,999 MinI Cape 0 - 0 - 0 -
120,000-219,999 Capesize 3 140,667 2 50% 0 -
>=220,000 VLOC 15 210,000 6 150% 2 650%
TOTAL 34 135,550 27 26% 15 127%
Dwt Tankers Units Average Dwt Ordered Units %m-o-m Units %y-o-y
less than 10,000 Small 1 6,600 0 - 1 0%
10,000-34,999 Handy 6 9,333 0 - - -
35,000-54,999 MR 9 44,156 14 -36% 3 200%
55,000-79,999 Panamax 0 - 0 - - -
80,000-119,999 Aframax 4 113,500 4 0% 6 -33%
120,000-160,000 Suezmax 0 - 8 -100% 2 -100%
161,000-320,000 VLCC 0 - 4 -100% 4 -100%
TOTAL 20 45,700 30 -33% 16 25%
LNG Tankers Units Average Cbm Ordered Units %m-o-m Units %y-o-y
1,000-11,999 Small 1 8000 2 -50% - -
10,000-34,999 Handy 0 - 0 - - -
20,000-49,999 MGC 0 - 0 - - -
>=70,000 VLGC 10 177,808 4 150% 3 233%
TOTAL 11 162,371 6 83% 3 267%
Cbm LPG Tankers Units Average Cbm Ordered Units %m-o-m Units %y-o-y
1,000-11,999 Small 2 5,000 0 - - -
12,000-19,999 Handy 0 - 0 - - -
20,000-49,999 MGC 3 40,000 5 -40% - -
50,000-69,999 Large 0 - 0 - - -
>=70,000 VLGC 9 86,500 10 -10% - -
TOTAL 14 67,111 15 -7% 0 -
TEU Containers Units Average TEU Ordered Units %m-o-m Units %y-o-y
0-999 Feeder 0 - 0 - - -
1,000-1,999 Handysize 19 1,452 16 19% - -
2,000-2,999 Sub Panamax 4 2,750 16 -75% - -
3,000-4,999 Small Panamax 0 - 3 -100% - -
5,000-7,999 Large Panamax 24 6,375 0 - - -
8,000-10,000 Post Panamax 0 - 0 - - -
>10,000 Post_Panamax 38 0 6 533% - -
TOTAL 85 8,889 41 107% 0 -
Previous YearPrevious Month
GOLDEN DESTINY established in 1994 SALE& PURCHASE-MARINE INSURANCE-SHIP VALUATIONS-MARKET RESEARCH May 2021
Page 4 MONTHLY NEWBUILDING MARKET REPORT
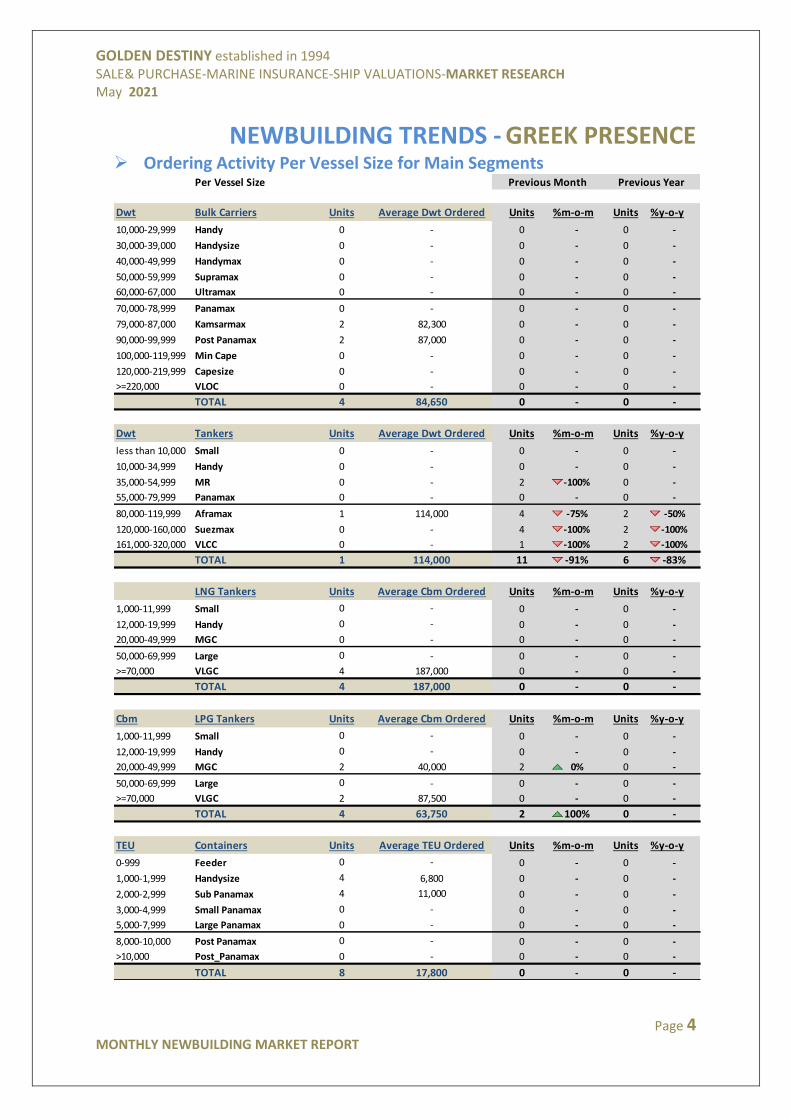
NEWBUILDING TRENDS - GREEK PRESENCE Ordering Activity Per Vessel Size for Main Segments
Per Vessel Size
Dwt Bulk Carriers Units Average Dwt Ordered Units %m-o-m Units %y-o-y
10,000-29,999 Handy 0 - 0 - 0 -
30,000-39,000 Handysize 0 - 0 - 0 -
40,000-49,999 Handymax 0 - 0 - 0 -
50,000-59,999 Supramax 0 - 0 - 0 -
60,000-67,000 Ultramax 0 - 0 - 0 -
70,000-78,999 Panamax 0 - 0 - 0 -
79,000-87,000 Kamsarmax 2 82,300 0 - 0 -
90,000-99,999 Post Panamax 2 87,000 0 - 0 -
100,000-119,999 Min Cape 0 - 0 - 0 -
120,000-219,999 Capesize 0 - 0 - 0 -
>=220,000 VLOC 0 - 0 - 0 -
Grand Total TOTAL 4 84,650 0 - 0 -
Dwt Tankers Units Average Dwt Ordered Units %m-o-m Units %y-o-y
less than 10,000 Small 0 - 0 - 0 -
10,000-34,999 Handy 0 - 0 - 0 -
35,000-54,999 MR 0 - 2 -100% 0 -
55,000-79,999 Panamax 0 - 0 - 0 -
80,000-119,999 Aframax 1 114,000 4 -75% 2 -50%
120,000-160,000 Suezmax 0 - 4 -100% 2 -100%
161,000-320,000 VLCC 0 - 1 -100% 2 -100%
Grand Total TOTAL 1 114,000 11 -91% 6 -83%
LNG Tankers Units Average Cbm Ordered Units %m-o-m Units %y-o-y
1,000-11,999 Small 0 - 0 - 0 -
12,000-19,999 Handy 0 - 0 - 0 -
20,000-49,999 MGC 0 - 0 - 0 -
50,000-69,999 Large 0 - 0 - 0 -
>=70,000 VLGC 4 187,000 0 - 0 -
Grand Total TOTAL 4 187,000 0 - 0 -
Cbm LPG Tankers Units Average Cbm Ordered Units %m-o-m Units %y-o-y
1,000-11,999 Small 0 - 0 - 0 -
12,000-19,999 Handy 0 - 0 - 0 -
20,000-49,999 MGC 2 40,000 2 0% 0 -
50,000-69,999 Large 0 - 0 - 0 -
>=70,000 VLGC 2 87,500 0 - 0 -
Grand Total TOTAL 4 63,750 2 100% 0 -
TEU Containers Units Average TEU Ordered Units %m-o-m Units %y-o-y
0-999 Feeder 0 - 0 - 0 -
1,000-1,999 Handysize 4 6,800 0 - 0 -
2,000-2,999 Sub Panamax 4 11,000 0 - 0 -
3,000-4,999 Small Panamax 0 - 0 - 0 -
5,000-7,999 Large Panamax 0 - 0 - 0 -
8,000-10,000 Post Panamax 0 - 0 - 0 -
>10,000 Post_Panamax 0 - 0 - 0 -
Grand Total TOTAL 8 17,800 0 - 0 -
Previous Month Previous Year
GOLDEN DESTINY established in 1994 SALE& PURCHASE-MARINE INSURANCE-SHIP VALUATIONS-MARKET RESEARCH May 2021
Page 5 MONTHLY NEWBUILDING MARKET REPORT
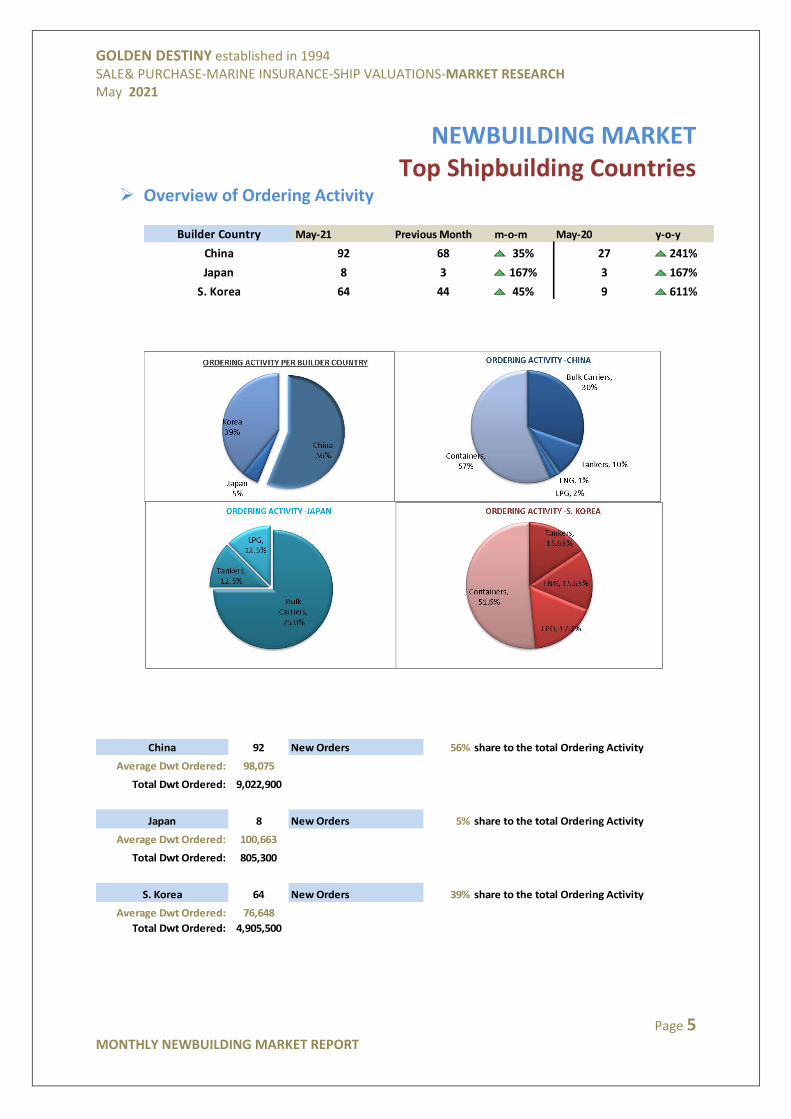
NEWBUILDING MARKET Top Shipbuilding Countries
Overview of Ordering Activity
May-21 Previous Month m-o-m May-20 y-o-y
35% 241%
167% 167%
45% 611%64S. Korea 944
Builder Country
92 68 27China
3Japan 8 3
China 92 New Orders 56%
Average Dwt Ordered: 98,075
Total Dwt Ordered: 9,022,900
Japan 8 New Orders 5%
Average Dwt Ordered: 100,663
Total Dwt Ordered: 805,300
S. Korea 64 New Orders 39%
Average Dwt Ordered: 76,648
Total Dwt Ordered: 4,905,500
share to the total Ordering Activity
share to the total Ordering Activity
share to the total Ordering Activity
GOLDEN DESTINY established in 1994 SALE& PURCHASE-MARINE INSURANCE-SHIP VALUATIONS-MARKET RESEARCH May 2021
Page 6 MONTHLY NEWBUILDING MARKET REPORT
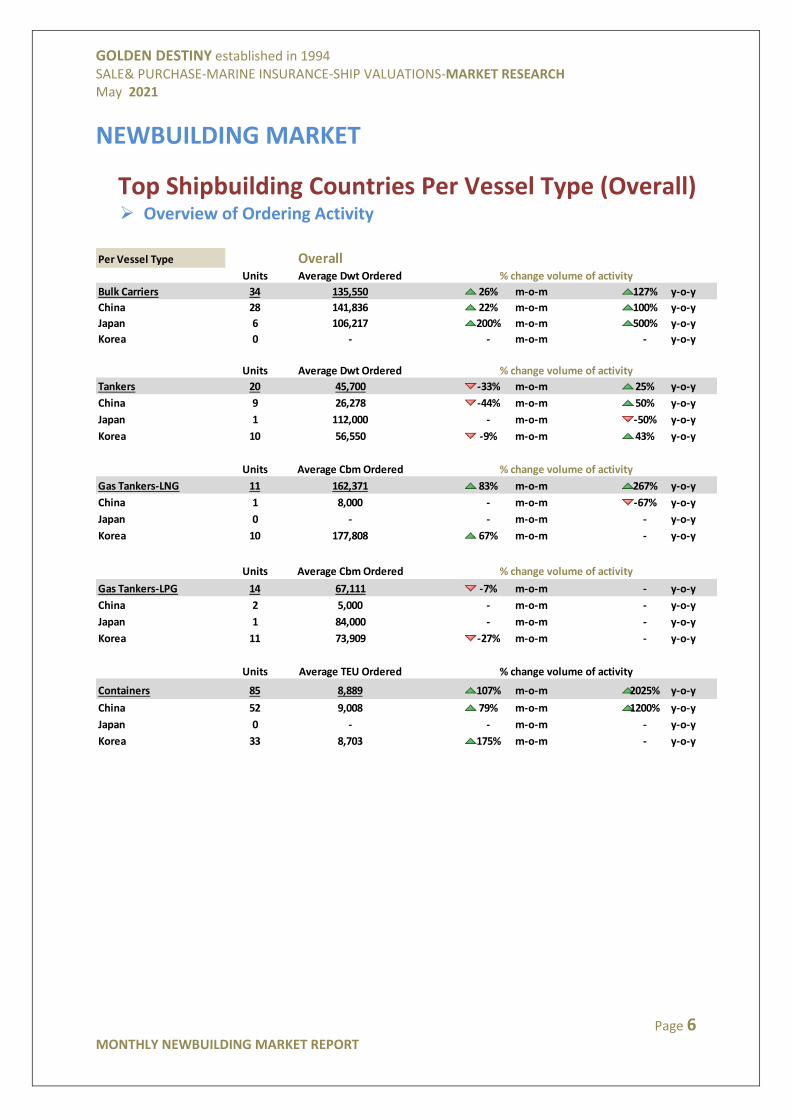
NEWBUILDING MARKET
Top Shipbuilding Countries Per Vessel Type (Overall) Overview of Ordering Activity
Per Vessel Type
Units Average Dwt Ordered
Bulk Carriers 34 135,550 26% m-o-m 127% y-o-y
China 28 141,836 22% m-o-m 100% y-o-y
Japan 6 106,217 200% m-o-m 500% y-o-y
Korea 0 - - m-o-m - y-o-y
Units Average Dwt Ordered
Tankers 20 45,700 -33% m-o-m 25% y-o-y
China 9 26,278 -44% m-o-m 50% y-o-y
Japan 1 112,000 - m-o-m -50% y-o-y
Korea 10 56,550 -9% m-o-m 43% y-o-y
Units Average Cbm Ordered
Gas Tankers-LNG 11 162,371 83% m-o-m 267% y-o-y
China 1 8,000 - m-o-m -67% y-o-y
Japan 0 - - m-o-m - y-o-y
Korea 10 177,808 67% m-o-m - y-o-y
Units Average Cbm Ordered
Gas Tankers-LPG 14 67,111 -7% m-o-m - y-o-y
China 2 5,000 - m-o-m - y-o-y
Japan 1 84,000 - m-o-m - y-o-y
Korea 11 73,909 -27% m-o-m - y-o-y
Units Average TEU Ordered
Containers 85 8,889 107% m-o-m 2025% y-o-y
China 52 9,008 79% m-o-m 1200% y-o-y
Japan 0 - - m-o-m - y-o-y
Korea 33 8,703 175% m-o-m - y-o-y
% change volume of activity
% change volume of activity
% change volume of activity
% change volume of activity
% change volume of activity
Overall
GOLDEN DESTINY established in 1994 SALE& PURCHASE-MARINE INSURANCE-SHIP VALUATIONS-MARKET RESEARCH May 2021
Page 7 MONTHLY NEWBUILDING MARKET REPORT
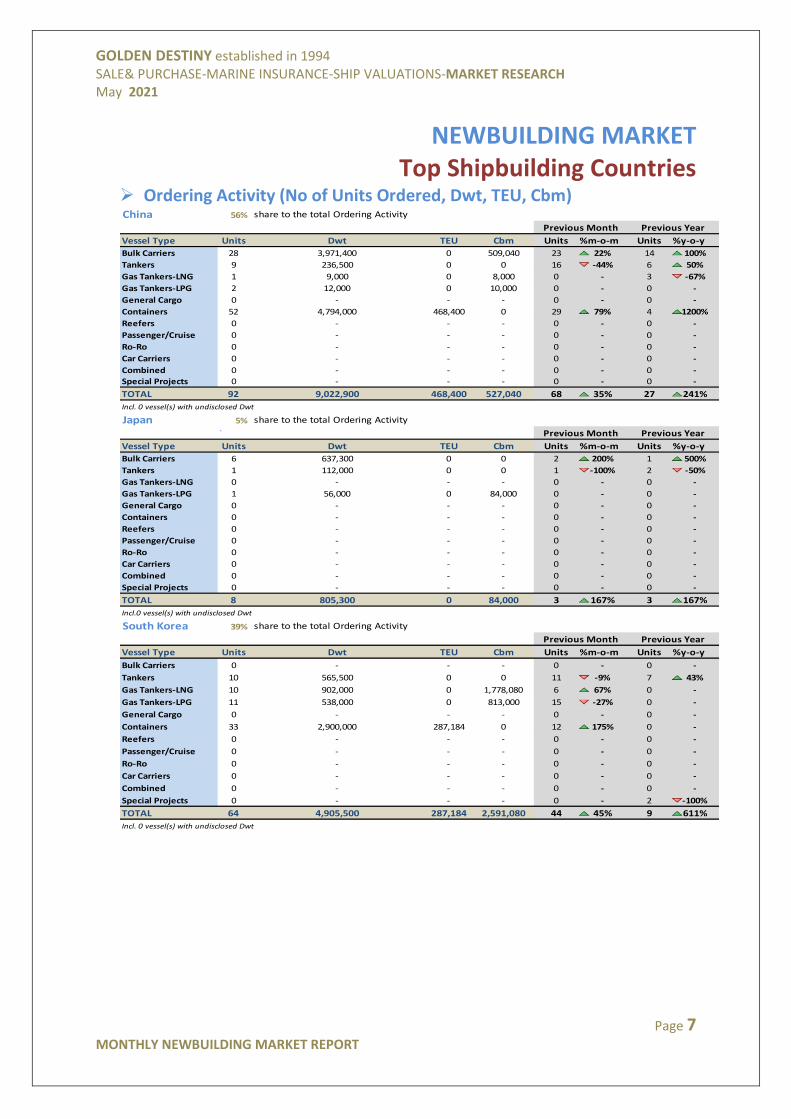
NEWBUILDING MARKET Top Shipbuilding Countries
Ordering Activity (No of Units Ordered, Dwt, TEU, Cbm)China 56% share to the total Ordering Activity
Vessel Type Units Dwt TEU Cbm Units %m-o-m Units %y-o-y
Bulk Carriers 28 3,971,400 0 509,040 23 22% 14 100%
Tankers 9 236,500 0 0 16 -44% 6 50%
Gas Tankers-LNG 1 9,000 0 8,000 0 - 3 -67%
Gas Tankers-LPG 2 12,000 0 10,000 0 - 0 -
General Cargo 0 - - - 0 - 0 -
Containers 52 4,794,000 468,400 0 29 79% 4 1200%
Reefers 0 - - - 0 - 0 -
Passenger/Cruise 0 - - - 0 - 0 -
Ro-Ro 0 - - - 0 - 0 -
Car Carriers 0 - - - 0 - 0 -
Combined 0 - - - 0 - 0 -
Special Projects 0 - - - 0 - 0 -
TOTAL 92 9,022,900 468,400 527,040 68 35% 27 241%
Incl. 0 vessel(s) with undisclosed Dwt
Japan 5% share to the total Ordering Activity
`
Vessel Type Units Dwt TEU Cbm Units %m-o-m Units %y-o-y
Bulk Carriers 6 637,300 0 0 2 200% 1 500%
Tankers 1 112,000 0 0 1 -100% 2 -50%
Gas Tankers-LNG 0 - - - 0 - 0 -
Gas Tankers-LPG 1 56,000 0 84,000 0 - 0 -
General Cargo 0 - - - 0 - 0 -
Containers 0 - - - 0 - 0 -
Reefers 0 - - - 0 - 0 -
Passenger/Cruise 0 - - - 0 - 0 -
Ro-Ro 0 - - - 0 - 0 -
Car Carriers 0 - - - 0 - 0 -
Combined 0 - - - 0 - 0 -
Special Projects 0 - - - 0 - 0 -
TOTAL 8 805,300 0 84,000 3 167% 3 167%
Incl.0 vessel(s) with undisclosed Dwt
South Korea 39% share to the total Ordering Activity
Vessel Type Units Dwt TEU Cbm Units %m-o-m Units %y-o-y
Bulk Carriers 0 - - - 0 - 0 -
Tankers 10 565,500 0 0 11 -9% 7 43%
Gas Tankers-LNG 10 902,000 0 1,778,080 6 67% 0 -
Gas Tankers-LPG 11 538,000 0 813,000 15 -27% 0 -
General Cargo 0 - - - 0 - 0 -
Containers 33 2,900,000 287,184 0 12 175% 0 -
Reefers 0 - - - 0 - 0 -
Passenger/Cruise 0 - - - 0 - 0 -
Ro-Ro 0 - - - 0 - 0 -
Car Carriers 0 - - - 0 - 0 -
Combined 0 - - - 0 - 0 -
Special Projects 0 - - - 0 - 2 -100%
TOTAL 64 4,905,500 287,184 2,591,080 44 45% 9 611%
Incl. 0 vessel(s) with undisclosed Dwt
Previous Month Previous Year
Previous Month Previous Year
Previous Month Previous Year
GOLDEN DESTINY established in 1994 SALE& PURCHASE-MARINE INSURANCE-SHIP VALUATIONS-MARKET RESEARCH May 2021
Page 8 MONTHLY NEWBUILDING MARKET REPORT
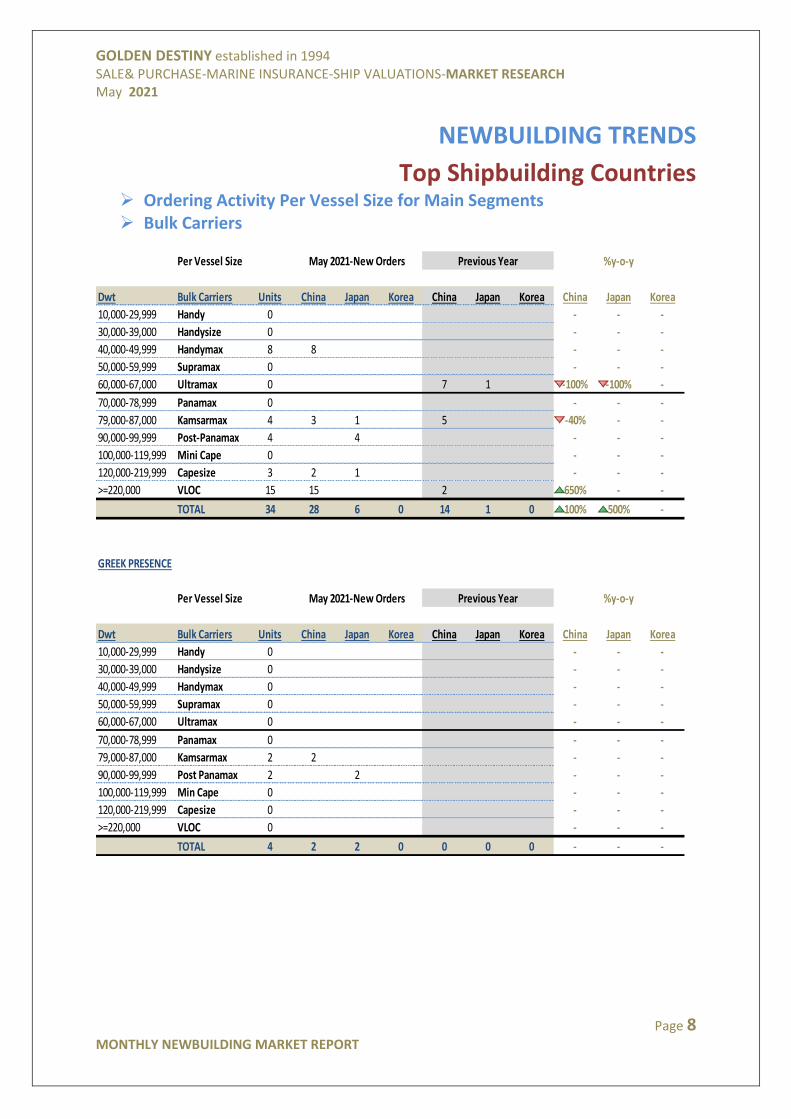
NEWBUILDING TRENDS
Top Shipbuilding Countries Ordering Activity Per Vessel Size for Main Segments Bulk Carriers
Per Vessel Size
Dwt Bulk Carriers Units China Japan Korea China Japan Korea China Japan Korea
10,000-29,999 Handy 0 - - -
30,000-39,000 Handysize 0 - - -
40,000-49,999 Handymax 8 8 - - -
50,000-59,999 Supramax 0 - - -
60,000-67,000 Ultramax 0 7 1 -100% -100% -
70,000-78,999 Panamax 0 - - -
79,000-87,000 Kamsarmax 4 3 1 5 -40% - -
90,000-99,999 Post-Panamax 4 4 - - -
100,000-119,999 Mini Cape 0 - - -
120,000-219,999 Capesize 3 2 1 - - -
>=220,000 VLOC 15 15 2 650% - -
TOTAL 34 28 6 0 14 1 0 100% 500% -
Per Vessel Size
Dwt Bulk Carriers Units China Japan Korea China Japan Korea China Japan Korea
10,000-29,999 Handy 0 - - -
30,000-39,000 Handysize 0 - - -
40,000-49,999 Handymax 0 - - -
50,000-59,999 Supramax 0 - - -
60,000-67,000 Ultramax 0 - - -
70,000-78,999 Panamax 0 - - -
79,000-87,000 Kamsarmax 2 2 - - -
90,000-99,999 Post Panamax 2 2 - - -
100,000-119,999 Min Cape 0 - - -
120,000-219,999 Capesize 0 - - -
>=220,000 VLOC 0 - - -
TOTAL 4 2 2 0 0 0 0 - - -
GREEK PRESENCE
May 2021-New Orders Previous Year %y-o-y
May 2021-New Orders Previous Year %y-o-y

GOLDEN DESTINY established in 1994 SALE& PURCHASE-MARINE INSURANCE-SHIP VALUATIONS-MARKET RESEARCH May 2021
Page 9 MONTHLY NEWBUILDING MARKET REPORT
NEWBUILDING TRENDS
Top Shipbuilding Countries Ordering Activity Per Vessel Size for Main Segments Tankers
Per Vessel Size
Dwt Tankers Units China Japan Korea China Japan Korea China Japan Korea
less than 10,000 Small 1 1 - - -
10,000-34,999 Handy 6 5 1 - - -
35,000-54,999 MR 9 4 5 2 1 - -100% 400%
55,000-79,999 Panamax 0 - - -
80,000-119,999 Aframax 4 1 3 4 2 -100% - 50%
120,000-160,000 Suezmax 0 2 - - -100%
161,000-320,000 VLCC 0 2 2 -100% - -100%
TOTAL 20 9 1 10 6 2 7 50% -50% 43%
Per Vessel Size
Dwt Tankers Units China Japan Korea China Japan Korea China Japan Korea
less than 10,000 Small 0 - - -
10,000-34,999 Handy 0 - - -
35,000-54,999 MR 0 - - -
55,000-79,999 Panamax 0 - - -
80,000-119,999 Aframax 1 1 2 - - -50%
120,000-160,000 Suezmax 0 2 - - -100%
161,000-320,000 VLCC 0 2 - - -100%
TOTAL 1 0 0 1 0 0 6 - - -83%
May 2021-New Orders Previous Year %y-o-y
GREEK PRESENCE
May 2021-New Orders Previous Year %y-o-y
LNG Tankers
Per Vessel Size
LNG Tankers Units China Japan Korea China Japan Korea China Japan Korea
1,000-11,999 Small 1 1 - - -
12,000-19,999 Handy 0 - - -
20,000-89,999 MGC 0 - - -
>=90,000 VLGC 10 10 3 -100% - -
TOTAL 11 1 0 10 3 0 0 -67% - -
Per Vessel Size
LNG Tankers Units China Japan Korea China Japan Korea China Japan Korea
1,000-11,999 Small 0 - - -
12,000-19,999 Handy 0 - - -
20,000-49,999 MGC 0 - - -
50,000-69,999 Large 0 - - -
>=70,000 VLGC 4 4
TOTAL 0 0 0 0 0 0 0 - - -
GREEK PRESENCE
May 2021-New Orders Previous Year %y-o-y
May 2021-New Orders Previous Year %y-o-y
GOLDEN DESTINY established in 1994 SALE& PURCHASE-MARINE INSURANCE-SHIP VALUATIONS-MARKET RESEARCH May 2021
Page 10 MONTHLY NEWBUILDING MARKET REPORT
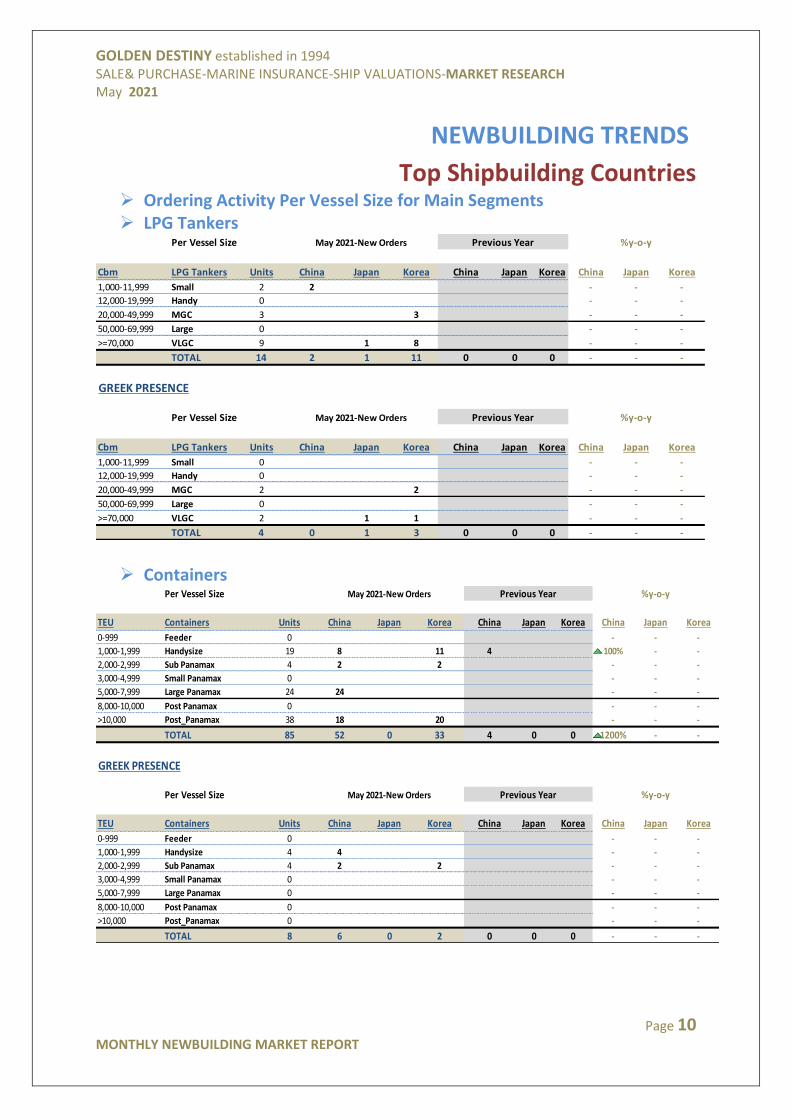
NEWBUILDING TRENDS
Top Shipbuilding Countries Ordering Activity Per Vessel Size for Main Segments LPG Tankers
Per Vessel Size
Cbm LPG Tankers Units China Japan Korea China Japan Korea China Japan Korea
1,000-11,999 Small 2 2 - - -
12,000-19,999 Handy 0 - - -
20,000-49,999 MGC 3 3 - - -
50,000-69,999 Large 0 - - -
>=70,000 VLGC 9 1 8 - - -
TOTAL 14 2 1 11 0 0 0 - - -
Per Vessel Size
Cbm LPG Tankers Units China Japan Korea China Japan Korea China Japan Korea
1,000-11,999 Small 0 - - -
12,000-19,999 Handy 0 - - -
20,000-49,999 MGC 2 2 - - -
50,000-69,999 Large 0 - - -
>=70,000 VLGC 2 1 1 - - -
TOTAL 4 0 1 3 0 0 0 - - -
GREEK PRESENCE
May 2021-New Orders Previous Year %y-o-y
May 2021-New Orders Previous Year %y-o-y
Containers
Per Vessel Size
TEU Containers Units China Japan Korea China Japan Korea China Japan Korea
0-999 Feeder 0 - - -
1,000-1,999 Handysize 19 8 11 4 100% - -
2,000-2,999 Sub Panamax 4 2 2 - - -
3,000-4,999 Small Panamax 0 - - -
5,000-7,999 Large Panamax 24 24 - - -
8,000-10,000 Post Panamax 0 - - -
>10,000 Post_Panamax 38 18 20 - - -
TOTAL 85 52 0 33 4 0 0 1200% - -
Per Vessel Size
TEU Containers Units China Japan Korea China Japan Korea China Japan Korea
0-999 Feeder 0 - - -
1,000-1,999 Handysize 4 4 - - -
2,000-2,999 Sub Panamax 4 2 2 - - -
3,000-4,999 Small Panamax 0 - - -
5,000-7,999 Large Panamax 0 - - -
8,000-10,000 Post Panamax 0 - - -
>10,000 Post_Panamax 0 - - -
TOTAL 8 6 0 2 0 0 0 - - -
May 2021-New Orders Previous Year %y-o-y
GREEK PRESENCE
May 2021-New Orders Previous Year %y-o-y