monthly state of the market report november 2010
TRANSCRIPT

Monthly State of the Market Report
November 2010
Published December 17, 2010
SPP Market Monitoring Unit

Table of Contents
Executive Summary .....................................................................................................................................2
Metrics ..........................................................................................................................................................3
Figure 1 – SPP EIS Price Contour Map ...........................................................................................3
Figure 2 – Congestion by Shadow Price Impact – November 2010 ................................................4
Figure 3 – Congestion by Shadow Price Impact – Previous 12 months ..........................................5
Figure 4 – Breached and Binding Flowgates by Interval ................................................................6
Figure 5 – LIP / Gas Cost Comparison ............................................................................................7
Figure 6 – Average Hourly Price by Market Participant – November 2010 ...................................8
Figure 7 – Average Hourly Price by Market Participant – Previous 12 months .............................9
Figure 8 – Regional Monthly Prices ..............................................................................................10
Figure 9 – Energy Generation by Fuel Type .................................................................................11
Figure 10 – Wind Generation & Capacity .....................................................................................12
Figure 11 – Fuel on the Margin .....................................................................................................13
Figure 12 – EIS Settlements - GWh ..............................................................................................14
Figure 13 – EIS Settlements - $ .....................................................................................................15
Figure 14 – Depth of Energy Market for Resources Only – by Status ..........................................16
Figure 15 – Ramp per 100 MW of Online Capacity ......................................................................17
Figure 16 – Monthly Summary of Market Ramp Rate Deficiency ...............................................18
Figure 16a – Timing of Up Ramp Deficiency Intervals ................................................................19
Figure 17 – Dispatchable Range ....................................................................................................20
Figure 18 – Transmission Owner Revenue ....................................................................................21
Figure 19 – Average Transmission Reservations and Schedules ..................................................22
Figure 20 – RNU Components ......................................................................................................23
DISCLAIMER
The data and analysis in this report are provided for informational purposes only and shall not be considered or relied upon as market
advice or market settlement data. The Southwest Power Pool Market Monitoring Unit (SPP MMU) makes no representation or
warranties of any kind, express or implied, with respect to the accuracy or adequacy of the information contained herein.
The SPP MMU shall have no liability to recipients of this information or third parties for the consequences arising from errors or
discrepancies in this information, or for any claim, loss or damage of any kind or nature whatsoever arising out of or in connection
with (i) the deficiency or inadequacy of this information for any purpose, whether or not known or disclosed to the authors, (ii) any
error or discrepancy in this information, (iii) the use of this information, or (iv) a loss of business or other consequential loss or
damage whether or not resulting from any of the foregoing.
Copyright © 2010 by Southwest Power Pool, Inc. All rights reserved.
Southwest Power Pool, Inc. SPP Market Monitoring Unit
Monthly State of the Market Report 2 November 2010
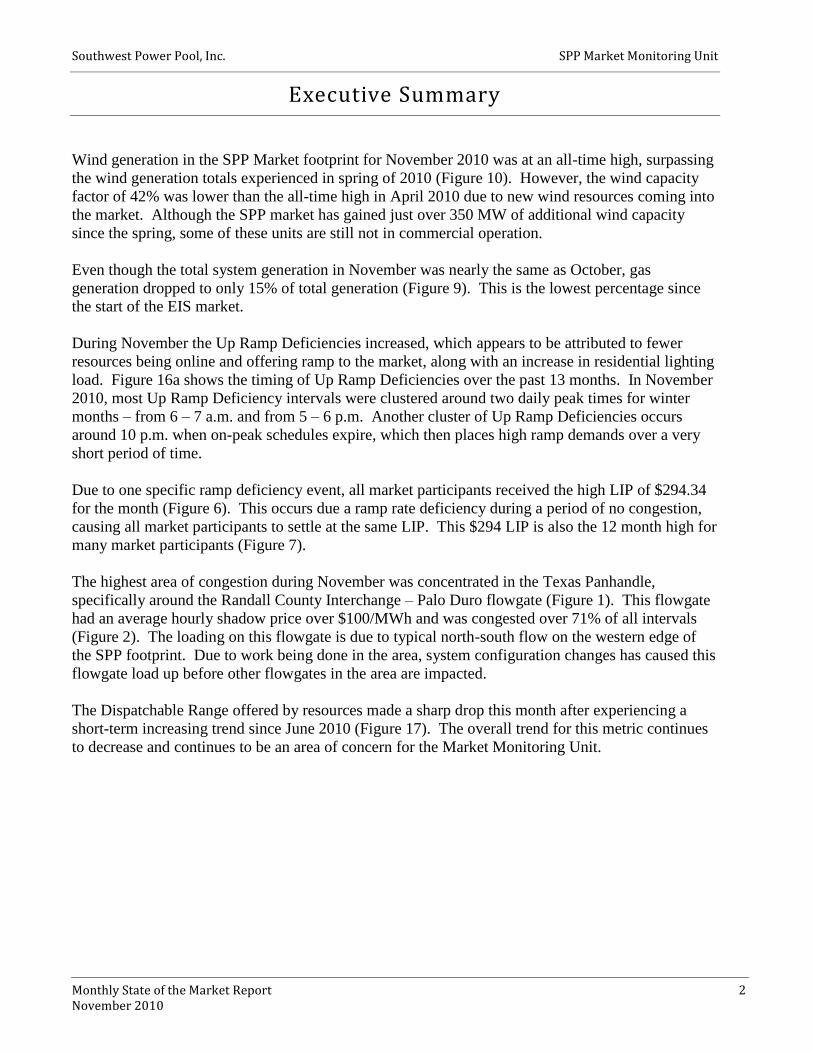
Executive Summary
Wind generation in the SPP Market footprint for November 2010 was at an all-time high, surpassing
the wind generation totals experienced in spring of 2010 (Figure 10). However, the wind capacity
factor of 42% was lower than the all-time high in April 2010 due to new wind resources coming into
the market. Although the SPP market has gained just over 350 MW of additional wind capacity
since the spring, some of these units are still not in commercial operation.
Even though the total system generation in November was nearly the same as October, gas
generation dropped to only 15% of total generation (Figure 9). This is the lowest percentage since
the start of the EIS market.
During November the Up Ramp Deficiencies increased, which appears to be attributed to fewer
resources being online and offering ramp to the market, along with an increase in residential lighting
load. Figure 16a shows the timing of Up Ramp Deficiencies over the past 13 months. In November
2010, most Up Ramp Deficiency intervals were clustered around two daily peak times for winter
months – from 6 – 7 a.m. and from 5 – 6 p.m. Another cluster of Up Ramp Deficiencies occurs
around 10 p.m. when on-peak schedules expire, which then places high ramp demands over a very
short period of time.
Due to one specific ramp deficiency event, all market participants received the high LIP of $294.34
for the month (Figure 6). This occurs due a ramp rate deficiency during a period of no congestion,
causing all market participants to settle at the same LIP. This $294 LIP is also the 12 month high for
many market participants (Figure 7).
The highest area of congestion during November was concentrated in the Texas Panhandle,
specifically around the Randall County Interchange – Palo Duro flowgate (Figure 1). This flowgate
had an average hourly shadow price over $100/MWh and was congested over 71% of all intervals
(Figure 2). The loading on this flowgate is due to typical north-south flow on the western edge of
the SPP footprint. Due to work being done in the area, system configuration changes has caused this
flowgate load up before other flowgates in the area are impacted.
The Dispatchable Range offered by resources made a sharp drop this month after experiencing a
short-term increasing trend since June 2010 (Figure 17). The overall trend for this metric continues
to decrease and continues to be an area of concern for the Market Monitoring Unit.

Southwest Power Pool, Inc. SPP Market Monitoring Unit
Monthly State of the Market Report 3 November 2010
Metrics
Figure 1 – SPP EIS Price Contour Map
November 2010
12 Month EIS Price Contour Map
500 kV
345 kV
230 kV
161 kV
138 kV
115 kV
69 kV
Oklahoma City
Tulsa
500 kV
345 kV
230 kV
161 kV
138 kV
115 kV
69 kV
Oklahoma City
Tulsa
Kansas City
area
Texas Panhandle
SE Kansas

Southwest Power Pool, Inc. SPP Market Monitoring Unit
Monthly State of the Market Report 4 November 2010
Figure 2 – Congestion by Shadow Price Impact – November 2010
Region Flowgate Name Flowgate Location (kV)
[Control Area]
Average
Hourly
Shadow
Price
($/MWh)
Total %
Intervals
(Breached
or Binding)
Detailed Description
Texas
Panhandle
RANPALAMASWI
Randall County - Palo Duro
(115) ftlo Amarillo – Swisher (230) [SPS]
$ 100.87 71.1%
Congestion due to high N-S flow. Breaches generally occur in this area with high fluctuating wind along
with limited transmission capability available.
TEMP12_16700 Tolk – Tuco (230) ftlo Tolk –
Yoakum (230) $ 3.91 4.6%
ELKXFRTUCOKU
Elk City XFR (230/138)
[CSWS] ftlo Tuco – Oklaunion (345) [SPS-
CSWS]
$ 1.61 3.1%
Kansas City
Area
IATXFRIATSTR
Iatan XFR () [KCPL] ftlo Lake Road – Iatan – Stranger
(345) KCPL] $ 14.79 5.4%
Heavy North – South flow from Nebraska into Kansas
with high external impacts and high market flow in the
Kansas City load pocket.
IASCLKNASJHA
Iatan – Stranger Creek (345)[KCPL] ftlo Lake Road
– Nashua (161), St. Joe –
Hawthorne (345) [GMOC-KCPL]
$ 4.38 2.4%
TEMP17_16702
TWA – Roanridge (161) ftlo Stranger – Craig (345)
[KCPL] $ 3.70 0.3%
SE Kansas
TEMP10_16663
Neosho – Columbus [WR-
EDE] (161) ftlo Asbury –
Purcell [EDE] (161) $ 6.24 4.0%
Due to the outages of: 161 kV transmission line in the region.
NEOCOLNEODEL
Neosho - Columbus [WR-
EDE] (161) ftlo Neosho -
Delaware (345) [WR-CSWS] $ 6.55 2.0%
SW Nebraska GENTLMREDWIL Gentleman – Red Willow
(345) [NPPD] $ 5.59 13.1%
Congestion in Kansas City with the addition of
multiple 345 kV transmission line outages over the
month that caused additional flow and external flow on
the flowgate.
SW Kansas HOLPLYHOLSPE
Holcomb – Plymell Switch (115) ftlo Holcomb -
Spearville (345) [SECI] $ 1.46 0.3%
345 kV transmission line tripped for a day that caused
additional flow on the flowgate.
0%
20%
40%
60%
80%
100%
$0
$20
$40
$60
$80
$100
%T
ota
l In
terv
als
Co
ng
este
d
Avera
ge H
ou
rly S
had
ow
Pri
ce
($/M
Wh
)
Average Hourly Shadow Price ($/MWh) % Total Intervals Congested

Southwest Power Pool, Inc. SPP Market Monitoring Unit
Monthly State of the Market Report 5 November 2010
Figure 3 – Congestion by Shadow Price Impact – Previous 12 months
Region Flowgate Name Flowgate Location (kV)
Average
Hourly
Shadow
Price
($/MWh)
Total %
Intervals
(Breached or
Binding)
Projects Expected to Provide Some
Positive Mitigation
(Estimated In Service Date –
Upgrade Type)
Texas
Panhandle
OSGCANBUSDEA
Osage Switch - Canyon East [SPS]
[(115) ftlo Bushland - Deaf Smith [SPS] (230)
$ 26.76 17.7%
1. Tuco Int. – Woodward 345 kV line (May 2014 - Balanced Portfolio)
2. Castro County Int. – Newhart 115 kV line (April
2015 - Regional Reliability)
RANPALAMASWI
Randall County - Palo Duro (115)
ftlo Amarillo – Swisher (230)
[SPS] $20.24 12.3%
1. Rebuild Randall Co–Palo Duro 115 kV line (April
2014 - no NTC but is Sponsored)
2. Tuco Int. – Woodward 345 kV line (May 2014 - Balanced Portfolio)
3. Swisher Co. Int. – Newhart 230 kV line (April 2015
- Regional Reliability)
SE
Oklahoma LONSARPITVAL
Lone Oak to Sardis [CSWS] (138)
ftlo Pittsburg – Valiant [CSWS] (345)
$ 11.98 2.9% 1. Sunnyside – Hugo – Valliant 345 kV line (April
2012 - Transmission Service)
SE Kansas NEOCOLNEOMOR
Neosho - Columbus [WR-EDE]
(161) ftlo Neosho - Morgan (345)
[WR-AECI] $ 11.52 2.1%
1. Rose Hill – Sooner – Cleveland 345 kV lines (Dec
2012 – Regional Reliability/Balanced Portfolio) 2. Two Woodward – Medicine Lodge – Wichita 345
kV lines (Dec 2014 - Priority Projects)
Kansas City Area
PLAKCISTRCRA
Platte City – KCI (161)[GMOC] ftlo Stranger Creek – Craig (115)
[KCPL] $ 9.27 1.4%
1. Iatan – Nashua 345 kV line (June 2015 - Balanced
Portfolio)
2. Nebraska City – Maryville – Sibley 345 kV line (June 2017 - Priority Projects)
LAKALASTJHAW
Lake Road – Alabama [GMOC]
(161) ftlo St. Joe – Hawthorn [GMOC] (345)
$ 9.09 1.5%
1. Axtell–Post Rock–Spearville 345 kV line, two
Spearville – Comanche – Woodward 345 kV lines, and two Comanche – Medicine Lodge – Wichita
345 kV lines (12/31/2014 - Balanced
Portfolio/Priority Projects) 2. Iatan – Nashua 345 kV line (June 2015 - Balanced
Portfolio)
3. Nebraska City – Maryville – Sibley 345 kV line (June 2017 - Priority Projects)
LAKALAIATSTR
Lake Road – Alabama [GMOC]
(161) ftlo Iatan to Stranger Creek [KCPL] (345)
$ 8.61 2.1% Same as LAKALASTJHAW above
Wichita
Area ELPFARWICWDR
El Paso – Farber [WR] (138) ftlo
Wichita – Woodring [WR-OGE] (345)
$ 7.50 5.0%
1. Rose Hill – Sooner 345 kV line (June 2012 -
Regional Reliability)
2. Two Woodward – Comanche Co. – Medicine Lodge – Wichita 345 kV lines (Dec 2014 - Priority
Projects)
SW Kansas HOLPLYHOLSPE
Holcomb – Plymell Switch [SECI]
(115) ftlo Holcomb - Spearville [SECI] (345)
$ 6.15 1.9% 1. Rebuild Holcomb – Plymell Switch 115 kV line
(Dec 2011 - Regional Reliability)
NE Kansas KELSENEMACON
Kelly – S. Seneca (115) [WR] ftlo
E. Manhattan – Concordia (230) [WR-SECI]
$ 4.48 2.9%
1. Rebuild Kelly – Seneca 115 kV line (Dec 2010 - Regional Reliability)
2. Axtell–Post Rock–Spearville 345 kV line, two
Spearville – Comanche – Medicine Lodge –Woodward 345 kV lines, and two Medicine Lodge –
Wichita 345 kV lines (Dec 2014 - Balanced
Portfolio/Priority Projects)

Southwest Power Pool, Inc. SPP Market Monitoring Unit
Monthly State of the Market Report 6 November 2010
Figure 4 – Breached and Binding Flowgates by Interval
intervals Nov
09
Dec
09
Jan
10
Feb
10
Mar
10
Apr
10
May
10
Jun
10
Jul
10
Aug
10
Sep
10
Oct
10
Nov
10
last 12
months
%
Breached 3.2% 6.6% 3.4% 2.6% 6.8% 10.6% 7.5% 6.1% 4.4% 7.5% 6.7% 3.4% 3.1% 5.7%
% Binding 54.7% 59.4% 41.5% 48.8% 74.4% 82.5% 68.9% 55.3% 56.5% 76.7% 72.9% 72.3% 82.1% 66.0%
Source: OBIEE/MOS
0%
5%
10%
15%
% D
isp
atc
h I
nte
rvals
Bre
ach
ed
% Intervals Breached
0%
20%
40%
60%
80%
100%
% D
isp
atc
h I
nte
rvals
Bin
din
g
% Intervals Binding
Southwest Power Pool, Inc. SPP Market Monitoring Unit
Monthly State of the Market Report 7 November 2010
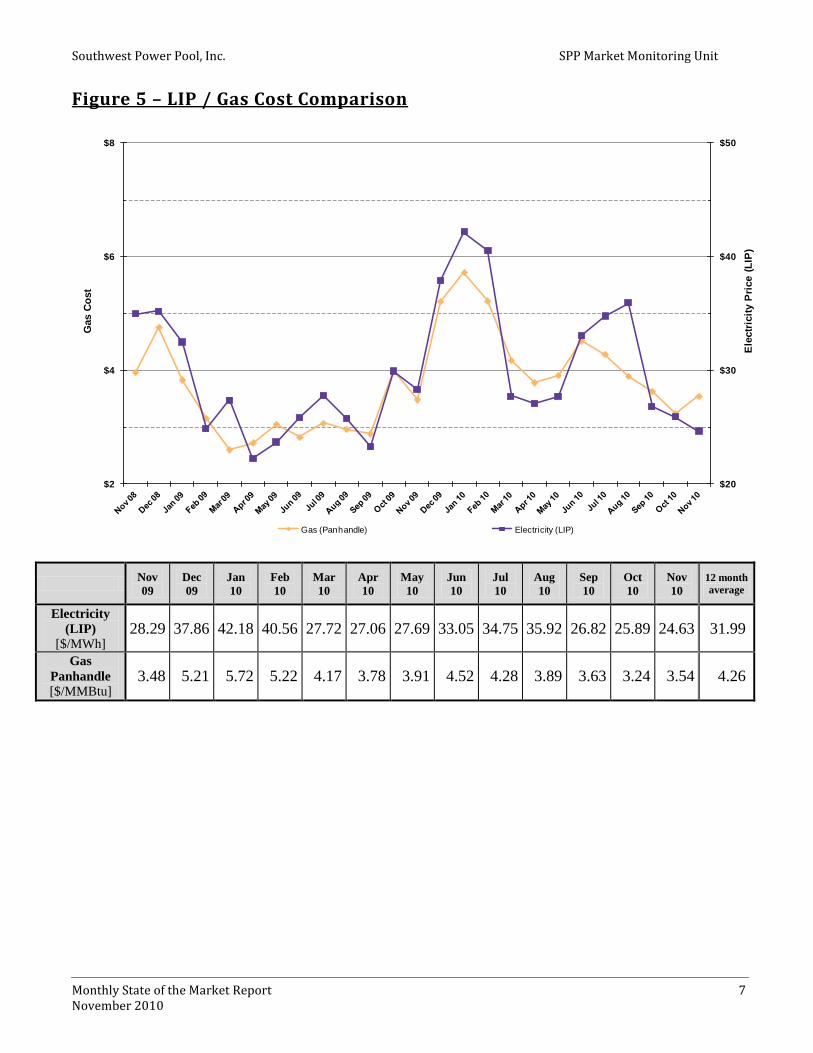
Figure 5 – LIP / Gas Cost Comparison
Nov
09
Dec
09
Jan
10
Feb
10
Mar
10
Apr
10
May
10
Jun
10
Jul
10
Aug
10
Sep
10
Oct
10
Nov
10
12 month
average
Electricity
(LIP)
[$/MWh] 28.29 37.86 42.18 40.56 27.72 27.06 27.69 33.05 34.75 35.92 26.82 25.89 24.63 31.99
Gas
Panhandle
[$/MMBtu] 3.48 5.21 5.72 5.22 4.17 3.78 3.91 4.52 4.28 3.89 3.63 3.24 3.54 4.26
$20
$30
$40
$50
$2
$4
$6
$8
Ele
ctr
icit
y P
rice (
LIP
)
Gas C
ost
Gas (Panhandle) Electricity (LIP)

Southwest Power Pool, Inc. SPP Market Monitoring Unit
Monthly State of the Market Report 8 November 2010
Figure 6 – Average Hourly Price by Market Participant – November 2010
in $ AECC AEPM BEPM EDEP GMOC GRDX GSEC INDN KBPU KCPS KPP LESM MEAN MIDW OGE OMPA OPPM SECI SPSM TEAN WFES WRGS
Max 294 294 294 294 294 294 294 294 294 294 294 294 294 294 294 294 294 294 294 294 294 294
Avg 26 25 20 27 23 26 29 24 25 25 25 20 20 24 25 26 20 23 27 20 25 25
Min -33 -36 -365 -30 -159 -26 3 -44 -17 -21 -12 -465 -416 -50 -28 -26 -466 -80 -34 -414 -28 -10
AECC
AEPM
BEPM
EDEP
GMOC
GRDX
GSEC
INDN
KBPUKCPS KPP
LESMMEAN
MIDW
OGE OMPA
OPPM
SECI
SPSM
TEAN
WFES
WRGS24.63
$15
$20
$25
$30
$35
AECC AEPM BEPM EDEP GMOC GRDX GSEC INDN KBPU KCPS KPP LESM MEAN MIDW OGE OMPA OPPM SECI SPSM TEAN WFES WRGS
$15
$20
$25
$30
$35
Pri
ces (
$/M
Wh
)
Market Participant
MP Average SPP Average

Southwest Power Pool, Inc. SPP Market Monitoring Unit
Monthly State of the Market Report 9 November 2010
Figure 7 – Average Hourly Price by Market Participant – Previous 12 months
in $ AECC AEPM BEPM EDEP GMOC GRDX GSEC INDN KBPU KCPS KPP LESM MEAN MIDW OGE OMPA OPPM SECI SPSM TEAN WFES WRGS
Max 323 346 294 532 381 330 1,169 294 294 294 294 294 294 304 299 301 294 294 1,199 294 302 294
Avg 34 33 26 36 30 33 36 32 32 32 31 26 26 30 33 33 26 31 35 26 33 31
Min -117 -103 -365 -178 -246 -161 -471 -175 -174 -174 -168 -465 -416 -238 -143 -127 -466 -198 -494 -414 -123 -171
AECCAEPM
BEPM
EDEP
GMOC
GRDX
GSEC
INDN
KBPU
KCPS
KPP
LESMMEAN
MIDW
OGE OMPA
OPPM
SECI
SPSM
TEAN
WFES
WRGS
31.99
$20
$30
$40
AECC AEPM BEPM EDEP GMOC GRDX GSEC INDN KBPU KCPS KPP LESM MEAN MIDW OGE OMPA OPPM SECI SPSM TEAN WFES WRGS
$20
$30
$40
Pri
ces (
$/M
Wh
)
Market Participant
For 12 months ending November 2010
MP Average SPP Average

Southwest Power Pool, Inc. SPP Market Monitoring Unit
Monthly State of the Market Report 10 November 2010
Figure 8 – Regional Monthly Prices
Region Average Price Maximum
Price Minimum Price Volatility
Average On-
Peak Price
Average
Off-Peak
Price
SPP $ 24.63 $ 294.34 $ -51.69 75% $ 29.45 $ 20.41
MISO $ 27.61 $ 129.74 $ -18.82 53% $ 33.19 $ 22.73
ERCOT $ 23.40 $ 469.71 $ -25.54 118% $ 27.95 $ 19.42
Note: This table is a “rough comparison” because of inherent differences in the structure of the three markets and also because of the differences in how prices for SPP, MISO, and ERCOT are calculated. For SPP, load weighted averages are used, while the data from MISO and ERCOT are not load weighted. Volatility is measured by the Coefficient of Variation, which is the standard deviation across all hours divided by the average of all hours.
$0
$10
$20
$30
$40
$50
$60
Nov 09 Dec 09 Jan 10 Feb 10 Mar 10 Apr 10 May 10 Jun 10 Jul 10 Aug 10 Sep 10 Oct 10 Nov 10
$/M
Wh
SPP MISO ERCOT
0%
50%
100%
150%
200%
Nov 09 Dec 09 Jan 10 Feb 10 Mar 10 Apr 10 May 10 Jun 10 Jul 10 Aug 10 Sep 10 Oct 10 Nov 10
Regional Price Volatility
SPP Volatility
MISO Volatility
ERCOT Volatility

Southwest Power Pool, Inc. SPP Market Monitoring Unit
Monthly State of the Market Report 11 November 2010
Figure 9 – Energy Generation by Fuel Type
in GWh Nov
09
Dec
09
Jan
10
Feb
10
Mar
10
Apr
10
May
10
Jun
10
Jul
10
Aug
10
Sep
10
Oct
10
Nov
10
Coal 11,294 12,952 12,198 11,317 11,277 9,828 10,871 12,542 13,373 14,167 11,716 10,309 10,889
Gas 2,646 3,943 4,459 3,630 2,858 2,931 3,859 5,934 6,846 7,748 4,535 3,691 2,427
Nuclear 519 1,556 1,814 1,664 1,599 1,716 1,819 1,718 1,802 1,800 1,770 1,392 1,789
Wind 840 849 747 502 1,069 1,091 909 939 768 770 867 870 1,132
Hydro 180 95 147 166 169 160 185 200 227 124 121 75 95
Other 13 12 13 17 21 17 17 22 19 21 20 21 20
Total 15,492 19,407 19,378 17,296 16,993 15,743 17,661 21,356 23,034 24,630 19,029 16,358 16,352
by % Nov
09
Dec
09
Jan
10
Feb
10
Mar
10
Apr
10
May
10
Jun
10
Jul
10
Aug
10
Sep
10
Oct
10
Nov
10
12
month
average
Coal 73% 67% 63% 65% 66% 62% 62% 59% 58% 58% 62% 63% 67% 63%
Gas 17% 20% 23% 21% 17% 19% 22% 28% 30% 31% 24% 23% 15% 23%
Nuclear 3% 8% 9% 10% 9% 11% 10% 8% 8% 7% 9% 9% 11% 9%
Wind 5% 4% 4% 3% 6% 7% 5% 4% 3% 3% 5% 5% 7% 5%
Hydro 1% 0% 1% 1% 1% 1% 1% 1% 1% 1% 1% 0% 1% 1%
Other 0% 0% 0% 0% 0% 0% 0% 0% 0% 0% 0% 0% 0% 0%
Source: OBIEE/MOS
0
5,000
10,000
15,000
20,000
25,000
Nov 08
Dec 08
Jan 09
Feb 09
Mar 09
Apr 09
May 09
Jun 09
Jul 09
Aug 09
Sep 09
Oct 09
Nov 09
Dec 09
Jan 10
Feb 10
Mar 10
Apr 10
May 10
Jun 10
Jul 10
Aug 10
Sep 10
Oct 10
Nov 10
Gen
era
tio
n (
GW
h)
Other Hydro Wind Nuclear Gas Coal

Southwest Power Pool, Inc. SPP Market Monitoring Unit
Monthly State of the Market Report 12 November 2010
Figure 10 – Wind Generation & Capacity
Nov
09
Dec
09
Jan
10
Feb
10
Mar
10
Apr
10
May
10
Jun
10
Jul
10
Aug
10
Sep
10
Oct
10
Nov
10
Capacity
(MW) 3,202 3,313 3,313 3,313 3,313 3,381 3,381 3,402 3,402 3,402 3,402 3,735 3,735
Generation
(GWh) 840 849 747 502 1,069 1,091 909 945 768 770 867 870 1,132
Capacity
Factor 36% 34% 30% 23% 43% 45% 36% 39% 30% 30% 35% 31% 42%
# of
Resources 49 51 51 51 51 53 53 54 54 54 54 57 57
Source: OBIEE/MOS
0
500
1,000
1,500
2,000
0
500
1,000
1,500
2,000
2,500
3,000
3,500
4,000
Win
d G
en
era
tio
n (
GW
h)
Win
d C
ap
acit
y (M
W)
Wind Capacity (MW) Wind Generation (GWh)

Southwest Power Pool, Inc. SPP Market Monitoring Unit
Monthly State of the Market Report 13 November 2010
Figure 11 – Fuel on the Margin
Nov
09
Dec
09
Jan
10
Feb
10
Mar
10
Apr
10
May
10
Jun
10
Jul
10
Aug
10
Sep
10
Oct
10
Nov
10
last 12
months
Other 0.0% 0.3% 0.1% 0.0% 0.2% 0.5% 0.9% 0.3% 0.0% 0.2% 0.6% 0.2% 0.3% 0.3%
Coal 39.5% 31.9% 29.9% 25.6% 41.9% 43.8% 46.6% 40.4% 32.0% 33.5% 40.7% 35.5% 44.4% 37.2%
Gas 60.5% 67.9% 70.0% 74.4% 57.8% 55.7% 52.5% 59.3% 68.0% 66.3% 58.7% 64.4% 55.4% 62.5%
Source: OBIEE/MOS
Note:
During non-congested periods, one resource sets the price for the entire market.
During congested periods, the market is effectively segmented into several sub-areas,
each with its own marginal resource. Each congested interval counts the same as a
non-congested period, but the marginal fuel type for each sub-area is represented
proportionally in the congested period.
Co
al
Co
al
Co
al
Co
al
Co
al
Co
al
Co
al
Co
al
Co
al
Co
al
Co
al
Co
al
Co
al
Co
al
Co
al
Co
al
Co
al
Co
al
Co
al
Co
al
Co
al
Co
al Co
al
Co
al C
oal
Gas
Gas
Gas
Gas
Gas G
as
Gas
Gas
Gas
Gas
Gas
Gas
Gas
Gas
Gas
Gas
Gas
Gas
Gas
Gas
Gas
Gas G
as
Gas
Gas
0%
20%
40%
60%
80%
100%
Southwest Power Pool, Inc. SPP Market Monitoring Unit
Monthly State of the Market Report 14 November 2010
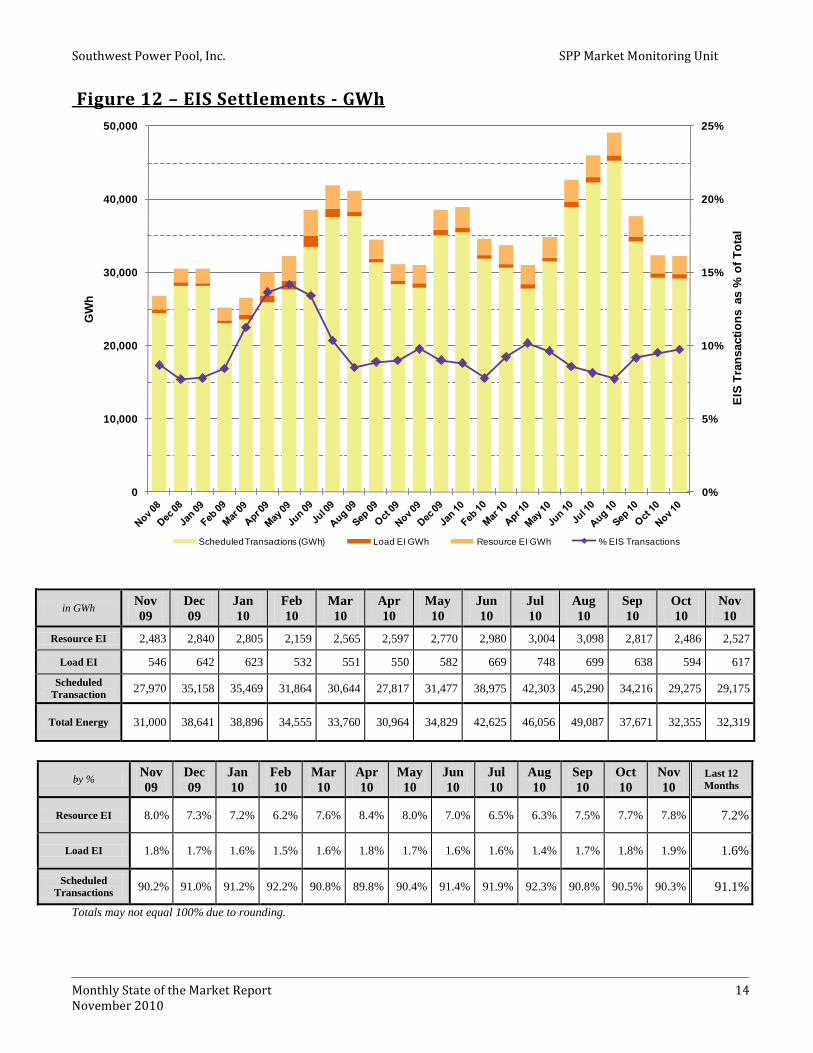
Figure 12 – EIS Settlements - GWh
in GWh Nov
09
Dec
09
Jan
10
Feb
10
Mar
10
Apr
10
May
10
Jun
10
Jul
10
Aug
10
Sep
10
Oct
10
Nov
10
Resource EI 2,483 2,840 2,805 2,159 2,565 2,597 2,770 2,980 3,004 3,098 2,817 2,486 2,527
Load EI 546 642 623 532 551 550 582 669 748 699 638 594 617
Scheduled
Transaction 27,970 35,158 35,469 31,864 30,644 27,817 31,477 38,975 42,303 45,290 34,216 29,275 29,175
Total Energy 31,000 38,641 38,896 34,555 33,760 30,964 34,829 42,625 46,056 49,087 37,671 32,355 32,319
by % Nov
09
Dec
09
Jan
10
Feb
10
Mar
10
Apr
10
May
10
Jun
10
Jul
10
Aug
10
Sep
10
Oct
10
Nov
10
Last 12
Months
Resource EI 8.0% 7.3% 7.2% 6.2% 7.6% 8.4% 8.0% 7.0% 6.5% 6.3% 7.5% 7.7% 7.8% 7.2%
Load EI 1.8% 1.7% 1.6% 1.5% 1.6% 1.8% 1.7% 1.6% 1.6% 1.4% 1.7% 1.8% 1.9% 1.6%
Scheduled
Transactions 90.2% 91.0% 91.2% 92.2% 90.8% 89.8% 90.4% 91.4% 91.9% 92.3% 90.8% 90.5% 90.3% 91.1%
Totals may not equal 100% due to rounding.
0%
5%
10%
15%
20%
25%
0
10,000
20,000
30,000
40,000
50,000
EIS
Tra
nsacti
on
s a
s %
of
To
tal
GW
h
Scheduled Transactions (GWh) Load EI GWh Resource EI GWh % EIS Transactions

Southwest Power Pool, Inc. SPP Market Monitoring Unit
Monthly State of the Market Report 15 November 2010
Figure 13 – EIS Settlements - $
in million $ Nov
09
Dec
09
Jan
10
Feb
10
Mar
10
Apr
10
May
10
Jun
10
Jul
10
Aug
10
Sep
10
Oct
10
Nov
10
12 Month
Average
Resource EI 70 107 122 87 76 73 77 97 103 109 79 64 61 88
Load EI 16 26 28 23 17 17 17 23 27 27 18 16 16 21
Total EI 85 133 150 111 93 90 95 121 130 136 107 80 77 109
$0
$100
$200
Mil
lio
ns
Resource EI Load EI

Southwest Power Pool, Inc. SPP Market Monitoring Unit
Monthly State of the Market Report 16 November 2010
Figure 14 – Depth of Energy Market for Resources Only – by Status
in GWh Nov
09
Dec
09
Jan
10
Feb
10
Mar
10
Apr
10
May
10
Jun
10
Jul
10
Aug
10
Sep
10
Oct
10
Nov
10
Market Dispatch 12,733 15,490 15,139 13,699 13,020 11,758 13,450 16,613 18,648 20,095 14,790 12,583 12,007
Self-Dispatch 534 470 407 336 399 326 328 749 585 647 559 269 215
Nuclear 514 1,561 1,832 1,675 1,614 1,734 1,821 1,723 1,807 1,803 1,770 1,393 1,798
Manual
(intermittent) 922 898 833 573 1,175 1,181 1,027 1,058 896 886 971 963 1,233
Manual (other) 811 1,052 1,369 1,119 974 908 1,122 1,334 1,213 1,317 1,039 1,242 1,223
Other (6) 4 (2) (7) (9) (4) (8) (6) (5) (2) (9) (19) (19)
TOTAL 15,549 19,475 19,578 17,395 17,174 15,903 17,741 21,470 23,144 24,745 19,121 16,431 16,457
by % of total
Nov
09
Dec
09
Jan
10
Feb
10
Mar
10
Apr
10
May
10
Jun
10
Jul
10
Aug
10
Sep
10
Oct
10
Nov
10
Last 12
Months
Market
Dispatch 82% 80% 77% 79% 76% 74% 76% 77% 81% 81% 78% 77% 73% 78%
Self-Dispatch 3% 2% 2% 2% 2% 2% 2% 3% 3% 3% 3% 2% 1% 2%
Nuclear 3% 8% 9% 10% 9% 11% 10% 8% 8% 7% 8% 8% 11% 8%
Manual
(intermittent) 6% 5% 4% 3% 7% 7% 6% 5% 4% 4% 5% 6% 7% 5%
Manual (other) 5% 5% 7% 6% 6% 6% 6% 6% 5% 5% 6% 8% 7% 6%
Other 0% 0% 0% 0% 0% 0% 0% 0% 0% 0% 0% 0% 0% 0%
Note: May not total to 100% due to rounding. Source: MOS
-
5,000
10,000
15,000
20,000
25,000
GW
h P
rod
ucti
on
Other Manual (other) Manual (intermittent) Nuclear Self-Dispatch Market Dispatch

Southwest Power Pool, Inc. SPP Market Monitoring Unit
Monthly State of the Market Report 17 November 2010
Figure 15 – Ramp per 100 MW of Online Capacity
Offered and Available to the EIS Market
Nov
09
Dec
09
Jan
10
Feb
10
Mar
10
Apr
10
May
10
Jun
10
Jul
10
Aug
10
Sep
10
Oct
10
Nov
10
12 month
average
MW / Minute /
100 MW of
Online Capacity 0.83 0.80 0.81 0.79 0.79 0.79 0.80 0.88 0.94 0.96 0.85 0.83 0.83 0.84
Average Online
Capacity (GW)
per Interval 27.2 31.9 32.5 31.6 28.6 27.6 30.8 37.6 38.8 40.9 34.2 29.7 26.6 32.6
-
10
20
30
40
0.5
0.6
0.7
0.8
0.9
1.0
1.1
1.2
1.3
1.4
Avera
ge O
nli
ne C
ap
acit
y (
GW
) p
er
Inte
rval
MW
/ M
inu
te /
100 M
W o
f O
nli
ne C
ap
acit
y
Available Online Capacity MW / Min Offered / 100 MW of Online Capacity

Southwest Power Pool, Inc. SPP Market Monitoring Unit
Monthly State of the Market Report 18 November 2010
Figure 16 – Monthly Summary of Market Ramp Rate Deficiency
Nov
09
Dec
09
Jan
10
Feb
10
Mar
10
Apr
10
May
10
Jun
10
Jul
10
Aug
10
Sep
10
Oct
10
Nov
10
12 month
average
UP Ramp
Deficiency
Intervals 43 35 25 22 11 2 16 6 1 14 9 10 66 18
DOWN Ramp
Deficiency
Intervals 5 0 0 0 3 16 35 14 0 8 8 4 6 8
Total Ramp
Deficiency
Intervals 48 35 25 22 14 18 51 20 1 22 17 14 72 26
% of Total
Market
Dispatch
Intervals
0.6% 0.4% 0.3% 0.3% 0.2% 0.2% 0.6% 0.2% 0.0% 0.2% 0.2% 0.2% 0.8% 0.3%
MW Ramp
Available per
Minute 224 256 263 249 227 219 254 331 365 393 290 245 221 276
-
40
80
120
160
200
240
280
320
360
400
-
20
40
60
80
100
MW
Ram
p A
vail
ab
le p
er
Min
ute
Ram
p D
efi
cie
ncy I
nte
rvals
UP Ramp Deficiency Intervals DOWN Ramp Deficiency Intervals Total MW Ramp Available per Minute

Southwest Power Pool, Inc. SPP Market Monitoring Unit
Monthly State of the Market Report 19 November 2010
Figure 16a – Timing of Up Ramp Deficiency Intervals
Past 13 months
November 2010
00010203040506070809101112131415161718192021222300
Nov-09 Dec-09 Jan-10 Feb-10 Mar-10 Apr-10 May-10 Jun-10 Jul-10 Aug-10 Sep-10 Oct-10 Nov-10 Dec-10
Hour
00010203040506070809101112131415161718192021222300
11/1/10
11/2/10
11/3/10
11/4/10
11/5/10
11/6/10
11/7/10
11/8/10
11/9/10
11/10/10
11/11/10
11/12/10
11/13/10
11/14/10
11/15/10
11/16/10
11/17/10
11/18/10
11/19/10
11/20/10
11/21/10
11/22/10
11/23/10
11/24/10
11/25/10
11/26/10
11/27/10
11/28/10
11/29/10
11/30/10
Hour

Southwest Power Pool, Inc. SPP Market Monitoring Unit
Monthly State of the Market Report 20 November 2010
Figure 17 – Dispatchable Range
Nov
09
Dec
09
Jan
10
Feb
10
Mar
10
Apr
10
May
10
Jun
10
Jul
10
Aug
10
Sep
10
Oct
10
Nov
10
last 12
mo
Average 39.2% 37.8% 36.9% 36.2% 36.2% 35.4% 37.4% 34.7% 36.6% 36.0% 37.6% 38.4% 35.0% 36.5%
Dispatchable Range is calculated as the average dispatachable range available (in
MW) divided by the average of the daily peak demand (MW) for the month.
32%
36%
40%
44%
Avg Dispatchable Range / Peak Demand Linear (Avg Dispatchable Range / Peak Demand)

Southwest Power Pool, Inc. SPP Market Monitoring Unit
Monthly State of the Market Report 21 November 2010
Figure 18 – Transmission Owner Revenue
in millions $ JAN FEB MAR APR MAY JUN JUL AUG SEP OCT NOV DEC
2008 32.1 34.6 33.1 33.0 32.9 32.1 32.6 33.8 37.7 34.7 35.0 36.3
2009 35.7 34.2 33.4 43.8 41.0 43.1 43.4 43.7 42.7 41.3 40.0 43.5
2010 44.7 43.9 46.6 54.3 52.0 52.3 53.8 65.1 55.8 52.9 52.5
$0
$10
$20
$30
$40
$50
$60
$70
Mil
lio
ns

Southwest Power Pool, Inc. SPP Market Monitoring Unit
Monthly State of the Market Report 22 November 2010
Figure 19 – Average Transmission Reservations and Schedules
in thousands
MWh Nov
09
Dec
09
Jan
10
Feb
10
Mar
10
Apr
10
May
10
Jun
10
Jul
10
Aug
10
Sep
10
Oct
10
Nov
10
12 month
average
Average Daily
Reservations 382 445 485 496 482 469 476 536 552 534 494 484 485 495
Average Daily
Schedules 74 110 113 119 93 96 101 117 112 112 98 95 93 105
% 19% 25% 23% 24% 19% 21% 21% 22% 20% 21% 20% 20% 19% 21%
0%
10%
20%
30%
40%
50%
60%
0
100
200
300
400
500
600
Oct 08
Nov 08
Dec 08
Jan 09
Feb 09
Mar 09
Apr 09
May 09
Jun 09
Jul 09
Aug 09
Sep 09
Oct 09
Nov 09
Dec 09
Jan 10
Feb 10
Mar 10
Apr 10
May 10
Jun 10
Jul 10
Aug 10
Sep 10
Oct 10
Th
ou
san
ds M
Wh
Avg. Daily Transmission Reservations Schedules as a % of Reservations

Southwest Power Pool, Inc. SPP Market Monitoring Unit
Monthly State of the Market Report 23 November 2010
Figure 20 – RNU Components
$ (thousands) Nov
09
Dec
09
Jan
10
Feb
10
Mar
10
Apr
10
May
10
Jun
10
Jul
10
Aug
10
Sep
10
Oct
10
Nov
10
EIS -245 -923 -1,166 1,347 589 2,617 1,564 -750 -530 -14 -686 132 -803
O/S -99 -101 -45 -26 -96 -113 -92 -101 -32 -151 -130 -44 -127
U/S -177 -257 -91 -52 -78 -112 -141 -71 -100 -140 -88 -38 -122
UDC -56 -136 -138 -81 -35 -48 -62 -98 -95 -109 -48 -29 -22
SP Loss -2 -17 -5 -6 -3 -27 -4 1 7 9 2 -12 -2
Total RNU -579 -1,434 -1,444 1,181 377 2,319 1,265 -1,018 -750 -404 -950 9 -1,078
EIS (Energy Imbalance Charge/Credit) – All energy deviations between actual generation or load and schedules are settled as (EIS).
O/S (Over-Scheduling Charge) - During any hour, if Locational Imbalance Prices diverge and a Market Participant’s Load imbalance is more than 4% (but at least 2 MW) at an applicable Settlement Location in that hour, that MP may be subject to an Over-Scheduling Charge.
U/S (Under-Scheduling Charge) - During any hour, if Locational Imbalance Prices diverge and a Market Participant’s Load imbalance is more than 4% (but at least 2 MW) at an applicable Settlement Location in that hour, that MP may be subject to an Under-Scheduling Charge.
UDC (Uninstructed Resource Deviation) – the difference between the dispatch instructions and the actual performance of a Resource.
SP Loss - Self-Provided Losses
-$4
-$2
$0
$2
$4
Mil
lio
ns
SP LOSS UDC U/S O/S EIS Total RNU