monthly weather review victoria february · pdf file48.8 °c at hopetoun airport on the...
TRANSCRIPT
Monthly Weather Review
Victoria
February 2009

The Monthly Weather Review - Victoria is produced twelve times each year by the Australian Bureau of Meteorology's VictoriaClimate Services Centre.
It is intended to provide a concise but informative overview of the temperatures, rainfall and significant weather events in Victoriafor the month.
To keep the Monthly Weather Review as timely as possible, much of the information is based on electronic reports. Although everyeffort is made to ensure the accuracy of these reports, the results can be considered only preliminary until complete quality controlprocedures have been carried out. Major discrepancies will be noted in later issues.
We are keen to ensure that the Monthly Weather Review is appropriate to the needs of its readers. If you have any comments orsuggestions, please do not hesitate to contact us:
By mail
Victoria Climate Services CentreBureau of Meteorology1010 Latrobe St.DOCKLANDS- MELBOURNE VIC 3008AUSTRALIA
By telephone
(03) 9669 4956
By email
You may also wish to visit the Bureau's home page, http://www.bom.gov.au.
Units of measurementExcept where noted, temperature is given in degrees Celsius (°C), rainfall in millimetres (mm), and wind speed in kilometres per hour(km/h).
Observation times and periodsEach station in Victoria makes its main observation for the day at 9 am local time. At this time, the precipitation over the past 24hours is determined, and maximum and minimum thermometers are also read and reset. In this publication, the followingconventions are used for assigning dates to the observations made:
Maximum temperatures are for the 24 hours from 9 am on the date mentioned. They normally occur in the afternoon of that day.
Minimum temperatures are for the 24 hours to 9 am on the date mentioned. They normally occur in the early morning of that day.
Daily rainfall is for the 24 hours to 9 am on the date mentioned. This means a significant fraction of the rain may have occurred onthe previous calendar day.
Monthly rainfall is for the period from 9 am on the last day of the previous month to 9 am on the last day of this month.
Maximum daily wind gusts are in the 24 hours from midnight to midnight.
Climatological valuesThe climatological averages shown in the text and tables are generally long-term means based on observations from all availableyears of record, which vary widely from site to site. They are not shown for sites with less than 10 years of record, as they cannotthen be calculated reliably. Climatological extremes are generally taken from available observations from all available years of record.The number of years can vary substantially from site to site.
Copyright© Commonwealth of Australia 2009This work is copyright. You may download, display, print and reproduce this material in unaltered form only (retaining this notice) foryour personal, non-commercial use or use within your organisation. Apart from any use as permitted under the Copyright Act 1968,all other rights are reserved. Requests and inquiries concerning reproduction and rights should be addressed to CommonwealthCopyright Administration, Attorney General’s Department, Robert Garran Offices, National Circuit, Barton ACT 2600 or posted athttp://www.ag.gov.au/cca.
Product code IDCKGC26R1. Prepared on 18 March 2009. ISSN 1836-3016
Cover photographFlames appear beneath thick smoke, as trees are whipped by strong winds, near Kinglake on what was to become known as "BlackSaturday". The house from which this mobile phone photo was taken was not among those destroyed.Photograph by Abbie Sharp, 7 February 2009. Used with permission.
Monthly Weather Review Victoria February 2009

OverviewThe very dry and warm weather that prevailed acrossVictoria during the second half of December andthroughout January, continued during February.Daytime temperatures have averaged between 1 and3 degrees above normal, including numerous all-timerecord maximum temperatures on 7 February, whilstovernight temperatures have averaged between halfa degree and 1 degree above normal. Very little rainhas fallen for the past ten weeks.
Included among the many places that received norain during the entire month of February are Echuca,Terang, Mildura, Kyabram and Avoca. Melbournereceived only 3 mm for the month.
Included among the many places that registeredtheir all-time record maximum temperatures on 7February are Melbourne (46.4 deg C), Hopetoun(48.8 deg C), Horsham (47.6 deg C), Grovedale (47.4deg C) and Eildon (45.4 deg C).
Extremes in February 2009
Hottest day(Highest daily maximum temperature)
48.8 °C at Hopetoun Airport on the 7thWarmest days on average
(Highest mean daily maximum temperature)33.8 °C at Mildura AirportCoolest days on average
(Lowest mean daily maximum temperature)16.7 °C at Mount Hotham
Coldest day(Lowest daily maximum temperature)
4.6 °C at Mount Hotham on the 10th 4.6 °C at FallsCreek on the 12th
4.6 °C at Mount Hotham on the 12thColdest night
(Lowest daily minimum temperature)-1.2 °C at Mount Buller on the 11th
Coolest nights on average(Lowest mean daily minimum temperature)
7.6 °C at Mount HothamWarmest nights on average
(Highest mean daily minimum temperature)17.2 °C at Mildura Airport
Warmest night(Highest daily minimum temperature)
27.1 °C at Beechworth Woolshed on the 8thWettest overall
(Highest total rainfall)84.0 mm at Mount Useful
Wettest day(Highest daily rainfall)
54.0 mm at Seaspray (Burong) on the 12thHighest wind gust
120 km/h at Colac (Mount Gellibrand) on the 7th
Significant weatherFebruary 2009 was a month dominated by hightemperatures and extreme fire weather conditionsthat led to tragic losses.
On the 1st of February, isolated thunderstormsdeveloped in the northeast of the state. There was areport of hail of 2cm diameter and heavy rain fromMt Beauty.
On Saturday the 7th of February, a strong and gustynortherly airstream and record maximumtemperatures for many areas led to extreme firedanger. Wind gusts to 115 km/h were reported at MtWilliam and Mt Gellibrand, while gusts over 90 km/hwere recorded at a number of sites including PortFairy, Aireys Inlet, Kilmore Gap, Dunns Hill and MtHotham. Several bushfires started on this dayresulting in losses of life and property. These firescontinued to burn for the rest of the month, and asof the 1st March losses were:
• Fatalities: 210• Private Dwellings: 2029• Agricultural buildings: 2498• Stock: 8217• Timber plantations: 21320 ha• Total area burnt: 302875 ha.The main fire complexes were:
Kilmore East - Murrindindi North, Kilmore East -Murrindindi South , Wilsons Promontory - Cathedral,Churchill Jerralang , Bunyip State Park, Dargo - WhiteTimber Spur, Beechworth - Libary Road , East Tyers -Thompson.
Synoptic summaryFollowing the late January hot spell, a weak changebrought some relief to southern coastal areas, butinland areas remained very hot until 5 February.Extreme heat then returned throughout most ofVictoria, peaking on 7 February when strengtheningnortherly winds ahead of an approaching front senttemperatures up to record highs at numerous places,before the Tasman Sea high finally moved away on 8February.
This was followed by the approach of a new High inthe Bight, but the development of a number of lowpressure systems in the easterly flow impinging uponNSW and QLD, prevented a resumption of the veryhot northerlies. Indeed, for most of the remainder ofFebruary, Victoria's weather was largely influencedby Highs near to, or to the west of the State.
Monthly Weather Review Victoria February 2009
page 1
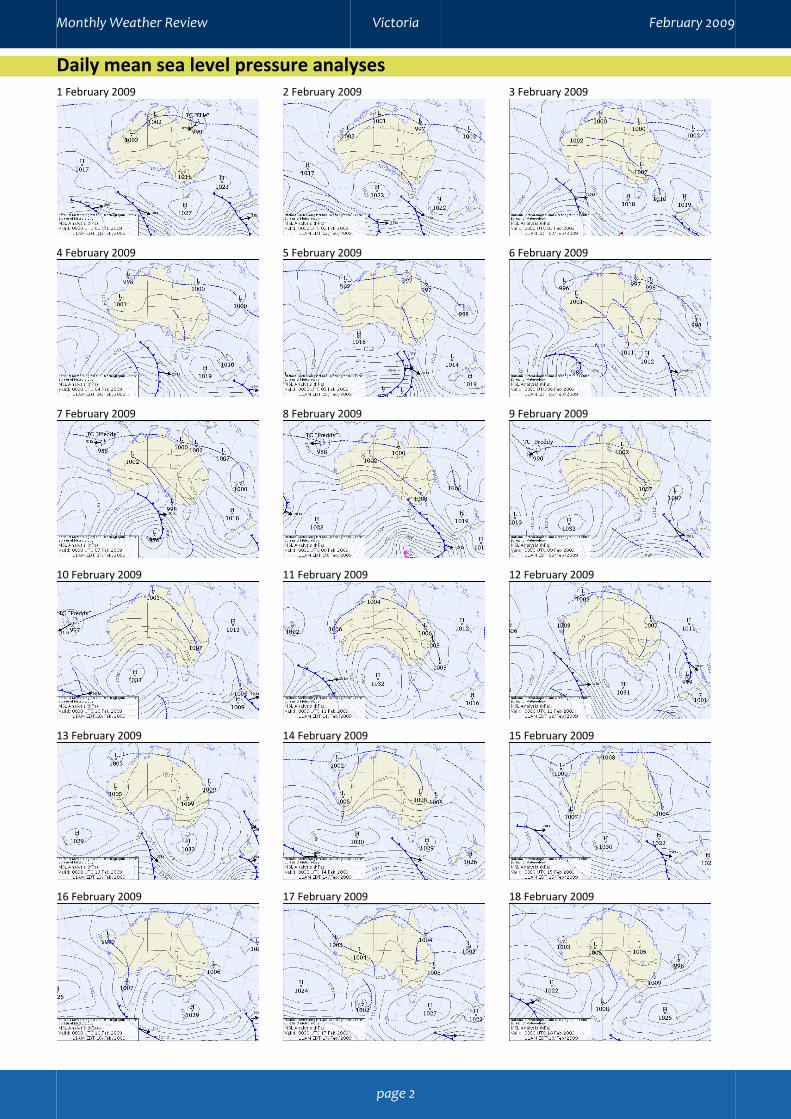
Daily mean sea level pressure analyses1 February 2009 2 February 2009 3 February 2009
4 February 2009 5 February 2009 6 February 2009
7 February 2009 8 February 2009 9 February 2009
10 February 2009 11 February 2009 12 February 2009
13 February 2009 14 February 2009 15 February 2009
16 February 2009 17 February 2009 18 February 2009
Monthly Weather Review Victoria February 2009
page 2

19 February 2009 20 February 2009 21 February 2009
22 February 2009 23 February 2009 24 February 2009
25 February 2009 26 February 2009 27 February 2009
28 February 2009
Monthly Weather Review Victoria February 2009
page 3

TemperaturesThe mean temperature for Victoria in February 2009was 20.6 °C, which is 0.9 °C above the long-termaverage.
New temperature records
Record highest February daily maximum temperature
New record Old recordYears
ofrecord
Melbourne Regional
Office46.4 on the 7th 43.2 on the 8th in 1983 154
Laverton RAAF 47.5 on the 7th 45.0 on the 8th in 1983 66
East Sale Airport 44.4 on the 7th 43.6 on the 8th in 1983 64
Mildura Airport 46.7 on the 7th 45.6 on the 14th in 2004 63
Echuca Aerodrome 46.8 on the 7th 44.6 on the 2nd in 1979 53
Omeo Comparison 40.0 on the 7th = 40.0 on the 1st in 1968 53
Ouyen (Post Office) 46.8 on the 7th 46.7 on the 14th in 2004 53
Wilsons Promontory
Lighthouse42.0 on the 7th 39.0 on the 8th in 1983 53
Ballarat Aerodrome 44.1 on the 7th 40.9 on the 16th in 1983 52
Mangalore Airport 46.1 on the 7th 43.6 on the 15th in 2004 51
Orbost (Comparison) 44.6 on the 7th 43.0 on the 8th in 1983 51
Horsham Polkemmet
Rd47.6 on the 7th 45.2 on the 14th in 2004 49
Kerang 46.9 on the 7th 45.1 on the 14th in 2004 45
Longerenong 47.6 on the 7th 45.3 on the 14th in 2004 45
Maryborough 45.4 on the 7th 42.8 on the 14th in 2004 45
Tatura Inst
Sustainable Ag44.8 on the 7th 41.4 on the 8th in 1983 45
Kyabram DPI 46.6 on the 7th 43.3 on the 1st in 1968 44
Walpeup Research 48.1 on the 7th 46.3 on the 14th in 2004 43
Scoresby Research
Institute46.1 on the 7th 41.8 on the 24th in 1968 42
Ararat Prison 44.7 on the 7th 42.6 on the 14th in 2004 40
Essendon Airport 47.3 on the 7th 42.2 on the 25th in 1968 40
Wonthaggi 45.0 on the 7th 42.0 on the 8th in 1983 40
Lake Eildon 45.4 on the 7th 41.0 on the 15th in 2004 39
Melbourne Airport 46.8 on the 7th 43.3 on the 8th in 1983 39
Point Hicks
(Lighthouse)40.4 on the 7th 39.9 on the 1st in 1983 39
Castlemaine Prison 43.9 on the 7th 42.3 on the 24th in 1968 38
Moorabbin Airport 46.7 on the 7th 43.2 on the 8th in 1983 38
Warracknabeal
Museum46.8 on the 7th 45.5 on the 14th in 2004 36
Strathbogie 42.0 on the 7th 39.5 on the 8th in 1983 32
Bairnsdale Airport 46.2 on the 7th 43.0 on the 3rd in 2000 28
Weeaproinah 39.0 on the 7th 37.7 on the 16th in 1983 28
Bundoora (Latrobe
University)46.5 on the 7th 43.1 on the 8th in 1983 26
Morwell (Latrobe
Valley Airport)46.3 on the 7th 40.7 on the 26th in 1998 26
Noojee (Slivar) 43.2 on the 7th 40.0 on the 8th in 1983 26
Hamilton Airport 44.5 on the 7th 42.1 on the 14th in 2004 25
Edi Upper 43.8 on the 7th 41.2 on the 15th in 2004 23
Mount Buller 30.7 on the 7th 28.0 on the 15th in 2004 23
Phillip Island Penguin
Reserve39.2 on the 7th 38.6 on the 18th in 1997 22
Wangaratta Aero 45.8 on the 7th 43.5 on the 15th in 2004 22
Record highest February daily maximum temperature
New record Old recordYears
ofrecord
Cranbourne Botanic
Gardens46.0 on the 7th 40.2 on the 26th in 1998 20
Grovedale (Geelong
Airport)47.4 on the 7th 41.6 on the 26th in 1998 20
Willow Grove (Blue
Rock Reservoir)43.0 on the 8th 38.0 on the 19th in 1997 20
Record highest February daily minimum temperature
New record Old recordYears
ofrecord
Dartmouth Reservoir 24.0 on the 1st 21.7 on the 16th in 2004 30
Edi Upper 24.2 on the 8th 23.8 on the 15th in 2004 23
Mount Buller 20.6 on the 1st 18.8 on the 5th in 1991 23
Monthly Weather Review Victoria February 2009
page 4
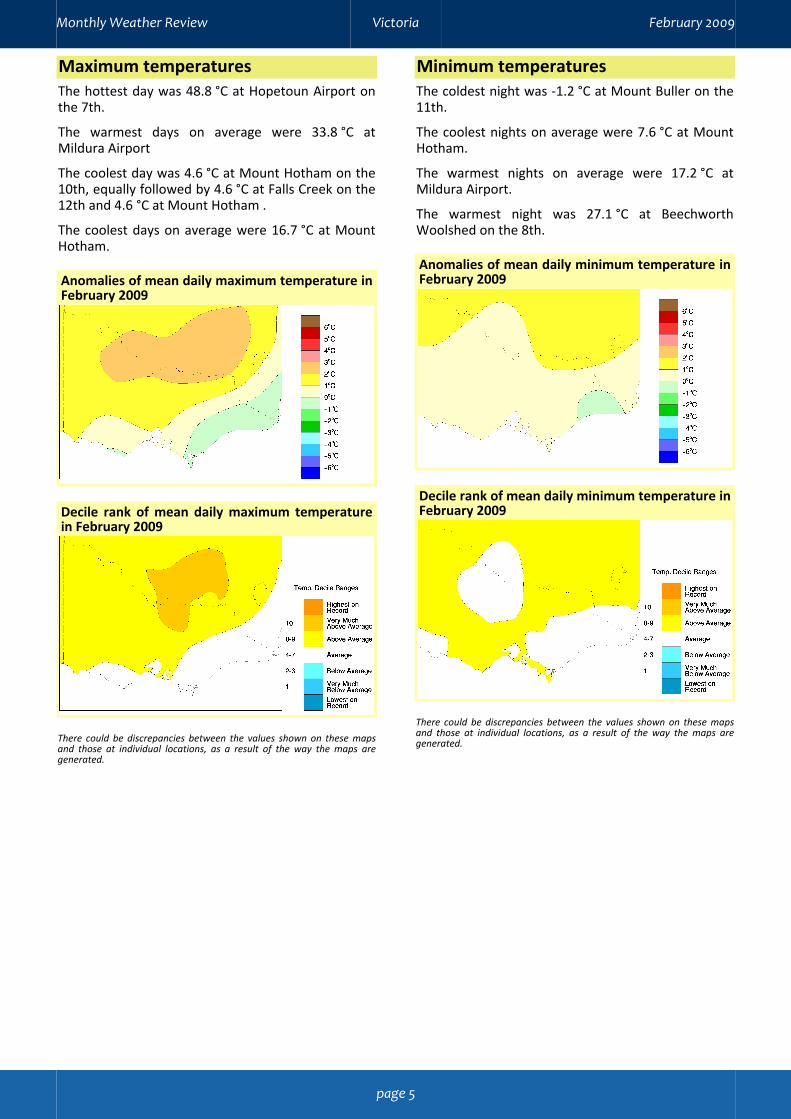
Maximum temperaturesThe hottest day was 48.8 °C at Hopetoun Airport onthe 7th.
The warmest days on average were 33.8 °C atMildura Airport
The coolest day was 4.6 °C at Mount Hotham on the10th, equally followed by 4.6 °C at Falls Creek on the12th and 4.6 °C at Mount Hotham .
The coolest days on average were 16.7 °C at MountHotham.
Anomalies of mean daily maximum temperature inFebruary 2009
Decile rank of mean daily maximum temperaturein February 2009
There could be discrepancies between the values shown on these mapsand those at individual locations, as a result of the way the maps aregenerated.
Minimum temperaturesThe coldest night was -1.2 °C at Mount Buller on the11th.
The coolest nights on average were 7.6 °C at MountHotham.
The warmest nights on average were 17.2 °C atMildura Airport.
The warmest night was 27.1 °C at BeechworthWoolshed on the 8th.
Anomalies of mean daily minimum temperature inFebruary 2009
Decile rank of mean daily minimum temperature inFebruary 2009
There could be discrepancies between the values shown on these mapsand those at individual locations, as a result of the way the maps aregenerated.
Monthly Weather Review Victoria February 2009
page 5
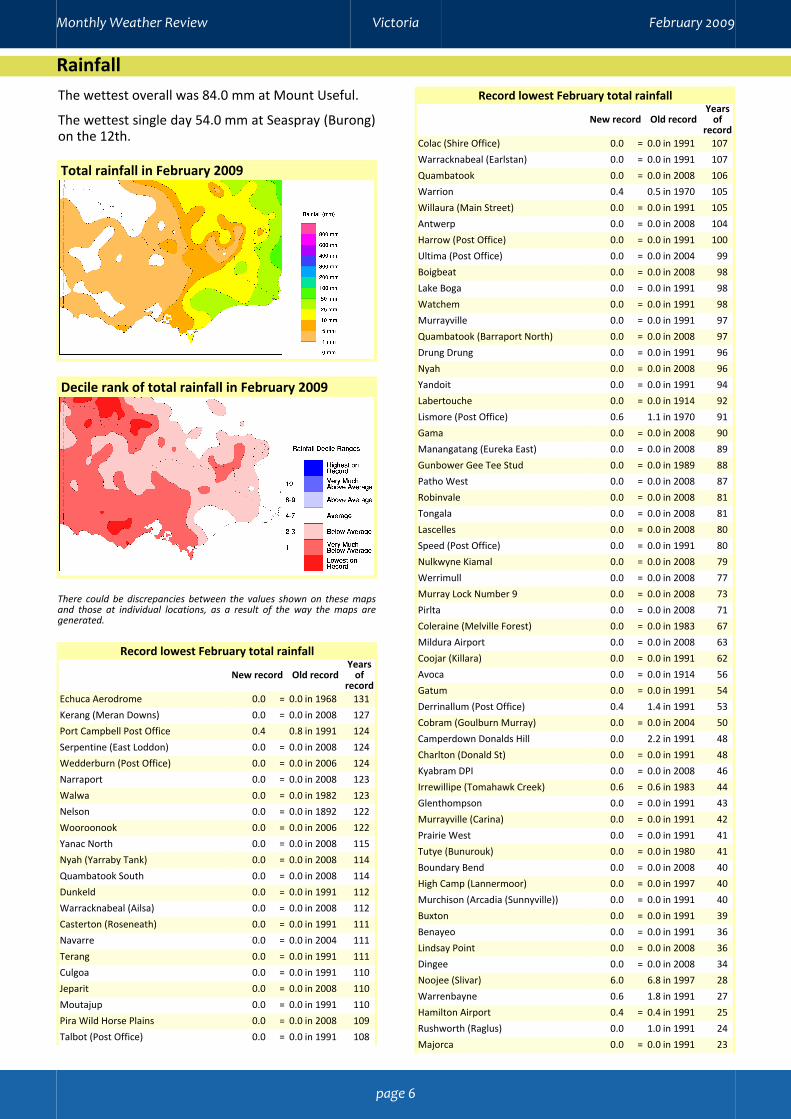
RainfallThe wettest overall was 84.0 mm at Mount Useful.
The wettest single day 54.0 mm at Seaspray (Burong)on the 12th.
Total rainfall in February 2009
Decile rank of total rainfall in February 2009
There could be discrepancies between the values shown on these mapsand those at individual locations, as a result of the way the maps aregenerated.
Record lowest February total rainfall
New record Old recordYears
ofrecord
Echuca Aerodrome 0.0 = 0.0 in 1968 131
Kerang (Meran Downs) 0.0 = 0.0 in 2008 127
Port Campbell Post Office 0.4 0.8 in 1991 124
Serpentine (East Loddon) 0.0 = 0.0 in 2008 124
Wedderburn (Post Office) 0.0 = 0.0 in 2006 124
Narraport 0.0 = 0.0 in 2008 123
Walwa 0.0 = 0.0 in 1982 123
Nelson 0.0 = 0.0 in 1892 122
Wooroonook 0.0 = 0.0 in 2006 122
Yanac North 0.0 = 0.0 in 2008 115
Nyah (Yarraby Tank) 0.0 = 0.0 in 2008 114
Quambatook South 0.0 = 0.0 in 2008 114
Dunkeld 0.0 = 0.0 in 1991 112
Warracknabeal (Ailsa) 0.0 = 0.0 in 2008 112
Casterton (Roseneath) 0.0 = 0.0 in 1991 111
Navarre 0.0 = 0.0 in 2004 111
Terang 0.0 = 0.0 in 1991 111
Culgoa 0.0 = 0.0 in 1991 110
Jeparit 0.0 = 0.0 in 2008 110
Moutajup 0.0 = 0.0 in 1991 110
Pira Wild Horse Plains 0.0 = 0.0 in 2008 109
Talbot (Post Office) 0.0 = 0.0 in 1991 108
Record lowest February total rainfall
New record Old recordYears
ofrecord
Colac (Shire Office) 0.0 = 0.0 in 1991 107
Warracknabeal (Earlstan) 0.0 = 0.0 in 1991 107
Quambatook 0.0 = 0.0 in 2008 106
Warrion 0.4 0.5 in 1970 105
Willaura (Main Street) 0.0 = 0.0 in 1991 105
Antwerp 0.0 = 0.0 in 2008 104
Harrow (Post Office) 0.0 = 0.0 in 1991 100
Ultima (Post Office) 0.0 = 0.0 in 2004 99
Boigbeat 0.0 = 0.0 in 2008 98
Lake Boga 0.0 = 0.0 in 1991 98
Watchem 0.0 = 0.0 in 1991 98
Murrayville 0.0 = 0.0 in 1991 97
Quambatook (Barraport North) 0.0 = 0.0 in 2008 97
Drung Drung 0.0 = 0.0 in 1991 96
Nyah 0.0 = 0.0 in 2008 96
Yandoit 0.0 = 0.0 in 1991 94
Labertouche 0.0 = 0.0 in 1914 92
Lismore (Post Office) 0.6 1.1 in 1970 91
Gama 0.0 = 0.0 in 2008 90
Manangatang (Eureka East) 0.0 = 0.0 in 2008 89
Gunbower Gee Tee Stud 0.0 = 0.0 in 1989 88
Patho West 0.0 = 0.0 in 2008 87
Robinvale 0.0 = 0.0 in 2008 81
Tongala 0.0 = 0.0 in 2008 81
Lascelles 0.0 = 0.0 in 2008 80
Speed (Post Office) 0.0 = 0.0 in 1991 80
Nulkwyne Kiamal 0.0 = 0.0 in 2008 79
Werrimull 0.0 = 0.0 in 2008 77
Murray Lock Number 9 0.0 = 0.0 in 2008 73
Pirlta 0.0 = 0.0 in 2008 71
Coleraine (Melville Forest) 0.0 = 0.0 in 1983 67
Mildura Airport 0.0 = 0.0 in 2008 63
Coojar (Killara) 0.0 = 0.0 in 1991 62
Avoca 0.0 = 0.0 in 1914 56
Gatum 0.0 = 0.0 in 1991 54
Derrinallum (Post Office) 0.4 1.4 in 1991 53
Cobram (Goulburn Murray) 0.0 = 0.0 in 2004 50
Camperdown Donalds Hill 0.0 2.2 in 1991 48
Charlton (Donald St) 0.0 = 0.0 in 1991 48
Kyabram DPI 0.0 = 0.0 in 2008 46
Irrewillipe (Tomahawk Creek) 0.6 = 0.6 in 1983 44
Glenthompson 0.0 = 0.0 in 1991 43
Murrayville (Carina) 0.0 = 0.0 in 1991 42
Prairie West 0.0 = 0.0 in 1991 41
Tutye (Bunurouk) 0.0 = 0.0 in 1980 41
Boundary Bend 0.0 = 0.0 in 2008 40
High Camp (Lannermoor) 0.0 = 0.0 in 1997 40
Murchison (Arcadia (Sunnyville)) 0.0 = 0.0 in 1991 40
Buxton 0.0 = 0.0 in 1991 39
Benayeo 0.0 = 0.0 in 1991 36
Lindsay Point 0.0 = 0.0 in 2008 36
Dingee 0.0 = 0.0 in 2008 34
Noojee (Slivar) 6.0 6.8 in 1997 28
Warrenbayne 0.6 1.8 in 1991 27
Hamilton Airport 0.4 = 0.4 in 1991 25
Rushworth (Raglus) 0.0 1.0 in 1991 24
Majorca 0.0 = 0.0 in 1991 23
Monthly Weather Review Victoria February 2009
page 6

Record lowest February total rainfall
New record Old recordYears
ofrecord
Grovedale (Geelong Airport) 2.2 6.4 in 1986 21
Springvale (Sandown) 0.0 = 0.0 in 1991 21
Record lowest February total rainfall for at least 20 yearsObserved this
monthMost recent
lower
Yearssincelower
Durdidwarrah 1.0 0.8 in 1876 133
Nelson 0.0 0.0 in 1892 115
Labertouche 0.0 0.0 in 1914 90
Cape Bridgewater 1.4 1.0 in 1934 75
Koetong 0.8 0.0 in 1937 62
Trentham (Post Office) 0.8 0.3 in 1956 52
Cheltenham Kingston Centre 0.8 0.0 in 1956 51
Portland 0.2 0.0 in 1956 50
Trafalgar Toseland Road 3.6 1.3 in 1965 43
Blackwood 2.5 1.3 in 1965 42
Creightons Creek (Baronga
(Creighton's C1.0 0.0 in 1968 41
Echuca Aerodrome 0.0 0.0 in 1968 41
Moe Gipsland Water 5.7 1.8 in 1965 41
Terip Terip 1.6 0.0 in 1968 41
Woodend (Carlisle Street) 1.0 0.0 in 1968 40
Camperdown (Ettrick) 1.0 0.0 in 1970 39
Eversley 0.8 0.8 in 1975 34
Cressy 0.6 0.0 in 1975 30
Kanumbra (Brilliant Estate) 1.0 0.0 in 1980 29
Lake Eildon 2.0 1.6 in 1980 29
Molka (Lowana) 0.6 0.0 in 1980 29
Nagambie (Goulburn Weir) 1.2 0.4 in 1980 29
Tutye (Bunurouk) 0.0 0.0 in 1980 29
Bannockburn 2.8 1.0 in 1982 27
Bannockburn (Hillside) 2.8 0.8 in 1982 27
Callaghan Creek Station 1.6 0.2 in 1982 27
Dartmouth Reservoir 2.0 0.4 in 1982 27
Kerang Model Farm 0.5 0.2 in 1982 27
Longwood 1.2 0.0 in 1980 27
Rushworth 0.4 0.0 in 1980 27
Strathbogie 2.4 0.6 in 1982 27
Ballarat Aerodrome 2.2 0.0 in 1983 26
Beeac (Post Office) 0.8 0.0 in 1983 26
Cobden (Post Office) 0.4 0.0 in 1983 26
Coleraine (Melville Forest) 0.0 0.0 in 1983 26
Dromana Sussex Farm 4.2 3.0 in 1983 26
Forrest State Forest 1.4 0.8 in 1983 26
Glen Park (White Swan
Reservoir)2.8 2.4 in 1983 26
Moorabool Reservoir 2.8 1.0 in 1983 26
Pennyroyal Creek 1.0 0.8 in 1983 26
Pykes Creek Reservoir 4.8 1.5 in 1983 26
Rochester 0.8 0.0 in 1983 26
Simpson South 1.6 0.0 in 1983 26
Swifts Creek 4.6 1.6 in 1982 26
Ventnor (Oaklands) 4.0 1.4 in 1983 26
Walwa 0.0 0.0 in 1982 26
Weeaproinah 16.2 3.0 in 1983 26
Wonthaggi 5.2 0.2 in 1983 26
Wyelangta 17.0 3.8 in 1983 26
Apollo Bay 8.8 0.8 in 1983 25
Record lowest February total rainfall for at least 20 yearsObserved this
monthMost recent
lower
Yearssincelower
Balmoral (Post Office) 0.2 0.0 in 1983 25
Flinders 3.0 1.6 in 1983 25
Hordern Vale 5.0 1.6 in 1983 25
Irrewillipe (Tomahawk Creek) 0.6 0.6 in 1983 25
Moorooduc 5.6 0.0 in 1983 25
Rosebud (Country Club) 3.4 1.8 in 1983 25
Shoreham 2.4 2.4 in 1983 25
Skipton Post Office 1.6 0.0 in 1983 25
Addington 2.6 0.0 in 1985 24
Avoca 0.0 0.0 in 1914 24
Cape Otway Lighthouse 1.6 1.6 in 1983 24
Meredith (Darra) 8.0 4.9 in 1985 24
Princetown 2.0 0.0 in 1983 24
Stanhope 0.2 0.0 in 1985 24
Swanpool (Tiree) 1.6 0.0 in 1985 23
Wensleydale (Anglesea (Vehicle
Proving G6.4 0.0 in 1983 23
Barwon Downs 0.6 0.2 in 1983 22
Tarwin Lower (Riverside) 5.8 5.8 in 1985 22
Bonnie Doon Garage 2.0 1.6 in 1985 21
Euroa 1.6 0.0 in 1985 21
Gunbower Gee Tee Stud 0.0 0.0 in 1989 20
Phillip Island Penguin Reserve 2.6 2.0 in 1983 20
Monthly Weather Review Victoria February 2009
page 7

Daily maximum temperature for February 20091 February 2009 2 February 2009 3 February 2009 4 February 2009 5 February 2009
6 February 2009 7 February 2009 8 February 2009 9 February 2009 10 February 2009
11 February 2009 12 February 2009 13 February 2009 14 February 2009 15 February 2009
16 February 2009 17 February 2009 18 February 2009 19 February 2009 20 February 2009
21 February 2009 22 February 2009 23 February 2009 24 February 2009 25 February 2009
26 February 2009 27 February 2009 28 February 2009
These maps are presented to give a statewide overview of conditions on each day through the month. There could be discrepancies between the valuesshown on these maps and those at individual locations, as a result of the way the maps are generated.
Monthly Weather Review Victoria February 2009
page 8

Daily minimum temperature for February 20091 February 2009 2 February 2009 3 February 2009 4 February 2009 5 February 2009
6 February 2009 7 February 2009 8 February 2009 9 February 2009 10 February 2009
11 February 2009 12 February 2009 13 February 2009 14 February 2009 15 February 2009
16 February 2009 17 February 2009 18 February 2009 19 February 2009 20 February 2009
21 February 2009 22 February 2009 23 February 2009 24 February 2009 25 February 2009
26 February 2009 27 February 2009 28 February 2009
These maps are presented to give a statewide overview of conditions on each day through the month. There could be discrepancies between the valuesshown on these maps and those at individual locations, as a result of the way the maps are generated.
Monthly Weather Review Victoria February 2009
page 9
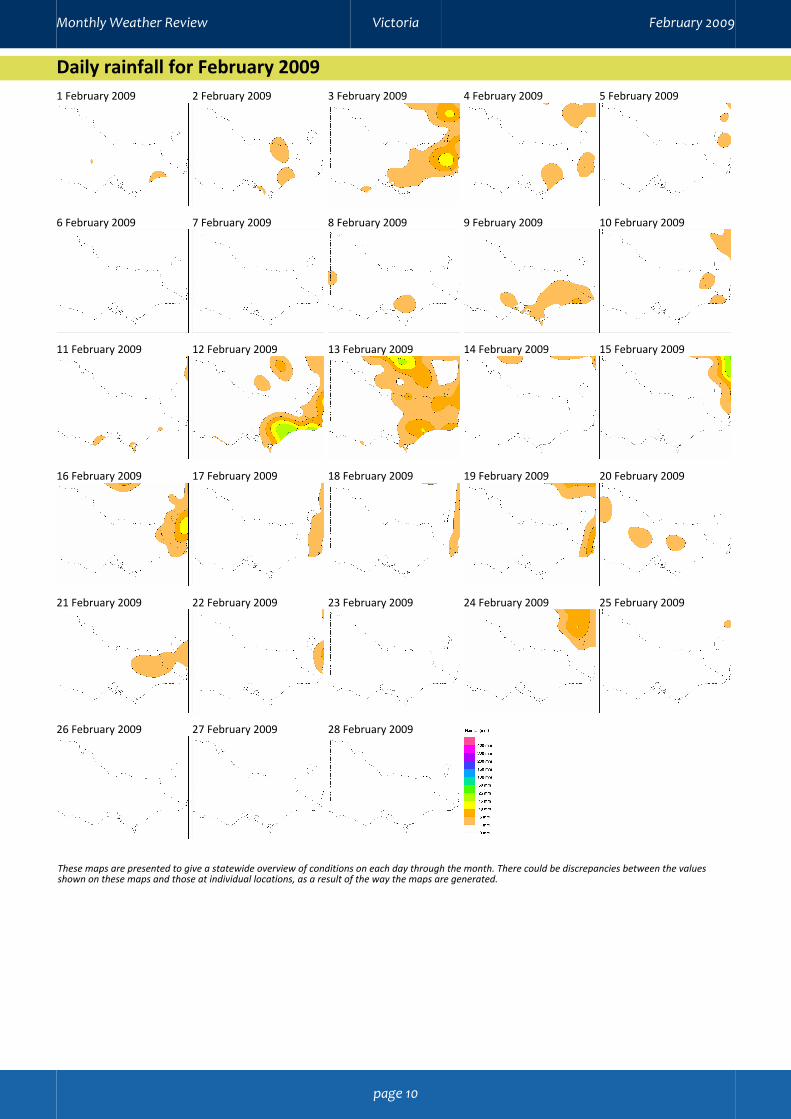
Daily rainfall for February 20091 February 2009 2 February 2009 3 February 2009 4 February 2009 5 February 2009
6 February 2009 7 February 2009 8 February 2009 9 February 2009 10 February 2009
11 February 2009 12 February 2009 13 February 2009 14 February 2009 15 February 2009
16 February 2009 17 February 2009 18 February 2009 19 February 2009 20 February 2009
21 February 2009 22 February 2009 23 February 2009 24 February 2009 25 February 2009
26 February 2009 27 February 2009 28 February 2009
These maps are presented to give a statewide overview of conditions on each day through the month. There could be discrepancies between the valuesshown on these maps and those at individual locations, as a result of the way the maps are generated.
Monthly Weather Review Victoria February 2009
page 10

Summary of observations for Melbourne in February 2009Observations and climatology are from the city, except for evaporation, sunshine and wind which are fromMelbourne Airport
Observed this month Climatological valueTemperatureMean daily maximum temperature 28.1 °C 25.8 °CMean daily minimum temperature 16.5 °C 14.6 °CMean temperature 22.3 °C 20.2 °CMean temperature at 9 am 19.2 °C 19.1 °CMean temperature at 3 pm 26.2 °C 24.6 °CHighest temperature 46.4 °C on the 7th 43.2 °C on the 8th in 1983Lowest temperature 12.8 °C on the 13th 4.5 °C on the 24th in 1924Days 30 °C or warmer 11 6.9Days 35 °C or warmer 2 2.7Nights 5 °C or cooler 0 0.0Nights 2 °C or cooler 0 0.0HumidityMean relative humidity at 9 am 64 % 66 %Mean relative humidity at 3 pm 40 % 48 %PressureMean MSL pressure at 9 am 1015.4 hPa 1015.8 hPaMean MSL pressure at 3 pm 1013.5 hPa 1014.1 hPaWindStrongest wind gust SW 83 km/h on the 7th WSW 115 km/h on the 26th in 1998Mean wind speed at 9 am 19 km/h 17 km/hMean wind speed at 3 pm 26 km/h 20 km/hDays with strong wind 3 4.8Days with gales 0 0.7Days with gale-force gusts 2 4.4RainfallTotal precipitation 3.0 mm 47.3 mmNumber of rain days 5 7.4Wettest day 1.2 mm on the 25th 113.4 mm on the 3rd in 2005SunshineMean daily sunshine 8.9 hoursEvaporationMean daily evaporation 8.0 mm 7.0 mmPhenomenaDays of thunder 2 1.7Days of hail 0 0.3Days of frost 0 0.0Days of fog 0 0.5Days with mist or haze 26 19.0
Monthly Weather Review Victoria February 2009
page 11
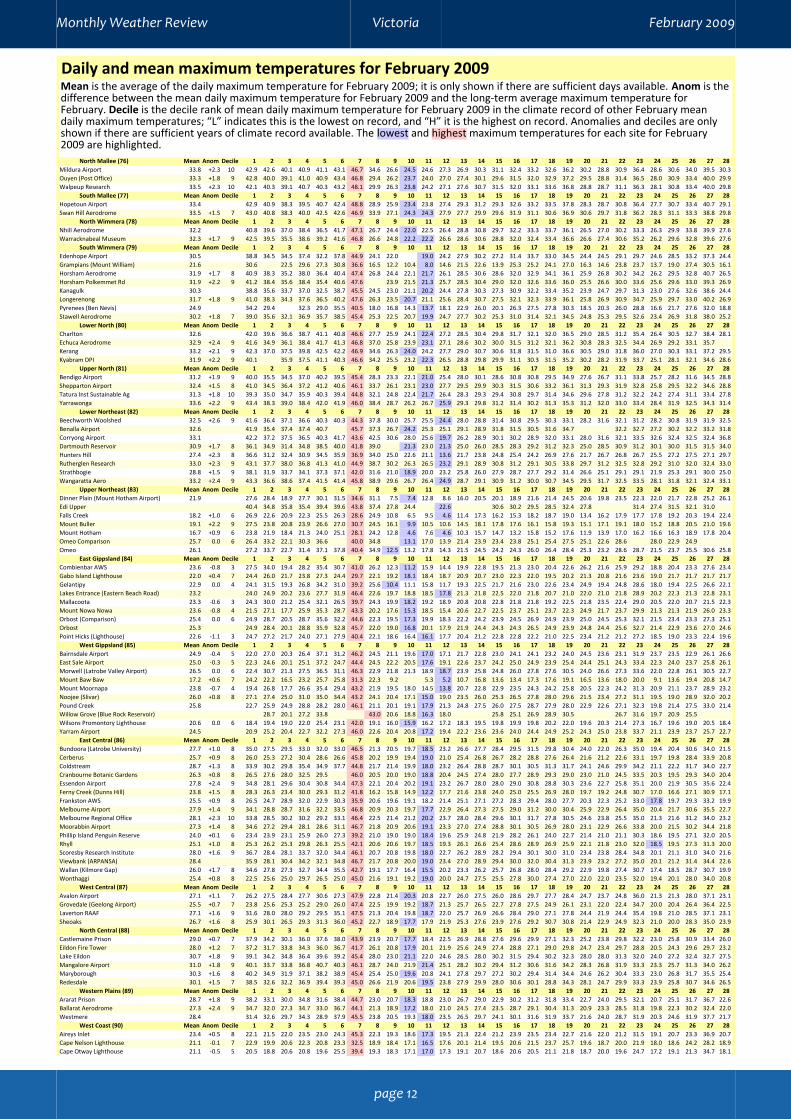
Daily and mean maximum temperatures for February 2009Mean is the average of the daily maximum temperature for February 2009; it is only shown if there are sufficient days available. Anom is thedifference between the mean daily maximum temperature for February 2009 and the long-term average maximum temperature forFebruary. Decile is the decile rank of mean daily maximum temperature for February 2009 in the climate record of other February meandaily maximum temperatures; “L” indicates this is the lowest on record, and “H” it is the highest on record. Anomalies and deciles are onlyshown if there are sufficient years of climate record available. The lowest and highest maximum temperatures for each site for February2009 are highlighted.
North Mallee (76) Mean Anom Decile 1 2 3 4 5 6 7 8 9 10 11 12 13 14 15 16 17 18 19 20 21 22 23 24 25 26 27 28Mildura Airport 33.8 +2.3 10 42.9 42.6 40.1 40.9 41.1 43.1 46.7 34.6 26.6 24.5 24.6 27.3 26.9 30.3 31.1 32.4 33.2 32.6 36.2 30.2 28.8 30.9 36.4 28.6 30.6 34.0 39.5 30.3Ouyen (Post Office) 33.3 +1.8 9 42.8 40.0 39.1 41.0 40.9 43.4 46.8 29.4 26.2 23.7 24.0 27.0 27.4 30.1 29.6 31.5 32.0 32.9 37.2 29.5 28.8 31.4 36.5 28.0 30.9 33.4 40.0 29.9Walpeup Research 33.5 +2.3 10 42.1 40.3 39.1 40.7 40.3 43.2 48.1 29.9 26.3 23.8 24.2 27.1 27.6 30.7 31.5 32.0 33.1 33.6 36.8 28.8 28.7 31.1 36.3 28.1 30.8 33.4 40.0 29.8
South Mallee (77) Mean Anom Decile 1 2 3 4 5 6 7 8 9 10 11 12 13 14 15 16 17 18 19 20 21 22 23 24 25 26 27 28Hopetoun Airport 33.4 42.9 40.9 38.3 39.5 40.7 42.4 48.8 28.9 25.9 23.4 23.8 27.4 29.3 31.2 29.3 32.6 33.2 33.5 37.8 28.3 28.7 30.8 36.4 27.7 30.7 33.4 40.7 29.1Swan Hill Aerodrome 33.5 +1.5 7 43.0 40.8 38.3 40.0 42.5 42.6 46.9 33.9 27.1 24.3 24.3 27.9 27.7 29.9 29.6 31.9 31.1 30.6 36.9 30.6 29.7 31.8 36.2 28.3 31.1 33.3 38.8 29.8
North Wimmera (78) Mean Anom Decile 1 2 3 4 5 6 7 8 9 10 11 12 13 14 15 16 17 18 19 20 21 22 23 24 25 26 27 28Nhill Aerodrome 32.2 40.8 39.6 37.0 38.4 36.5 41.7 47.1 26.7 24.4 22.0 22.5 26.4 28.8 30.8 29.7 32.2 33.3 33.7 36.1 26.5 27.0 30.2 33.3 26.3 29.9 33.8 39.9 27.6Warracknabeal Museum 32.3 +1.7 9 42.5 39.5 35.5 38.6 39.2 41.6 46.8 26.6 24.8 22.2 22.2 26.6 28.6 30.6 28.8 32.0 32.4 33.4 36.6 26.6 27.4 30.6 35.2 26.2 29.6 32.8 39.6 27.6
South Wimmera (79) Mean Anom Decile 1 2 3 4 5 6 7 8 9 10 11 12 13 14 15 16 17 18 19 20 21 22 23 24 25 26 27 28Edenhope Airport 30.5 38.8 34.5 34.5 37.4 32.2 37.8 44.9 24.1 22.0 19.0 24.2 27.9 30.2 27.2 31.4 33.7 33.0 34.5 24.4 24.5 29.1 29.7 24.6 28.5 33.2 37.3 24.4Grampians (Mount William) 21.6 30.6 22.5 29.6 27.3 30.8 36.6 16.5 12.2 10.4 8.0 14.6 21.5 22.6 13.9 25.3 25.2 24.1 27.0 16.3 14.6 23.8 23.7 13.7 19.0 27.4 30.5 16.1Horsham Aerodrome 31.9 +1.7 8 40.9 38.3 35.2 38.0 36.4 40.4 47.4 26.8 24.4 22.1 21.7 26.1 28.5 30.6 28.6 32.0 32.9 34.1 36.1 25.9 26.8 30.2 34.2 26.2 29.5 32.8 40.7 26.5Horsham Polkemmet Rd 31.9 +2.2 9 41.2 38.4 35.6 38.4 35.4 40.6 47.6 23.9 21.5 21.3 25.7 28.5 30.4 29.0 32.0 32.6 33.6 36.0 25.5 26.6 30.0 33.6 25.6 29.6 33.0 39.3 26.9Kanagulk 30.3 38.8 35.6 33.7 37.0 32.5 38.7 45.5 24.5 23.0 21.1 20.2 24.4 27.8 30.3 27.3 30.9 32.2 33.4 35.2 23.9 24.7 29.7 31.3 23.0 27.6 32.6 38.6 24.4Longerenong 31.7 +1.8 9 41.0 38.3 34.3 37.6 36.5 40.2 47.6 26.3 23.5 20.7 21.1 25.6 28.4 30.7 27.5 32.1 32.3 33.9 36.1 25.8 26.9 30.9 34.7 25.9 29.7 33.0 40.2 26.9Pyrenees (Ben Nevis) 24.9 34.2 29.4 32.3 29.0 35.5 40.5 18.0 16.8 14.3 13.7 18.1 22.9 26.0 20.1 26.3 27.5 27.8 30.3 18.5 20.3 26.0 28.8 16.6 21.7 27.6 32.0 18.8Stawell Aerodrome 30.2 +1.8 7 39.0 35.6 32.1 36.9 35.7 38.5 45.4 25.3 22.5 20.7 19.9 24.7 27.7 30.2 25.3 31.0 31.4 32.1 34.5 24.8 25.3 29.5 32.6 23.4 26.9 31.8 38.0 25.2
Lower North (80) Mean Anom Decile 1 2 3 4 5 6 7 8 9 10 11 12 13 14 15 16 17 18 19 20 21 22 23 24 25 26 27 28Charlton 32.6 42.0 39.6 36.6 38.7 41.1 40.8 46.6 27.7 25.9 24.1 22.4 27.2 28.5 30.4 29.8 31.7 32.1 32.0 36.5 29.0 28.5 31.2 35.4 26.4 30.5 32.7 38.4 28.1Echuca Aerodrome 32.9 +2.4 9 41.6 34.9 36.1 38.4 41.7 41.3 46.8 37.0 25.8 23.9 23.1 27.1 28.6 30.2 30.0 31.5 31.2 32.1 36.2 30.8 28.3 32.5 34.4 26.9 29.2 33.1 35.7Kerang 33.2 +2.1 9 42.3 37.0 37.5 39.8 42.5 42.2 46.9 34.6 26.3 24.0 24.2 27.7 29.0 30.7 30.6 31.8 31.5 31.0 36.6 30.5 29.0 31.8 36.0 27.0 30.3 33.1 37.2 29.5Kyabram DPI 31.9 +2.2 9 40.1 35.9 37.5 41.1 40.3 46.6 34.2 25.5 23.2 22.3 26.5 28.8 29.8 29.9 31.1 30.3 31.5 35.2 30.2 28.2 31.9 33.7 25.1 28.1 32.1 34.6 28.6
Upper North (81) Mean Anom Decile 1 2 3 4 5 6 7 8 9 10 11 12 13 14 15 16 17 18 19 20 21 22 23 24 25 26 27 28Bendigo Airport 31.2 +1.9 9 40.0 35.5 34.5 37.0 40.2 39.5 45.4 28.3 23.3 22.1 21.0 25.4 28.0 30.1 28.6 30.8 30.8 29.5 34.9 27.6 26.7 31.1 33.8 25.7 28.2 31.6 34.5 28.8Shepparton Airport 32.4 +1.5 8 41.0 34.5 36.4 37.2 41.2 40.6 46.1 33.7 26.1 23.1 23.0 27.7 29.5 29.9 30.3 31.5 30.6 33.2 36.1 31.3 29.3 31.9 32.8 25.8 29.5 32.2 34.6 28.8Tatura Inst Sustainable Ag 31.3 +1.8 10 39.3 35.0 34.7 35.9 40.3 39.4 44.8 32.1 24.8 22.4 21.7 26.4 28.3 29.3 29.4 30.8 29.7 31.4 34.6 29.6 27.8 31.2 32.2 24.2 27.4 31.1 33.4 27.8Yarrawonga 33.6 +2.2 9 43.4 38.3 39.0 38.4 42.0 41.9 46.0 38.4 28.7 26.2 26.7 25.9 29.3 29.8 31.2 31.4 30.2 31.3 35.3 31.2 32.0 33.0 33.4 28.4 31.9 32.5 34.3 31.4
Lower Northeast (82) Mean Anom Decile 1 2 3 4 5 6 7 8 9 10 11 12 13 14 15 16 17 18 19 20 21 22 23 24 25 26 27 28Beechworth Woolshed 32.5 +2.6 9 41.6 36.4 37.1 36.6 40.3 40.3 44.3 37.8 30.0 25.7 25.5 24.4 28.0 28.8 31.4 30.8 29.5 30.3 33.1 28.2 31.6 32.1 31.2 28.2 30.8 31.9 31.9 32.5Benalla Airport 32.6 41.9 35.4 37.4 37.4 40.7 45.7 37.3 26.7 24.2 25.3 25.1 29.1 28.9 31.8 31.5 30.5 31.6 34.7 32.2 32.7 27.2 30.2 32.2 33.2 31.8Corryong Airport 33.1 42.2 37.2 37.5 36.5 40.3 41.7 43.6 42.5 30.6 28.0 25.6 19.7 26.2 28.9 30.1 30.2 28.9 32.0 33.1 28.0 31.6 32.1 33.5 32.6 32.4 32.5 32.4 36.8Dartmouth Reservoir 30.9 +1.7 8 36.1 34.9 31.4 34.8 38.5 40.0 41.8 39.0 21.3 23.0 21.3 25.0 26.0 28.5 28.3 29.2 31.2 32.3 25.0 28.5 30.9 31.2 30.1 30.0 31.5 31.5 34.0Hunters Hill 27.4 +2.3 8 36.6 31.2 32.4 30.9 34.5 35.9 36.9 34.0 25.0 22.6 21.1 13.6 21.7 23.8 24.8 25.4 24.2 26.9 27.6 21.7 26.7 26.8 26.7 25.5 27.2 27.5 27.1 29.7Rutherglen Research 33.0 +2.3 9 43.1 37.7 38.0 36.8 41.3 41.0 44.9 38.7 30.2 26.3 26.5 23.2 29.1 28.9 30.8 31.2 29.1 30.5 33.8 29.7 31.2 32.5 32.8 29.2 31.0 32.0 32.4 33.0Strathbogie 28.8 +1.5 9 38.1 31.9 33.7 34.1 37.3 37.1 42.0 31.6 21.0 18.9 20.0 23.2 25.8 26.0 27.9 28.7 27.7 29.2 31.4 26.6 25.1 29.1 29.1 21.9 25.3 29.1 30.0 25.0Wangaratta Aero 33.2 +2.4 9 43.3 36.6 38.6 37.4 41.5 41.4 45.8 38.9 29.6 26.7 26.4 24.9 28.7 29.1 30.9 31.2 30.0 30.7 34.5 29.5 31.7 32.5 33.5 28.1 31.8 32.1 32.4 33.1
Upper Northeast (83) Mean Anom Decile 1 2 3 4 5 6 7 8 9 10 11 12 13 14 15 16 17 18 19 20 21 22 23 24 25 26 27 28Dinner Plain (Mount Hotham Airport) 21.9 27.6 28.4 18.9 27.7 30.1 31.5 34.6 31.1 7.5 7.4 12.8 8.6 16.0 20.5 20.1 18.9 21.6 21.4 24.5 20.6 19.8 23.5 22.3 22.0 21.7 22.8 25.2 26.1Edi Upper 40.4 34.8 35.8 35.4 39.4 39.6 43.8 37.4 27.8 24.4 22.6 30.6 30.2 29.5 28.5 32.4 27.8 31.4 27.4 31.5 32.1 31.0Falls Creek 18.2 +1.0 6 26.9 22.6 20.9 22.3 25.5 26.3 28.6 24.9 10.8 6.5 9.5 4.6 11.4 17.3 16.2 15.3 18.2 18.7 19.0 13.4 16.2 17.9 17.7 17.8 19.2 20.3 19.4 22.4Mount Buller 19.1 +2.2 9 27.5 23.8 20.8 23.9 26.6 27.0 30.7 24.5 16.1 9.9 10.5 10.6 14.5 18.1 17.8 17.6 16.1 15.8 19.3 15.1 17.1 19.1 18.0 15.2 18.8 20.5 21.0 19.6Mount Hotham 16.7 +0.9 6 23.8 21.9 18.4 21.3 24.0 25.1 28.1 24.2 12.8 4.6 7.6 4.6 10.3 15.7 14.7 13.2 15.8 15.2 17.6 11.9 13.9 17.0 16.2 16.6 16.3 18.9 17.8 20.4Omeo Comparison 25.7 0.0 6 26.4 33.2 22.1 30.3 36.6 40.0 34.8 13.1 17.0 13.9 21.4 23.9 23.4 23.8 25.1 25.4 27.5 25.1 22.6 28.6 28.0 22.9 24.9Omeo 26.1 27.2 33.7 22.7 31.4 37.1 37.8 40.4 34.9 12.5 13.2 17.8 14.3 21.5 24.5 24.2 24.3 26.0 26.4 28.4 25.3 23.2 28.6 28.7 21.5 23.7 25.5 30.6 25.8
East Gippsland (84) Mean Anom Decile 1 2 3 4 5 6 7 8 9 10 11 12 13 14 15 16 17 18 19 20 21 22 23 24 25 26 27 28Combienbar AWS 23.6 -0.8 3 27.5 34.0 19.4 28.2 35.4 30.7 41.0 26.2 12.3 11.2 15.9 14.4 19.9 22.8 19.5 21.3 23.0 20.4 22.6 26.2 21.6 25.9 29.2 18.8 20.4 23.3 27.6 23.4Gabo Island Lighthouse 22.0 +0.4 7 24.4 26.0 21.7 23.8 27.3 24.4 29.7 22.1 19.2 18.1 18.4 18.7 20.9 20.7 23.0 22.3 22.0 19.5 20.2 21.3 20.8 21.6 23.6 19.0 21.7 21.7 21.7 21.7Gelantipy 22.9 0.0 4 24.1 31.5 19.3 26.8 34.2 31.0 39.2 25.6 10.4 11.1 15.8 11.7 19.3 22.5 21.7 21.6 23.0 22.6 23.4 24.9 19.4 24.8 28.6 18.0 19.4 22.5 26.6 22.1Lakes Entrance (Eastern Beach Road) 23.2 24.0 24.9 20.2 23.6 27.7 31.9 46.4 22.6 19.7 18.8 18.5 17.8 21.3 21.8 22.5 22.0 21.8 20.7 21.0 22.0 21.0 21.8 28.9 20.2 22.3 21.3 22.8 23.1Mallacoota 23.3 -0.6 3 24.3 30.0 21.2 25.4 32.1 26.5 39.7 24.3 19.9 18.2 19.2 18.9 20.8 20.8 22.8 21.8 21.8 19.2 22.5 21.8 23.5 22.4 29.0 20.5 22.0 20.7 21.5 22.3Mount Nowa Nowa 23.6 -0.8 4 21.5 27.1 17.7 25.9 35.3 28.7 43.3 20.2 17.6 15.3 18.5 15.4 20.6 22.7 22.5 23.7 25.1 23.7 22.3 24.9 21.7 23.7 29.9 21.3 21.3 21.9 26.0 23.3Orbost (Comparison) 25.4 0.0 6 24.9 28.7 20.5 28.7 35.6 32.2 44.6 22.3 19.5 17.3 19.9 18.3 22.2 24.2 23.9 24.5 26.9 24.9 23.9 25.0 24.5 25.3 32.1 21.5 23.4 23.3 27.3 25.1Orbost 25.3 24.9 28.4 20.1 28.8 35.9 32.8 45.7 22.0 19.0 16.8 20.1 17.9 21.9 24.4 24.3 24.3 26.5 24.9 23.9 24.8 24.4 25.6 32.7 21.4 22.9 23.6 27.0 24.6Point Hicks (Lighthouse) 22.6 -1.1 3 24.7 27.2 21.7 24.0 27.1 27.9 40.4 22.1 18.6 16.4 16.1 17.7 20.4 21.2 22.8 22.8 22.2 21.0 22.5 23.4 21.2 21.2 27.2 18.5 19.0 23.3 22.4 19.6
West Gippsland (85) Mean Anom Decile 1 2 3 4 5 6 7 8 9 10 11 12 13 14 15 16 17 18 19 20 21 22 23 24 25 26 27 28Bairnsdale Airport 24.9 -0.4 5 22.0 27.0 20.3 26.4 37.1 31.2 46.2 24.5 21.1 19.6 17.0 17.1 21.7 22.8 23.0 24.1 24.1 23.2 24.0 24.5 23.6 23.1 31.9 23.7 23.5 22.9 26.1 26.6East Sale Airport 25.0 -0.3 5 22.3 24.6 20.1 25.1 37.2 24.7 44.4 24.5 22.2 20.5 17.6 19.1 22.6 23.7 24.2 25.0 24.9 23.9 25.4 24.4 25.1 24.3 33.4 22.3 24.0 23.7 25.8 26.1Morwell (Latrobe Valley Airport) 26.5 0.0 6 22.4 30.7 21.3 27.5 36.5 31.1 46.3 22.9 21.8 21.3 18.9 18.7 23.9 25.8 24.8 26.0 27.8 27.6 30.5 24.0 26.6 27.3 33.6 22.0 22.8 26.1 30.5 22.7Mount Baw Baw 17.2 +0.6 7 24.2 22.2 16.5 23.2 25.7 25.8 31.3 22.3 9.2 5.3 5.2 10.7 16.8 13.6 13.4 17.3 17.6 19.1 16.5 13.6 18.0 20.0 9.1 13.6 19.4 20.8 14.7Mount Moornapa 23.8 -0.7 4 19.4 26.8 17.7 26.6 35.4 29.4 43.2 21.9 19.5 18.0 14.5 13.8 20.7 22.8 22.9 23.5 24.3 24.2 25.8 20.5 22.3 24.2 31.3 20.9 21.1 23.7 28.9 23.2Noojee (Slivar) 26.0 +0.8 8 27.1 27.4 25.0 31.0 35.0 34.4 43.2 24.1 20.4 17.1 15.0 19.0 23.5 26.0 25.3 26.5 27.8 28.0 29.6 21.5 23.4 27.2 31.1 19.5 19.0 28.9 32.0 20.2Pound Creek 25.8 22.7 25.9 24.9 28.8 28.2 28.0 46.1 21.1 20.1 19.1 17.9 21.3 24.8 27.5 26.0 27.5 28.7 27.9 28.0 22.9 22.6 27.1 32.3 19.8 21.4 27.5 33.0 21.4Willow Grove (Blue Rock Reservoir) 28.7 20.1 27.2 33.8 43.0 20.6 18.8 16.3 18.0 25.8 25.1 26.9 28.9 30.5 26.7 31.6 19.7 20.9 25.5Wilsons Promontory Lighthouse 20.6 0.0 6 18.4 19.4 19.0 22.0 25.4 23.1 42.0 19.1 16.0 15.9 16.2 17.2 18.3 19.5 19.8 19.9 19.8 20.2 22.0 19.6 20.3 21.4 27.3 16.7 19.6 19.0 20.5 18.4Yarram Airport 24.5 20.9 25.2 20.4 22.7 32.2 27.3 46.0 22.6 20.4 20.8 17.2 19.4 22.2 23.6 23.6 24.0 24.4 24.9 25.2 24.3 25.0 23.8 33.7 21.1 23.9 23.7 25.7 22.7
East Central (86) Mean Anom Decile 1 2 3 4 5 6 7 8 9 10 11 12 13 14 15 16 17 18 19 20 21 22 23 24 25 26 27 28Bundoora (Latrobe University) 27.7 +1.0 8 35.0 27.5 29.5 33.0 32.0 33.0 46.5 21.3 20.5 19.7 18.5 23.2 26.6 27.7 28.4 29.5 31.5 29.8 30.4 24.0 22.0 26.3 35.0 19.4 20.4 30.6 34.0 21.5Cerberus 25.7 +0.9 8 26.0 25.3 27.2 30.4 28.6 26.6 45.8 20.2 19.9 19.4 19.0 21.0 25.4 26.8 26.7 28.2 28.8 27.6 26.4 21.6 21.2 22.6 33.1 19.7 19.8 28.4 33.9 20.8Coldstream 28.7 +1.3 8 33.9 30.2 29.8 35.4 34.9 37.7 44.8 21.7 21.4 19.9 18.0 23.2 26.4 28.8 28.7 30.1 30.5 31.3 31.7 24.1 24.6 29.9 34.2 21.1 22.2 31.7 34.0 22.7Cranbourne Botanic Gardens 26.3 +0.8 8 26.5 27.6 28.0 32.5 29.5 46.0 20.5 20.0 19.0 18.8 20.4 24.5 27.4 28.0 27.7 28.9 29.3 29.0 23.0 21.0 24.5 33.5 20.3 19.5 29.3 34.0 20.4Essendon Airport 27.8 +2.4 9 34.8 28.1 29.6 30.4 30.8 34.4 47.3 22.1 20.4 20.2 19.1 23.2 26.7 28.0 28.0 29.0 30.8 28.8 30.3 23.6 22.7 25.8 35.1 20.0 21.9 30.5 35.6 22.4Ferny Creek (Dunns Hill) 23.8 +1.5 8 28.3 26.3 23.4 30.0 29.3 31.2 41.8 16.2 15.8 14.9 12.2 17.7 21.6 23.8 24.0 25.0 25.5 26.9 28.0 19.7 19.2 24.8 30.7 17.0 16.6 27.1 30.9 17.1Frankston AWS 25.5 +0.9 8 26.5 24.7 28.9 32.0 22.9 30.3 35.9 20.6 19.6 19.1 18.2 21.4 25.1 27.1 27.2 28.3 29.4 28.0 27.7 20.3 22.3 25.2 33.0 17.8 19.7 29.3 33.2 19.9Melbourne Airport 27.9 +1.4 9 34.1 28.8 28.7 31.6 32.2 33.5 46.8 20.9 20.3 19.7 17.7 22.9 26.4 27.3 27.5 29.0 31.2 30.0 30.4 25.9 22.9 26.4 35.0 20.4 21.7 30.6 35.5 22.7Melbourne Regional Office 28.1 +2.3 10 33.8 28.5 30.2 30.2 29.2 33.1 46.4 22.5 21.4 21.2 20.2 23.7 28.0 28.4 29.6 30.1 31.7 27.8 30.5 24.6 23.8 25.5 35.0 21.3 21.6 31.2 34.0 23.2Moorabbin Airport 27.3 +1.4 8 34.6 27.2 29.4 28.1 28.6 31.1 46.7 21.8 20.9 20.6 19.1 23.3 27.0 27.4 28.8 30.1 30.5 26.9 28.0 23.1 22.9 26.6 33.8 20.0 21.5 30.2 34.4 21.8Phillip Island Penguin Reserve 24.0 +0.1 6 23.4 23.9 23.1 25.9 26.0 27.3 39.2 21.0 19.0 19.0 18.4 19.6 25.9 24.8 21.9 28.2 26.1 24.0 22.7 21.4 21.0 21.1 30.3 18.6 19.5 27.1 32.0 20.5Rhyll 25.1 +1.0 8 25.3 26.2 25.3 29.8 26.3 25.5 42.1 20.6 20.6 19.7 18.5 19.3 26.1 26.6 25.4 28.6 28.9 26.9 25.9 22.1 21.8 23.0 32.0 18.5 19.5 27.3 31.3 20.0Scoresby Research Institute 28.0 +1.6 9 36.7 28.4 28.1 33.7 32.0 34.4 46.1 20.7 20.8 19.8 18.0 22.7 26.2 28.9 28.2 29.4 30.1 30.0 31.0 23.4 23.8 28.4 34.8 20.1 21.1 31.0 34.0 21.6Viewbank (ARPANSA) 28.4 35.9 28.1 30.4 34.2 32.1 34.8 46.7 21.7 20.8 20.0 19.0 23.4 27.0 28.9 29.4 30.0 32.0 30.4 31.3 23.9 23.2 27.2 35.0 20.1 21.2 31.4 34.4 22.6Wallan (Kilmore Gap) 26.0 +1.7 8 34.6 27.8 27.3 32.7 34.4 35.5 42.7 19.1 17.7 16.4 15.5 20.2 23.3 26.2 25.7 26.8 28.0 28.4 29.2 22.9 19.8 27.4 30.7 17.4 18.5 28.7 30.7 19.9Wonthaggi 25.4 +0.8 8 22.5 25.6 25.0 29.7 26.5 25.0 45.0 21.6 19.1 19.2 19.0 20.0 24.7 27.5 25.5 27.8 30.0 27.4 27.0 22.0 22.0 23.5 32.0 19.4 20.1 28.0 34.0 20.8
West Central (87) Mean Anom Decile 1 2 3 4 5 6 7 8 9 10 11 12 13 14 15 16 17 18 19 20 21 22 23 24 25 26 27 28Avalon Airport 27.1 +1.1 7 26.2 27.5 28.4 27.7 30.6 27.3 47.9 22.8 21.4 20.3 20.8 22.7 26.0 27.5 26.0 28.6 29.7 27.7 28.4 24.7 23.7 24.8 36.0 21.3 21.3 28.0 37.1 23.1Grovedale (Geelong Airport) 25.5 +0.7 7 23.8 25.6 25.3 25.2 29.0 26.0 47.4 22.5 19.9 19.2 18.7 21.3 25.7 26.5 22.7 27.8 27.5 24.9 26.1 23.1 22.0 22.4 34.7 20.0 20.4 26.4 36.4 22.5Laverton RAAF 27.1 +1.6 9 31.6 28.0 28.0 29.2 29.5 35.1 47.5 21.3 20.4 19.8 18.7 22.0 25.7 26.9 26.6 28.4 29.0 27.1 27.8 24.4 21.9 24.4 35.4 19.8 21.0 28.5 37.1 23.1Sheoaks 26.7 +1.6 8 25.9 30.1 26.5 29.3 31.3 36.0 45.2 22.7 18.9 17.7 17.9 21.9 25.3 27.6 23.9 27.6 29.2 30.7 30.8 21.4 22.9 24.9 32.3 21.0 20.0 28.3 35.0 23.9
North Central (88) Mean Anom Decile 1 2 3 4 5 6 7 8 9 10 11 12 13 14 15 16 17 18 19 20 21 22 23 24 25 26 27 28Castlemaine Prison 29.0 +0.7 7 37.9 34.2 30.1 36.0 37.6 38.0 43.9 23.9 20.7 17.7 18.4 22.5 26.9 28.8 27.6 29.6 29.9 27.1 32.3 25.2 23.8 29.8 32.2 23.0 25.8 30.9 33.4 26.0Eildon Fire Tower 28.0 +1.2 7 37.2 31.7 33.8 34.3 36.0 36.7 41.7 26.1 20.8 17.9 20.1 21.9 25.6 24.9 27.4 28.8 27.1 29.0 29.8 24.7 23.4 29.7 28.8 20.5 24.3 29.6 29.7 23.2Lake Eildon 30.7 +1.8 9 39.1 34.2 34.8 36.4 39.6 39.2 45.4 28.0 23.0 21.1 22.0 24.6 28.5 28.0 30.2 31.5 29.4 30.2 32.3 28.0 28.0 31.3 32.0 24.0 27.2 32.4 32.7 27.5Mangalore Airport 31.0 +1.8 9 40.1 33.7 33.8 36.8 40.7 40.3 46.1 28.7 24.0 21.9 21.4 25.1 28.2 30.2 29.4 31.2 30.6 31.6 34.2 28.3 26.8 31.9 33.3 23.3 25.7 31.3 34.0 26.2Maryborough 30.3 +1.6 8 40.2 34.9 31.9 37.1 38.2 38.9 45.4 25.4 25.0 19.6 20.8 24.1 27.8 29.7 27.2 30.2 29.4 31.4 34.4 24.6 26.2 30.4 33.3 23.0 26.8 31.7 35.5 25.4Redesdale 30.1 +1.5 7 38.5 32.6 32.2 36.9 39.4 39.3 45.0 26.6 21.9 20.6 19.5 23.8 27.9 29.9 28.0 30.6 30.1 28.8 34.3 28.1 24.7 29.9 33.3 23.9 25.8 30.7 34.6 26.5
Western Plains (89) Mean Anom Decile 1 2 3 4 5 6 7 8 9 10 11 12 13 14 15 16 17 18 19 20 21 22 23 24 25 26 27 28Ararat Prison 28.7 +1.8 9 38.2 33.1 30.0 34.8 31.6 38.4 44.7 23.0 20.7 18.3 18.8 23.0 26.7 29.0 22.9 30.2 31.2 31.8 33.4 22.7 24.0 29.5 32.1 20.7 25.1 31.7 36.7 22.6Ballarat Aerodrome 27.3 +2.4 9 34.7 32.0 27.3 34.7 33.0 36.7 44.1 21.3 18.9 17.2 18.0 21.0 24.5 27.4 23.5 28.7 29.1 30.4 31.3 20.9 23.3 28.5 31.8 19.8 22.3 30.2 32.4 22.0Westmere 28.4 31.4 32.6 29.7 34.3 28.9 37.9 45.5 23.8 20.5 19.3 18.0 23.5 26.5 29.7 24.1 30.1 31.6 31.9 33.7 21.6 24.0 28.7 31.9 20.3 24.6 31.9 37.7 21.7
West Coast (90) Mean Anom Decile 1 2 3 4 5 6 7 8 9 10 11 12 13 14 15 16 17 18 19 20 21 22 23 24 25 26 27 28Aireys Inlet 23.4 +0.5 8 22.1 21.5 22.0 23.5 23.0 24.3 45.3 22.3 19.3 18.6 17.3 19.5 21.3 22.4 21.2 23.9 23.5 23.4 22.7 21.6 22.0 21.2 31.5 19.1 20.7 23.3 36.9 20.7Cape Nelson Lighthouse 21.1 -0.1 7 22.9 19.9 20.6 22.3 20.8 23.3 32.5 18.9 18.4 17.1 16.5 17.6 20.1 21.4 19.5 20.6 21.5 23.7 25.7 19.6 18.7 20.0 21.9 18.0 18.6 24.2 28.2 18.9Cape Otway Lighthouse 21.1 -0.5 5 20.5 18.8 20.6 20.8 19.6 25.5 39.4 19.3 18.3 17.1 17.0 17.3 19.1 20.7 18.6 20.6 20.5 21.1 21.8 18.7 20.0 19.6 24.7 17.2 19.1 21.3 34.7 18.1
Monthly Weather Review Victoria February 2009
page 12

Daily and mean maximum temperatures for February 2009Mean is the average of the daily maximum temperature for February 2009; it is only shown if there are sufficient days available. Anom is thedifference between the mean daily maximum temperature for February 2009 and the long-term average maximum temperature forFebruary. Decile is the decile rank of mean daily maximum temperature for February 2009 in the climate record of other February meandaily maximum temperatures; “L” indicates this is the lowest on record, and “H” it is the highest on record. Anomalies and deciles are onlyshown if there are sufficient years of climate record available. The lowest and highest maximum temperatures for each site for February2009 are highlighted.Casterton Showgrounds 29.0 +1.6 9 36.4 33.2 32.2 35.8 28.0 36.3 42.9 23.0 21.0 19.8 17.5 22.2 27.8 30.3 25.1 31.0 34.0 33.3 34.2 24.0 21.8 29.8 28.8 22.5 26.2 33.3 37.1 23.2Casterton 28.7 37.3 32.2 32.3 36.1 27.2 35.6 42.9 23.4 20.4 19.3 16.7 22.5 27.5 29.6 25.2 30.8 34.1 33.5 34.0 22.8 21.4 29.6 28.6 22.6 26.1 32.9 37.5 22.6Colac (Mount Gellibrand) 25.9 25.2 31.3 25.2 27.5 27.7 30.2 45.4 22.0 19.8 18.7 15.9 21.1 22.7 27.6 21.7 25.1 28.9 30.7 31.7 20.8 23.1 24.4 31.3 19.7 23.3 25.5 36.4 20.9Hamilton Airport 28.5 +1.9 9 36.6 30.5 31.1 34.5 28.5 36.5 44.5 22.5 20.9 19.4 17.6 22.6 26.9 30.0 25.3 30.4 32.9 32.0 33.7 22.7 21.1 29.2 29.9 20.1 24.7 31.9 38.8 22.6Heywood Forestry 32.3 24.4 26.0 30.0 24.2 28.0 39.0 19.4 17.0 25.3 25.5 30.5 33.5 24.2 26.3Mortlake Racecourse 27.4 +1.4 8 31.5 29.0 29.1 33.5 24.5 31.7 46.0 21.9 19.8 18.8 17.4 22.9 26.4 28.8 25.1 30.0 32.7 32.6 33.5 19.9 21.7 28.1 30.3 18.8 23.0 31.3 37.6 21.0Port Fairy AWS 23.0 +0.2 6 25.0 22.6 23.1 24.0 22.4 24.8 41.6 21.8 19.3 18.2 17.2 20.2 22.5 21.9 20.9 22.5 22.9 23.8 24.8 20.6 19.9 21.3 25.6 19.1 20.5 23.1 35.9 19.6Portland (Cashmore Airport) 22.7 +0.4 7 26.1 21.4 24.0 26.2 20.4 26.8 33.8 20.4 17.9 17.2 16.7 17.7 22.9 21.9 21.0 23.7 25.8 31.3 27.6 20.4 18.9 21.7 21.8 17.9 19.3 24.4 30.1 19.5Warrnambool Airport NDB 25.8 +1.2 8 30.6 25.5 27.2 28.0 22.8 29.3 44.8 21.3 20.1 19.0 17.2 21.2 26.8 24.2 22.1 26.7 31.6 31.9 32.5 20.5 19.6 23.2 28.8 19.6 20.6 28.4 37.8 20.4Weeaproinah 21.3 +1.0 8 23.0 21.5 20.0 28.0 22.8 27.7 39.0 17.0 14.8 13.3 12.7 13.4 17.8 24.5 17.0 21.2 27.0 27.0 27.2 15.6 16.4 22.8 25.3 14.0 16.1 24.1 33.2 14.2
Monthly Weather Review Victoria February 2009
page 13

Daily and mean minimum temperatures for February 2009Mean is the average of the daily minimum temperature for February 2009; it is only shown if there are sufficient days available. Anom is thedifference between the mean daily minimum temperature for February 2009 and the long-term average minimum temperature forFebruary. Decile is the decile rank of mean daily minimum temperature for February 2009 in the climate record of other February mean dailyminimum temperatures; “L” indicates this is the lowest on record, and “H” it is the highest on record. Anomalies and deciles are only shownif there are sufficient years of climate record available. The lowest and highest minimum temperatures for each site for February 2009 arehighlighted.
North Mallee (76) Mean Anom Decile 1 2 3 4 5 6 7 8 9 10 11 12 13 14 15 16 17 18 19 20 21 22 23 24 25 26 27 28Mildura Airport 17.2 +0.8 7 24.6 24.6 24.8 22.5 20.1 22.5 26.1 22.2 14.8 12.0 10.2 10.8 13.3 17.0 17.3 18.5 18.2 15.4 16.7 18.3 14.3 13.8 14.2 11.9 10.8 14.8 17.4 14.5Ouyen (Post Office) 16.1 +0.9 8 24.0 24.0 21.5 21.6 20.9 20.2 22.6 20.4 13.2 10.2 9.8 10.8 13.9 15.9 17.4 16.0 17.5 15.4 16.7 17.4 13.0 12.6 14.0 9.9 10.0 13.1 15.9 12.4Walpeup Research 15.7 +0.4 6 23.3 23.8 20.3 20.3 19.0 19.8 24.0 18.8 12.0 8.8 7.8 8.6 13.7 16.0 16.9 15.5 18.1 18.4 18.7 16.3 11.3 11.9 16.3 8.3 9.8 13.7 17.6 10.5
South Mallee (77) Mean Anom Decile 1 2 3 4 5 6 7 8 9 10 11 12 13 14 15 16 17 18 19 20 21 22 23 24 25 26 27 28Hopetoun Airport 14.7 23.0 23.2 19.9 19.6 20.7 17.7 22.3 18.7 11.0 9.3 8.5 9.4 12.2 12.9 16.8 14.6 16.5 13.7 15.6 16.6 11.8 12.4 11.4 8.0 8.7 10.1 14.1 11.7Swan Hill Aerodrome 16.1 +0.3 6 24.1 24.8 21.8 20.3 21.0 19.7 24.2 22.4 13.5 11.1 10.5 11.0 12.5 14.9 15.0 15.8 18.0 18.5 15.6 19.2 12.6 12.4 13.3 10.4 9.6 11.5 12.9 12.9
North Wimmera (78) Mean Anom Decile 1 2 3 4 5 6 7 8 9 10 11 12 13 14 15 16 17 18 19 20 21 22 23 24 25 26 27 28Nhill Aerodrome 13.7 23.0 23.8 16.3 16.5 18.8 14.9 20.4 16.5 8.4 7.4 9.0 7.9 11.1 12.8 15.3 12.4 17.2 17.1 15.9 13.7 13.0 8.5 12.7 7.4 4.5 10.8 16.0 11.1Warracknabeal Museum 14.3 +0.2 6 22.2 22.4 19.0 17.2 20.5 16.5 20.2 17.6 9.8 8.0 7.8 9.8 10.5 13.0 17.0 14.8 16.0 15.5 15.4 16.0 14.0 11.4 12.6 8.5 7.2 11.6 15.4 10.0
South Wimmera (79) Mean Anom Decile 1 2 3 4 5 6 7 8 9 10 11 12 13 14 15 16 17 18 19 20 21 22 23 24 25 26 27 28Edenhope Airport 13.2 20.7 19.8 17.4 14.2 15.2 13.7 19.0 15.6 7.2 8.6 9.3 8.5 11.3 14.2 14.2 15.0 16.8 14.6 14.0 13.7 8.9 11.4 7.3 4.9 10.5 16.2 13.3Grampians (Mount William) 10.1 15.4 20.5 12.7 19.4 17.4 20.5 9.4 3.0 2.4 2.3 2.8 3.7 10.2 8.5 8.3 13.0 14.6 15.4 8.3 6.2 5.8 12.2 3.2 3.6 9.4 17.7 8.0Horsham Aerodrome 12.4 +0.2 6 21.7 20.8 14.7 14.8 17.9 13.0 20.3 16.8 7.5 5.0 7.1 8.6 10.3 11.3 13.8 10.8 16.8 14.8 13.0 15.1 13.1 9.2 10.0 5.8 2.5 9.5 11.7 10.6Horsham Polkemmet Rd 13.0 -0.3 5 21.8 22.2 15.5 16.4 18.5 14.1 18.5 16.6 9.2 7.0 9.5 8.2 10.0 12.2 14.2 10.7 16.2 16.9 14.6 14.9 13.4 7.9 11.8 6.2 4.1 7.9 14.9 11.0Kanagulk 13.2 20.6 20.0 17.4 15.4 17.1 13.5 18.8 14.8 9.7 8.4 10.6 9.8 8.7 10.6 14.4 13.3 15.7 17.6 14.0 14.0 12.6 10.3 11.5 8.2 7.1 8.5 15.0 12.5Longerenong 13.6 +0.5 6 24.2 22.4 18.4 16.5 18.1 15.1 19.9 16.8 8.8 6.1 7.8 7.5 9.5 12.1 14.5 14.6 16.8 16.1 14.7 15.0 12.9 13.0 10.4 8.0 4.6 12.3 14.7 9.6Pyrenees (Ben Nevis) 12.5 20.4 23.3 16.9 18.0 22.7 17.1 24.2 11.0 5.9 4.8 4.9 5.6 6.6 11.1 11.0 12.7 14.2 15.1 18.4 9.5 8.2 8.7 13.2 5.9 5.2 11.2 16.3 8.0Stawell Aerodrome 13.9 +0.4 6 19.7 19.6 18.6 13.5 17.9 13.8 19.5 16.4 11.5 10.3 10.4 10.7 9.0 10.4 14.5 15.0 13.7 14.7 14.5 15.2 13.4 14.2 12.4 11.2 10.3 10.1 15.5 14.2
Lower North (80) Mean Anom Decile 1 2 3 4 5 6 7 8 9 10 11 12 13 14 15 16 17 18 19 20 21 22 23 24 25 26 27 28Charlton 15.2 22.5 22.8 19.2 16.8 19.5 17.3 22.9 19.1 11.7 9.4 9.3 11.4 12.5 14.5 15.5 14.4 18.7 15.2 15.5 17.9 13.7 13.8 13.0 9.8 9.5 11.0 16.4 12.2Echuca Aerodrome 15.6 +0.4 7 20.8 22.0 19.8 17.1 19.6 17.0 22.2 23.1 13.9 11.8 11.8 12.2 11.3 11.3 13.8 14.2 15.6 18.0 15.7 22.2 13.1 14.2 12.4 11.2 9.7 12.0 15.4Kerang 15.9 +0.8 8 23.2 23.4 20.2 18.8 20.6 18.3 21.7 23.7 13.4 11.4 11.4 12.2 11.9 14.3 14.0 15.3 17.9 18.4 15.3 19.1 13.0 14.2 12.9 11.5 8.8 11.9 15.3 13.2Kyabram DPI 15.4 +0.7 7 21.5 21.9 17.5 18.2 16.7 21.8 21.9 14.5 10.6 10.8 13.6 11.6 12.3 13.0 16.2 14.5 17.2 14.9 21.8 13.1 15.0 11.4 11.4 10.3 13.7 15.4 15.9
Upper North (81) Mean Anom Decile 1 2 3 4 5 6 7 8 9 10 11 12 13 14 15 16 17 18 19 20 21 22 23 24 25 26 27 28Bendigo Airport 14.7 +0.6 6 24.2 22.1 18.7 16.4 18.0 16.0 21.2 20.5 12.2 10.4 10.9 12.0 10.3 10.8 12.5 15.1 15.0 14.3 13.1 17.6 12.2 13.5 12.5 10.9 11.0 12.9 14.0 13.0Shepparton Airport 15.1 +0.4 6 20.7 21.2 19.7 16.4 17.8 16.2 22.2 22.2 14.5 11.9 11.5 12.7 7.4 9.8 11.4 13.6 12.3 16.8 15.0 20.9 14.9 14.1 10.9 13.0 12.0 11.3 15.2 16.5Tatura Inst Sustainable Ag 14.5 +0.1 6 20.6 20.0 19.2 16.6 17.0 16.3 20.4 21.4 14.1 11.5 11.5 12.9 8.2 9.2 10.5 13.7 12.0 14.4 12.6 19.1 13.9 14.4 9.4 12.6 11.7 12.5 13.1 16.1Yarrawonga 16.6 +1.1 7 23.8 24.3 20.9 23.2 21.3 20.1 23.1 25.3 16.1 11.9 12.0 12.8 12.1 12.8 12.1 13.8 15.0 19.3 17.8 19.6 13.5 14.2 12.6 12.9 9.1 12.8 15.8 16.5
Lower Northeast (82) Mean Anom Decile 1 2 3 4 5 6 7 8 9 10 11 12 13 14 15 16 17 18 19 20 21 22 23 24 25 26 27 28Beechworth Woolshed 13.2 +0.1 7 23.3 20.8 17.0 18.2 17.0 17.4 20.4 27.1 16.0 9.3 8.1 10.0 7.7 7.4 8.6 9.6 9.4 15.8 10.6 14.4 8.0 12.3 10.7 8.3 3.9 11.0 13.6 14.8Benalla Airport 15.1 24.0 21.3 22.3 17.8 17.9 19.1 20.2 15.8 12.6 11.8 13.8 9.7 11.3 10.9 14.3 11.4 16.2 16.2 20.4 8.7 12.5 9.9 12.5 13.3 13.9Corryong Airport 13.3 20.9 21.1 18.0 17.5 17.0 21.0 18.2 25.7 17.9 12.8 12.8 14.2 7.5 5.7 8.5 10.0 6.6 14.5 13.6 13.1 9.6 9.1 11.0 10.0 5.3 9.6 9.0 11.0Dartmouth Reservoir 14.5 +1.0 8 24.0 18.7 20.1 16.5 16.0 18.5 18.0 23.0 14.5 12.4 14.0 13.0 9.9 12.0 11.5 9.6 12.5 13.5 14.4 15.2 15.0 11.3 10.0 11.0 12.7 12.4 12.5Hunters Hill 15.0 +1.1 7 23.9 20.1 18.8 17.5 20.4 22.7 22.8 26.3 14.5 9.0 7.7 9.5 7.8 9.4 11.4 11.6 10.6 13.0 15.1 16.3 13.2 13.1 15.3 14.5 12.4 11.3 13.7 17.1Rutherglen Research 14.8 +0.9 7 21.1 23.7 18.5 19.7 18.1 19.2 21.2 24.3 16.2 12.6 10.2 12.5 9.0 10.5 11.6 11.8 11.3 17.7 13.8 16.6 11.8 12.2 11.6 12.2 6.0 9.9 13.9 16.1Strathbogie 12.0 +0.4 7 23.2 17.9 16.4 13.2 12.3 12.9 17.8 20.1 11.2 8.1 8.4 9.2 9.6 5.9 8.7 12.2 8.2 14.5 9.1 16.1 11.5 10.3 6.9 9.9 8.1 10.4 9.9 12.6Wangaratta Aero 14.0 +0.4 7 22.0 23.7 17.4 17.3 17.0 17.9 19.5 22.8 15.4 11.6 9.1 11.0 8.6 9.8 10.5 12.3 11.2 17.2 13.7 16.8 12.0 12.4 9.4 12.9 5.8 11.0 11.8 12.8
Upper Northeast (83) Mean Anom Decile 1 2 3 4 5 6 7 8 9 10 11 12 13 14 15 16 17 18 19 20 21 22 23 24 25 26 27 28Dinner Plain (Mount Hotham Airport) 7.7 13.5 14.8 14.1 10.2 12.8 11.8 14.8 21.7 5.5 3.4 2.8 4.7 1.7 -0.6 5.1 5.1 2.0 8.9 4.4 8.6 7.5 5.8 7.9 4.4 1.8 2.2 7.6 13.2Edi Upper 15.1 +1.3 8 21.8 20.2 18.4 17.4 18.6 19.0 21.2 24.2 15.4 9.8 9.4 11.2 9.4 11.6 16.0 13.2 17.7 14.8 11.6 8.0 11.2 13.3 15.0Falls Creek 8.0 -0.4 6 16.5 13.5 11.5 15.0 16.2 19.3 5.6 1.6 0.6 1.0 0.5 2.1 6.4 5.0 4.9 8.9 9.2 9.5 6.9 5.7 10.2 8.4 8.1 3.3 6.3 12.9Mount Buller 10.0 +1.3 8 20.6 18.0 13.4 13.0 14.0 16.4 19.4 19.8 11.3 1.0 -1.2 2.4 1.4 5.7 6.3 8.0 7.4 8.8 9.6 8.5 7.6 7.5 11.0 8.0 6.2 10.7 11.3 13.0Mount Hotham 7.6 -0.3 5 15.3 15.6 10.7 9.5 12.1 14.9 17.9 18.7 3.7 0.2 -0.9 -0.1 -0.9 1.2 5.7 3.7 4.6 7.3 8.3 7.6 5.7 4.9 9.2 8.2 6.4 3.6 9.2 11.5Omeo Comparison 10.2 +0.6 7 15.9 15.6 16.8 15.1 14.4 13.0 16.7 10.0 7.9 8.8 5.4 3.6 7.9 10.6 5.2 11.9 8.8 8.9 11.8 7.6 8.5 2.2 8.9 9.6Omeo 10.6 16.0 16.1 16.7 15.0 15.3 12.3 16.1 21.3 10.0 8.6 7.9 8.7 5.4 2.7 10.3 10.5 4.5 11.9 8.8 8.8 11.7 6.5 9.1 11.0 1.8 9.0 9.8 11.1
East Gippsland (84) Mean Anom Decile 1 2 3 4 5 6 7 8 9 10 11 12 13 14 15 16 17 18 19 20 21 22 23 24 25 26 27 28Combienbar AWS 12.6 -0.7 4 16.7 18.5 16.3 15.1 18.1 13.8 16.6 19.9 10.6 9.2 7.7 8.4 8.4 9.2 10.9 11.7 10.9 13.1 11.9 12.5 11.1 11.4 14.4 10.8 7.0 10.4 11.4 17.6Gabo Island Lighthouse 16.8 +0.6 8 18.4 20.4 18.9 18.5 19.4 18.9 19.5 20.5 15.4 14.7 14.6 13.0 12.6 14.6 15.6 17.7 16.5 17.0 16.4 15.3 15.8 15.6 18.8 16.3 13.9 17.1 16.0 18.0Gelantipy 11.0 -0.3 5 15.8 16.0 15.5 15.6 16.0 13.0 18.3 17.9 9.0 7.4 7.0 7.9 4.3 7.0 7.5 10.1 8.6 12.8 9.4 10.2 10.3 8.6 13.6 9.5 4.0 8.4 10.8 13.4Lakes Entrance (Eastern Beach Road) 14.6 19.5 19.0 18.6 18.3 16.9 18.2 18.3 16.7 15.0 13.0 12.2 12.5 9.1 11.0 11.5 15.6 13.6 15.6 11.0 12.0 13.9 14.0 13.7 15.5 13.1 14.0 11.2 14.5Mallacoota 15.5 0.0 6 18.4 20.9 18.5 18.2 18.8 17.0 18.8 21.5 14.3 13.6 12.8 12.1 12.6 12.8 13.3 16.7 15.3 16.2 16.3 12.8 14.1 13.6 17.1 15.4 10.3 14.2 12.5 16.3Mount Nowa Nowa 13.6 -0.6 5 17.5 17.5 16.6 15.5 16.8 16.0 17.7 17.6 11.2 10.5 9.2 9.7 10.0 10.9 12.8 12.7 11.9 13.9 13.3 14.5 13.1 13.0 15.9 12.6 9.9 12.6 12.4 14.7Orbost (Comparison) 13.4 -0.1 5 19.4 17.8 18.2 16.7 16.1 16.8 16.9 18.8 13.7 13.6 11.7 11.9 8.2 8.6 9.6 12.3 10.3 14.1 11.0 10.3 15.1 9.4 11.2 15.6 11.7 13.0 8.9 14.2Orbost 13.8 19.2 18.2 17.9 16.6 16.6 17.5 17.4 19.3 13.2 13.3 11.6 11.7 8.9 10.0 10.9 13.4 11.7 15.3 11.5 10.8 15.0 10.1 12.3 15.4 11.6 13.4 9.6 15.2Point Hicks (Lighthouse) 16.0 -0.1 5 19.4 19.4 18.3 18.1 18.7 18.1 19.1 20.1 15.3 13.2 13.6 12.3 11.7 14.0 14.8 17.0 15.0 16.4 15.8 15.0 15.8 14.6 17.4 15.2 13.8 15.5 15.0 15.1
West Gippsland (85) Mean Anom Decile 1 2 3 4 5 6 7 8 9 10 11 12 13 14 15 16 17 18 19 20 21 22 23 24 25 26 27 28Bairnsdale Airport 13.0 +0.4 8 18.8 18.8 17.9 17.6 18.2 14.0 17.4 18.8 14.1 9.7 9.1 11.8 8.0 10.4 9.6 13.9 9.6 12.7 10.7 10.9 12.4 10.7 11.4 14.3 9.6 11.6 8.7 14.5East Sale Airport 13.5 +0.4 7 18.7 18.5 17.9 17.8 18.8 14.4 15.7 18.6 14.0 10.7 7.9 12.4 8.5 9.4 12.0 16.1 12.2 13.5 11.6 11.3 10.6 11.6 12.0 13.3 11.4 12.6 11.3 14.6Morwell (Latrobe Valley Airport) 13.9 +1.2 9 18.7 19.5 18.0 17.4 18.5 15.3 16.5 17.6 13.0 5.2 8.2 11.4 8.2 9.7 13.8 14.1 14.8 13.4 12.4 14.1 12.8 14.9 14.5 11.1 13.5 13.0 13.3 15.6Mount Baw Baw 8.0 -0.1 5 16.4 19.0 11.0 10.1 15.3 15.2 17.4 14.6 2.1 0.0 0.8 2.0 1.4 3.3 6.3 5.9 6.6 8.4 9.9 11.2 3.8 6.9 11.6 1.3 1.4 5.2 7.8 9.4Mount Moornapa 12.7 -0.7 5 16.7 16.3 16.2 15.0 15.9 14.2 15.2 15.9 10.0 9.2 8.4 8.8 9.3 9.8 12.0 12.1 11.7 13.8 14.2 13.8 12.4 12.4 15.5 10.9 8.6 11.8 12.6 13.3Noojee (Slivar) 11.4 +0.6 7 17.1 15.4 18.8 13.0 15.2 15.9 15.2 17.2 12.1 7.5 6.9 10.1 4.6 6.1 9.1 8.6 8.8 10.3 12.8 12.0 12.4 13.9 10.4 9.5 9.8 6.9 9.4 10.9Pound Creek 12.9 18.7 19.1 17.9 17.3 12.7 9.6 17.7 15.4 13.4 7.4 13.2 3.5 7.2 9.2 13.2 15.0 13.3 12.5 9.8 12.0 15.6 10.1 11.4 14.0 14.2 6.0 14.9 16.9Willow Grove (Blue Rock Reservoir) 16.5 17.8 11.5 16.7 16.0 9.5 10.0 11.0 10.5 8.9 13.7 13.8 13.5 12.2 12.0 12.1 12.7Wilsons Promontory Lighthouse 15.9 +1.1 9 17.1 17.0 16.0 16.2 17.3 14.5 16.5 17.4 13.7 13.1 13.2 13.2 13.8 16.4 16.9 17.1 16.7 17.7 17.3 16.7 16.1 16.0 17.4 14.0 13.9 15.8 16.7 17.1Yarram Airport 13.7 17.9 18.6 17.2 17.0 18.2 11.9 16.6 17.8 10.4 7.2 9.5 12.2 10.2 10.0 16.3 16.2 14.0 12.9 10.7 11.7 12.9 14.6 14.6 11.6 13.4 11.1 14.5 14.1
East Central (86) Mean Anom Decile 1 2 3 4 5 6 7 8 9 10 11 12 13 14 15 16 17 18 19 20 21 22 23 24 25 26 27 28Bundoora (Latrobe University) 14.6 +0.5 7 19.3 20.5 19.5 16.0 16.5 16.5 18.5 17.5 14.2 11.8 11.8 13.7 8.2 10.9 11.2 12.6 12.2 14.3 14.0 16.7 16.0 16.0 13.4 12.4 13.4 12.1 14.1 15.0Cerberus 15.3 +1.2 8 18.0 20.0 18.6 18.9 17.4 16.6 17.2 15.3 14.4 13.1 12.8 14.2 13.9 14.6 16.5 16.6 15.3 10.5 12.2 13.9 16.0 15.3 14.8 13.4 14.4 11.0 16.5 16.7Coldstream 11.8 0.0 6 16.4 16.3 19.5 12.4 13.3 14.9 18.1 18.0 13.3 10.3 8.4 7.7 7.7 6.8 8.9 8.9 8.5 8.4 8.6 14.4 15.0 14.7 9.4 11.4 8.6 6.6 10.1 14.7Cranbourne Botanic Gardens 13.9 0.0 5 17.5 17.0 18.8 18.0 17.0 15.5 16.0 15.5 12.5 10.0 12.0 10.6 10.2 8.0 15.6 15.5 13.8 12.1 12.5 15.0 15.3 15.0 13.5 10.5 11.9 11.0 14.5 15.5Essendon Airport 14.8 +1.1 8 18.9 20.0 19.5 16.5 16.9 18.0 18.3 17.4 15.3 13.1 12.2 13.8 8.3 10.3 11.7 13.7 13.8 15.0 14.4 16.0 15.0 16.5 12.7 11.2 13.4 12.9 14.3 14.3Ferny Creek (Dunns Hill) 12.3 -0.3 6 15.8 16.2 16.0 13.0 14.5 13.2 13.5 14.3 9.4 7.4 8.2 8.7 9.0 12.1 11.7 13.3 14.3 15.3 15.3 13.7 12.1 12.0 12.7 8.9 9.0 10.8 13.0 11.8Frankston AWS 16.2 +0.4 6 19.9 19.8 19.5 19.0 19.5 16.5 17.7 18.1 13.6 12.7 13.0 13.9 13.7 14.1 16.3 17.1 15.8 15.4 15.7 18.0 16.4 16.1 16.4 13.8 14.9 14.2 16.1 17.2Melbourne Airport 14.3 +0.2 6 18.1 18.7 18.8 17.9 17.0 17.6 18.8 16.9 14.3 11.5 11.6 12.9 6.9 10.5 11.8 13.2 13.0 13.7 13.7 15.9 14.3 16.1 13.4 9.5 12.1 12.7 14.6 14.2Melbourne Regional Office 16.5 +1.9 9 20.3 20.8 20.5 16.8 19.8 17.9 18.7 18.6 16.1 14.1 14.3 14.4 12.8 14.0 14.8 16.0 15.8 17.0 16.8 18.0 17.4 16.9 16.2 14.3 14.1 14.2 14.3 16.1Moorabbin Airport 15.0 +0.8 8 19.4 18.3 19.7 15.8 17.7 16.0 17.5 18.9 14.2 11.2 12.9 13.2 10.5 10.2 14.5 14.8 12.5 12.3 13.4 17.9 16.7 15.8 14.5 14.8 14.7 11.9 13.7 16.8Phillip Island Penguin Reserve 14.1 +0.3 6 19.0 18.3 17.6 8.7 16.1 17.1 17.5 14.6 13.8 12.8 13.7 12.8 8.1 16.0 15.5 13.1 10.2 9.3 14.1 16.6 15.4 10.6 14.5 14.4 14.0 9.8 16.8Rhyll 16.4 +0.7 8 19.9 19.9 18.7 18.6 19.6 16.5 17.4 16.9 14.9 13.9 13.6 14.2 14.0 15.2 16.7 16.5 16.2 16.1 16.5 17.4 16.4 15.9 16.9 14.3 14.2 15.4 16.9 16.9Scoresby Research Institute 13.9 +0.2 6 18.5 19.2 19.4 13.6 17.8 16.0 17.4 17.8 13.5 10.7 11.5 10.4 9.9 9.4 10.6 11.5 11.0 11.5 13.4 17.0 16.0 15.6 14.1 13.2 13.1 10.0 12.2 15.9Viewbank (ARPANSA) 14.6 19.1 20.0 19.6 15.9 17.1 16.7 18.0 17.3 14.0 11.8 12.5 13.4 8.9 11.2 12.2 13.0 12.2 12.7 14.4 16.9 15.9 16.0 13.7 12.8 13.3 11.1 13.7 15.5Wallan (Kilmore Gap) 12.4 -0.1 5 15.2 16.1 16.4 14.5 16.9 14.0 16.4 14.3 9.6 7.7 8.0 8.8 7.4 10.8 11.5 11.8 14.9 16.4 15.4 13.7 11.5 12.1 13.8 8.4 9.3 9.9 12.1 11.0Wonthaggi 14.1 +0.9 8 13.6 19.0 18.0 16.8 15.4 13.5 16.0 17.4 13.3 12.1 12.5 8.7 9.0 12.7 15.4 15.4 14.7 13.3 14.2 14.1 16.0 14.5 13.7 13.5 14.0 9.1 13.0 16.9
West Central (87) Mean Anom Decile 1 2 3 4 5 6 7 8 9 10 11 12 13 14 15 16 17 18 19 20 21 22 23 24 25 26 27 28Avalon Airport 14.9 +0.7 6 18.5 18.8 18.3 19.1 15.5 17.3 19.1 17.0 14.1 11.5 12.6 13.5 14.5 10.5 16.1 17.0 12.9 14.5 13.3 17.3 15.7 16.3 12.4 9.0 14.0 13.2 13.5 12.3Grovedale (Geelong Airport) 13.9 +0.5 7 18.0 18.3 17.7 17.6 14.6 16.5 16.9 15.0 13.2 9.5 12.7 12.4 11.5 9.8 13.6 15.8 13.4 11.9 12.3 15.6 15.9 14.7 12.6 9.9 13.5 14.2 11.8 11.6Laverton RAAF 14.9 +0.7 7 18.6 20.4 19.3 18.1 15.4 17.8 18.7 16.5 14.9 13.4 13.8 15.0 8.2 9.6 16.7 12.7 12.7 13.1 13.3 17.4 15.6 17.0 13.2 9.8 13.5 13.7 13.8 14.1Sheoaks 12.7 +0.1 5 16.8 17.9 16.8 16.6 16.2 14.6 17.4 15.7 10.0 6.9 9.8 9.3 10.0 8.5 14.0 14.3 12.1 11.0 10.3 14.9 13.7 14.3 13.4 5.5 9.7 13.5 11.8 11.9
North Central (88) Mean Anom Decile 1 2 3 4 5 6 7 8 9 10 11 12 13 14 15 16 17 18 19 20 21 22 23 24 25 26 27 28Castlemaine Prison 13.5 +0.2 5 23.3 21.1 17.8 13.8 19.2 14.9 20.7 18.2 10.8 6.1 9.9 11.0 9.9 11.3 11.5 11.0 16.1 15.0 10.9 15.6 10.9 14.9 12.9 9.6 7.2 11.5 15.6 8.6Eildon Fire Tower 14.0 +0.5 6 22.9 23.1 17.1 16.3 20.8 15.0 22.3 19.5 9.8 7.7 6.7 8.7 10.1 11.7 13.7 14.7 13.6 16.0 15.6 14.5 10.9 11.5 16.0 9.6 7.4 10.7 15.0 12.1Lake Eildon 13.8 +1.1 8 19.4 18.4 17.0 15.6 17.8 14.4 18.3 23.0 13.7 8.8 9.5 10.1 12.9 10.0 13.0 15.0 13.8 17.0 12.9 15.0 10.3 11.0 13.9 13.7 7.6 8.8 11.4 12.7Mangalore Airport 14.9 +0.8 7 19.5 19.4 19.4 17.2 19.4 16.5 20.1 20.1 13.7 12.0 11.9 13.1 9.8 10.9 11.5 14.9 13.4 16.7 13.7 18.5 15.2 15.2 10.6 12.1 12.0 12.9 13.1 15.5Maryborough 13.6 +0.5 7 21.3 21.4 18.3 14.7 18.2 15.1 19.6 16.3 10.3 9.3 10.1 10.1 8.1 10.8 13.3 13.8 13.5 12.9 13.6 15.1 13.8 13.9 12.4 9.6 9.4 9.9 14.2 12.8Redesdale 13.9 +0.8 6 23.7 20.4 18.1 14.4 17.6 14.0 20.4 19.3 10.9 10.2 10.0 11.4 7.9 10.2 11.6 13.6 15.5 14.2 14.5 17.3 13.2 13.0 12.5 10.3 9.0 10.9 13.1 13.0
Western Plains (89) Mean Anom Decile 1 2 3 4 5 6 7 8 9 10 11 12 13 14 15 16 17 18 19 20 21 22 23 24 25 26 27 28Ararat Prison 12.1 +0.9 8 17.9 17.4 17.5 13.6 14.2 14.0 17.4 14.9 8.2 6.5 9.6 8.6 8.7 7.5 13.0 12.9 12.8 12.2 12.4 14.0 12.0 13.4 8.9 6.5 8.3 10.0 14.0 11.6Ballarat Aerodrome 11.9 +0.5 7 16.4 16.3 17.0 14.6 15.0 13.2 20.2 13.8 7.6 5.6 7.9 7.0 8.4 10.1 12.8 13.5 12.7 12.0 10.3 13.2 12.4 12.2 11.3 6.4 7.6 12.1 13.6 9.7Westmere 11.5 17.3 16.6 17.7 12.0 13.3 15.4 18.2 13.1 7.9 7.6 9.4 8.3 5.3 5.3 11.4 11.4 12.3 10.2 10.7 14.2 12.6 14.6 10.0 6.3 8.4 7.6 12.6 11.8
West Coast (90) Mean Anom Decile 1 2 3 4 5 6 7 8 9 10 11 12 13 14 15 16 17 18 19 20 21 22 23 24 25 26 27 28Aireys Inlet 14.9 +0.4 6 17.1 17.9 16.6 17.2 16.6 15.4 16.6 15.5 13.9 12.1 10.9 12.6 14.4 13.6 16.3 16.5 16.2 14.7 15.4 15.3 15.7 14.6 14.3 12.2 13.1 14.9 14.1 14.3Cape Nelson Lighthouse 15.2 +0.2 7 17.1 17.9 16.5 15.9 15.6 15.0 16.5 15.9 13.8 12.9 12.6 13.0 14.9 15.7 16.7 16.1 16.1 16.8 14.8 15.4 15.5 15.6 12.6 13.9 13.6 14.5 15.9 15.5Cape Otway Lighthouse 15.0 +1.1 9 16.5 17.3 15.9 17.0 16.3 11.0 16.5 16.0 13.4 11.7 11.8 12.4 14.3 15.3 16.2 16.4 16.5 16.1 15.8 15.6 15.5 14.7 13.7 13.5 13.5 14.7 16.5 15.2
Monthly Weather Review Victoria February 2009
page 14

Daily and mean minimum temperatures for February 2009Mean is the average of the daily minimum temperature for February 2009; it is only shown if there are sufficient days available. Anom is thedifference between the mean daily minimum temperature for February 2009 and the long-term average minimum temperature forFebruary. Decile is the decile rank of mean daily minimum temperature for February 2009 in the climate record of other February mean dailyminimum temperatures; “L” indicates this is the lowest on record, and “H” it is the highest on record. Anomalies and deciles are only shownif there are sufficient years of climate record available. The lowest and highest minimum temperatures for each site for February 2009 arehighlighted.Casterton Showgrounds 12.6 +0.5 7 17.0 17.5 17.7 14.8 15.2 13.2 17.2 15.1 8.8 9.4 11.2 10.5 8.7 9.8 13.1 14.5 14.3 14.8 12.7 15.8 14.0 9.5 9.0 6.5 4.8 8.9 14.4 13.0Casterton 12.4 17.2 17.4 17.0 14.7 14.0 13.3 17.5 14.0 7.8 7.9 10.3 9.6 9.1 11.4 12.8 14.1 15.5 15.6 13.0 15.2 13.6 10.6 9.0 5.5 3.5 10.6 14.9 11.2Colac (Mount Gellibrand) 13.0 17.2 16.7 15.7 15.1 16.8 13.5 16.7 14.3 9.2 8.4 9.8 9.0 10.9 12.4 13.7 14.3 13.2 13.8 14.2 12.7 11.9 13.1 13.5 8.6 10.5 12.9 14.6 11.9Hamilton Airport 11.6 +0.6 8 15.9 16.1 15.9 14.3 15.0 13.5 18.0 14.8 7.0 6.1 9.0 8.5 5.4 8.3 11.5 12.0 13.5 15.6 15.0 14.6 10.4 8.7 10.5 5.4 5.2 8.9 14.8 12.0Heywood Forestry 15.5 17.2 13.9 13.5 7.5 7.5 5.9 5.5 11.6 10.0 10.5 7.0 5.8Mortlake Racecourse 11.5 0.0 7 16.2 17.3 17.0 14.3 12.7 14.5 18.3 13.1 4.8 5.7 8.3 9.0 7.3 4.8 11.7 7.6 14.1 14.7 14.2 15.0 12.4 14.5 9.2 4.0 9.8 7.6 13.8 9.6Port Fairy AWS 15.0 +0.5 7 17.5 17.4 17.4 15.8 13.8 14.2 17.8 16.0 14.0 12.9 12.9 12.6 14.6 14.7 16.6 16.2 14.8 15.6 14.4 16.1 15.3 15.6 9.8 13.8 14.0 13.2 16.0 15.9Portland (Cashmore Airport) 13.1 +0.5 7 16.1 17.6 15.9 14.9 13.4 6.1 14.3 14.2 12.1 9.9 11.9 11.5 13.5 8.8 15.3 15.2 14.5 13.1 12.0 14.9 15.1 14.8 9.4 12.2 12.1 11.8 12.4 12.7Warrnambool Airport NDB 12.3 +0.1 7 16.7 15.2 16.7 13.1 12.3 8.2 17.1 14.5 9.0 8.6 11.6 11.7 6.3 9.0 10.1 14.0 13.7 14.9 13.0 15.9 13.2 14.4 7.8 9.9 11.5 7.1 15.2 12.6Weeaproinah 11.6 +0.3 7 14.3 15.3 13.3 13.7 15.5 9.9 11.8 12.9 6.8 6.6 7.8 7.3 9.7 10.4 13.3 13.3 12.4 15.5 13.8 11.9 11.8 10.6 11.6 8.8 9.6 11.0 14.3 11.6
Monthly Weather Review Victoria February 2009
page 15
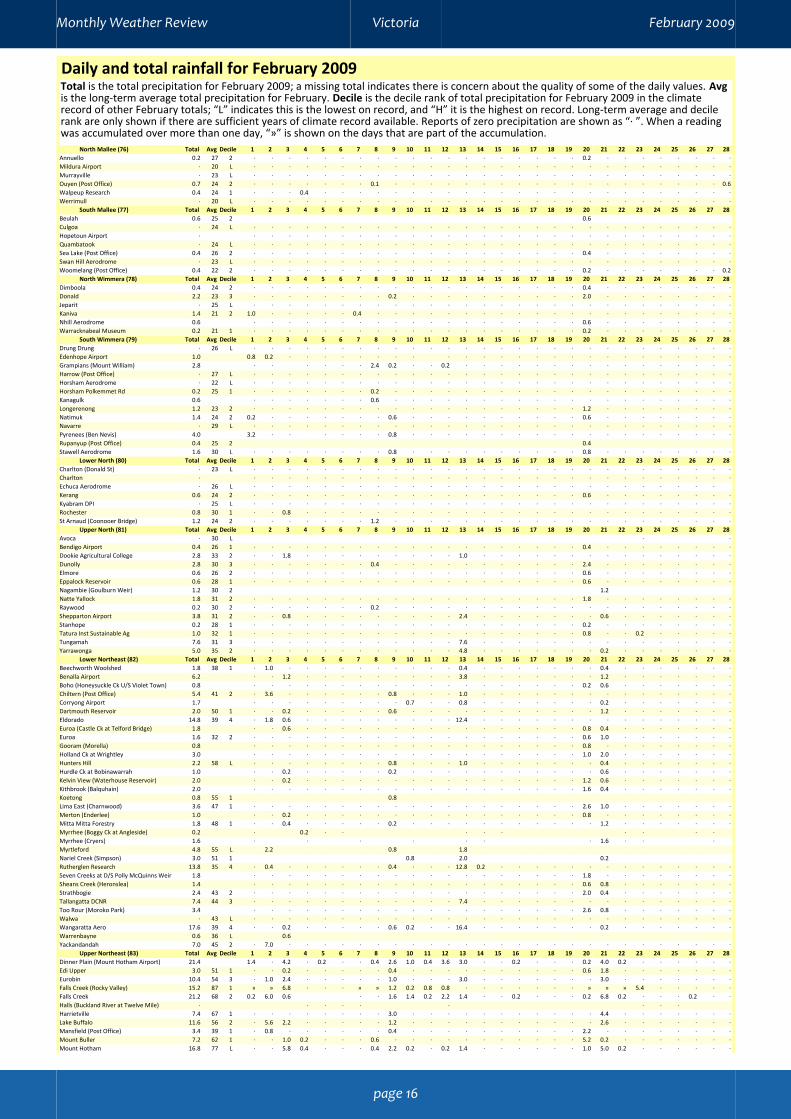
Daily and total rainfall for February 2009Total is the total precipitation for February 2009; a missing total indicates there is concern about the quality of some of the daily values. Avgis the long-term average total precipitation for February. Decile is the decile rank of total precipitation for February 2009 in the climaterecord of other February totals; “L” indicates this is the lowest on record, and “H” it is the highest on record. Long-term average and decilerank are only shown if there are sufficient years of climate record available. Reports of zero precipitation are shown as “· ”. When a readingwas accumulated over more than one day, “»” is shown on the days that are part of the accumulation.
North Mallee (76) Total Avg Decile 1 2 3 4 5 6 7 8 9 10 11 12 13 14 15 16 17 18 19 20 21 22 23 24 25 26 27 28Annuello 0.2 27 2 · · · · · · · · · · · · · · · · · · · 0.2 · · · · · · · ·Mildura Airport · 20 L · · · · · · · · · · · · · · · · · · · · · · · · · · · ·Murrayville · 23 L · · · · · · · · · · · · · · · · · · · · · · · · · · · ·Ouyen (Post Office) 0.7 24 2 · · · · · · · 0.1 · · · · · · · · · · · · · · · · · · · 0.6Walpeup Research 0.4 24 1 · · · 0.4 · · · · · · · · · · · · · · · · · · · · · · · ·Werrimull · 20 L · · · · · · · · · · · · · · · · · · · · · · · · · · · ·
South Mallee (77) Total Avg Decile 1 2 3 4 5 6 7 8 9 10 11 12 13 14 15 16 17 18 19 20 21 22 23 24 25 26 27 28Beulah 0.6 25 2 0.6Culgoa · 24 L · · · · · · · · · · · · · · · · · · · · · · · · · · · ·Hopetoun Airport · · · · · · · · · · · · · · · · · · · · · · · · · · · · ·Quambatook · 24 L · · · · · · · · · · · · · · · · · · · · · · · · · · · ·Sea Lake (Post Office) 0.4 26 2 · · · · · · · · · · · · · · · · · · · 0.4 · · · · · · · ·Swan Hill Aerodrome · 23 L · · · · · · · · · · · · · · · · · · · · · · · · · · · ·Woomelang (Post Office) 0.4 22 2 · · · · · · · · · · · · · · · · · · · 0.2 · · · · · · · 0.2
North Wimmera (78) Total Avg Decile 1 2 3 4 5 6 7 8 9 10 11 12 13 14 15 16 17 18 19 20 21 22 23 24 25 26 27 28Dimboola 0.4 24 2 · · · · · · · · · · · · · · · · · · · 0.4 · · · · · · · ·Donald 2.2 23 3 · · · · · · · · 0.2 · · · · · · · · · · 2.0 · · · · · · · ·Jeparit · 25 L · · · · · · · · · · · · · · · · · · · · · · · · · · · ·Kaniva 1.4 21 2 1.0 · · · · · 0.4 · · · · · · · · · · · · · · · · · · · · ·Nhill Aerodrome 0.6 · · · · · · · · · · · · · · · · · · · 0.6 · · · · · · · ·Warracknabeal Museum 0.2 21 1 · · · · · · · · · · · · · · · · · · · 0.2 · · · · · · · ·
South Wimmera (79) Total Avg Decile 1 2 3 4 5 6 7 8 9 10 11 12 13 14 15 16 17 18 19 20 21 22 23 24 25 26 27 28Drung Drung · 26 L · · · · · · · · · · · · · · · · · · · · · · · · · · · ·Edenhope Airport 1.0 0.8 0.2 · · · · · · · · · · · · · · · · · · · · · · · · ·Grampians (Mount William) 2.8 · · · · · · 2.4 0.2 · · 0.2 · · · · · · · · · · · · · · · ·Harrow (Post Office) · 27 L · · · · · · · · · · · · · · · · · · · · · · · · · · · ·Horsham Aerodrome · 22 L · · · · · · · · · · · · · · · · · · · · · · · · · · · ·Horsham Polkemmet Rd 0.2 25 1 · · · · · · · 0.2 · · · · · · · · · · · · · · · · · · · ·Kanagulk 0.6 · · · · · · · 0.6 · · · · · · · · · · · · · · · · · · · ·Longerenong 1.2 23 2 · · · · · · · · · · · · · · · · · · · 1.2 · · · · · · · ·Natimuk 1.4 24 2 0.2 · · · · · · · 0.6 · · · · · · · · · · 0.6 · · · · · · · ·Navarre · 29 L · · · · · · · · · · · · · · · · · · · · · · · · · · · ·Pyrenees (Ben Nevis) 4.0 3.2 · · · · · · 0.8 · · · · · · · · · · · · · · · · · · ·Rupanyup (Post Office) 0.4 25 2 0.4Stawell Aerodrome 1.6 30 L · · · · · · · · 0.8 · · · · · · · · · · 0.8 · · · · · · · ·
Lower North (80) Total Avg Decile 1 2 3 4 5 6 7 8 9 10 11 12 13 14 15 16 17 18 19 20 21 22 23 24 25 26 27 28Charlton (Donald St) · 23 L · · · · · · · · · · · · · · · · · · · · · · · · · · · ·Charlton · · · · · · · · · · · · · · · · · · · · · · · · · · · · ·Echuca Aerodrome · 26 L · · · · · · · · · · · · · · · · · · · · · · · · · · ·Kerang 0.6 24 2 · · · · · · · · · · · · · · · · · · · 0.6 · · · · · · · ·Kyabram DPI · 25 L · · · · · · · · · · · · · · · · · · · · · · · · · · · ·Rochester 0.8 30 1 · · 0.8 · · · · · · · · · · · · · · · · · · · · · · · · ·St Arnaud (Coonooer Bridge) 1.2 24 2 · · · · · · · 1.2 · · · · · · · · · · · · · · · · · · · ·
Upper North (81) Total Avg Decile 1 2 3 4 5 6 7 8 9 10 11 12 13 14 15 16 17 18 19 20 21 22 23 24 25 26 27 28Avoca · 30 L · ·Bendigo Airport 0.4 26 1 · · · · · · · · · · · · · · · · · · · 0.4 · · · · · · · ·Dookie Agricultural College 2.8 33 2 · · 1.8 · · · · · · · · · 1.0 · · · · · · · · · · · · · · ·Dunolly 2.8 30 3 · · · · · · · 0.4 · · · · · · · · · · · 2.4 · · · · · · · ·Elmore 0.6 26 2 · · · · · · · · · · · · · · · · · · · 0.6 · · · · · · · ·Eppalock Reservoir 0.6 28 1 · · · · · · · · · · · · · · · · · · · 0.6 · · · · · · · ·Nagambie (Goulburn Weir) 1.2 30 2 1.2Natte Yallock 1.8 31 2 · · · · · · · · · · · · · · · · · · · 1.8 · · · · · · · ·Raywood 0.2 30 2 · · · · · · · 0.2 · · · · · · · · · · · · · · · · · · · ·Shepparton Airport 3.8 31 2 · · 0.8 · · · · · · · · · 2.4 · · · · · · · 0.6 · · · · · · ·Stanhope 0.2 28 1 · · · · · · · · · · · · · · · · · · · 0.2 · · · · · · · ·Tatura Inst Sustainable Ag 1.0 32 1 · · · · · · · · · · · · · · · · · · · 0.8 · · 0.2 · · · · ·Tungamah 7.6 31 3 · · · · · · · · · · · · 7.6 · · · · · · · · · · · · · · ·Yarrawonga 5.0 35 2 · · · · · · · · · · · · 4.8 · · · · · · · 0.2 · · · · · · ·
Lower Northeast (82) Total Avg Decile 1 2 3 4 5 6 7 8 9 10 11 12 13 14 15 16 17 18 19 20 21 22 23 24 25 26 27 28Beechworth Woolshed 1.8 38 1 · 1.0 · · · · · · · · · · 0.4 · · · · · · · 0.4 · · · · · · ·Benalla Airport 6.2 · · 1.2 · · · · · · · · · 3.8 · · · · · · · 1.2 · · · · · · ·Boho (Honeysuckle Ck U/S Violet Town) 0.8 · · · · · · · · · · · · · · · · · · · 0.2 0.6 · · · · · · ·Chiltern (Post Office) 5.4 41 2 · 3.6 · · · · · · 0.8 · · · 1.0 · · · · · · · · · · · · · · ·Corryong Airport 1.7 · · · · · · · · · 0.7 · · 0.8 · · · · · · · 0.2 · · · · · · ·Dartmouth Reservoir 2.0 50 1 · · 0.2 · · · · · 0.6 · · · · · · · · · · · 1.2 · · · · · · ·Eldorado 14.8 39 4 · 1.8 0.6 · · · · · · · · · 12.4 · · · · · · · · · · · · · · ·Euroa (Castle Ck at Telford Bridge) 1.8 · · 0.6 · · · · · · · · · · · · · · · · 0.8 0.4 · · · · · · ·Euroa 1.6 32 2 · · · · · · · · · · · · · · · · · · · 0.6 1.0 · · · · · · ·Gooram (Morella) 0.8 · · · · · · · · · · · · · · · · · · · 0.8 · · · · · · · ·Holland Ck at Wrightley 3.0 · · · · · · · · · · · · · · · · · · · 1.0 2.0 · · · · · · ·Hunters Hill 2.2 58 L · · · · · · · · 0.8 · · · 1.0 · · · · · · · 0.4 · · · · · · ·Hurdle Ck at Bobinawarrah 1.0 · · 0.2 · · · · · 0.2 · · · · · · · · · · · 0.6 · · · · · · ·Kelvin View (Waterhouse Reservoir) 2.0 · · 0.2 · · · · · · · · · · · · · · · · 1.2 0.6 · · · · · · ·Kithbrook (Balquhain) 2.0 · · · · · · · · · · · · · · · · · · · 1.6 0.4 · · · · · · ·Koetong 0.8 55 1 0.8Lima East (Charnwood) 3.6 47 1 · · · · · · · · · · · · · · · · · · · 2.6 1.0 · · · · · · ·Merton (Enderlee) 1.0 · · 0.2 · · · · · · · · · · · · · · · · 0.8 · · · · · · · ·Mitta Mitta Forestry 1.8 48 1 · · 0.4 · · · · · 0.2 · · · · · · · · · · · 1.2 · · · · · · ·Myrrhee (Boggy Ck at Angleside) 0.2 · 0.2 · · · · · · · · ·Myrrhee (Cryers) 1.6 · · · · · · · 1.6 · · ·Myrtleford 4.8 55 L 2.2 0.8 1.8Nariel Creek (Simpson) 3.0 51 1 0.8 2.0 0.2Rutherglen Research 13.8 35 4 · 0.4 · · · · · · 0.4 · · · 12.8 0.2 · · · · · · · · · · · · · ·Seven Creeks at D/S Polly McQuinns Weir 1.8 · · · · · · · · · · · · · · · · · · · 1.8 · · · · · · · ·Sheans Creek (Heronslea) 1.4 · · · · · · · · · · · · · · · · · · · 0.6 0.8 · · · · · · ·Strathbogie 2.4 43 2 · · · · · · · · · · · · · · · · · · · 2.0 0.4 · · · · · · ·Tallangatta DCNR 7.4 44 3 · · · · · · · · · · · · 7.4 · · · · · · · · · · · · · · ·Too Rour (Moroko Park) 3.4 · · · · · · · · · · · · · · · · · · · 2.6 0.8 · · · · · · ·Walwa · 43 L · · · · · · · · · · · · · · · · · · · · · · · · · · · ·Wangaratta Aero 17.6 39 4 · · 0.2 · · · · · 0.6 0.2 · · 16.4 · · · · · · · 0.2 · · · · · · ·Warrenbayne 0.6 36 L 0.6Yackandandah 7.0 45 2 · 7.0 · · · · · · · · · · · · · · · · · · · · · · · · · ·
Upper Northeast (83) Total Avg Decile 1 2 3 4 5 6 7 8 9 10 11 12 13 14 15 16 17 18 19 20 21 22 23 24 25 26 27 28Dinner Plain (Mount Hotham Airport) 21.4 1.4 · 4.2 · 0.2 · · 0.4 2.6 1.0 0.4 3.6 3.0 · · 0.2 · · · 0.2 4.0 0.2 · · · · · ·Edi Upper 3.0 51 1 · · 0.2 · · · · · 0.4 · · · · · · · · · · 0.6 1.8 · · · · · · ·Eurobin 10.4 54 3 · 1.0 2.4 · · · · · 1.0 · · · 3.0 · · · · · · · 3.0 · · · · · · ·Falls Creek (Rocky Valley) 15.2 87 1 » » 6.8 · · · » » 1.2 0.2 0.8 0.8 · · · · · · · » » » 5.4 · · · · ·Falls Creek 21.2 68 2 0.2 6.0 0.6 · · 1.6 1.4 0.2 2.2 1.4 · · 0.2 · · · 0.2 6.8 0.2 · · · 0.2 · ·Halls (Buckland River at Twelve Mile) · · · · · · · · ·Harrietville 7.4 67 1 · · · · · · · · 3.0 · · · · · · · · · · · 4.4 · · · · · · ·Lake Buffalo 11.6 56 2 · 5.6 2.2 · · · · · 1.2 · · · · · · · · · · · 2.6 · · · · · · ·Mansfield (Post Office) 3.4 39 1 · 0.8 · · · · · · 0.4 · · · · · · · · · · 2.2 · · · · · · · ·Mount Buller 7.2 62 1 · · 1.0 0.2 · · · 0.6 · · · · · · · · · · · 5.2 0.2 · · · · · · ·Mount Hotham 16.8 77 L · · 5.8 0.4 · · · 0.4 2.2 0.2 · 0.2 1.4 · · · · · · 1.0 5.0 0.2 · · · · · ·
Monthly Weather Review Victoria February 2009
page 16

Daily and total rainfall for February 2009Total is the total precipitation for February 2009; a missing total indicates there is concern about the quality of some of the daily values. Avgis the long-term average total precipitation for February. Decile is the decile rank of total precipitation for February 2009 in the climaterecord of other February totals; “L” indicates this is the lowest on record, and “H” it is the highest on record. Long-term average and decilerank are only shown if there are sufficient years of climate record available. Reports of zero precipitation are shown as “· ”. When a readingwas accumulated over more than one day, “»” is shown on the days that are part of the accumulation.Omeo Comparison 11.8 52 2 · · 4.6 · · · · · 3.2 » 0.8 1.0 · · · 0.2 · · · · 2.0 · · · · · · ·Omeo 11.8 · · 4.4 · · · · · 3.4 1.2 · 1.0 · · · · · · · 0.2 1.6 · · · · · · ·Tolmie (Mount Tabletop Repeater) 12.0 · · · · · · · · · · · · 9.0 · · · · · · 3.0 · · · · · · · ·Whitfield (King River at Cheshunt) 6.0 · 1.4 · · · · · · 0.6 · · · · · · · · · · 0.2 3.8 · · · · · · ·Whitlands (Burder's Lane) 9.8 56 2 · 0.8 0.4 · · · · · 0.4 · · · 1.2 · · · · · · 2.4 4.6 · · · · · · ·Woods Point 2.8 61 1 · · · · · · · · · · · 2.8 · · · · · · · · · · · · · · · ·
East Gippsland (84) Total Avg Decile 1 2 3 4 5 6 7 8 9 10 11 12 13 14 15 16 17 18 19 20 21 22 23 24 25 26 27 28Bonang 34.2 63 4 24.2 3.0 5.4 1.6Buchan 17.0 58 3 · · 0.6 · · · · · 3.4 · · 5.6 6.8 · · · · · · · 0.6 · · · · · · ·Bullumwaal 45.8 0.4 2.4 2.6 2.4 0.2 · · · 1.4 · · 11.2 25.2 · · · · · · · · · · · · · · ·Cabbage Tree Creek 29.0 67 3 · · 4.0 · · · · · 5.0 · · 15.2 4.8 · · · · · · · · · · · · · · ·Cann River 29.4 55 4 · · 1.0 0.6 · · · · 6.6 · · 14.6 4.2 · · 0.6 0.2 · 0.6 · 0.4 · · · · · · 0.6Club Terrace 19.6 69 3 1.0 0.2 10.6 4.6 1.8 0.8 0.6Combienbar AWS 46.0 87 5 · · 2.8 5.4 · · · · 6.2 1.0 · 12.6 9.0 · · 6.8 · · 0.8 · 1.2 0.2 · · · · · ·Combienbar 22.6 · · 2.0 0.4 · · · · 6.8 0.6 · 7.4 3.2 · · 0.8 · · · · · · · 1.0 · 0.4 · ·Dellicknora (Tellicura) 9.6 58 2 4.0 2.2 3.4Ensay 16.2 54 3 · · 0.6 · · · · · 2.0 · · 6.0 4.8 · · · · · · · 2.8 · · · · · · ·Gabo Island Lighthouse 43.2 68 5 · · 1.2 1.2 · · · · 1.8 0.2 · 7.2 12.2 0.2 1.2 3.2 3.6 10.2 0.2 · · · · · · 0.4 0.4 ·Gelantipy 18.2 63 2 · · 4.6 0.8 · · · · 5.4 1.4 0.2 1.4 2.6 · · · · · · · 1.4 0.2 · · · · 0.2 ·Genoa (Fools Haven) 36.2 64 4 1.4 2.2 1.2 0.6 9.0 4.8 0.2 0.8 5.0 1.6 7.4 0.6 0.2 1.2 ·Lakes Entrance (Eastern Beach Road) 56.0 1.2 2.2 · · · · · 1.0 · 1.0 41.8 6.8 · · · · · · · · · · · · · 2.0 · ·Mallacoota 46.0 61 6 · 0.4 0.8 3.6 · · · · 2.4 0.2 · 10.0 11.2 1.0 1.8 0.4 5.4 1.0 6.0 0.4 · · · · · · 1.4 ·Mount Nowa Nowa 41.4 76 3 2.8 1.6 2.0 2.2 · · · · 2.6 · 3.8 21.4 5.0 · · · · · · · · · · · · · · ·Orbost (Comparison) 20.8 59 3 1.2 0.2 2.4 0.2 · · · · 7.0 · · 5.2 4.4 · · · · · · · · · · · · 0.2 · ·Orbost 22.4 1.4 0.2 2.6 · · · · · 6.6 · · 6.8 4.8 · · · · · · · · · · · · · · ·Point Hicks (Lighthouse) 70.7 56 8 · · 0.8 1.4 · · · · 1.4 7.8 0.8 42.2 9.0 0.2 0.4 · 2.0 0.2 2.6 0.8 0.4 · · · · · 0.7 ·Tubbut 8.6 51 2 5.6 1.0 2.0Wonnagatta River @ Waterford 12.6 · · 2.0 0.4 · · · 0.2 1.8 · · 3.0 5.0 0.2 · · · · · · · · · · · · · ·
West Gippsland (85) Total Avg Decile 1 2 3 4 5 6 7 8 9 10 11 12 13 14 15 16 17 18 19 20 21 22 23 24 25 26 27 28Bairnsdale Airport 44.2 48 6 1.6 0.8 · 1.8 · · · · 0.8 · · 29.6 9.6 · · · · · · · · · · · · · · ·Boolarra South 10.0 0.2 1.6 0.2 0.4 1.4 3.0 1.8 0.4 0.6 0.4 ·Drouin Bowling Club 3.2 55 1 · · 1.2 · · · · 1.8 · · · 0.2 · · · · · · · · · · · · · · · ·East Sale Airport 26.8 41 4 0.8 0.2 1.2 · · · · 0.8 0.6 · · 21.0 1.8 · · · · · · · 0.2 · 0.2 · · · · ·Erica (Parkers Corner) 33.0 67 3 · · 2.2 1.0 · · · 2.0 2.0 · · 20.0 2.0 · · 0.6 · · · · · · 0.2 3.0 · · · ·Foster Hoddle 12.6 41 1 1.0 1.6 5.4 4.6Glencairn (Barkly River (Glenview)) 4.8 · · · · · · · 0.6 2.0 · · 1.2 1.0 · · · · · · · · · · · · · · ·Glenmaggie Weir 33.8 48 5 1.2 2.0 2.2 1.6 · · · 1.6 0.8 · · 17.8 6.6 · · · · · · · · · · · · · · ·Jindivick 10.0 66 1 · · 5.2 · · · · 1.0 1.2 · · 1.8 · · · · · · · · · · · 0.4 0.2 0.2 · ·Labertouche · 56 L · · · · · · · · · · · · · · · · · · · · · · · · · · · ·Le Roy (Taylors Rd Quarry) 5.8 · · 0.2 · · · · 1.2 · · 0.6 3.8 · · · · · · · · · · · · · · · ·Lindenow 27.4 47 4 1.6 · · · · · · · · · · 18.8 7.0 · · · · · · · · · · · · · · ·Maffra 26.0 52 3 » 4.4 2.4 1.8 · · · · · · · 16.4 1.0 · · · · · · · · · · · · · · ·Mirboo North Water Board 6.2 53 1 1.8 4.0 0.4Mitchell River @ Glenaladale 48.4 0.8 5.8 0.4 0.6 · · · · 0.6 · · 34.6 5.6 · · · · · · · · · · · · · · ·Morwell (Latrobe Valley Airport) 11.0 39 1 · · 0.4 · · · · 0.2 1.2 · · 5.6 3.4 0.2 · · · · · · · · · · · · · ·Mount Baw Baw 37.2 104 L · · 1.4 · 0.2 · · 5.6 1.4 · 18.6 5.2 · 0.2 0.2 · · · · 0.2 0.2 0.2 3.4 0.2 0.2 · ·Mount Moornapa 28.2 71 3 · 1.4 0.4 0.2 0.4 0.2 0.2 · · 0.2 · 0.4 16.2 7.2 1.4 · · · · · · · · · · · · ·Mount Tamboritha 9.4 58 L · · 0.2 · · · · · 1.6 0.2 · 5.2 2.2 · · · · · · · · · · · · · · ·Mount Useful 84.0 0.6 · 1.8 2.4 · · · 1.6 2.0 · · 20.6 22.6 31.4 · 0.2 0.2 · · · · 0.6 · · · · · ·Murderers Hill 61.6 78 5 · 0.8 4.2 4.6 · 0.2 · 8.2 2.2 0.2 · 24.2 16.2 · 0.2 · · · 0.4 0.2 · · · · · · · ·Noojee (Slivar) 6.0 56 L · · 2.2 · · · · 0.6 0.6 · 0.4 2.0 · · · · · · · · · · · 0.2 · · · ·Pound Creek 5.2 · · · · 0.2 · · · 3.8 · · · 1.0 · · · · · · · · · · · · 0.2 · ·Reeves Knob 71.8 0.2 · 8.6 11.6 · · · 0.4 5.0 0.8 · 32.8 12.0 · · · · · · · · · · 0.4 · · · ·Toora 18.2 53 2 » 3.4 · 3.0 · · » » 3.2 · · 5.2 3.0 » » 0.4 · · · · · · · · · · · ·Traralgon Creek at Koornalla 4.2 · · 0.4 · · · · · 0.4 · · 2.6 0.8 · · · · · · · · · · · · · · ·Traralgon EPA 11.4 · 0.2 0.6 · 0.4 · · 1.0 0.6 · · 6.6 2.0 · · · · · · · · · · · · · · ·Willow Grove (Blue Rock Reservoir) 11.1 48 1 · · 4.4 · · · » » 0.8 · · 4.8 0.6 · · · · · · · · · · · 0.5 · · ·Willow Grove 7.0 48 1 · · 4.0 · · · · · 0.8 · · 2.2 · · · · · · · · · · · · · · · ·Wilsons Promontory Lighthouse 9.0 46 1 · 0.2 0.4 · · · · · 0.4 · 2.0 5.4 0.2 · · · · · · · · · · · 0.4 · · ·Yarram Airport 21.0 · 1.4 0.6 3.2 0.6 0.2 · 0.4 · · · 13.8 0.6 · · 0.2 · · · · · · · · · · · ·
East Central (86) Total Avg Decile 1 2 3 4 5 6 7 8 9 10 11 12 13 14 15 16 17 18 19 20 21 22 23 24 25 26 27 28Bundoora (Latrobe University) 5.4 41 2 · · · · · · · 1.8 · · 0.6 · · · · · · · · 0.6 1.4 · · · 1.0 · · ·Cerberus 4.6 38 L · · · · · · · · 4.4 · · · 0.2 · · · · · · · · · · · · · · ·Cheltenham Kingston Centre 0.8 48 1 · · · · · · · · 0.6 · · · · · · · · · · · 0.2 · · · · · · ·Coldstream 3.4 48 L · · 3.0 · · · · 0.2 · · · · · · · · · · · · 0.2 · · · · · · ·Cranbourne Botanic Gardens 10.2 55 2 · · 2.8 · · 0.2 · 2.2 1.6 · 0.1 3.0 · · · · · · · · · · · · · 0.2 · 0.1Croydon (Council Depot) 4.0 47 1 · · 3.4 · · · · · · · 0.6 · · · · · · · · · · · · · · · · ·Eltham 2.6 51 1 · · 1.4 · · · · 0.2 · · · · · · · · · · · · 0.8 · · · 0.2 · · ·Epping 1.6 48 1 · · · · · · · · · · · · · · · · · · · 0.2 0.4 · · · 1.0 · · ·Essendon Airport 3.2 46 1 · · 0.2 · · · · · · · 2.6 · · · · · · · · · 0.4 · · · · · · ·Ferny Creek (Dunns Hill) 3.2 69 L · · 2.0 · 0.2 · · 0.4 0.4 · · · · · · · · · · · 0.2 · · · · · · ·Flemington Racecourse 3.0 44 1 · · · · · · · 0.2 0.4 · 1.2 · · · · · · · · · 1.2 · · · · · · ·Glen Waverley (Golf Course) 3.8 54 1 · · 0.8 · · · 0.4 1.2 1.0 · · · · · · · · · · · 0.4 · · · · · · ·Healesville (Valley View Farm) 3.0 · · 1.6 · · · · · 0.4 · · · · · · · · · · · 1.0 · · · · · · ·Kinglake West 2.2 58 1 · · 1.0 · · · · · · · · · · · · · · · · · · · · 1.2 · · · ·Lilydale 2.6 53 1 · · 2.6 · · · · · · · · · · · · · · · · · · · · · · · · ·Main Ridge 2.8 · · 1.4 · · · · · 1.4 · · · · · · · · · · · · · · · · · · ·Melbourne Airport 6.0 42 1 · · · · · · · 1.8 0.2 0.2 1.8 1.2 · · · · · · · · 0.8 · · · · · · ·Melbourne Regional Office 3.0 47 1 · · · · · · · 0.8 0.6 · · · · · · · · · · · 0.2 · · · 1.2 0.2 · ·Mitcham 4.8 57 1 2.0 1.2 0.6 1.0Moorabbin Airport 1.6 44 1 · · · · · · · · 0.8 · · · · · · · · · · · 0.6 · · · · 0.2 · ·Mornington 5.8 43 1 · · · · · · » » 4.0 · · 1.8 · · · · · · · · · · · · · · · ·Oakleigh (Metropolitan Golf Club) 2.8 48 1 · · 0.8 · · · · · · · · · · · · · · · · · 1.4 · · · 0.6 · · ·Phillip Island Penguin Reserve 2.6 33 1 0.8 · 0.2 0.1 · · · 1.3 · 0.2 · · · · · · · · · · · · · 0.4 · · ·Prahran (Como House) 4.6 46 1 · · 0.4 · · · · · 0.8 · · · · · · · · · · · · · 0.2 · · 3.2 · ·Preston Reservoir 4.6 49 1 0.6 1.6 0.2 0.2 0.2 0.6 0.2 0.4 0.6Rhyll 3.6 39 L · · · · · · · 0.2 2.6 · · 0.8 · · · · · · · · · · · · · · · ·Rosebud (Country Club) 3.4 42 1 1.6 0.4 · · · · · · 1.0 · · · · · · · · · · · 0.4 · · · · · · ·Scoresby Research Institute 6.0 52 1 · · 3.8 · · · · 2.2 · · · · · · · · · · · · · · · · · · · ·Springvale Necropolis 3.0 54 1 · · · · · 1.0 · · 2.0 · · · · · · · · · · · · · · · · · · ·Toorourrong Reservoir (Toorourrong) 3.8 53 1 1.4 0.4 0.2 1.4 0.4Ventnor (Oaklands) 4.0 43 1 · 1.0 0.4 0.8 · · · 0.4 1.4 · · · · · · · · · · · · · · · · · · ·Viewbank (ARPANSA) 3.6 44 L · · 1.0 · · · · 1.0 · · · · · · · · · · · 0.2 0.6 · · · 0.6 0.2 · ·Wallan (Kilmore Gap) 4.8 45 1 · · 3.0 0.2 · · · 0.8 · · · · · · · · · · · · 0.4 0.2 · · · 0.2 · ·Warburton (O'Shannassy Reservoir) 3.6 63 1 0.4 1.4 0.8 0.6 0.4Warrandyte 1.0 49 1 1.0Wonthaggi 5.2 45 1 · 0.5 · · · · · 0.2 3.4 · · · · · · · · · · · · · · · 0.5 · · 0.6Yan Yean 2.4 45 1 1.0 0.2 0.2 0.8 0.2
West Central (87) Total Avg Decile 1 2 3 4 5 6 7 8 9 10 11 12 13 14 15 16 17 18 19 20 21 22 23 24 25 26 27 28Avalon Airport 2.6 32 2 · · 0.2 · · · · · 2.4 · · · · · · · · · · · · · · · · · · ·Ballan 5.0 47 2 · · 2.2 0.6 · · · 0.6 0.8 · · 0.8 · · · · · · · · · · · · · · · ·Bannockburn 2.8 35 1 · · 1.2 · · · · · 1.0 0.4 0.2 · · · · · · · · · · · · · · · · ·Barwon Heads Golf Club 4.4 1.0 2.8 0.6Blackwood 2.5 53 1 · · 1.0 · · · · · · · 0.6 0.4 · · · · · · · 0.4 · · · · · · · 0.1Clifton Springs 3.2 · · 1.0 · · · · · 1.0 · 0.4 · · · · · · · · · 0.6 · · · 0.2 · · ·
Monthly Weather Review Victoria February 2009
page 17

Daily and total rainfall for February 2009Total is the total precipitation for February 2009; a missing total indicates there is concern about the quality of some of the daily values. Avgis the long-term average total precipitation for February. Decile is the decile rank of total precipitation for February 2009 in the climaterecord of other February totals; “L” indicates this is the lowest on record, and “H” it is the highest on record. Long-term average and decilerank are only shown if there are sufficient years of climate record available. Reports of zero precipitation are shown as “· ”. When a readingwas accumulated over more than one day, “»” is shown on the days that are part of the accumulation.Durdidwarrah 1.0 48 1 · 0.2 · 0.6 · · 0.2 · · · · · ·Grovedale (Geelong Airport) 2.2 30 L · · 0.4 · · · · 0.2 0.2 · · 1.4 · · · · · · · · · · · · · · · ·Lancefield 2.6 41 1 · · · · · · · 2.0 0.2 · » » 0.2 · · · · · · 0.2 · · · · · · · ·Laverton RAAF 1.8 46 1 · · · · · · · 0.4 1.0 0.4 · · · · · · · · · · · · · · · · · ·Meredith (Darra) 8.0 47 2 · · 2.0 · · 0.4 · · 3.4 · 0.6 1.4 · · · · · · · · 0.2 · · · · · · ·Moorabool River at Morrisons 5.0 · · · · · · 5.0 · · · · · · · ·Sheoaks 3.6 38 L · · 0.6 · · · · · 2.0 · 0.4 0.4 · · · · · · · · · · · · · · 0.2 ·Sunbury (Salesian College ) 2.4 46 1 2.4
North Central (88) Total Avg Decile 1 2 3 4 5 6 7 8 9 10 11 12 13 14 15 16 17 18 19 20 21 22 23 24 25 26 27 28Acheron River @ Taggerty · 29 L · · · · · · · ·Alexandra (Post Office) 4.4 37 1 · · 0.4 · · · » » 2.0 · · · · · · · · · · 2.0 · · · · · · · ·Avenel (Post Office) 2.0 34 2 · · 1.6 · · · · · · · · · · · · · · · · 0.4 · · · · · · · ·Broadford (Kilmore North) 0.6 · · · · · · · · · · · · · · · · · · · 0.6 · · · · · · · ·Bullarto South 0.2 · · · · · · · · 0.2 · · · · · · ·Cairn Curran Reservoir 1.8 33 2 1.8Castlemaine Prison 3.6 32 2 · · · · · · · 0.8 · · · · · · · · · · · 2.8 · · · · · · · ·Clunes 1.0 37 1 0.6 · · · · · · 0.4 · · · · · · · · · · · · · · · · · · · ·Eildon Fire Tower 3.2 33 L · · 0.4 · · · · · 1.2 · · · · · · · · · · 1.6 · · · · · · · ·Heathcote 1.8 34 2 · · · · · · · · · · · · · · · · · · · 1.8 · · · · · · · ·Kinglake West (Wallaby Creek) 3.2 59 1 2.0 0.6 0.6Kyneton 3.0 39 2 · · 2.0 · · · · 1.0 · · · · · · · · · · · · · · · · · · · ·Lake Eildon 2.0 41 1 · · 0.4 · · · · · 0.2 · · · · · · · · · · 1.4 · · · · · · · ·Mangalore Airport 1.4 33 1 · · 1.0 · · · · · 0.2 · · · · · · · · · · 0.2 · · · · · · · ·Maryborough 4.5 32 3 · · 0.1 · · · · · · · · · · · · · · · · 4.4 · · · · · · · ·Marysville Golf Course · · · · · · · · · ·Redesdale 0.8 36 2 · · · · · · · · 0.2 · · · · · · · · · · 0.6 · · · · · · · ·Strath Creek 0.2 33 1 · · 0.2 · · · · · · · · · · · · · · · · · · · · · · · · ·Trentham (Post Office) 0.8 54 1 · · 0.2 · · · · · · · 0.6 · · · · · · · · · · · · · · · · ·
Western Plains (89) Total Avg Decile 1 2 3 4 5 6 7 8 9 10 11 12 13 14 15 16 17 18 19 20 21 22 23 24 25 26 27 28Ararat Prison 1.8 32 1 · · · · · · · 0.2 1.2 · · · · · · · · · · 0.4 · · · · · · · ·Ballarat Aerodrome 2.2 43 1 · · · · · · · · 1.2 · · · · · · · · · · · · 0.2 · · · · · 0.8Balmoral (Post Office) 0.2 26 1 0.2Beaufort 2.4 40 1 · · · · · · · · 2.0 · · · · · · · · · · · · · · · · · · 0.4Cavendish (Post Office) 1.0 29 1 · · · · · · · · · · · · · · · · · · 1.0 · · · · · · · · ·Cressy 0.6 34 1 · 0.6 · · · · · · · · · · · · · · · · · · · · · · · · · ·Derrinallum (Post Office) 0.4 35 L · · · · · · · 0.4 · · · · · · · · · · · · · · · · · · · ·Dunkeld · 36 L · · · · · · · · · · · · · · · · · · · · · · · · · · · ·Glenthompson · 29 L · · · · · · · · · · · · · · · · · · · · · · · · · · · ·Leigh River @ Mount Mercer · · · · · · · · · ·Lismore (Post Office) 0.6 36 L · · · · · · · · 0.6 · · · · · · · · · · · · · · · · · · ·Skipton Post Office 1.6 39 1 · · · · · · · · 1.6 · · · · · · · · · · · · · · · · · · ·Warrambine Ck at Warrambine 0.4 42 2 · · · · 0.4 · · · · · · · · · ·Westmere · · · · · · · · · · · · · · · · · · · · · · · · · · · · ·Wickliffe 0.2 32 1 · 0.2Willaura (Main Street) · 33 L · · · · · · · · · · · · · · · · · · · · · · · · · · · ·
West Coast (90) Total Avg Decile 1 2 3 4 5 6 7 8 9 10 11 12 13 14 15 16 17 18 19 20 21 22 23 24 25 26 27 28Aireys Inlet 3.6 37 L · 0.6 0.4 · · · · · · · 2.4 · · · · · · · · · · · · · 0.2 · · ·Apollo Bay 8.8 50 1 1.2 1.4 2.8 · 0.2 0.2 · · · 0.4 0.4 1.8 0.2 · · · · · · · 0.2 · · · · · · ·Benwerrin 0.4 · 0.2 · 0.2 · · ·Boonah 5.8 · 0.2 0.8 0.2 · · · · · 0.6 3.0 0.4 0.2 · · · · · 0.2 · · · · · · · 0.2 ·Camperdown 0.2 · · · · · · · · · · 0.2 · · · · · · · · · · · · · · · · ·Cape Nelson Lighthouse · 23 L · · · · · · · · · · · · · · · · · · · · · · · · · · · ·Cape Otway Lighthouse 1.6 42 1 · 0.2 0.2 · · · · · · 0.4 0.4 0.4 · · · · · · · · · · · · · · · ·Caramut 0.6 28 1 0.6Casterton Showgrounds 2.0 24 1 0.6 0.2 · · · · · · · · 0.4 0.6 · · · · · · · · 0.2 · · · · · · ·Casterton · · · · · · · · · · · · · · · · · · · · · · · · · · · · ·Cobden (Post Office) 0.4 40 1 » » » » » » 0.2 » » » » » » 0.2Colac (Mount Gellibrand) 1.0 · 0.8 · · · · · 0.2 · · · · · · · · · · · · · · · · · · · ·Coleraine Hospital 1.6 26 1 · 1.6 · · · · · · · · · · · · · · · · · · · · · · · · · ·Forrest State Forest 1.4 48 1 · · · · · · · · · · 0.8 · 0.6 · · · · · · · · · · · · · · ·Haines Junction (Mount Sabine) 2.2 0.4 0.4 · 0.2 · · · · 0.2 1.0 ·Hamilton Airport 0.4 23 L · · · · · · 0.2 0.2 · · · · · · · · · · · · · · · · · · · ·Hawkesdale (Post Office) 4.2 33 1 · · · · · 0.4 0.4 · · 0.8 1.0 1.6 · · · · · · · · · · · · · · · ·Heywood Forestry 3.6 29 1 · · · · · · 0.2 » 1.2 0.1 » 2.1 · · · · · · · · · · · · · · · ·Koroit 1.4 34 1 · · · · · · · · · 0.2 0.2 1.0 · · · · · · · · · · · · · · · ·Lorne (Mount Cowley) 5.8 0.4 0.2 0.2 · · 4.8 · · · 0.2 · ·Merino 0.8 30 1 · · · · · · · · · 0.8 · · · · · · · · · · · · · · · · · ·Mortlake Racecourse 0.8 30 L 0.6 · · · · · · · · · 0.2 · · · · · · · · · · · · · · · · ·Nelson · 29 L · · · · · · · · · · · · · · · · · · · · · · · · · · · ·Penshurst (Post Office) 0.2 34 1 · · · · · · 0.2 · · · · · · · · · · · · · · · · · · · · ·Port Campbell Post Office 0.4 39 L 0.4Port Fairy AWS 1.6 27 L · · · · 0.2 · 0.4 · · · 0.4 0.6 · · · · · · · · · · · · · · · ·Portland (Cashmore Airport) 2.6 25 1 · · · · · · · · · 1.6 · 0.8 · · · · · · · · · · · 0.2 · · · ·Terang · 38 L · · · · · · · · · · · · · · · · · · · · · · · · · · · ·Warrnambool Airport NDB 1.6 32 L · · · · · · · · · · 0.2 1.4 · · · · · · · · · · · · · · · ·Weeaproinah 16.2 86 1 0.4 0.2 1.8 0.4 · 0.6 · · 0.2 2.4 1.4 1.6 3.2 · · · 0.2 · · · 2.0 · · 0.4 1.2 0.2 · ·
Monthly Weather Review Victoria February 2009
page 18