mooring tanker
TRANSCRIPT
8/6/2019 Mooring Tanker
http://slidepdf.com/reader/full/mooring-tanker 1/7
NIPPON STEEL TECHNICAL REPORT No. 60 JANUARY 1994
UDC627.338
D e s ig n o f M u l t i - B u o y M o o r i n g B e r t h
K in ji Sek i ta "
Tadash i To r ii * 1
Kazu to N ish imu ra "
Abstract:
The K uji U nderground O il Storage T erm inal adopts a unique six-point m ooring
berth for tanker m ooring in place of the conventional fixed berth . The reason is
an extrem ely sm all num ber of days w orked per year for oil loading and unloading.
W hen a tanker moored at multip le points is exposed to waves, w inds, and tidal
currents, it sw ays and yaw s under constant external forces. It m ove s w ith re spe ct
to the point of equilibrium over a long period corresponding to the intrinsic period
of floating bodies and over a short period corresponding to the w ave period. A de-
sign technique w as developed for estim ating the m axim um tanker m otions by the
tim e h isto ry re sp on se a na ly sis o f lo ng -p erio d m otio ns w ith th re e d eg re es o f slo w d rift
oscila tion and six degree of short-period oscila tion and for com puting the m axi-
m um m ooring force of the m ooring lines, while considering the nonlinear load-
elongation relationship of the m ooring lines and the contact of the anchor cablesand sinkers w ith the sea bed. The design of the mooring buoy berth , including the
c om p ariso n o f th e c om pu ta tio na l re su lts w ith th e e xp erim en ta l re su lts, is d esc rib ed .
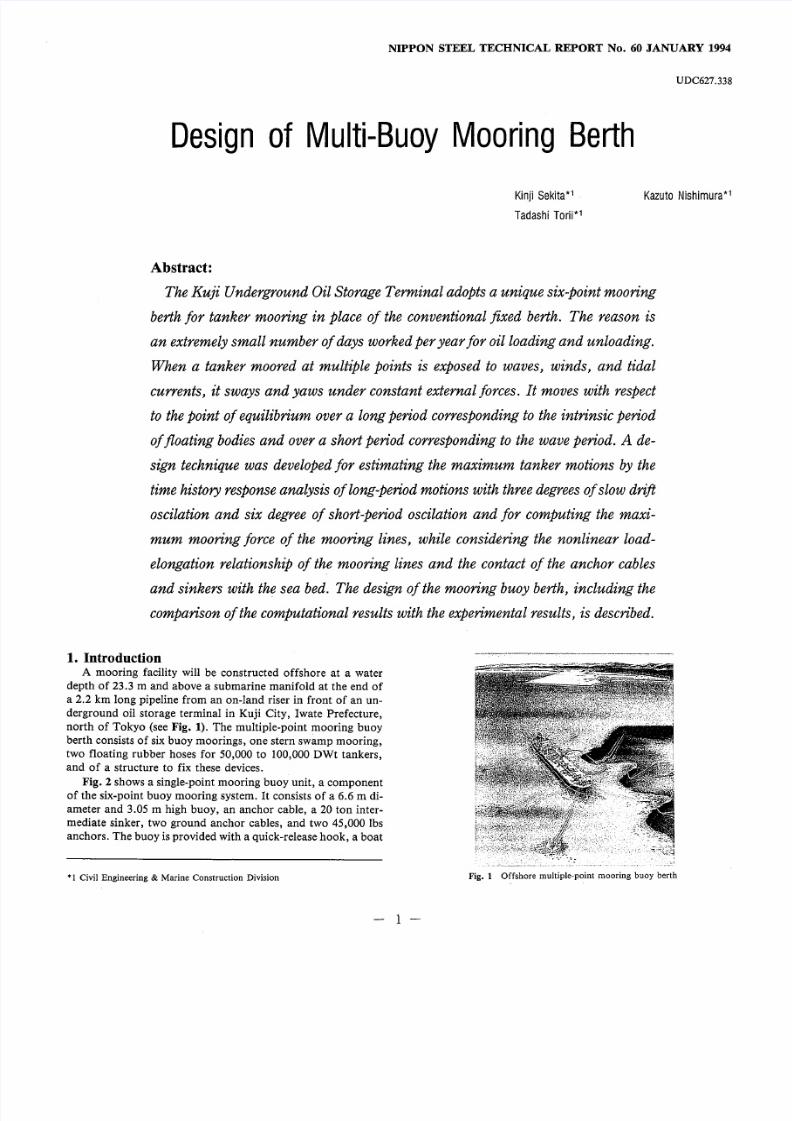
1. IntroductionA mooring facility will be constructed offshore at a water
depth of 23.3 m and above a submarine manifold at the end of
a 2.2 km long pipeline from an on-land riser in front of an un-
derground oil storage terminal in Kuji City, Iwate Prefecture,
north of Tokyo (see Fig. 1). The multiple-point mooring buoy
berth consists of six buoy moorings, one stern swamp mooring,
two floating rubber hoses for 50,000 to 100,000 DWt tankers,and of a structure to fix these devices.
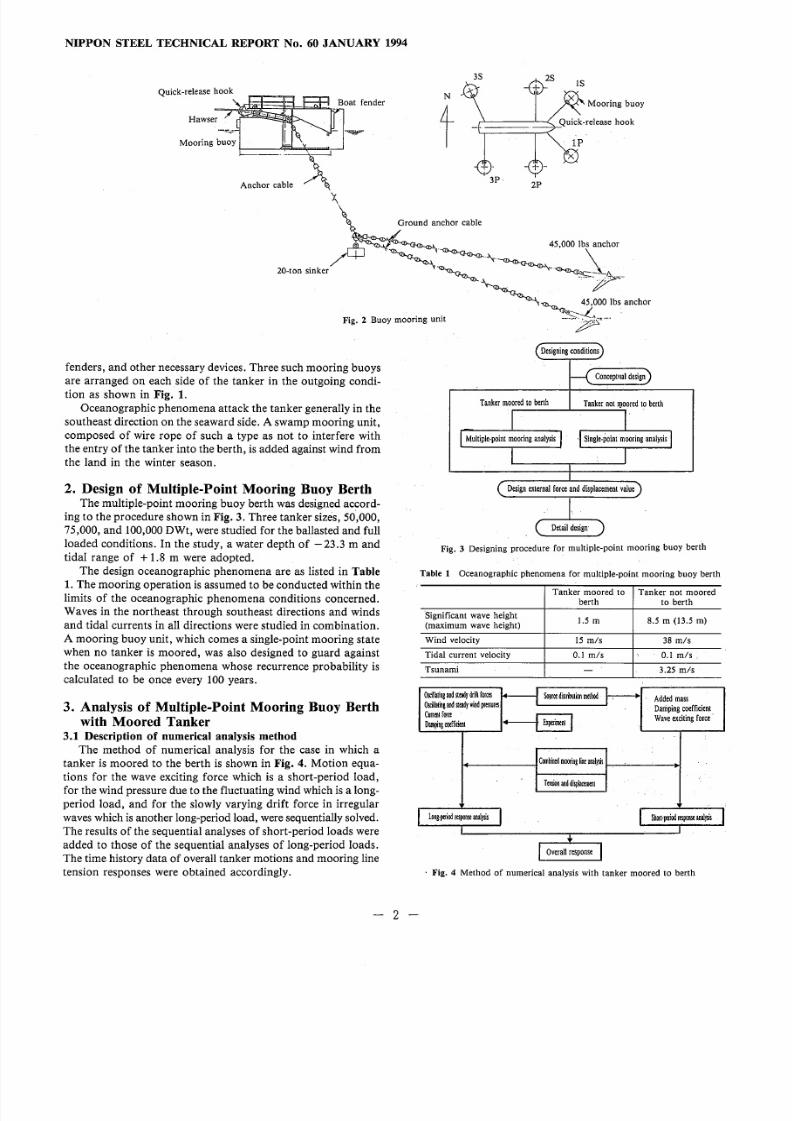
Fig. 2 shows a single-point mooring buoy unit, a component
of the six-point buoy mooring system. Itconsists of a 6.6 m di-
ameter and 3.05 m high buoy, an anchor cable, a 20 ton inter-
mediate sinker, two ground anchor cables, and two 45,000 lbs
anchors. The buoy isprovided with a quick-release hook, a boat
*1 Civil Engineering & Marine Construction Division Fig. 1 Offshore multiple-point mooring buoy berth
-1-
8/6/2019 Mooring Tanker
http://slidepdf.com/reader/full/mooring-tanker 2/7
NIPPON STEEL TECHNICAL REPORT No. 60 JANUARY 1994
3S
fenders, and other necessary devices. Three such mooring buoys
are arranged on each side of the tanker in the outgoing condi-tion as shown in Fig. 1.
Oceanographic phenomena attack the tanker generally in the
southeast direction on the seaward side. A swamp mooring unit,
composed of wire rope of such a type as not to interfere with
the entry of the tanker into the berth, isadded against wind from
the land in the winter season.
2. Design of Multiple-Point Mooring Buoy BerthThe multiple-point mooring buoy berth was designed accord-
ing to the procedure shown in Fig. 3. Three tanker sizes, 50,000,
75,000, and 100,000DWt, were studied for the ballasted and full
loaded conditions. In the study, a water depth of - 23.3 m and
tidal range of + 1.8 m were adopted.
The design oceanographic phenomena are as listed in Table
1.The mooring operation isassumed to be conducted within the
limits of the oceanographic phenomena conditions concerned.
Waves in the northeast through southeast directions and winds
and tidal currents in all directions were studied in combination.
A mooring buoy unit, which comes a single-point mooring state
when no tanker is moored, was also designed to guard against
the oceanographic phenomena whose recurrence probability is
calculated to be once every 100 years.
3. Analysis of Multiple-Point Mooring Buoy Berthwith Moored Tanker
3.1 Description of numerical analysis method
The method of numerical analysis for the case in which a
tanker is moored to the berth is shown in Fig. 4. Motion equa-
tions for the wave exciting force which is a short-period load,
for the wind pressure due to the fluctuating wind which is a long-
period load, and for the slowly varying drift force in irregular
waveswhich is another long-period load, were sequentially solved.
The results of the sequential analyses of short-period loads were
added to those of the sequential analyses of long-period loads.
The time history data of overall tanker motions and mooring line
tension responses were obtained accordingly.
Mooring buoy
( D es ig n in g c o nd it io n s
HC o n c ep tu a l d e si g0
T a n ke r m o o re d t o b er t h T an ke r n ot m o o re d t o b er t h
_ l1li ng le -p o in t m o o r i ng a n al ys is J
J
l M u l ti pl e- po in t m o o r i ng a n al ys is I
l
( D e s i g n e xt e rn al f o rc e a nd d is pl a ce m en t v al u e)
I
D e t ai l d e s ig n '
Fig. 3 Designing procedure for multiple-point mooring buoy berth
Table 1 Oceanographic phenomena for multiple-point mooring buoy berth
Significant wave height(maximum wave height)
3.25 mls
Tanker moored to Tanker not mooredberth to berth
1.5 m 8.5 m (13.5 m)
Wind velocity 15 mls 38 mls
Tidal current velocity 0.1 mls 0.1 mls
Tsunami
O s c i l b J i n g a n d ~ e a d y d r i l l l o I C ~ r-t S o u l ~ d i s l r ib u l i o nm t l h o d _ r - - . - + A d d ed m a s sO ~ i l l a l i n g a n d ~ c a d y w i n d p r ~ S U I ~
D a m p in g c o ef fi ci en tC u n e n l l o r c e
~W a v e e x c it in g f o rc e
D a m ~ n g c o e l f i c i e n l
C o m b i n e dm o o r i n g l i n e a n a l y s i l
T e n s i o n a n d d i l ~ a c e m e n l
l o n g · p e r i o d l ~ p o n ~ a n a l y s i s S h O r J · p e l i o d l ~ p o n ~ a n a l y s i l
_ + _
I O v e r al l r e sp o n s e I. Fig. 4 Method of numerical analysis wi th tanker moored to berth
- 2 -

8/6/2019 Mooring Tanker
http://slidepdf.com/reader/full/mooring-tanker 3/7
This method of numerical analyses is described below.
(1) The short-period motions were considered by six degrees of
freedom. The hydrodynamic force coefficients and wave ex-
citing force in the motion equations were determined by the
three dimensional source distribution method.
(2) The long-period motions were studied taking into considera-
tion three degrees of freedom, i.e., sway, surge and yaw. The
added mass coefficient and wave drift force in the motion
equations were determined by the three-dimensional sourcedistribution method. The damping coefficients were based on
values obtained by free oscillation experiments in calm
water!', The wind loads were computed from the experimen-
tally determined wind drag force coefficients.
(3) The hawser load-elongation nonlinearity, buoy buoyancy
change, and sinker rise from and fall to the sea bottom were
taken into account when determining the restoring characteris-
tics of the mooring lines.
(4) The numerical analyses were performed by the Newmark (3
method at time intervals of 0.5 s for 1 to 2 h.
3.2 External forces acting on tanker
Each external force component was computed according in
principle to the "Technical Standards for Port and Harbor Fa-
cilities and Commentary".3 .2.1 Load due to tidal current
The tidal current force (F) acting on the tanker is calculated by
F= ~ P w Vc2AC ...... (1)
where P w is density of sea water; Vc is tidal current velocity; A
is projected area of tanker below the surface of water; and C
is value dependent on relative tidal current direction, the depth
of water and draft.
3.2.2 Wind load
The wind load acting on the tanker is resolved into surge, sway
and yaw components (Fx, Fy, Mz, respectively) and computed by
(
F'x ) (COXAt 1Fy = ~P. CoyAs I U+u(t) I - ru-uu»Mz ConAsL
. .. .. . ( 2)
where Pa is density of air; Cox, COYand COn are experimentally
determined wind drag force coefficients of tanker; L is length
of tanker; At and As are front and side projected areas of tanker
above water surface, respectively; and U is 10 min average wind
velocity. The fluctuating wind velocity u(t) was given by a Furier
series by using the amplitude calculated from a wind spectral den-
sity of the Davenport type and the phase determined from ran-
dom number generation.
3.2.3 Wave drift force
The constant components and fluctuation components of the
wave drift force ( : F ; c , F Y , Mz) are simultaneously given by2)
(
h(t) 1 ( F X 1~(t) = Fy g~St)
Mz(t) Mz
. .. .. . ( 3)
where [Fx, Fy, MzJ are constant components of wave drift
force; 1]'2 is variance value of irregular wave; and q(t) is water
surface elevation.
Since it is decided to separately solve the long-period and short-
NIPPON STEEL TECHNICAL REPORT No. 60 JANUARY 1994
period responses, the solution of the long-period response equa-
tion diverges if there is a high-frequency component. Time
series data simulating both wind load and wave slow drift were
then Fourier-transformed, and high-frequency components great-
er than 0.1 Hz were cut. The resultant data were further inverse
Fourier-transformed and returned to time history response data.
The cut high-frequency components were similarly inverse trans-
formed and added to the wave exciting force time history as
described next.3.2.4 Wave exciting force
The six-degrees-of-freedom wave exciting force F(t) for irregu-
lar waves is computed from the wave force magnification factor
in regular waves as given by
F(t) = . r ; .j2S C O df H(f)cos(27rf+s) . .. .. . ( 4)
where S(f) is wave spectrum; H(f) is wave force magnification
factor of regular waves; f is frequency; and e is phase lag (ran-
dom number generation). Like the fluctuating wind velocity com-
ponents, the water surface elevation time history ';(t) in Eq. (3)
and the wave exciting force are prepared by the Bretschneider-
Mitsuyasu type wave spectra and by random number generation.
3.3 Damping coefficient
The decay of long-period motions, an important factor in this
analysis, was determined taking into consideration the experimen-
tal results given in Table 2. Take yaw for example. Since the os-
cillatory waveform is small in the free oscillation experiment, the
response is represented by the following oscillatory waveform of
a one-degree-of-freedom system (Y(t»:
Y (t) =e-n'(Yocosp.jl-n2!p t
+ Yo+nYo . .j~2 2 )
p.jl-n2jp2 smp l-n~/P~ t . .. .. . ( 5)
where p is 27l"/T n; Tn is natural period; and t is time.
As shown in Fig. 5, the initial velocity Yo was assumed with
the initial angle Yo of yaw as the origin, and the natural frequency
Tn and the damping index n were determined so that the ex-
perimental line should agree with the free oscillation waveform
expressed by Eq. (5). Since surge appeared larger than that studied
by Wichers'", the results of Wichers were used on the conserva-
tive side. The sway of the tanker in the ballasted condition in
Table 2 was used by referring to the results of Ando et aI. about
Table 2 Surge, sway, and yaw damping coefficients used for purpose of
computation
Ballasted condition Full loaded condition
Surge Cx 10 tm-Is 100 tm-Is
Sway c- 30 tm!s 600 tm-Is
Yaw CN 5 x 10⁴ tms 1.0 x 10⁶ tms
Full loaded condition
Measured,-waveform
,--' Fit curve
Fig. 5 Computation of damping coefficient
- 3 -
8/6/2019 Mooring Tanker
http://slidepdf.com/reader/full/mooring-tanker 4/7
NIPPON STEEL TECHNICAL .REPORT No. 60 JANUARY 1994
box-shaped flat barge. In the absence of comparable data, the
smallest values of the experimental results were used for yaw.
The damping coefficient of short-period motion with respect
to the significant wave height H1I3and the significant wave peri-
od T1I3was determined as follows. The curves of the damping
coefficient Cjk(f) for six components in regular waves analyzed
by the three-dimensional source distribution method were precal-
culated. The equivalent damping coefficient Cjk was obtained by
f o~ S (f)eJk (0 df
fo~ S(f)df······(6)
Nonlinearity was taken into account for the roll of the tanker.
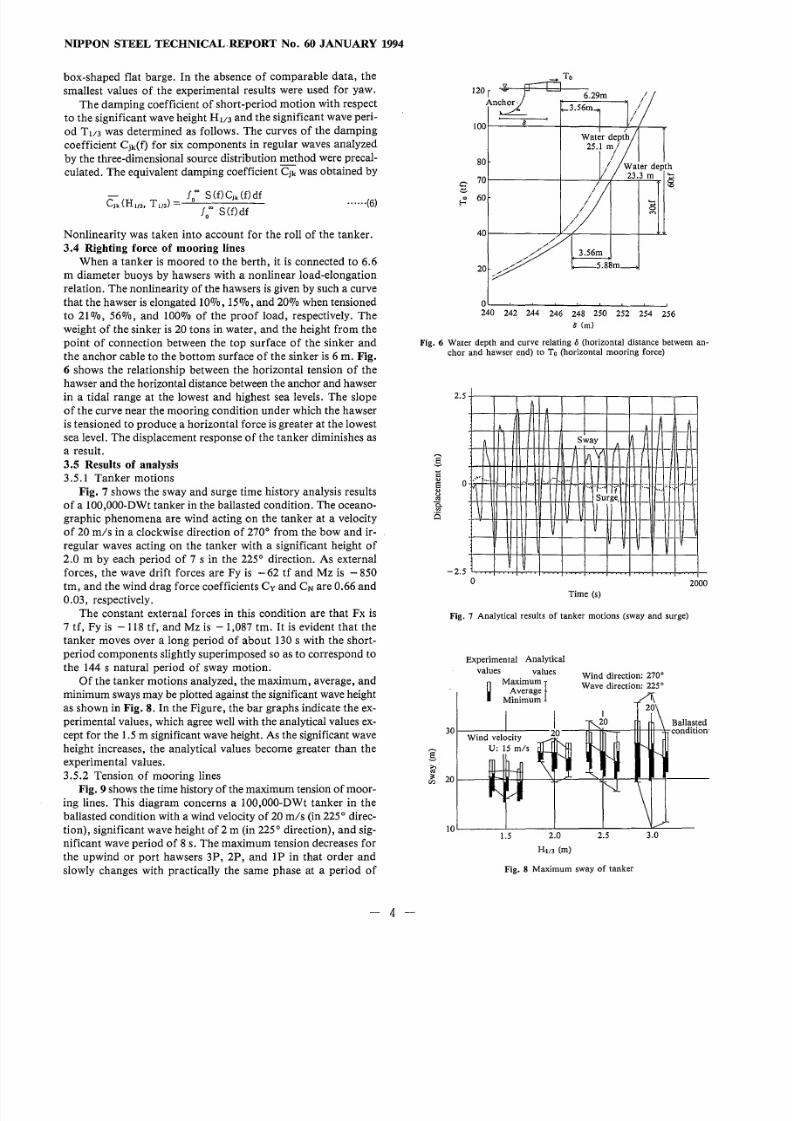
3.4 Righting force of mooring lines
When a tanker is moored to the berth, it is connected to 6.6
m diameter buoys by hawsers with a nonlinear load-elongation
relation. The nonlinearity of the hawsers isgiven by such a curve
that the hawser is elongated 10070,15%, and 20% when tensioned
to 21%, 56%, and 100% of the proof load, respectively. The
weight of the sinker is 20 tons in water, and the height from the
point of connection between the top surface of the sinker and
the anchor cable to the bottom surface of the sinker is 6 m. Fig.
6 shows the relationship between the horizontal tension of the
hawser and the horizontal distance between the anchor and hawser
in a tidal range at the lowest and highest sea levels. The slope
of the curve near the mooring condition under which the hawser
istensioned to produce a horizontal force isgreater at the lowest
sea level. The displacement response of the tanker diminishes as
a result.
3.5 Results of analysis
3.5.1 Tanker motions
Fig. 7 shows the sway and surge time history analysis results
of a 100,000-DWt tanker in the ballasted condition. The oceano-
graphic phenomena are wind acting on the tanker at a velocity
of 20 mls in a clockwise direction of 2700 from the bow and ir-
regular waves acting on the tanker with a significant height of
2.0 m by each period of 7 s in the 2250 direction. As external
forces, the wave drift forces are Fy is - 62 tf and Mz is - 850tm, and the wind drag force coefficients Cy and CN are 0.66 and
0.03, respectively.
The constant external forces in this condition are that Fx is
7 tf, Fy is -118 tf, and Mz is - 1,087 tm. It is evident that the
tanker moves over a long period of about 130 s with the short-
period components slightly superimposed so as to correspond to
the 144 s natural period of sway motion.
Of the tanker motions analyzed, the maximum, average, and
minimum swaysmay be plotted against the significant wave height
as shown in Fig. 8. In the Figure, the bar graphs indicate the ex-
perimental values, which agree wellwith the analytical values ex-
cept for the 1.5 m significant wave height. As the significant wave
height increases, the analytical values become greater than the
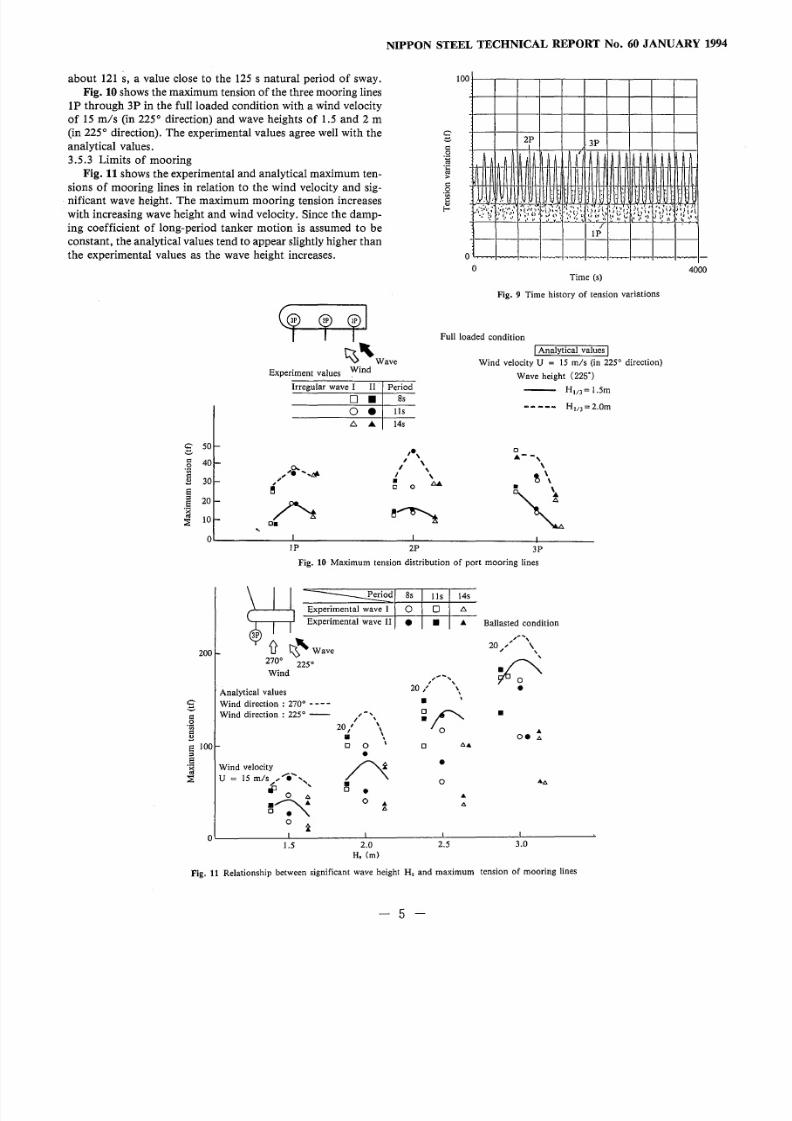
experimental values.3.5.2 Tension of mooring lines
Fig. 9 shows the time history of the maximum tension of moor-
ing lines. This diagram concerns a 100,000-DWt tanker in the
ballasted condition with a wind velocity of 20mls (in 2250 direc-
tion), significant wave height of 2 m (in 2250 direction), and sig-
nificant wave period of 8 s. The maximum tension decreases for
the upwind or port hawsers 3P, 2P, and IP in that order and
slowly changes with practically the same phase at a period of
- 4 --
120r~
An~ 1"------_
100r--~8---+---+-~~--.
80
Q70
~~ 60
40//,/
,/
20/./.,,"""
/
5.88m
o~~_~_~~_~~~~~240 242 244 246 248 250 252 254 256
8 (rn)
Fig. 6 Water depth and curve relating 5 (horizontal distance between an-chor and hawser end) to To (horizontal mooring force)
2.5-t----,---,---,----.--,---,---.----.--,-----,
Sway+--+f<r--tH-+I-t-H--,l----j---l--jf----II- - - - -
1 \ / \ 1 /1+-H+H--ttt-HtH-ttl-tHl+f-jH--HH--/--t\- - - ..- --
0- .
"\.. . .. .: : :: - 7 " . .
-H-t--+fHH+-H-+lI--H--H-t-HH Surge,
I I
_ • M . .. ' • ..,_. . . . . ,','
-j----tf----tt+H--tt--'---t----j--jI/--l/-HI- - - - --
-2.5~~~~~~~~~~~~~_~~~~·-o 2000
Time (s)
Fig. 7 Analytical results of tanker motions (sway and surge)
Experimental Analytical
values values
~
MaXimUm!AverageMinimum
Wind direction: 27 00
Wave direction: 22 50
Ballasted---;rk-'li===-----tit--+ft---:bcondition·
g~~ 20~- __~~r---~~--~~1r-;~r-~------
1.5 2.0
HII3 (m)
Fig. 8 Maximum sway of tanker
8/6/2019 Mooring Tanker
http://slidepdf.com/reader/full/mooring-tanker 5/7
about 121 s, a value close to the 125 s natural period of sway.
Fig. 10shows the maximum tension of the three mooring lines
1P through 3P in the full loaded condition with a wind velocity
of 15 mls (in 2250 direction) and wave heights of 1.5 and 2 m
(in 2250 direction). The experimental values agree well with the
analytical values.
3.5.3 Limits of mooring
Fig. 11 shows the experimental and analytical maximum ten-
sions of mooring lines in relation to the wind velocity and sig-nificant wave height. The maximum mooring tension increases
with increasing wave height and wind velocity. Since the damp-
ing coefficient of long-period tanker motion is assumed to be
constant, the analytical values tend to appear slightly higher than
the experimental values as the wave height increases.
sS 20.~:; E
C ¥ ~ fl~"wave
Experiment values Wind
Irregular wave I II
NIPPON STEEL TECHNICAL REPORT No. 60 JANUARY 1994
o •o •6... 14s
,,~ ..... .#
{"
o 4000Time (s)
Fig. 9 Time history of tension variations
Full loaded condition
Period
IAnalytical values IWind velocity U = 15 mls (in 2250 direction)
Wave height (225')H'13= 1.5m
----- H'13=2.0m8s
us
0 ~ - - - - - - - - ~ - - - - - - - - - - - - - - - - ~ - - - - - - - - - - - -_-4 __IP
200
C'< : : : .0:
.2;g!:l
s 100
=s.~:; E
2P 3P
Fig. 10 Maximum tension distribution of port mooring lines
~eriod 8s L l s 14s
Experimental wave I 0 0 l'>
Experimental wave II • • . ..
~If ~'wave
2700
2250
Wind
Ballasted condition
. . . . . . . . . . ,, ,20,' '.. '
,~..,20,' ,
~•
Wind velocity
U = 15 mls ...... ' ...jJ ,
o 6
~~o i
OL_ _L ~--------~------~~------~
1.5 2.0 2.5 3.0
H, (m)
Analytical values
Wind direction : 2700 - - --
Wind direction: 2250 -- r>,
20/ '.. '.D 0 \
•/"{~ .
o ...6
•.. .
o e 6D 6...
•o
.. .6
Fig. 11 Relationship between significant wave height H, and maximum tension of mooring lines
- 5 -

8/6/2019 Mooring Tanker
http://slidepdf.com/reader/full/mooring-tanker 6/7
NIPPON STEEL TECHNICAL REPORT No. 60 JANUARY 1994.4. Analysis of Multiple-Point Mooring Buoy Berthwithout Moored TankerAnchors at the buoy berth are installed so that each anchor
can effectively exhibit its holding force in the direction of the
mooring line it serves. When the tanker is not moored to the
multiple-point buoy berth, the sinker located on the weather side
of the anchor for the buoy in the direction of the external force
as shown in Fig. 12(a) isliable to be dragged by the external force
until it forces the anchor out of the seabed.In case the tanker is not moored to the buoy berth, therefore,
the strength of the mooring lines and the details of the anchors
must be examined against the design conditions listed in Table
1. When the tanker is not moored to the buoy berth, the loads
that act on the buoys of the berth total 1.62 tf for the tidal cur-
rent force, wind load, and steady wave drift force combined. Of
these force components, the wind load is predominant. Its wind
drag force coefficient C, is put at 1.0 for the buoy proper and
at 1.3 for the deck structure. The drag coefficient Cd is put at
1.0 for tsunami surge, and a tidal current pressure of 5 tf is as-
sumed to act on each buoy.
4.1 Evaluation of buoy motions
Buoy motions in regular waves were analyzed by the three-
dimensional source distribution method, and the 1 1 1000 maxi-mum expected value of surge with a significant wave height of
8.5 m (wave period of 14 s)was estimated at 11.25 m bythe short-
term statistical prediction method.
4.2 Frictional force of sinker, ground anchor cable, and anchor
As to the stability of the anchor, such an extreme case was
assumed that the anchor is located behind the sinker in the direc-
tion of the external force as shown in Fig. 12(a), in which posi-
tion it would produce no designholding force but a mere frictional
force.
In this extreme case, the frictional force is 45 tf when the
coefficient of friction with the sand of the seabed is put at 0.6
for the sinker, 0.75 for the ground anchor cable, and 0.6 for the
anchor. The anchor is actually buried in a hole dug in the seabed
stiff soil for added safety. This frictional force of 45 tf is far great-
er than the tension of 5 tf when the tsunami surge arrives and
the tension of 42 tf when the anchor islocated behind the sinker
in the direction of the external force as shown in Fig. 12(a). It
is also greater than the horizontal force of 41.5 tf computed tak-
ing into account the effect of tidal current in the Morison equa-
tion while assuming that the buoy does not move when tsunami
as high as 15.35 m above the maximum sea level arrives. When
the anchor is located before the sinker in the direction of the ex-
ternal force as shown in Fig. 12(b), the horizontal force acting
on the buoy is 57 tf', The holding force of the anchor is 142.8
tf when the holding force factor is7. This means that the anchor
will not move.
5. Items Considered for Operational ControlIn the design stage, seven moorings, including a swamp moor-
ing, were analyzed. It was found as a result that waves arriving
with a significant wave height of 1.5 m (period of 9.5 s) in a direc-
tion of 2250 and winds arriving at a velocity of 15m/s in a direc-
tion of 2700 constitute critical conditions. The maximum design
tension and other factors may be summarized as shown in Table
3. The tension of mooring members is calculated from the
horizontal tension values in Table 3.
External force Buoy- Buoy External force+--
Sinker
(a) Anchor located aftersinker in direction of
external force
Sinker
(b) Anchor located before
sinker in direction of
external force
Fig. 12 Relationship among buoy, sinker, and anchor when tanker is not
moored to berth
Table 3 Maximum design tension
Tension when Tension when Tension whentanker is moored tsunami arrives tanker is not
to berth (tf) (tf) moored to berth(tf)
3S line 11 5 57(Anchor locatedbefore sinker)
3P line 68 5 42
(Anchor locatedafter sinker)
Swamp type30 - -mooring line
Maximum tanker Surge: - 1. 5 mmotion Sway: +8.5 m
Yaw: -0.9°
20
H, =1.5m (225°)
TIll = 7.0s
!.,____aximum motion
. ,____ Displacement due to
steady force
15
Surge
U= 15m/s (225°)O~-----L------~----~ ___
10 15
Initial tension T, (tf)
Fig. 13 Effect of initial tension of mooring lines on motion of tanker
The tanker motions, on the other hand, are analyzed for the
initial tension of 15 tf. Postulating that the buoy berth may also
be operated with much smaller initial tensions, response analy-
sis was conducted by determining the long-period motion damp-
ing coefficient C as follows:
C= 2 h"'Km (7 )
where h is damping constant obtained from the damping coeffi-cient shown for the tension of 15tf in Table 2; K isrighting coeffi-
cient of mooring lines; and m is mass.
The results of analysis performed using the damping coeffi-
cient are as shown in Fig. 13. When the initial tension is 5 tf,
the tanker motion increases to 13.5 m. This value falls within
the permissible range of movement of the oil loading and un-
loading rubber hose connecting the submarine manifold and the
tanker.
-6-
8/6/2019 Mooring Tanker
http://slidepdf.com/reader/full/mooring-tanker 7/7
NIPPON STEELTECHNICAL REPORT No. 60 JANUARY 1994
When the proof load of anchor cables after the service life
of 20 years was estimated from corrosion weight loss and wear,
it was found that the achieved safety factor was greater than the
specified value of 3.
The shape, draft, surplus buoyancy, and other details of the
buoys are determined so that they are not submerged when sub-
jected to the maximum horizontal force of 68 tf and remain in-
tact even when partly damaged.
The swamp mooring unit is composed of two wire ropes witha diameter of 33.5 mm and breaking strength of 71.1 tf, a 58
mm diameter anchor cable, a 9-ton sinker, and a 15,000-lbs
ground anchor cable. It is normally placed on the seabed and
isconnected to the winch of the tanker when the tanker ismoored
to the buoy berth.
6. ConclusionsIn the design of a multiple-point mooring buoy berth, the ves-
sel motion characteristics and mooring line tensions are deter-
mined according to the slow drift of the vessel due to wave
irregularity and wind fluctuation. Against long-period external
forces, the multiple-point mooring buoy berth was analyzed for
three degrees of freedom, i.e., surge, sway and yaw. With the
addition of roll, heave and pitch against short-period loads like
the wave exciting force, the time history response of the berth
was computed by analyzing a total of six degrees of freedom.
The computed results were superimposed on the three-degrees-
of-freedom motions obtained first. The newly developed designing
technique was verified through comparison with the results of
experiments conducted at the Port and Harbor Research Labora-
tory of the Ministry of Transportation. It was confirmed as a
result that the technique is high in accuracy as previously report-
ed. It was applied to the design of the multiple-point mooring
buoy berth to be constructed in the Kuji Bay. A series of numer-
ical simulation was performed with tanker size, orientation (in-
coming or outgoing) and load condition, wave height, wind
velocity, wind direction-wave direction combination, and other
conditions as parameters. The following findings were obtained:
(1)The mooring force and vessel motion become the largest for
the 100,000-DWt tanker.
(2)The orientation of the tanker does not significantly influence
the maximum mooring force.
(3)The tanker motion and mooring force are greater in the bal-
lasted condition with a greater wind load than in the loaded
condition.
(4)The maximum mooring force becomes the greatest when the
wind direction is 2700 (in south direction) and the wave direc-
tion is 2250 (in southeast direction).
(5)When the initial tension is small, the maximum tension is
small, but the maximum motion is large.
References
I) Hiraishi, T. , Takayama, T. , Sekita , K., Torii , T. : Experimental and Numeri-cal Study on Mooring Tension and Motion of a Tanker in a Multi-Buoy Berth.Proc. 3rd Intern. Offshore and Polar Engineering Conf, June 1993
2) Kato, S.: Simulation of Long-Period Motion and Mooring Force of MooredFloating Body in Irregular Waves. Report of Ship Research Institute. 25 (2),
March 19833) Wichers, J.E.W.: A Simulation Model for a SinglePoint Moored Tanker. (797),
Maritime Research Institute, Netherland
- 7 -