more on u.s. treasury term premiums: spot and … · more on u.s. treasury term premiums: spot and...
TRANSCRIPT

This paper presents preliminary findings and is being distributed to economists and other interested readers solely to stimulate discussion and elicit comments. The views expressed in this paper are those of the author and are not necessarily reflective of views at the Federal Reserve Bank of New York or the Federal Reserve System. Any errors or omissions are the responsibility of the author.
Federal Reserve Bank of New York Staff Reports
More on U.S. Treasury Term Premiums: Spot and Expected Measures
J. Benson Durham
Staff Report No. 658 December 2013
Revised May 2014
More on U.S. Treasury Term Premiums: Spot and Expected Measures J. Benson Durham Federal Reserve Bank of New York Staff Reports, no. 658 December 2013; revised May 2014 JEL classification: E52, G10
Abstract
Several studies that use affine term structure models (ATSMs) or survey data suggest that subdued nominal U.S. Treasury yields during the global financial crisis and its aftermath primarily reflected exceptionally low, if not negative, term premiums as distinct from depressed anticipated short rates. However, this literature pays little attention to the length of time market participants anticipated low term premiums to prevail, as captured by the “forward” or “expected” term premium over a given horizon, distinct from the “spot” term premium. Besides the implications for investors at the back end of the term structure, this issue relates to recent policy-related studies that argue that the persistence of interest rate shocks affects real outcomes. Unlike the consensus inference on low spot term premiums, the evidence on expected term premiums is somewhat mixed. Some ATSMs suggest that expected term premiums did drop substantially along with spot measures after 2007, but the simple survey-based estimate reported here notably indicates the opposite.
Key words: Treasury term premium, monetary policy _________________
Durham: Federal Reserve Bank of New York (e-mail: [email protected]). The author thanks Tobias Adrian, Richard Crump, Michael Bauer, Antulio Bomfim, Kris Dawsey, Andrew Dubinsky, Charles Himmelberg, Lotfi Karoui, Karin Kimbrough, Larry Meyer, Emanuel Moench, Nathan Sheets, Flemming Würtz, and seminar participants at the Federal Reserve Bank of New York and the European Central Bank for helpful comments. The views expressed in this paper are those of the author and do not necessarily reflect the position of the Federal Reserve Bank of New York or the Federal Reserve System. Any errors are the responsibility of the author.

1
1. Introduction
Most studies suggest that the subdued level of longer-dated nominal U.S. Treasury yields
on net since the onset of the global financial crisis owes to low if not negative term premiums,
rather than depressed anticipated short rates.1 Low term premiums on balance plausibly reflect
unconventional Federal Reserve policy, namely large scale asset purchases (LSAPs) that purport
to work through the portfolio rebalancing channel under the assumption of market segmentation
(Bernanke 2010; Stein, 2012; Gagnon et al., 2011), possible net flight-to-quality flows that
manifest another aspect of “special demand” or a “safety or scarcity premium” for the asset class
(e.g., Krishnamurthy and Vissing-Jorgensen, 2011, 2013), or, perhaps apart from LSAPs,
reduced uncertainty around the path for monetary policy given explicit forward-rate guidance by
the FOMC (e.g., Bauer and Rudebusch, 2012).
However, this literature generally does not distinguish between “spot” and “expected”
term premiums. Simply put, spot measures capture the compensation investors require, today, to
hold long- as opposed to short-term risk-free debt, whereas the “expected” term premium is what
they anticipate demanding sometime in the future. The two do not necessarily correlate
positively. Just as near-term expected short rates could decline in response to a surprise ease in
monetary policy, while more distant-horizon expected rates increase if that action boosts
expected longer-run inflation or growth, investors could require lower duration compensation
immediately, perhaps as the central bank announces plans to buy assets, yet build in greater risk
premiums for later amid expectations for a possibly problematic withdrawal of that
accommodation. This distinction seems relevant in the context of FOMC policy after the
financial crisis, because although most analyses suggest that historically low term premiums
1 Bernanke (2010) suggests that contemporary low longer-term yields largely reflect very low term premiums, owing to asset purchases within the context of the portfolio rebalancing channel.
2
coincided with unconventional monetary policy. Previous work focuses less acutely if at all on
the length of time investors expected low premiums to prevail, which of course requires parsing
the very back end of the term structure.
Besides the implications for investors in very long-duration instruments, this issue of the
persistence of term premium shocks is relevant to the real effects of monetary policy,
conventional or otherwise. Consider two hypothetical accommodative measures. Suppose the
first coincides with lower long-term yields that investors expect to last for one month. Assume
the second produces an equivalent initial drop anticipated to persist for one year or even two. All
else equal, the latter presumably provides more stimulus than the former, and some studies argue
that permanency in rate movements matters—the longer rates stay lower, the greater the boost to
growth and or inflation (Kiley, 2012; Fuhrer and Olivei, 2011). The same is presumably true for
transmission mechanisms that work through (signaling) expected short rates, on the one hand, or
term premium channels, on the other.
The evidence, based on two generally distinct methods, is somewhat mixed. First, affine
term structure models (ATSMs) readily produce estimates of expected term premiums for any
tenor at any horizon. A standard 3-factor Vasicek model suggests that 5-year-ahead 10-year
term premiums were very stable over the sample, which implies that term premium shocks after
2007 were not very persistent. However, the 5-factor model based on Adrian et al. (2013)
produces highly volatile 5-year-ahead estimates that correlate closely with the corresponding
spot measure not only during the crisis period but also the full sample, with the contrary
implication that investors perceived declines in term premiums to be much longer-lasting.
Adrian et al. (2013) may well be the preferable ATSM-based approach, but to complicate the
story, a pure survey-based measure of expected term premiums increased, on net, since 2007.
3
This model-free result hardly means that the FOMC do not provide substantial support, notably
beyond the standard rate expectations channel, in the aftermath of the crisis. Nonetheless, this
finding—perhaps the only shred of evidence that any spot or forward term premium measure
actually increased in recent years—raises questions about the extent to which investors may have
made some allowances for a possibly complicated exit from prolonged policy accommodation.
The remainder of this paper is organized as follows. Section 2 briefly outlines spot and
expected term premium estimates from the ATSMs, Section 3 describes the survey-based
measure of expected forward term premiums, and Section 4 concludes.
2. Some ATSM-based Estimates of Expected and Spot Term Premiums
Turning to some evidence, ATSMs—the workhorse of the literature on the impact of
LSAPs on the yield curve—produce closed-form expressions for time-varying term premiums,
which formally comprise the difference between model-implied forward rates (yields) and the
model-implied (average) expected short rates. In addition, ATSMs are of course flexible enough
to generate estimates of forward rates and term premiums of any tenor for any future horizon.
The underlying mechanics of this approach are well-known, but note that any decrease in spot
term premiums cannot be “permanent” in the vast majority of applications. By construction, the
underlying factors are nearly ubiquitously mean-reverting, and therefore low spot term
premiums—a function of those variables—must rebound to historical averages. Of course, the
question is just how quickly, which is governed by the model parameters that conceivably could
be time-varying but are typically derived from yield patterns observed over ultimately limited
samples that include too few rate cycles.
4
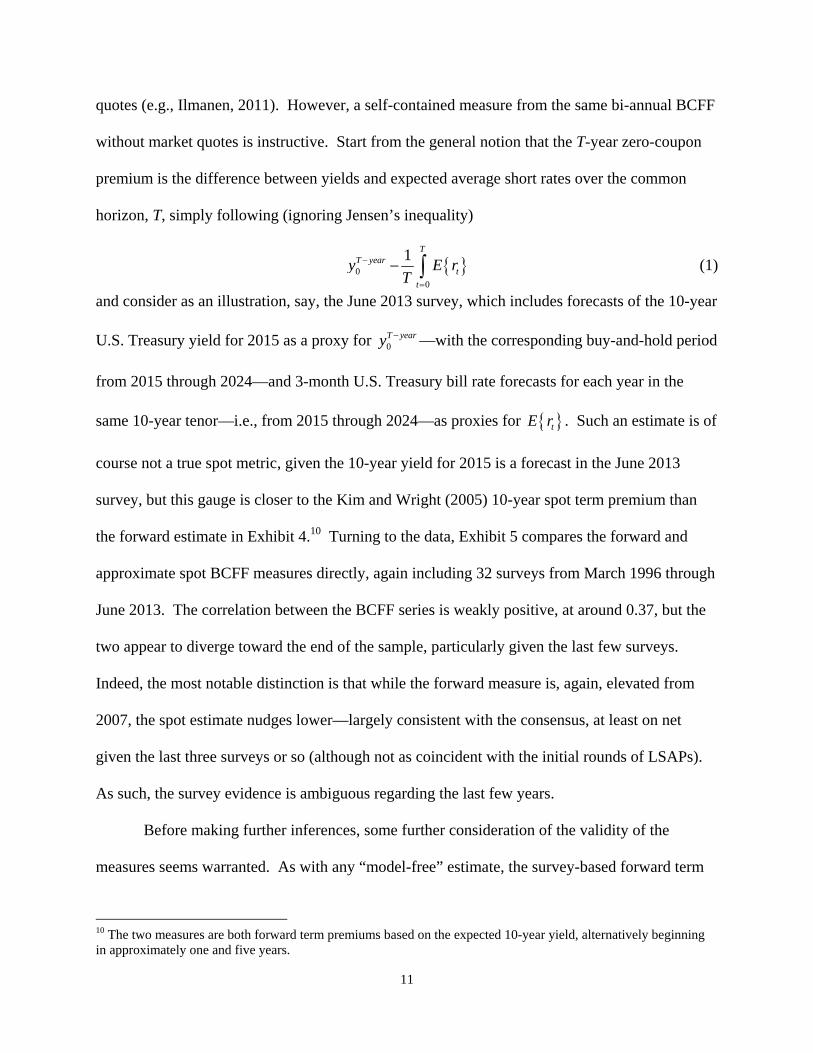
Consider a very a simple 3-factor Vasicek (1977) model that, unlike Kim and Wright
(2005), uses no survey data but allows for time-varying term premiums. The top panel of
Exhibit 1 shows the estimated spot 10-year term premium, the black line, along with the
anticipated measure two and five years ahead, the blue and red lines, respectively. Following the
familiar result, spot term premiums reached historical lows during the nadir of the crisis as well
as subsequent rounds of Federal Reserve innovations in forward guidance and large scale asset
purchases. The 2-year-ahead expected measure also declined around those times, but not nearly
as precipitously, and the 5-year-ahead metric barely budged comparatively. Also, strictly
speaking and judging by the gap between the black and blue lines, at the extreme spot lows
around 2012:Q2, the model suggests that investors expected the term premium to recover about
80 percent of the way back toward its long-run level within two years—i.e., from a negative term
premium to about 200 basis points, in turn roughly 50 basis points shy of the 5-year-ahead
estimate at the time. Again, these results simply reflect the model’s mean-reversion parameters
but arguably imply a fairly timely anticipated return to more normal levels.2
However, the results shown in the bottom panel of Exhibit 1 based on a 5-factor model
from Adrian et al. (2013), which comprises a more satisfactory method that prices the term
structure with linear regressions, tell another story about expected premiums. As evidenced by
the tight correlation as well as the comparatively very narrow spreads among the spot, 2-year,
and 5-year measures throughout the sample, shocks to the term premium appear to take much
longer to dissipate. In point of fact, near the lows of 2012:Q2, the gap between the spot and 5-
year ahead measure is within a few basis points. This result is broadly consistent with
considerable persistence in perceived financial accommodation, and by extension with lower
required returns on longer-dated bonds as well as greater monetary stimulus. 2 Note however that spot and expected term premiums never appear to correlate negatively.
5
The methods described in Adrian et al. (2013) seem safely preferable to the simple 3-
factor model, but any affine term structure model has inherent limits. Again, a well-known
challenge with estimation regards the high persistence yet presumed mean-reversion of bond
yields given short samples (Kim and Orphanides, 2012; Bauer and Rudebusch, 2012), which
naturally raises the specter of sensitivity to sample extensions. Other empirical challenges
include possible peso problems (Gürkaynak and Wright, 2012), and some research also explores
bond pricing with learning, as agents slowly recognize regime shifts (Kozicki and Tinsley, 2001)
or form expectations in a manner that is decidedly more evolutionary than standard models imply
(with common constant mean and conditional volatilities for economic variables) (Laubach et al.,
2007; Orphanides and Wei, 2010). In addition, ATSMs are frequently not calibrated to the back
end of the term structure, the very section of the yield curve germane to this question.3
Therefore, there is simply no compelling reason not to consider what some model-free methods,
namely exclusive use of survey data,4 might suggest about the persistence of longer-dated term
premiums.
3. Some Expected and (Approximate) Spot Survey Evidence on Term Premiums
There are no survey-based measures that are both direct—e.g., a single question such as
“What is the term premium at the following horizon?” or “What compensation do you demand,
precisely, to loan to the Treasury over longer as opposed to shorter periods?”—as well as self-
contained—i.e., within a given poll and without reference to market quotes—in Blue Chip,
3 For example, Kim and Wright (2005) as well as Kim and Orphanides (2012) only use maturities up to 10 years to estimate the parameters. 4 Of course this distinction is somewhat crude given the use of both survey and market data in the estimation of arbitrage-free model parameters (e.g., Orphanides and Kim, 2012). Also, there are perhaps other “model-free” gauges such as spreads between government bond yields and money market rates, under the assumptions that the latter do not embed significant term premiums and that market segmentation prevails (e.g., Krishnamurthy and Vissing-Jorgensen, 2011; Joyce et al., 2011; Bauer and Rudebusch, 2012).
6
Consensus Economics, Survey of Professional Forecasters, etc.5 However, conceivably surveys
contain some self-contained indirect information about term premiums, without reference to
market quotes.6 To motivate the identifying assumption behind a forward as opposed to an
approximate spot measure, consider two questions. First, what 3-month risk-free Treasury bill
rate do you expect in 1000 years? Some respondents might sensibly question whether the United
States will be issuing obligations, or even exist, at that horizon, but for the sake of illustration a
reasonable answer might be around 4 percent, perhaps grounded with respect to contemporary
references of potential GDP and common central bank inflation goals. Second, what do you
expect 10-year U.S. Treasury yields to be a millennium ahead? The wisest answer might well
be none at all, but suppose a plausible response around 5 percent.
What would the difference, if any, between these two possible responses represent? Of
course, strict adherents of the (pure) expectations hypothesis for interest rates would render the
same answer for both quantities. Millennium-ahead forecasts of bill yields would reflect the
perceived equilibrium short rate, and if longer-term interest rates solely comprise the average
expected short rate over the tenor of the bond, then the two responses simply cannot differ,
unless investors anticipate changes in monetary policy precisely between 1000 and 1010 years
ahead, in the case of the projected 10-year yield in 1000 years.
But what would a positive spread—the 100 basis point positive gap between 4 and 5
percent, say—convey about premiums versus expectations? Such responses could be consistent
with the view that investors today would expect that their counterparts, even a millennium into
5 See Durham (2014) for a similar discussion of this survey-based measure. 6 Piazzesi et al. (2013) also use BCFF data to construct subjective bond risk premia. However, their measure is not “self-contained” in that, similar to Froot (1989), they necessarily use realized yields in their construction of expectation errors. Using nearer-term forecasts at available horizons (i.e., from one to six quarters ahead), they find that bond premia are less volatile and cyclical compared to statistical measures (i.e., regressions of log excess returns on observed variables), given that respondents render projections as if the level and slope of the term structure are more persistent.
7
the future, would demand some compensation for rolling over shorter-term debt to the U.S.
Treasury, presumed to be at the constant equilibrium rate between 1000 and 1010 years ahead.
The gap in these long-run forecasts might approximate anticipated term premiums at that
horizon.7
No existing survey poses such questions. However, some longer-run interest rate
forecasts might contain similar information about investors’ implied forward premiums. For
example, twice a year in June and December the Blue Chip Financial Forecasts (BCFF) survey
asks respondents to forecast the 3- and 6-month as well as 1-, 2-, 5-, 10-, and 30-year nominal
U.S Treasury yields expected to prevail between six and 10 years ahead, and the Blue Chip
Economic Indicators (BCEI) survey similarly polls respondents on 3-month and 10-year yields
each March and October.8 This horizon is neither a millennium projection, of course, nor as
distant as the “long run forecasts” found in the quarterly release of the Federal Open Market
Committee’s (FOMC) Summary of Economic Projections (SEP), which investors commonly
interpret as the Federal Reserve’s long-run objectives. Indeed, some Blue Chip respondents
might take the instructions literally as a 5-year average beginning in six years and ending in 10
years. As such, these forecasts might not reflect equilibrium levels but rather lingering
projections from a prolonged if not unprecedented interest rate cycle, such as the period
following the recent financial crisis. Then again, many respondents might ignore the explicit
horizon, and, as in the SEP, render their “equilibrium” estimates for interest rates beyond the
current cycle.
7 Strictly speaking, evidence of a constant term premium would not be inconsistent with a weak-form version of the expectations hypothesis. But as the following notes, such measures of the term premium appear to be time-varying. 8 This set of questions first appeared in the December 1996 survey and continued each June and December through the most recent June 2013 Blue Chip Financial Forecast. The expectations are the December 2002 and December 2003 surveys, which do not include these questions. In sum, there are 32 long-run forecasts at the time of writing.

8
There is no way to know for sure, but these survey data do not seem to imply this latter
assumption that longer-run forecast embed information about perceived equilibriums. In
addition to the average between six and 10 years ahead, the BCFF includes forecasts for the
federal funds rate (and at least seven other nominal Treasury yield tenors) for each year between
one and five years hence. The identifying assumption that the 6- through 10-year average
forecasts (for any series) approximate an equilibrium expectation implies that projections
asymptote to long-run levels by the end of the nearer term, i.e., the 1- to 5-year horizon that
captures prevailing perceptions about the trajectory of the current business cycle. If the mean
forecast for the federal funds rate for the fifth year is equal to the average forecast for the sixth
through the tenth year, then a reasonable inference is that respondents expect no cyclical
developments in policy after the fifth year, and thus the longest-horizon forecast indeed closely
resembles an equilibrium projection. For example, in the most recent BCFF forecast (June
2013), the mean expected funds rate forecasts were 0.8 percent, 2.0 percent, 3.1 percent, 3.6
percent, and 3.9 percent for calendar years 2015 through 2019, respectively—a steady exit from
the nominal zero bound. However, perhaps tellingly, the average forecast for the subsequent
period from 2020 through 2014 was 3.8 percent, strictly speaking 10 basis points lower than the
2019 projection and implies that respondents did not necessarily envisage further tightening or
“normalization” beyond five years and, in turn, thus rendered an equilibrium funds rate for the
2020 through 2014 period.
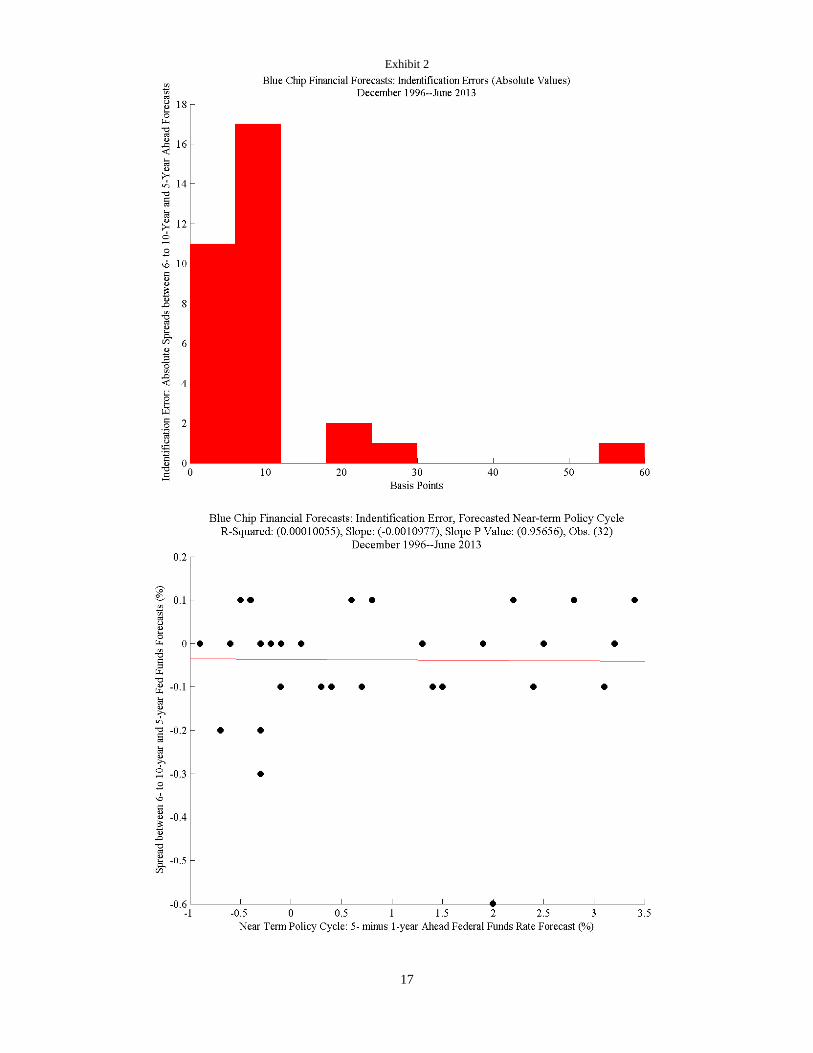
Besides the most recent observation, the histogram in the top panel of Exhibit 2 shows
that for 28 of 32 surveys, the projected federal funds rate for the fifth year ahead is, like the June
poll, within 10 basis points of the average expected federal funds rate between six and 10 years
ahead. Also, despite the notably prolonged recent cycle, the difference in forecasts at those
9
horizons is within this narrow range, which after all possibly includes measurement errors, for
every survey since 2007. Moreover, as the simple scatter plot and OLS regression estimate in
the lower panel of Exhibit 2 indicates, there is no relation between the forecasted directional
trajectory of the funds rate from one to five years ahead and any spread between the fifth-year
forecast and the average between six and 10 years, which is a reasonable prior under the
suspicion that forecasters’ cyclical views inform their longer-run equilibrium forecasts. Indeed,
the estimated coefficient, although clearly statistically insignificant, is perversely negative
(owing to an outlier, the June 2003 survey).
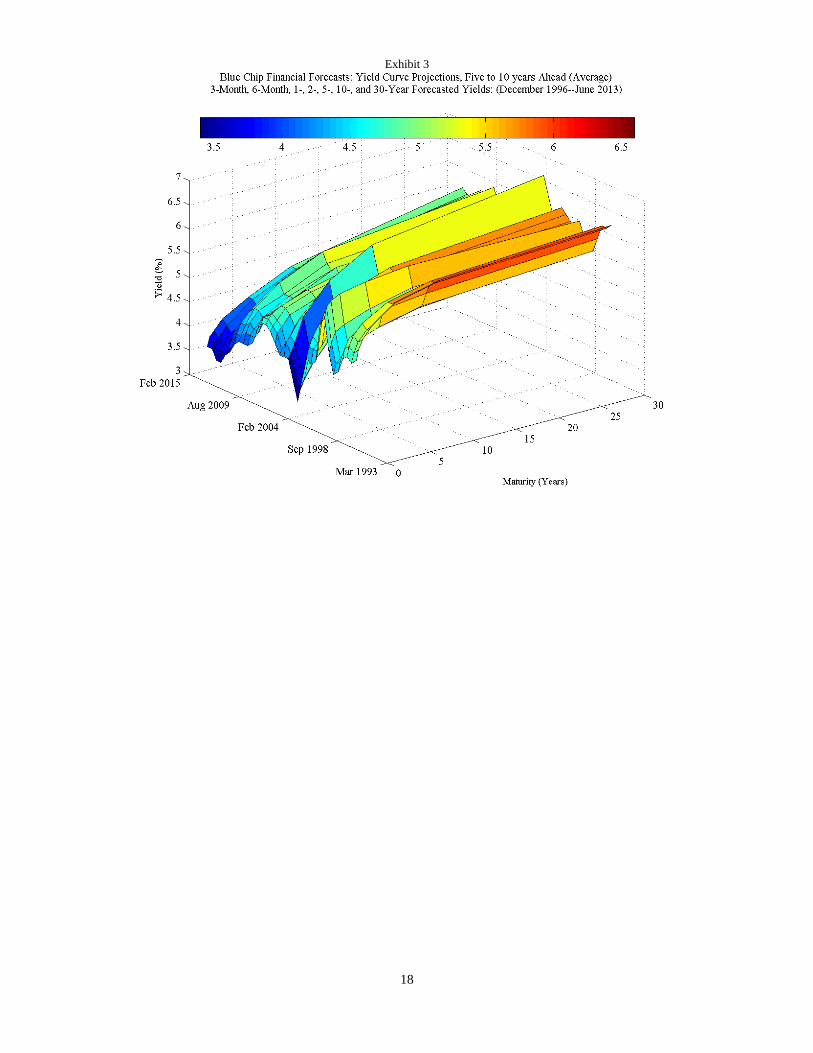
Leaving aside the identifying assumption, what do these survey data say? Exhibit 3
includes the surface or cross-sectional time-series of responses from December 1996 through
June 2013 from the BCFF survey. For starters, the surface is not flat, which is noteworthy along
two dimensions, pun intended. First, with respect to each cross section, the expected yield curve
between six and 10 years ahead is always upward sloping—indeed, even the anticipated spread
between six and three months bills is positive for every single observation, as it is between all
adjacent points (e.g., between the 1- and 2-year yield forecasts, the 5- and 10-year projections,
etc.). Thus, unless investors from December 1996 through June 2013 consistently expected the
Federal Reserve to be tightening monetary policy between six and 10 years hence, this positive
slope suggests that investors expected positive term premiums into the future, notably in
violation of the pure expectations hypothesis. This reflects the common observation that the
U.S. Treasury yield curve has almost always been positive-sloping, which in turn implies
positive term premiums under the assumption that investors most likely have not almost always
expected policy tightening.

10
Turning to the second dimension from the surface of responses, the level and slope of the
projected average term structures six to 10 years ahead, after all a substantially lengthy horizon,
change notably over time. Of course, this observation again could reflect that possibility that
respondents’ nearer-term forecasts seep into their longer-run or equilibrium estimates, but
alternatively under the indentifying assumption, this time variation might reflect actual changes
in forecasted risk preferences expected to prevail in the future, which violates the weaker form of
the expectations hypothesis. And, considering such variation at a particular point along the term
structure to approximate the 10-year term premium, the solid black lines in Exhibit 4 show the
forecasted average 10-year yield between six and 10 years ahead, the dashed black lines are the
projected 3-month bill rates over the same horizon, and the red lines are the spreads between
these two points along the forecasted yield curve (a proxy for the expected forward term
premium), based on the BEFF and BCEI surveys in the top and bottom panels, respectively. In
general, both interest rate forecast series decline over the sample, but again clearly not in
lockstep, which implies some variation in the forward term premium. In particular, in contrast to
the common perception that Treasury term premiums have plummeted on net since the start of
the financial crisis, owing on balance to substantial flight-to-quality flows as well as
unconventional monetary policy measures, these survey-based forward term premiums have
increased on net since the beginning of 2007 and remain around mean or above-average levels.9
But what about a simple survey-based spot measure, or more precisely a much nearer-
term expected forward estimate? Common back-of-the-envelope gauges of the term premium
comprise the difference between observed market yields and survey forecasts of short rates over
corresponding tenors, with some necessary assumptions that align the timing of the surveys and
9 This inference is not sensitive to the particular tenors used in the calculations—e.g., the gap between 10- and 5-year yield forecasts follows a very similar trajectory.
11
quotes (e.g., Ilmanen, 2011). However, a self-contained measure from the same bi-annual BCFF
without market quotes is instructive. Start from the general notion that the T-year zero-coupon
premium is the difference between yields and expected average short rates over the common
horizon, T, simply following (ignoring Jensen’s inequality)
00
1 TT year
t
t
y E rT
(1)
and consider as an illustration, say, the June 2013 survey, which includes forecasts of the 10-year
U.S. Treasury yield for 2015 as a proxy for 0T yeary —with the corresponding buy-and-hold period
from 2015 through 2024—and 3-month U.S. Treasury bill rate forecasts for each year in the
same 10-year tenor—i.e., from 2015 through 2024—as proxies for tE r . Such an estimate is of
course not a true spot metric, given the 10-year yield for 2015 is a forecast in the June 2013
survey, but this gauge is closer to the Kim and Wright (2005) 10-year spot term premium than
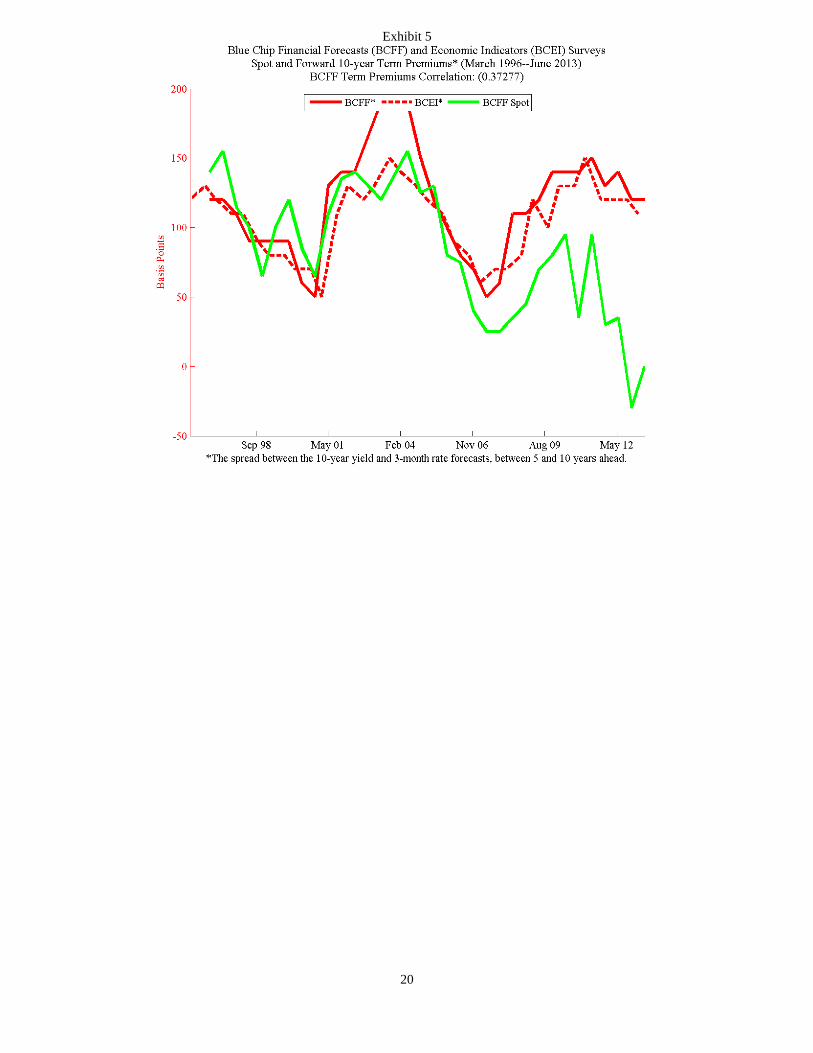
the forward estimate in Exhibit 4.10 Turning to the data, Exhibit 5 compares the forward and
approximate spot BCFF measures directly, again including 32 surveys from March 1996 through
June 2013. The correlation between the BCFF series is weakly positive, at around 0.37, but the
two appear to diverge toward the end of the sample, particularly given the last few surveys.
Indeed, the most notable distinction is that while the forward measure is, again, elevated from
2007, the spot estimate nudges lower—largely consistent with the consensus, at least on net
given the last three surveys or so (although not as coincident with the initial rounds of LSAPs).
As such, the survey evidence is ambiguous regarding the last few years.
Before making further inferences, some further consideration of the validity of the
measures seems warranted. As with any “model-free” estimate, the survey-based forward term
10 The two measures are both forward term premiums based on the expected 10-year yield, alternatively beginning in approximately one and five years.
12
premium rests on strong simplifying assumptions, however persuasive the simple evidence in
Exhibit 2. Also, neither the forward nor spot estimates impose any arbitrage-free structure.
Nonetheless, some additional survey data might address whether there is any intuition behind
these results. As noted previously, closed-form affine model solutions suggest that the partial
derivative of term premiums with respect to the volatility parameters is positive. In other words,
investors demand greater compensation to hold longer-term debt, the greater their uncertainty
about the trajectory of short-term rates over the horizon. Briefly, the very surveys that produce
these term premium estimates include some relevant information on this score. Both the BCFF
and BCEI surveys report not only the mean responses for the 6- through 10-year horizons but
also the difference between the top and bottom ten answers for each U.S. Treasury maturity
point, as well as for the federal funds rate. This range in responses strictly reflects disagreement
rather than uncertainty per se, but a worthwhile question is whether the magnitude of the range
of anticipated policy rates between six and 10 years ahead correlates with the implied term
premium measure at that horizon.
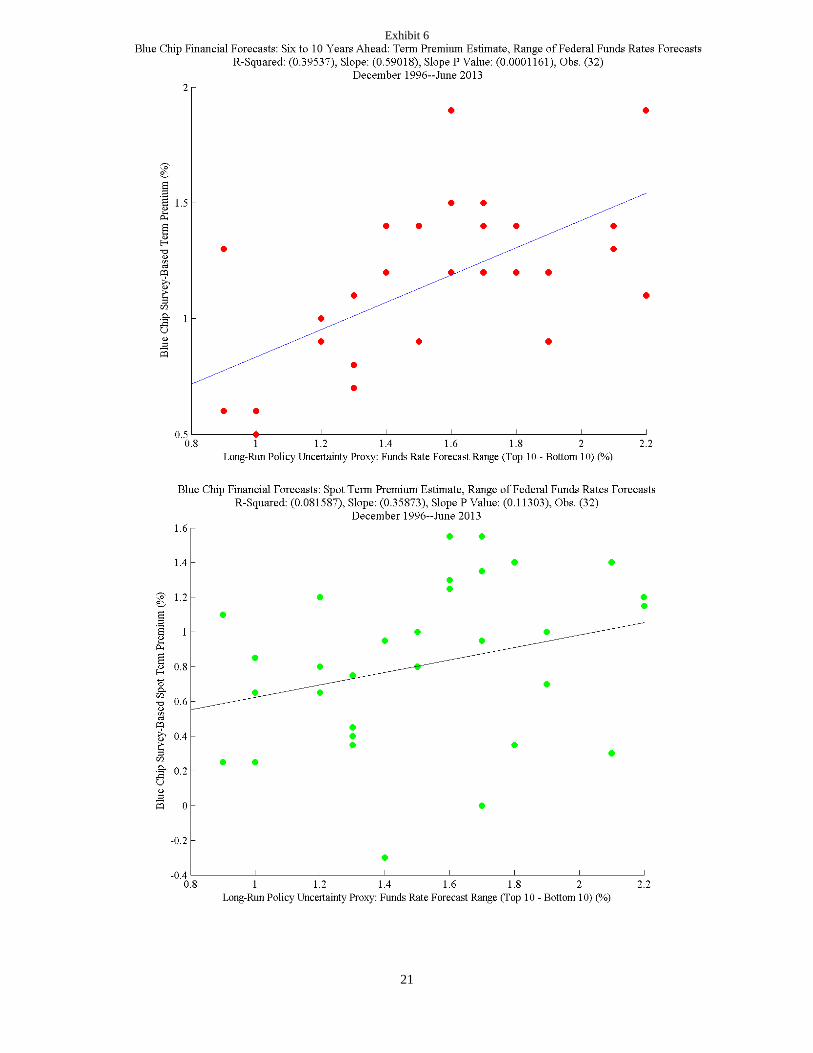
Exhibit 6 shows simple scatter plots of the forward and approximate spot term premium
estimates for each of the 32 surveys, against the difference between the top average and bottom
average responses for the federal funds rate. Regarding the forward measure, indicated in the top
panel, visual inspection suggests a positive relation between the proxy for long-run uncertainty
about policy (perceptions rather than attitudes toward risk) and long-run duration compensation,
as expected. Even though the limited number of observations hardly affords satisfactory
statistical power, the p value (0.000) nonetheless indicates significance well within standard
confidence bands, and the R-squared of the simple OLS regression is almost 0.40.11 Also, the
11 For example, for a more complete econometric specification of ATSM-based term premiums, see Durham (2008) or Li and Wei (2012).
13
slope (0.59) seems economically meaningful, and as such this survey evidence is scarcely
inconsistent with intuition and formal theory. By contrast, although the evidence on the
approximate spot measure in the lower panel indicates the same general relation, the estimates
are notably weaker considering a lower R-squared (0.08), a lower slope (0.36), and a p value
(0.113) that suggests statistical insignificance, albeit again given few observations. As a further
caveat any inference that the forward measure follows intuition whereas the spot metric does not,
the remaining unexplained variance likely owes to the fundamental under-specification of the
univariate model, particularly the absence of any proxy for the market price of risk, which in
theory might not perhaps relate to flights-to-quality per se during the latter sample period but
special demand associated with asset purchases.
There are a number of standard caveats regarding the use of survey data, including small
cross-sections and inconsistent samples over time as well as possible “irrational” forecasts (e.g.,
Froot, 1989).12 Nonetheless, in sum these survey data might contain some useful information
about investors’ longer-run perceptions of duration risk, and the fact that the forward metric has
on net increased rather than decreased since the onset of the financial crisis is noteworthy. Also,
considering both measures, a complicated story—perhaps related to the transmission of
unconventional monetary policy through supply or signaling channels—must reconcile
investors’ increased perceptions of anticipated interest rate risk on 10-year yields beginning in
six years, with simultaneously decreased spot term premiums for that tenor. A possible
explanation is that, just as term premiums mean revert by construction in common Gaussian
12 Froot (1989) infers using survey data that the failure of the expectations hypothesis for long bonds owes to expectation errors. Also, Bacchetta et al. (2009) find across multiple financial markets that expectation errors from surveys are predictable in markets with significant excess return predictability (i.e., in foreign exchange, stock, and bond markets but not the money market). However, the use of survey data in this application differs because, although long-run forecasts of each maturity may be biased or prove erroneous, this term premium proxy of course comprises the spread(s) between those projections.

14
affine term structure models (e.g., Kim and Wright, 2005), the survey data similarly imply a
steep expected trajectory from low spot premiums toward historical norms, or perhaps elevated
levels around the 5-year horizon that could be consistent with some unmooring of investors’
perceptions of the Federal Reserve’s reaction function or perhaps concern about the long-run
implications of unconventional balance sheet measures.
4. Discussion
Published analyses based on ATSMs and surveys largely conclude that U.S. Treasury
term premiums fell dramatically over the course of the financial crisis and its aftermath, but few
studies distinguish spot from expected term premiums. To be sure, the back end of the term
structure beyond, say, 10 years embeds the required information, and ATSMs again are useful
tools to disentangle the signals. The evidence based on this method is naturally sensitive to
model assumptions and corresponding parameter estimates, but at least one method (Adrian et
al., 2013) implies considerable persistence in term premium shocks, not only during the financial
crisis but also for the remainder of the sample. However, the pure survey-based approach
implies the near opposite, as expected term premiums five years ahead increased with the
simultaneous decrease in the approximate spot measure from 2007.
Even so, the survey-based results do not necessarily imply that Federal Reserve policies
did not ease monetary conditions and stimulate the economy—lower spot and nearer-horizon
term premiums of course reflect greater financial market accommodation. Instead, in addition to
the obvious issue of expected returns toward the back end of the U.S. Treasury term structure,
they simply may address whether market participants anticipated eventual shifts in broad

15
financial conditions, over and above any channel that works through expected short rates in the
short to medium run.
Also, this inference may reflect some recent evidence regarding the term structure of
equity risk premiums or required stock returns, derived from an arbitrage-free method, over the
course of the financial crisis and the subsequent policy response (e.g., Durham, 2013). That is,
just as spot term premiums declined during this period, very near-term equity risk premiums fell
sharply from their peaks in late 2008, on balance, over the following few years. Also, the recent
upward-sloping term structure of required returns could connote that equity investors became
increasingly less comfortable with shares the longer the horizon, a forecast period that not
implausibly includes expectations of an unwind of substantial accommodation.
Finally, with regard to estimation and the ATSM-based approach, Kim and Orphanides
(2005) demonstrate some key advantages in using survey data to pin down the expected short
rate path.13 However, they only use forecasts of the 3-month bill rate and no other longer-dated
tenor from the BCFF or BCEI surveys.14 Unfortunately, these forecasts are only available twice
a year, but an alternative nonetheless might be to inform the Kalman filter estimation survey data
evenly across the term structure. Given the results in Exhibit 4, a sensible prior might be that
these survey data might push term premium (expected short rate) estimates across the yield curve
somewhat higher (lower).
13 However, Bauer and Rudebusch (2012) argue that information from surveys does not satisfactorily address small-sample bias given their low frequency and possible misrepresentation of rational short rate forecasts. 14 Kim and Orphanides (2012) compare monthly Blue Chip near-term forecasts of 5- and 10-year yields with those based on their forecasts. They do not use distant-horizon forecasts of longer-dated tenors in their Kalman-filter-based maximum likelihood estimates. Some previous estimations incorporate long-run survey forecasts of longer-dated tenors for non-U.S. data. For example, Guimarães (2012), who finds that contemporary low U.K. 10-year government bond yields owes to lower expected real rates (rather than real or inflation risk premiums) uses Consensus Economics forecasts of average 5-year inflation five years ahead in addition to 1-, 2-, and 3-year-ahead forecasts of the policy rate.
Exhibit 1
17
Exhibit 2
18
Exhibit 3

Exhibit 4
20
Exhibit 5
21
Exhibit 6
References Adrian, Tobias, Emanuel Moench, Richard Crump, 2013, “Pricing the Term Structure with Linear Regressions,” Journal of Financial Economics, Vol. 110, pp. 110–138. Bacchetta, Philippe, Elmar Mertens, and Eric von Wimcoop, 2009, “Predictability in Financial Markets: What do Survey Expectations Tell Us?” Journal of International Money and Finance, vol. 28, pp. 406–426. Bauer, Michael D. and Glenn D. Rudebusch, 2012, “The Signaling Channel for Federal Reserve Bond Purchases,” Federal Reserve Bank of San Francisco Working Paper Series. Bernanke, Ben, 2010, “The Economic Outlook and Monetary Policy,” speech at Jackson Hole, Wyoming. Durham, J. Benson, 2008, “Implied Interest Rate Skew, Term Premiums, and the ‘Conundrum,’” Journal of Fixed Income, vol. 17, pp. 88–99. Durham, J. Benson, 2013, “Arbitrage-Free Models of Stocks and Bonds,” Federal Reserve Bank of New York Staff Report, No. 656, (http://www.newyorkfed.org/research/staff_reports/sr656.html). Durham, J. Benson, 2014, “Another View on U.S. Treasury Term Premiums,” Journal of Fixed Income, (forthcoming). Fuhrer, Jeffrey C. and Giovanni P. Olivei, 2011, “The Estimated Macroeconomic Effects of the Federal Reserve’s Large-Scale Treasury Purchase Program,” Public Policy Briefs, Federal Reserve Bank of Boston, (http://www.bostonfed.org/economic/ppb/2011/ppb112.pdf). Froot, K. A., 1989, “New Hope for the Expectations Hypothesis of the Term Structure of Interest Rates,” Journal of Finance, vol. 44, pp. 283–305. Guimarães, Rodrigo, 2012, “What Accounts for the Fall in UK Ten-year Government Bond Yields?” Bank of England Quarterly Bulletin, Q3, pp. 213–223. Gürkaynak, Refet S., and Jonathan H. Wright, 2012, “Macroeconomics and the Term Structure,” Journal of Economic Literature, vol. 50 no. 2, pp. 331–67. Ilmanen, Antti, 2011, Expected Returns: An Investor’s Guide to Harvesting Market Rewards, Wiley. Joyce, Michael, Ana Lasaosa, Ibrahim Stevens, and Matthew Tong, 2011,“The Financial Market Impact of Quantitative Easing in the United Kingdom,” International Journal of Central Banking, vol. 7 no. 3, pp. 113–161.

23
Kiley, Michael, 2012, “The Aggregate Demand Effects of Short- and Long-Term Interest Rates,” Finance and Economics Discussion Series (The Federal Reserve Board). Kim, Don H. and Jonathan H. Wright, 2005, “An Arbitrage-Free Three-Factor Term Structure Model and the Recent Behavior of Long-Term Yields and Distant-Horizon Forward Rates,” Finance and Economics Discussion Series (The Federal Reserve Board). Kim, Don H. and Athanasios Orphanides, 2012, “Term Structure Estimation with Survey Data on Interest Rate Forecasts,” Journal of Financial and Quantitative Analysis, vol. 47, pp. 241–272. Kozicki, Sharon and Peter A. Tinsley, 2001, “Shifting Endpoints in the Term Structure of Interest Rates,” Journal of Monetary Economics, vol. 47, pp. 613–652. Krishnamurthy, Arvind and Annette Vissing-Jorgensen, 2011, “The Effects of Quantitative Easing on Interest Rates: Channels and Implications for Policy,” Brookings Papers on Economic Activity. Krishnamurthy, Arvind and Annette Vissing-Jorgensen, 2013, “The Ins and Outs of LSAPs,” www.kansascityfed.org/publicat/sympos/2013/2013Krishnamurthy.pdf . Laubach, Thomas, Robert Tetlow, and John Williams, 2007, “Learning and the Role of Macroeconomic Factors in the Term Structure of Interest Rates,” Federal Reserve Bank of San Francisco working paper. Lemke, Wolfgang and Thomas Werner, 2009, “The Term Structure of Equity Premia in an Affine Arbitrage-Free Model of Bond and Stock Market Dynamics,” European Central Bank Working Paper Series, No. 1045 (April). Li, Canlin and Min Wei, 2012, “Term Structure Modeling with Supply Factors and the Federal Reserve’s Large Scale Asset Purchase Programs,” Finance and Economics Discussion Series (The Federal Reserve Board). Orphanides, Athanasios and Min Wei, 2010, “Evolving Macroeconomic Perceptions and the Term Structure of Interest Rates,” Finance and Economics Discussion Series 2010-1 (The Federal Reserve Board). Piazzesi, Monica, Juliana Salomao, and Martin Schneider, 2013, “Trend and Cycle in Bond Premia,” working paper. Stein, Jeremy C., 2012, “Evaluating Large-Scale Asset Purchases,” Speech (October 11; Brookings Institution; Washington, D.C.), (http://www.federalreserve.gov/newsevents/speech/stein20121011a.htm). Vasicek, O., 1977, “An Equilibrium Characterization of the Term Structure of Interest Rates,” Journal of Financial Economics, vol. 5, pp. 177–188.