morphometrics and allometry in fishes -...
TRANSCRIPT
4
Morphometrics and Allometry in Fishes
Paraskevi K. Karachle and Konstantinos I. Stergiou Aristotle University of Thessaloniki, School of Biology,
Department of Zoology, Laboratory of Ichthyology Greece
1. Introduction
Fish morphometrics has been in the hot-spot of ichthyological studies for many decades, but
the initial steps date back to the time of Galileo Galilei (Froese 2006). Yet, the scientific basis
for morphometry in fishes, and especially the mathematical way that weight relates to
length, was set by Fulton, in 1906, who for the first time introduced fisheries science into
‘allometry’ (Froese 2006).
Nowadays, the most commonly used relationships, that have been established for the
majority of fishes (Binohlan & Pauly 2000, FishBase: www.fishbase.org: Froese & Pauly
2011), are those relating weight to body length (in the majority of cases, total body length
(TL)), and different types of length (i.e., standard (SL) and fork (FL) length) to TL. Weight
(W)-length (TL) relationships are of power type, i.e., W=a TLb. In this equation, a is the
coefficient of body shape (Lleonart et al. 2000, Froese 2006, www.fishbase.org), and it gets
values around 0.1 for fishes which are small sized and with a rounded body shape, 0.01 for
streamlined-shaped fishes and 0.001 for eel-like shaped fishes. In contrast, b is the coefficient
balancing the dimensions of the equation and its values can be smaller, larger or equal to 3
(Lleonart et al. 2000, Froese 2006, www.fishbase.org). In the first two cases (i.e., b<3 and
b>3) fish growth is allometric (i.e., when b<3 the fish grows faster in length than in weight,
and when b>3 the fish grows faster in weigth than in length), whereas when b=3 growth is
isometric. Froese (2006) analyze 3929 weight-length relationships for 1773 species, and
reports that b ranges between 1.96 and 3.94, with 90% of the cases falling inside the 2.7-3.4
range. The lowest values have been recorded for Cepola macropthalma, whereas the highest
for Chaenocephalus aceratus. In principle, these types of relationships are allometric (82%),
with a trend towards positive allometry (Froese 2006). Weight-length relationships are of
high importance for fisheries science and can be used in a wide range of applications, such
as: (a) estimation of biomass from length data; (b) estimation of a species condition factor;
and (c) comparisons among life history and morphologic differentiations of the same species
in different areas (e.g., Pauly 1993, Petrakis & Stergiou 1995, Binohlan & Pauly 2000).
In recent years, attempts have been made to relate other morphological characteristics of
fishes, such as mouth (e.g., Karpouzi & Stergiou 2003, Chalkia & Bobori 2006, Karachle &
Stergiou 2011a), intestine (e.g., Kramer & Bryant 1995a, b, Karachle & Stergiou 2010) and tail
(Karachle & Stergiou 2004), to TL, and as well as to feeding habits and fractional trophic
www.intechopen.com
Morphometrics 66
levels (τ). In general, eco-morphological studies focus on the patterns that relate
morphology and the use of available resources (e.g., Motta et al. 1995, Wainwright &
Richard 1995), and consider morphology as a key factor for the determination of a species’
feeding habits. Hence, variations in morphology are due to differences in the ability of
different fish species to catch and consume their food, affecting the overall diet composition
(e.g., Wainwright & Richard 1995, Wootton 1998).
Mouth gape has long being considered as the most important, yet restraining, factor affecting food consumption mainly in: (a) defining the size range of prey items a consumer can catch/consume and (b) affecting the efficiency of a predator to catch and consume its food (Wainwright & Richard 1995). More specifically, mouth gape can be used for the evaluation of the relationship between prey and predator size (e.g., Keast & Webb 1966, Wainwright & Richard 1995), whereas mouth shape and position, teeth, structure and number of gill rakers seem to be related to the type of food being consumed (e.g., Al-Hussaini 1947, Kapoor et al. 1975, Verigina 1991). The size spectrum of prey items for fishes increases as they grow, which is more evident in apex predators (Karpouzi & Stergiou 2003), and this fact has been mainly attributed to ontogenetic changes related to mouth morphology, visual acuity, more efficient digestion and better swimming ability of large fish (e.g., Keast & Webb 1966, Kaiser & Hughes 1993, Juanes 1994, Juanes & Conover 1994, Hart 1997, Wootton 1998, Fordham & Trippel 1999). Hence, mouth morphometry is generally related to τ (Karpouzi & Stergiou 2003).
Intestine (or gut) length (GL) is considered to be an indicator of diet (Kramer & Bryant 1995a) and, particularly in fishes, can be used for interspecific dietary comparisons (e.g., Al-Hussaini 1947, Karachle & Stergiou 2010a). For a given body length, intestine in herbivorous species is longer than in omnivorous ones, and in omnivorous species longer than in carnivorous ones (e.g., Kapoor et al. 1975, Kramer & Bryant 1995b, Karachle & Stergiou 2010a, b). Hence, the widely accepted pattern of fish GL variation in relation to species feeding habits is:
Carnivores<omnivores<herbivores<detritus feeders
(e.g., Kapoor et al. 1975, Ribble & Smith 1983, Kramer & Bryant 1995b, Karachle & Stergiou 2010a, b). The same pattern is also true in other vertebrate classes (e.g., reptiles: O’Grady et al. 2005, birds: Ricklefs 1996, and mammals: Chivers & Hladik 1980).
Recent research has shown that there is a strong relationship between GL and body length (BL), that can be best described by the power type equation, i.e., GL=a BLb (Kramer & Bryant 1995a, b, Karachle & Stergiou 2010a, b). The significance of this allometry in GL could be related to the effect of the increasing body length to the relative efficiency of intestine to absorb nutrients from the digested food (e.g., Ribble & Smith 1983, Kramer & Bryant 1995a). Since growing organisms require more energy and nutrients, changes of the structural capacity, i.e. lengthier intestine, must be performed in order for those needs to be met. Those structural changes of intestine will ensure that food will be retained longer in the tract and more nutrients will be adsorbed, and more receptors for the absorption of energy and nutrients will be available.
Tail, the one characteristic that in the eyes of everyday people is what defines a fish, is the
least examined of all feeding-related morphologic characteristics in fishes. Its relationship
www.intechopen.com

Morphometrics and Allometry in Fishes 67
with feeding was established in a model of the estimation of annual food consumption per
unit biomass, i.e., Q/B (Palomares & Pauly 1989). In this model, the tail aspect ratio (A; i.e.,
the ratio of squared tail height per tail area) is a key variable: 芸 稽斑 = 劇待.滞怠 × 畦待.泰態な.に ×激待.態
where T is the mean water temperature (°C) and W is the asymptotic (or maximum) live
weight of the fish (g) in the population (Pauly 1989a).
Despite the importance of tail characteristics, such as height, area and aspect ratio, little
effort has been put into their study and thus available information is limited (Karachle &
Stergiou 2004, 2005, 2008a). Moreover, even in research focusing on Q/B estimation, Α has
been estimated mainly from fish photos or drawings (e.g., García & Duarte 2002), or from
measurements derived from a small number of individuals (e.g., 3-4 individuals; Angelini &
Agostinho 2005).
In this chapter, we explore the effects of feeding habits, environment and/or habitat type on
weight-length relationships and the morphometrics of feeding-related characteristics of
fishes, namely mouth, intestine and tail. For weight-length relationships, mouth and
intestine, we expanded on previously published information and relationships. For tail
allometry we estimated tail area (TA), height (TH) and tail aspect ratio (A) for 61 species
from the North Aegean Sea, Greece, using imprints of tails, for a large number of
individuals per species. Based on these estimates, we established the within-species
relationships between TA, TH and A with TL. We also explored the relationships of the
above mentioned tail characteristics with species’ feeding habits and habitat type (i.e.,
pelagic, benthopelagic, demersal, and reef-associated; the ecological niche concept being
also included). Finally, the relationship between the mean A values (Am) and mean TL (TLm)
per species was explored.
2. Materials and methods
We used prior published information on morphology and morphometrics of fishes, and
especially mathematical expressions, which were transformed into allometric regressions
and grouped based on species’ feeding habits and environment/habitat. The use of the
allometric model, instead of other types of models (i.e., linear, exponential, and logarithmic),
in the description of relationships between morphological characteristics, such as those
presented here, and body length, was better for the following reasons:
1. it allows the detection of morphologic changes in shape, which is the basic hypothesis in the study of morphometrics (Lleonart et al. 2002)
2. in contrast with the other types of models, the allometric one is the only one for which when X=0, then Y=0, a fact that is meaningful in morphometrics (Lleonart et al. 2002), and
3. especially in the case of feeding related characteristics, it is the only one that can explain changes in the morphology such as required for a growing fish to meet its increasing energetic demands, while the energy spent for the acquisition of food is minimized (Karachle & Stergiou 2010b, 2011a).
www.intechopen.com
Morphometrics 68
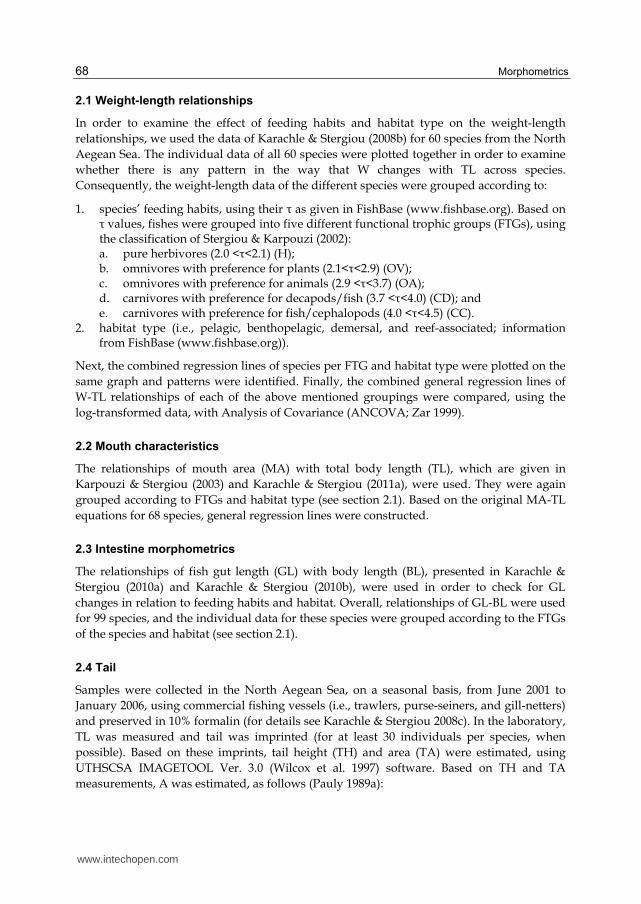
2.1 Weight-length relationships
In order to examine the effect of feeding habits and habitat type on the weight-length
relationships, we used the data of Karachle & Stergiou (2008b) for 60 species from the North
Aegean Sea. The individual data of all 60 species were plotted together in order to examine
whether there is any pattern in the way that W changes with TL across species.
Consequently, the weight-length data of the different species were grouped according to:
1. species’ feeding habits, using their τ as given in FishBase (www.fishbase.org). Based on τ values, fishes were grouped into five different functional trophic groups (FTGs), using the classification of Stergiou & Karpouzi (2002): a. pure herbivores (2.0 <τ<2.1) (H); b. omnivores with preference for plants (2.1<τ<2.9) (OV); c. omnivores with preference for animals (2.9 <τ<3.7) (OA); d. carnivores with preference for decapods/fish (3.7 <τ<4.0) (CD); and e. carnivores with preference for fish/cephalopods (4.0 <τ<4.5) (CC).
2. habitat type (i.e., pelagic, benthopelagic, demersal, and reef-associated; information from FishBase (www.fishbase.org)).
Next, the combined regression lines of species per FTG and habitat type were plotted on the
same graph and patterns were identified. Finally, the combined general regression lines of
W-TL relationships of each of the above mentioned groupings were compared, using the
log-transformed data, with Analysis of Covariance (ANCOVA; Zar 1999).
2.2 Mouth characteristics
The relationships of mouth area (MA) with total body length (TL), which are given in
Karpouzi & Stergiou (2003) and Karachle & Stergiou (2011a), were used. They were again
grouped according to FTGs and habitat type (see section 2.1). Based on the original MA-TL
equations for 68 species, general regression lines were constructed.
2.3 Intestine morphometrics
The relationships of fish gut length (GL) with body length (BL), presented in Karachle &
Stergiou (2010a) and Karachle & Stergiou (2010b), were used in order to check for GL
changes in relation to feeding habits and habitat. Overall, relationships of GL-BL were used
for 99 species, and the individual data for these species were grouped according to the FTGs
of the species and habitat (see section 2.1).
2.4 Tail
Samples were collected in the North Aegean Sea, on a seasonal basis, from June 2001 to
January 2006, using commercial fishing vessels (i.e., trawlers, purse-seiners, and gill-netters)
and preserved in 10% formalin (for details see Karachle & Stergiou 2008c). In the laboratory,
TL was measured and tail was imprinted (for at least 30 individuals per species, when
possible). Based on these imprints, tail height (TH) and area (TA) were estimated, using
UTHSCSA IMAGETOOL Ver. 3.0 (Wilcox et al. 1997) software. Based on TH and TA
measurements, A was estimated, as follows (Pauly 1989a):
www.intechopen.com

Morphometrics and Allometry in Fishes 69
畦 = 脹張鉄脹凋 .
The relationships between TA-TL and TH-TL were established using power regression (Y=a
Xb; Lleonart et al. 2000) and consequently b (given the mathematical traits of b as explained
in the introduction) was tested for difference from 2, in the case of TA (since the
measurement unit of TA is cm2), and difference from 1, in the case of TH (since the
measurement unit of TH is cm), using t-test (Zar 1999). Additionally, all TA-TL regressions
were plotted together for the detection of possible groupings of species.
In order to identify patterns of changes of TA with TL, the data for the different species were
compiled together based on FTGs and habitat type (see section 2.1). In order to identify
possible patterns, the regressions per group in each of the above mentioned compilations
were plotted together. Comparisons of the slopes of the general regression lines were
performed on the log-transformed data using ANCOVA (Zar 1999).
The relationships between A and TL were estimated for all species (they are not presented
here) and the type of the relationship was defined based on the R2 values. Finally, the
across-species relationship between the mean A values (Am) and mean TL (TLm) per species
was also explored.
3. Results
3.1 Weight-length relationships
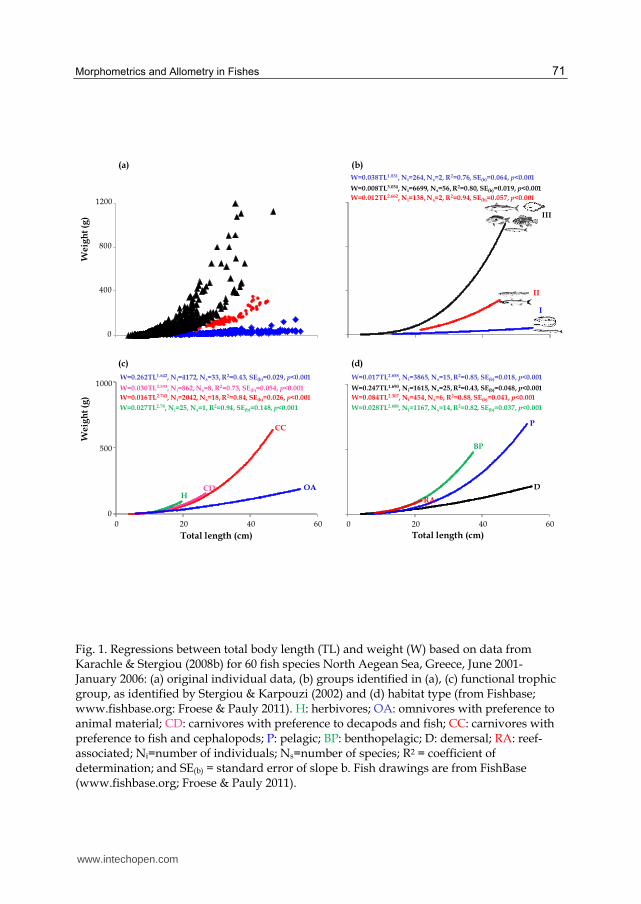
When all data for the 60 species were plotted together, three major groups were identified
(Fig. 1a, b): group (I) included C. macrophthalma and Belone belone, group (II) Scyliorhinus
canicula and Sphyraena sphyraena, and group (III) the remaining species. The slopes of the
regressions of the three groups differed significantly (for all combinations: p<0.05). The
graphs of the combined regression lines per FTG and habitat type (number of species per
FTG and habitat type are given in Table 1) did not reveal any clear grouping of weight-
length relationships (Fig. 1c and d). Nevertheless, in the case of FTGs, based on the results of
ANCOVA, there was a significant difference in the slopes of the regression lines between
omnivores with preference to animal material, carnivores with preference to fish and
decapods and carnivores with preference to fish and cephalopods (for all combinations:
p<0.05), whereas there was no difference between those of the regressions for herbivorous
species with those of the species of all other FTGs (for all combinations: p>0.10).
Accordingly, in the case of habitat type, there was not any significant difference in the
slopes of the relationships between pelagic and benthopelagic species (ANCOVA: p=0.569,
F-ratio=9026.64), while the slopes of all remaining combinations differed significantly (for all
combinations: p<0.05).
For the same length, omnivores with preference to animal material weighed less than
carnivores (carnivores with preference to fish and decapods and carnivores with preference
to fish and cephalopods) (Fig. 1c). When habitat type was examined (Fig 1d), for the same
length, the following pattern was observed for weight:
D<P<BP = RA.
www.intechopen.com
Morphometrics 70
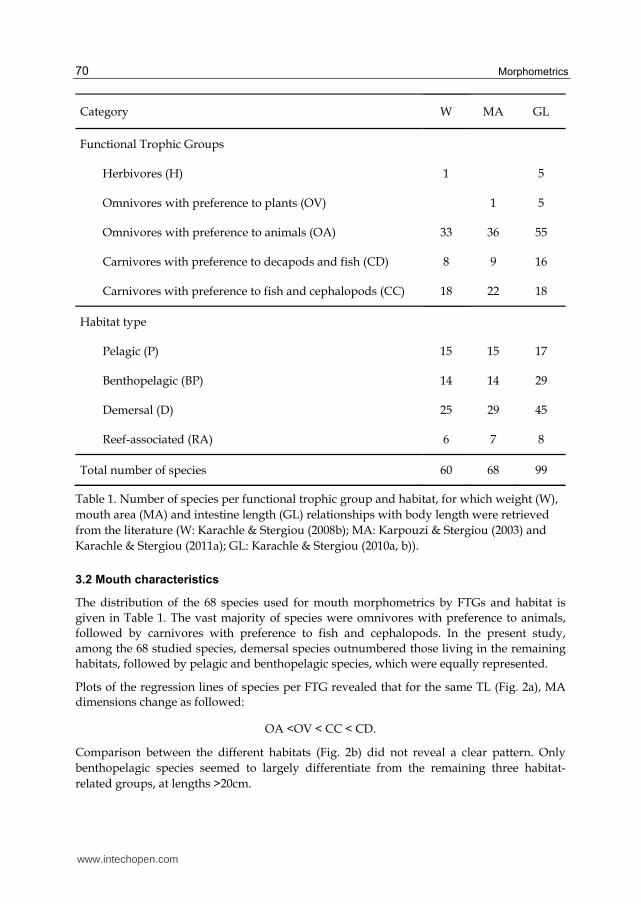
Category W MA GL
Functional Trophic Groups
Herbivores (H) 1 5
Omnivores with preference to plants (OV) 1 5
Omnivores with preference to animals (OA) 33 36 55
Carnivores with preference to decapods and fish (CD) 8 9 16
Carnivores with preference to fish and cephalopods (CC) 18 22 18
Habitat type
Pelagic (P) 15 15 17
Benthopelagic (BP) 14 14 29
Demersal (D) 25 29 45
Reef-associated (RA) 6 7 8
Total number of species 60 68 99
Table 1. Number of species per functional trophic group and habitat, for which weight (W),
mouth area (MA) and intestine length (GL) relationships with body length were retrieved
from the literature (W: Karachle & Stergiou (2008b); MA: Karpouzi & Stergiou (2003) and
Karachle & Stergiou (2011a); GL: Karachle & Stergiou (2010a, b)).
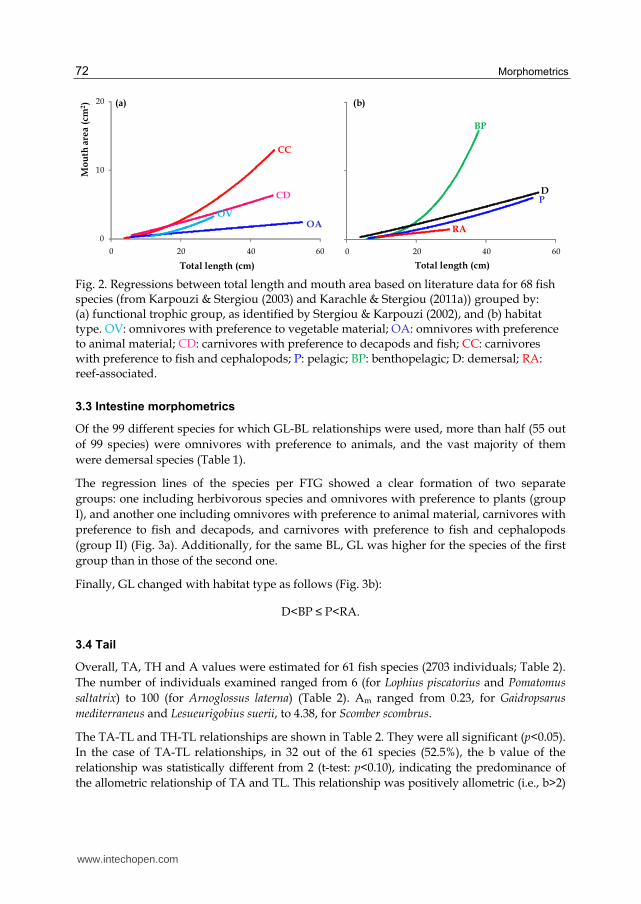
3.2 Mouth characteristics
The distribution of the 68 species used for mouth morphometrics by FTGs and habitat is
given in Table 1. The vast majority of species were omnivores with preference to animals,
followed by carnivores with preference to fish and cephalopods. In the present study,
among the 68 studied species, demersal species outnumbered those living in the remaining
habitats, followed by pelagic and benthopelagic species, which were equally represented.
Plots of the regression lines of species per FTG revealed that for the same TL (Fig. 2a), MA dimensions change as followed:
OA <OV < CC < CD.
Comparison between the different habitats (Fig. 2b) did not reveal a clear pattern. Only
benthopelagic species seemed to largely differentiate from the remaining three habitat-
related groups, at lengths >20cm.
www.intechopen.com
Morphometrics and Allometry in Fishes 71
Fig. 1. Regressions between total body length (TL) and weight (W) based on data from Karachle & Stergiou (2008b) for 60 fish species Νorth Aegean Sea, Greece, June 2001- January 2006: (a) original individual data, (b) groups identified in (a), (c) functional trophic group, as identified by Stergiou & Karpouzi (2002) and (d) habitat type (from Fishbase; www.fishbase.org: Froese & Pauly 2011). H: herbivores; OA: omnivores with preference to animal material; CD: carnivores with preference to decapods and fish; CC: carnivores with preference to fish and cephalopods; P: pelagic; BP: benthopelagic; D: demersal; RA: reef-associated; Ni=number of individuals; Ns=number of species; R2 = coefficient of determination; and SE(b) = standard error of slope b. Fish drawings are from FishBase (www.fishbase.org; Froese & Pauly 2011).
www.intechopen.com
Morphometrics 72
Fig. 2. Regressions between total length and mouth area based on literature data for 68 fish species (from Karpouzi & Stergiou (2003) and Karachle & Stergiou (2011a)) grouped by: (a) functional trophic group, as identified by Stergiou & Karpouzi (2002), and (b) habitat type. OV: omnivores with preference to vegetable material; OA: omnivores with preference to animal material; CD: carnivores with preference to decapods and fish; CC: carnivores with preference to fish and cephalopods; P: pelagic; BP: benthopelagic; D: demersal; RA: reef-associated.
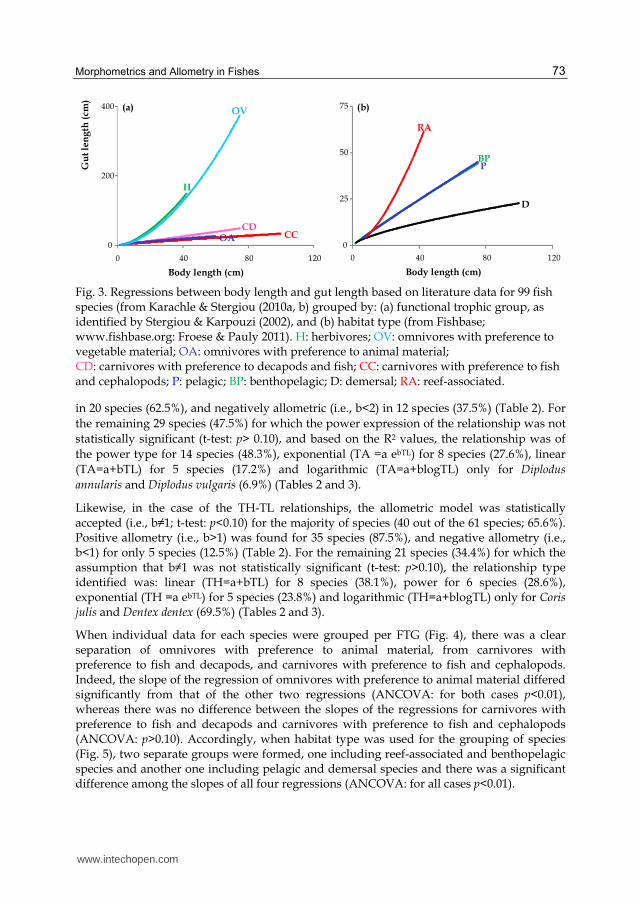
3.3 Intestine morphometrics
Of the 99 different species for which GL-BL relationships were used, more than half (55 out
of 99 species) were omnivores with preference to animals, and the vast majority of them
were demersal species (Table 1).
The regression lines of the species per FTG showed a clear formation of two separate
groups: one including herbivorous species and omnivores with preference to plants (group
I), and another one including omnivores with preference to animal material, carnivores with
preference to fish and decapods, and carnivores with preference to fish and cephalopods
(group II) (Fig. 3a). Additionally, for the same BL, GL was higher for the species of the first
group than in those of the second one.
Finally, GL changed with habitat type as follows (Fig. 3b):
D<BP ≤ P<RA.
3.4 Tail
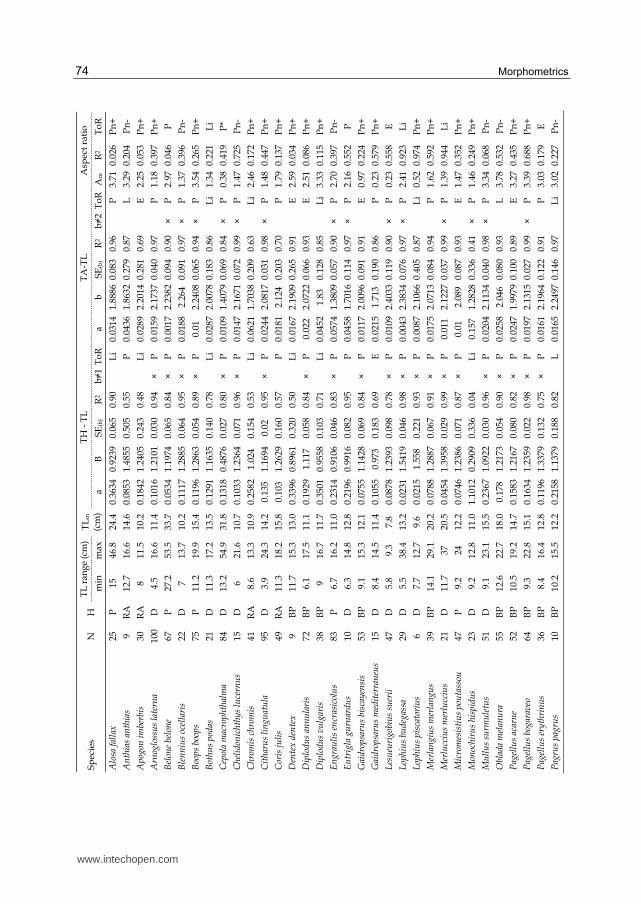
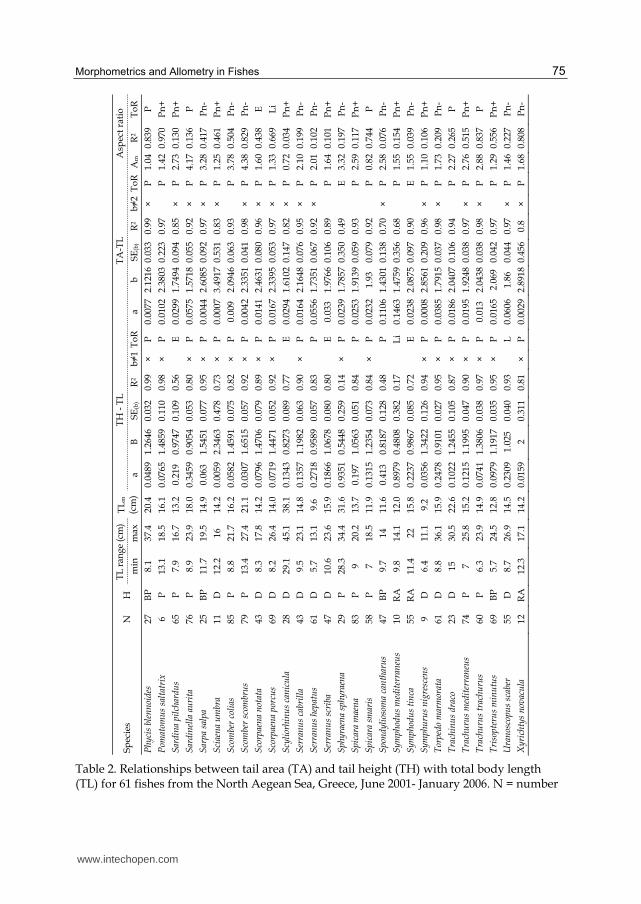
Overall, TA, TH and A values were estimated for 61 fish species (2703 individuals; Table 2).
The number of individuals examined ranged from 6 (for Lophius piscatorius and Pomatomus
saltatrix) to 100 (for Arnoglossus laterna) (Table 2). Αm ranged from 0.23, for Gaidropsarus
mediterraneus and Lesueurigobius suerii, to 4.38, for Scomber scombrus.
The TA-TL and TH-TL relationships are shown in Table 2. They were all significant (p<0.05).
In the case of TA-TL relationships, in 32 out of the 61 species (52.5%), the b value of the
relationship was statistically different from 2 (t-test: p<0.10), indicating the predominance of
the allometric relationship of TA and TL. This relationship was positively allometric (i.e., b>2)
(a) (b)
Total length (cm) Total length (cm)
Mo
uth
are
a (
cm2)
P
RAOA
CD
CC
0
10
20
0 20 40 60
OV
0 20 40 60
D
BP
www.intechopen.com
Morphometrics and Allometry in Fishes 73
Fig. 3. Regressions between body length and gut length based on literature data for 99 fish species (from Karachle & Stergiou (2010a, b) grouped by: (a) functional trophic group, as identified by Stergiou & Karpouzi (2002), and (b) habitat type (from Fishbase; www.fishbase.org: Froese & Pauly 2011). H: herbivores; OV: omnivores with preference to vegetable material; OA: omnivores with preference to animal material; CD: carnivores with preference to decapods and fish; CC: carnivores with preference to fish and cephalopods; P: pelagic; BP: benthopelagic; D: demersal; RA: reef-associated.
in 20 species (62.5%), and negatively allometric (i.e., b<2) in 12 species (37.5%) (Table 2). For
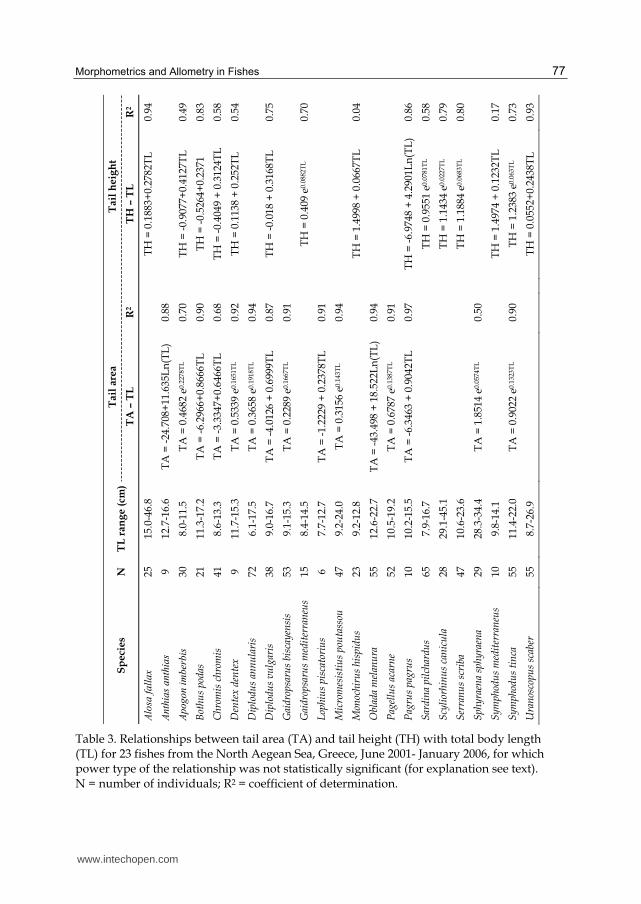
the remaining 29 species (47.5%) for which the power expression of the relationship was not
statistically significant (t-test: p> 0.10), and based on the R2 values, the relationship was of
the power type for 14 species (48.3%), exponential (TA =a ebTL) for 8 species (27.6%), linear
(TA=a+bTL) for 5 species (17.2%) and logarithmic (TA=a+blogTL) only for Diplodus
annularis and Diplodus vulgaris (6.9%) (Tables 2 and 3).
Likewise, in the case of the TH-TL relationships, the allometric model was statistically accepted (i.e., b≠1; t-test: p<0.10) for the majority of species (40 out of the 61 species; 65.6%). Positive allometry (i.e., b>1) was found for 35 species (87.5%), and negative allometry (i.e., b<1) for only 5 species (12.5%) (Table 2). For the remaining 21 species (34.4%) for which the assumption that b≠1 was not statistically significant (t-test: p>0.10), the relationship type identified was: linear (TH=a+bTL) for 8 species (38.1%), power for 6 species (28.6%), exponential (TH =a ebTL) for 5 species (23.8%) and logarithmic (TH=a+blogTL) only for Coris julis and Dentex dentex (69.5%) (Tables 2 and 3).
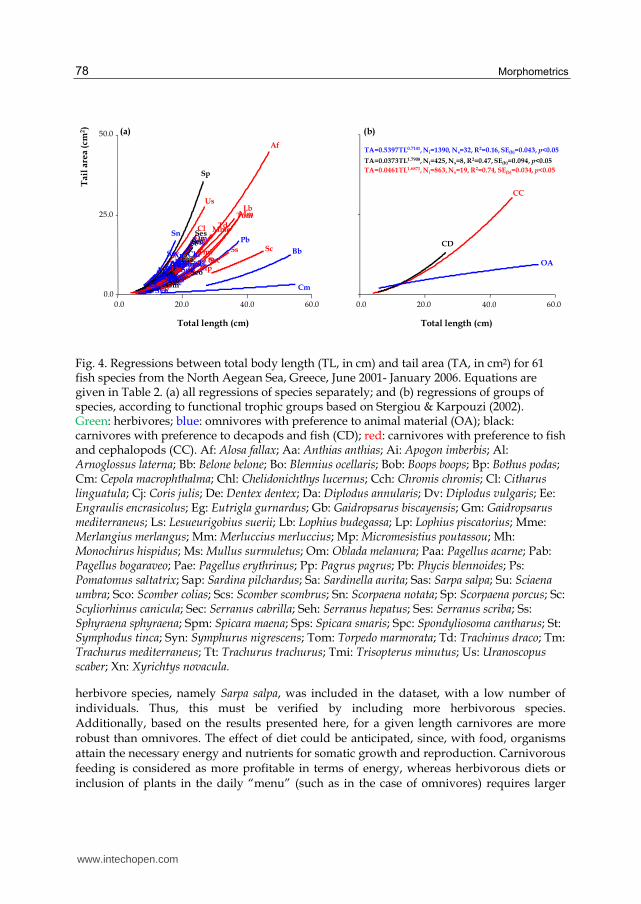
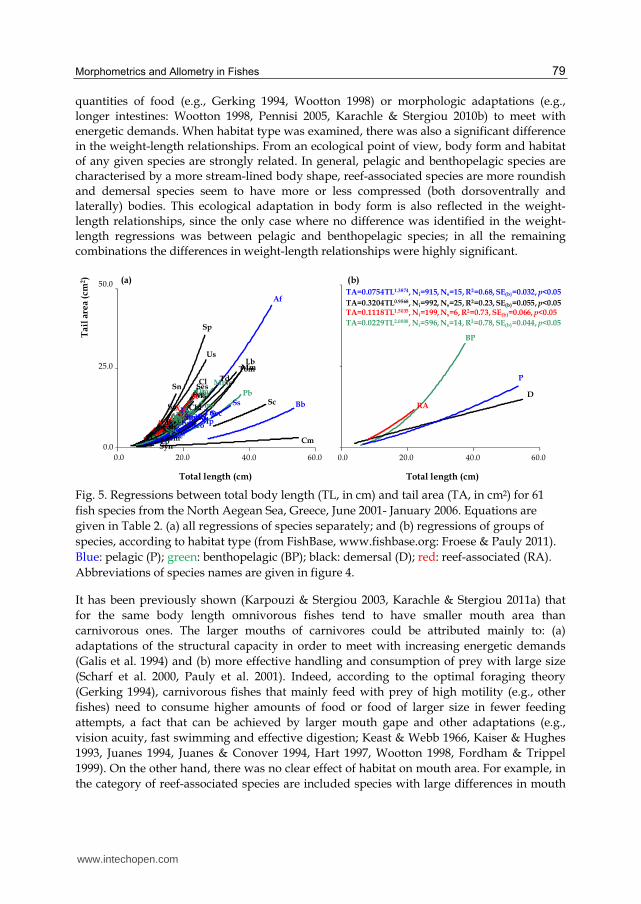
When individual data for each species were grouped per FTG (Fig. 4), there was a clear separation of omnivores with preference to animal material, from carnivores with preference to fish and decapods, and carnivores with preference to fish and cephalopods. Indeed, the slope of the regression of omnivores with preference to animal material differed significantly from that of the other two regressions (ANCOVA: for both cases p<0.01), whereas there was no difference between the slopes of the regressions for carnivores with preference to fish and decapods and carnivores with preference to fish and cephalopods (ANCOVA: p>0.10). Accordingly, when habitat type was used for the grouping of species (Fig. 5), two separate groups were formed, one including reef-associated and benthopelagic species and another one including pelagic and demersal species and there was a significant difference among the slopes of all four regressions (ANCOVA: for all cases p<0.01).
H
OV
CDCC
P
RA
(a) (b)
Body length (cm) Body length (cm)
Gu
t le
ng
th (
cm)
BP
D
0
200
400
0 40 80 120
OA0
25
50
75
0 40 80 120
www.intechopen.com
Morphometrics 74
www.intechopen.com
Morphometrics and Allometry in Fishes 75
Table 2. Relationships between tail area (TA) and tail height (TH) with total body length (TL) for 61 fishes from the North Aegean Sea, Greece, June 2001- January 2006. N = number
www.intechopen.com

Morphometrics 76
of individuals; H = habitat type; P = pelagic; BP = benthopelagic; D = demersal; RA = reef-associated; SEb = standard error of slope b; R2 = coefficient of determination; ToR = type of relationship; E = exponential type; L = logarithmic type; Li = linear type; P = power type; Pn
= Polynomial type; Am = mean tail aspect ratio value. × indicates that b≠2 in the case of TA, and b≠1 in the case of TH. * indicates decreasing trend of the regression line. + indicates cases that polynomial relationship showed a minimum, and – indicates cases that polynomial relationship showed a peak.
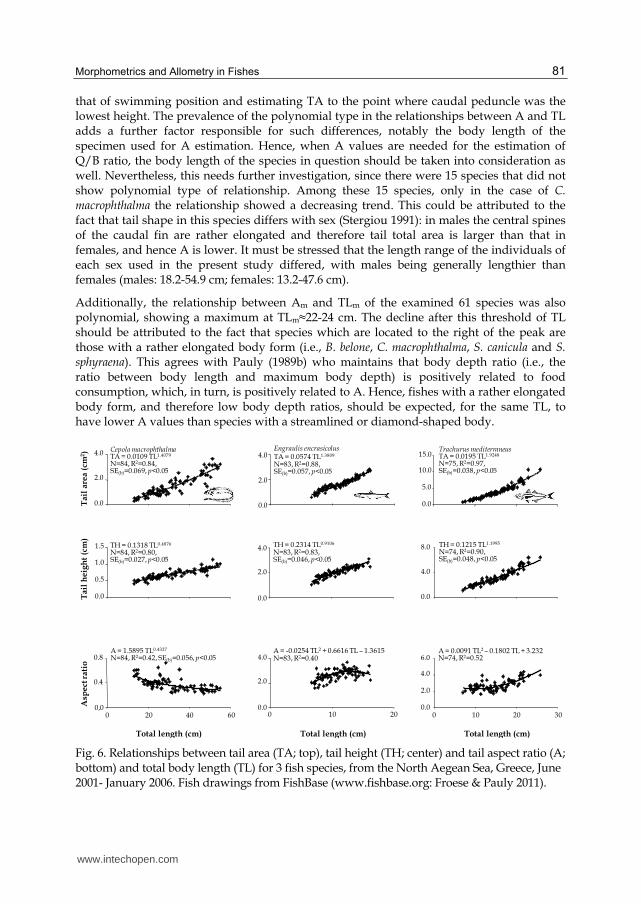
The majority of the relationships between A and TL (Table 2) were of the polynomial type
(46 out of the 61 species; 75.4%). Out of these 46 species, in 18 species (39.1%) the regression
showed a minimum, indicating that A decreases with TL until a certain point and thereafter
increases again (e.g., Trachurus mediterraneus; Fig. 6), and in the remaining 28 species (60.9%)
the regression showed a peak, i.e., A increases with TL up to a maximum and then decreases
(i.e., Engraulis encrasicolus; Fig. 6). In addition, three other types of relationships were
identified for the remaining 15 species: power (8 species; 13.1%); linear (4 species; 6.6%) and
exponential (3 species; 4.9%). Among these 15 species, only in the case of C. macrophthalma
the relationship showed a decreasing trend (Fig. 6).
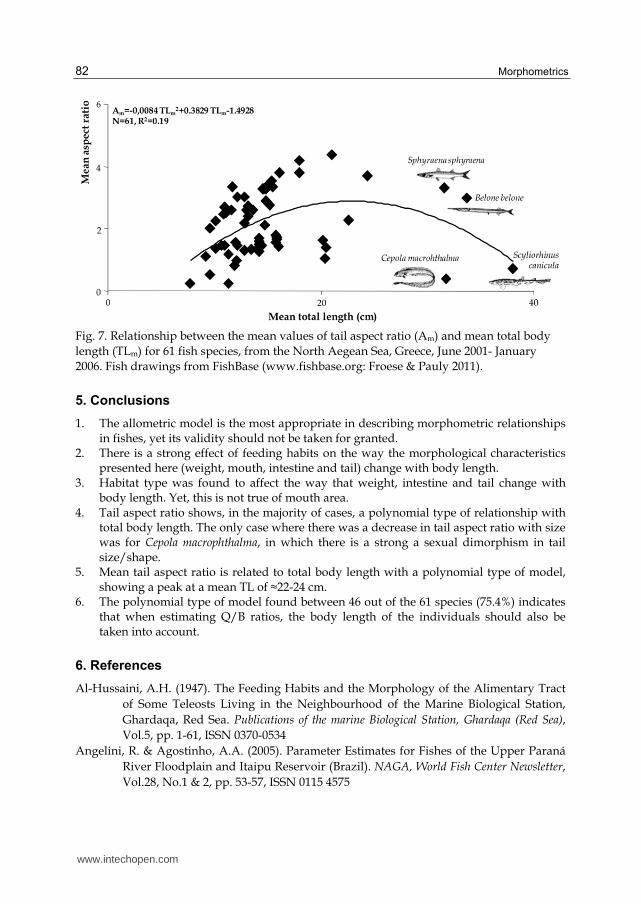
Finally, the relationship between Am and TLm for the 61 species was polynomial (Fig. 7),
with a peak at TLm≈22-24 cm, indicating that A increases with body length up to a
maximum and then decreases.
4. Discussion
The allometric model seems to be the most appropriate for describing morphometrics in fishes (Lleonart et al. 2002) and applies to the vast majority of relationships of morphological characteristics with body length (e.g., Karpouzi & Stergiou 2003, Karachle & Stergiou 2008a, 2010a, b, 2011a). Yet, allometric calculations should not be considered optimally applicable to all metric comparisons, and one must always examine its validity (Peters 1983). Based on the results of the present study, as well as of previous ones (Karachle & Stergiou 2008a, 2010a, b, 2011a), it is also apparent that such relationships might reflect the effect of different factors such as habitat type and feeding habits.
There was a strong effect of body form and shape on W-L relationships and, thus, on b values, since group (I) was comprised of extremely elongated fishes with slim body (i.e., C. macrophthalma and B. belone), group (II) of elongated, yet more cylindrical body shape (i.e. S. canicula and S. sphyraena), and group (III) of stream-lined body shape. Furthermore, a values decreased and b values increased from group (I) to group (III), which is in accordance to the widely accepted norm for such relationships in fishes (e.g., Froese 2006). Additionally, based on the results presented here, there was also a strong effect of both feeding habits and habitat type. Nevertheless, the b value of the regressions of species grouped per FTG and habitat type, showed deviation from the widely accepted value b=3 (Froese 2006), a fact that can be mainly attributed to the high dispersion of W-L data values, which resulted from the inclusion of species of different body forms. Thus, these regressions are given only for illustrative purposes.
Indeed, in the case of feeding habits the relationships between FTGs differed significantly,
with the exception of that of herbivores. This could be attributed to the fact that only one
www.intechopen.com
Morphometrics and Allometry in Fishes 77
Table 3. Relationships between tail area (TA) and tail height (TH) with total body length (TL) for 23 fishes from the North Aegean Sea, Greece, June 2001- January 2006, for which power type of the relationship was not statistically significant (for explanation see text). N = number of individuals; R2 = coefficient of determination.
www.intechopen.com
Morphometrics 78
Fig. 4. Regressions between total body length (TL, in cm) and tail area (TA, in cm2) for 61 fish species from the North Aegean Sea, Greece, June 2001- January 2006. Equations are given in Table 2. (a) all regressions of species separately; and (b) regressions of groups of species, according to functional trophic groups based on Stergiou & Karpouzi (2002). Green: herbivores; blue: omnivores with preference to animal material (OA); black: carnivores with preference to decapods and fish (CD); red: carnivores with preference to fish and cephalopods (CC). Af: Alosa fallax; Aa: Anthias anthias; Ai: Apogon imberbis; Al: Arnoglossus laterna; Bb: Belone belone; Bo: Blennius ocellaris; Bοb: Boops boops; Bp: Bothus podas; Cm: Cepola macrophthalma; Chl: Chelidonichthys lucernus; Cch: Chromis chromis; Cl: Citharus linguatula; Cj: Coris julis; De: Dentex dentex; Da: Diplodus annularis; Dv: Diplodus vulgaris; Ee: Engraulis encrasicolus; Eg: Eutrigla gurnardus; Gb: Gaidropsarus biscayensis; Gm: Gaidropsarus mediterraneus; Ls: Lesueurigobius suerii; Lb: Lophius budegassa; Lp: Lophius piscatorius; Mme: Merlangius merlangus; Mm: Merluccius merluccius; Mp: Micromesistius poutassou; Mh: Monochirus hispidus; Ms: Mullus surmuletus; Om: Oblada melanura; Paa: Pagellus acarne; Pab: Pagellus bogaraveo; Pae: Pagellus erythrinus; Pp: Pagrus pagrus; Pb: Phycis blennoides; Ps: Pomatomus saltatrix; Sap: Sardina pilchardus; Sa: Sardinella aurita; Sas: Sarpa salpa; Su: Sciaena umbra; Sco: Scomber colias; Scs: Scomber scombrus; Sn: Scorpaena notata; Sp: Scorpaena porcus; Sc: Scyliorhinus canicula; Sec: Serranus cabrilla; Seh: Serranus hepatus; Ses: Serranus scriba; Ss: Sphyraena sphyraena; Spm: Spicara maena; Sps: Spicara smaris; Spc: Spondyliosoma cantharus; St: Symphodus tinca; Syn: Symphurus nigrescens; Tom: Torpedo marmorata; Td: Trachinus draco; Tm: Trachurus mediterraneus; Tt: Trachurus trachurus; Tmi: Trisopterus minutus; Us: Uranoscopus scaber; Xn: Xyrichtys novacula.
herbivore species, namely Sarpa salpa, was included in the dataset, with a low number of individuals. Thus, this must be verified by including more herbivorous species. Additionally, based on the results presented here, for a given length carnivores are more robust than omnivores. The effect of diet could be anticipated, since, with food, organisms attain the necessary energy and nutrients for somatic growth and reproduction. Carnivorous feeding is considered as more profitable in terms of energy, whereas herbivorous diets or inclusion of plants in the daily “menu” (such as in the case of omnivores) requires larger
Aa
Cch
Af
Al
Bb
BoBobBp
Cm
ChlCj
DdDaDv
EeEgGb
Lp
Mh
PaaPae
PsSa
Seh
Mm
Ms PbSt
Ai
GmLsSap
Syn
Tt
OmPab
Cl
Lb
MmeSn
Sp
SecSes
Tom
Td
Us
PpSco
Sc
SpsSpc
Mp
SasSu
Scc
Ss
SpmTm
TmiXn
Total length (cm)
Tai
l a
rea
(cm
2)
25.0
50.0
0.0
0.0 20.0 60.040.0
TA=0.5397TL0.7141, Ni=1390, Ns=32, R2=0.16, SE(b)=0.043, p<0.05
Total length (cm)
0.0 20.0 60.040.0
TA=0.0373TL1.7908, Ni=425, Ns=8, R2=0.47, SE(b)=0.094, p<0.05
TA=0.0461TL1.6871, Ni=863, Ns=19, R2=0.74, SE(b)=0.034, p<0.05
CC
CD
OA
(a) (b)
www.intechopen.com
Morphometrics and Allometry in Fishes 79
quantities of food (e.g., Gerking 1994, Wootton 1998) or morphologic adaptations (e.g., longer intestines: Wootton 1998, Pennisi 2005, Karachle & Stergiou 2010b) to meet with energetic demands. When habitat type was examined, there was also a significant difference in the weight-length relationships. From an ecological point of view, body form and habitat of any given species are strongly related. In general, pelagic and benthopelagic species are characterised by a more stream-lined body shape, reef-associated species are more roundish and demersal species seem to have more or less compressed (both dorsoventrally and laterally) bodies. This ecological adaptation in body form is also reflected in the weight-length relationships, since the only case where no difference was identified in the weight-length regressions was between pelagic and benthopelagic species; in all the remaining combinations the differences in weight-length relationships were highly significant.
Fig. 5. Regressions between total body length (TL, in cm) and tail area (TA, in cm2) for 61
fish species from the Νorth Aegean Sea, Greece, June 2001- January 2006. Equations are
given in Table 2. (a) all regressions of species separately; and (b) regressions of groups of
species, according to habitat type (from FishBase, www.fishbase.org: Froese & Pauly 2011).
Blue: pelagic (P); green: benthopelagic (BP); black: demersal (D); red: reef-associated (RA).
Abbreviations of species names are given in figure 4.
It has been previously shown (Karpouzi & Stergiou 2003, Karachle & Stergiou 2011a) that
for the same body length omnivorous fishes tend to have smaller mouth area than
carnivorous ones. The larger mouths of carnivores could be attributed mainly to: (a)
adaptations of the structural capacity in order to meet with increasing energetic demands
(Galis et al. 1994) and (b) more effective handling and consumption of prey with large size
(Scharf et al. 2000, Pauly et al. 2001). Indeed, according to the optimal foraging theory
(Gerking 1994), carnivorous fishes that mainly feed with prey of high motility (e.g., other
fishes) need to consume higher amounts of food or food of larger size in fewer feeding
attempts, a fact that can be achieved by larger mouth gape and other adaptations (e.g.,
vision acuity, fast swimming and effective digestion; Keast & Webb 1966, Kaiser & Hughes
1993, Juanes 1994, Juanes & Conover 1994, Hart 1997, Wootton 1998, Fordham & Trippel
1999). On the other hand, there was no clear effect of habitat on mouth area. For example, in
the category of reef-associated species are included species with large differences in mouth
25.0
50.0
0.0
0.0 20.0 60.040.0
TA=0.0754TL1.3874, Ni=915, Ns=15, R2=0.68, SE(b)=0.032, p<0.05
0.0 20.0 60.040.0
TA=0.3204TL0.9568, Ni=992, Ns=25, R2=0.23, SE(b)=0.055, p<0.05TA=0.1118TL1.5035, Ni=199, Ns=6, R2=0.73, SE(b)=0.066, p<0.05
Aa
Cch
Af
Al
Bb
BoBobBp
Cm
Chl
Cl
CjDd
DaDv
EgGb
Lb
Mme
Mm
MpMh
MsOm
Paa
Pab
PaePp
Pb
Ps
Sap
SaSaSas
Su
Sco
Scc
Sn
Sp
ScSecSes
Ss
SpmSps
St
Ai
EeGmLsLp
SehSpc
Syn
TomTd
TmTt
Tmi
Us
Xn
TA=0.0229TL2.0008, Ni=596, Ns=14, R2=0.78, SE(b)=0.044, p<0.05
BP
D
P
RA
Total length (cm)
Ta
il a
rea
(cm
2)
Total length (cm)
(a) (b)
www.intechopen.com

Morphometrics 80
size; Apogon imberbis and Anthias anthias are two such species, which prey on fishes and
benthic crustaceans (Karachle & Stergiou 2010c, www.fishbase.org), with rather big mouth
gapes, whereas Coris julis and Symphodus tinca (which prey upon worms, bivalves,
gastopods and small crustaceans, such as amphipods (Karachle & Stergiou 2010c,
www.fishbase.org) are two species with small mouths, yet strong dentition. Likewise,
pelagic species include a wide range of predators: from small pelagic filter feeders, such as
sardines and anchovies, which prey on small-sized zooplankton (copepods)
(www.fishbase.org) to apex predators such as tunas, which feed on fishes
(www.fishbase.org). The same is also true for the remaining two categories of fishes
(demersal: Lesueurigobius suerii and Blennius ocellaris that prey on small crustaceans and
molluscs (Karachle & Stergiou 2010c), with small mouths, and flatfishes, such as Arnoglossus
laterna and Citharus linguatula, that prey on fishes (Karachle & Stergiou 2011b) with large
mouth gape; benthopelagic: Diplodus annularis and Oblada melanura, that mainly feed on
worms, molluscs and small crustaceans, with small mouths, and large-mouthed species as
Gadus morhua and Merlangius merlangus, that prey on fishes (www.fishbase.org).
With respect to intestine length, there was a strong grouping of species according to their
feeding habits: species that fed exclusively on plants and those which included large amounts
of vegetable material in their diet (omnivores with preference to plants) formed a group that
clearly separated from carnivorous species (omnivores with preference to animal material,
carnivores with preference to fish and decapods and carnivores with preference to fish and
cephalopods). Additionally, for the same body length, species of the first group had
remarkably longer intestines than species in the second one. The above differences mainly
result from the fact that plant material is more resistant to digestion, and hence longer
intestines are required in order adequate amounts of nutrients and energy to be absorbed (e.g.,
Wootton 1998, Pennisi 2005). The effect of habitat type was also clear, yet no difference was
observed between the pelagic and benthopelagic species studied here, a fact also observed in
the case of weight-length relationships, and can be attributed to the fact that intestine growth,
form and shape is strongly affected by the general body form, which in turn, as mentioned
above, is related to habitat type (Verigina 1991, Karachle & Stergiou 2010b).
The effect of both feeding habits and habitat type on tail morphometrics was also strong,
with TA for the same body length increasing faster in carnivorous than in omnivorous
species, and for benthopelagic than pelagic and demersal species. This fact can be attributed
both to the differentiation of the general body form of fishes with habitats, as mentioned
above, and to the importance of tail shape and area to the acquisition of food (Keast & Webb
1966, Ward-Campbell & Beamish 2005).
Despite the extensive search for relative literature on tail characteristics, and especially on relationships linking TA and TH to body length, no such information was found. The only available information is restricted to estimates of A, and the majority of such estimates are from photographs and/or fish drawings (www.fishbase.org). Additionally, there are differences in A estimates for the same species, a fact that has been attributed to one or a combination of the following parameters (García & Duarte 2002): (a) the method used for the estimation of ΤΗ and ΤΑ, (b) the type of picture (i.e., photograph or drawing) used for A estimation and (c) the disposition of tail. According to Palomares & Pauly (1998) the most appropriate way of acquiring more accurate A estimates is a disposition of tail resembling
www.intechopen.com
Morphometrics and Allometry in Fishes 81
that of swimming position and estimating TA to the point where caudal peduncle was the lowest height. The prevalence of the polynomial type in the relationships between A and TL adds a further factor responsible for such differences, notably the body length of the specimen used for A estimation. Hence, when A values are needed for the estimation of Q/B ratio, the body length of the species in question should be taken into consideration as well. Nevertheless, this needs further investigation, since there were 15 species that did not show polynomial type of relationship. Among these 15 species, only in the case of C. macrophthalma the relationship showed a decreasing trend. This could be attributed to the fact that tail shape in this species differs with sex (Stergiou 1991): in males the central spines of the caudal fin are rather elongated and therefore tail total area is larger than that in females, and hence A is lower. It must be stressed that the length range of the individuals of each sex used in the present study differed, with males being generally lengthier than females (males: 18.2-54.9 cm; females: 13.2-47.6 cm).
Additionally, the relationship between Am and TLm of the examined 61 species was also polynomial, showing a maximum at TLm≈22-24 cm. The decline after this threshold of TL should be attributed to the fact that species which are located to the right of the peak are those with a rather elongated body form (i.e., B. belone, C. macrophthalma, S. canicula and S. sphyraena). This agrees with Pauly (1989b) who maintains that body depth ratio (i.e., the ratio between body length and maximum body depth) is positively related to food consumption, which, in turn, is positively related to A. Hence, fishes with a rather elongated body form, and therefore low body depth ratios, should be expected, for the same TL, to have lower A values than species with a streamlined or diamond-shaped body.
Fig. 6. Relationships between tail area (TA; top), tail height (TH; center) and tail aspect ratio (A; bottom) and total body length (TL) for 3 fish species, from the North Aegean Sea, Greece, June 2001- January 2006. Fish drawings from FishBase (www.fishbase.org: Froese & Pauly 2011).
www.intechopen.com
Morphometrics 82
Fig. 7. Relationship between the mean values of tail aspect ratio (Am) and mean total body
length (TLm) for 61 fish species, from the North Aegean Sea, Greece, June 2001- January
2006. Fish drawings from FishBase (www.fishbase.org: Froese & Pauly 2011).
5. Conclusions
1. The allometric model is the most appropriate in describing morphometric relationships in fishes, yet its validity should not be taken for granted.
2. There is a strong effect of feeding habits on the way the morphological characteristics presented here (weight, mouth, intestine and tail) change with body length.
3. Habitat type was found to affect the way that weight, intestine and tail change with body length. Yet, this is not true of mouth area.
4. Tail aspect ratio shows, in the majority of cases, a polynomial type of relationship with total body length. The only case where there was a decrease in tail aspect ratio with size was for Cepola macrophthalma, in which there is a strong a sexual dimorphism in tail size/shape.
5. Mean tail aspect ratio is related to total body length with a polynomial type of model, showing a peak at a mean TL of ≈22-24 cm.
6. The polynomial type of model found between 46 out of the 61 species (75.4%) indicates that when estimating Q/B ratios, the body length of the individuals should also be taken into account.
6. References
Al-Hussaini, A.H. (1947). The Feeding Habits and the Morphology of the Alimentary Tract
of Some Teleosts Living in the Neighbourhood of the Marine Biological Station,
Ghardaqa, Red Sea. Publications of the marine Biological Station, Ghardaqa (Red Sea),
Vol.5, pp. 1-61, ISSN 0370-0534
Angelini, R. & Agostinho, A.A. (2005). Parameter Estimates for Fishes of the Upper Paraná
River Floodplain and Itaipu Reservoir (Brazil). NAGA, World Fish Center Newsletter,
Vol.28, No.1 & 2, pp. 53-57, ISSN 0115 4575
www.intechopen.com
Morphometrics and Allometry in Fishes 83
Binohlan, C. & Pauly, D. (2000). The length-weight table, In: Fishbase 2000: concepts, design
and data sources, Froese R. & D. Pauly, (Eds), 121-123, ICLARM, ISBN 971-8709-99-1,
Manila, Philippines
Chalkia, V.V. & Bobori, D.C. (2006). Length-Length and Length-Mouth Dimensions
Relationships of Freshwater Fishes of Northern Greece. Proceedings of the 10th
International Congress on the Zoogeography and Ecology of Greece and Adjacent Regions
pp. 123. Patra, Greece, June 26-30, 2006
Chivers, D.J. & Hladik, C.M. (1980). Morphology of the Gastrointestinal Tract in Primates:
Comparisons with other Mammals in Relation to Diet. Journal of Morphology,
Vol.166, pp. 337-386, ISSN 1097-4687
Fordham, S.E. & Trippel, E.A. (1999). Feeding Behaviour of Cod (Gadus morhua) in Relation
to Spawning. Journal of Applied Ichthyology, Vol.15, pp. 1-9, ISSN 1439-0426
Froese, R., Pauly, D. (Eds.) (2011). FishBase. World Wide Web electronic publication. URL:
www.fishbase.org http//:www.fishbase.org [version 08/2011]
Galis, F., Terlouw, A. & Osse, J.W.M. (1994). The Relation between Morphology and
Behaviour During Ontogenetic and Evolutionary Changes. Journal of Fish Biology,
Vol.45, pp. 13-26, ISSN 1095-8649
García, C.B. & Duarte, L.O. (2002).Consumption to Biomass (Q/B) Ratio and Estimates of
Q/B-Predictor Parameters for Caribbean Fishes. NAGA, The ICLARM Quarterly,
Vol.25, No.2, pp. 19-31, ISSN 0116-290X
Gerking, S.D. (1994). Feeding Ecology of Fish. Academic Press, ISBN 0-12-280780-4, San
Diego, USA
Hart, P.J.B. (1997). Foraging Tactics, In: Behavioural Ecology of Teleost Fishes, J.G.J. Godin,
(Ed.), 104–133, Oxford University Press, ISBN 0-19-850503-5, New York, USA
Juanes, F. & Conover, D.O. (1994). Piscivory and Prey Size Selection in Young-of-the-Year
Bluefish: Predator Preference or Size-Dependent Capture Success? Marine Ecology
Progress Series, Vol.114, pp. 59-69, ISSN 0171-8630
Juanes, F. (1994). What Determines Prey Size Selectivity in Piscivorous Fishes? In: Theory and
application in fish feeding ecology, Stouder, D.J., Fresh, K.L. & Feller, R.J., (eds), 78-100,
Belle W. Baruch Library in Marine Sciences, no. 18, ISBN 1570030138, University of
South Carolina Press, Columbia, SC, USA
Kaiser, M.J. & Hughes, R.N. (1993). Factors Affecting the Behavioural Mechanisms of Diet
Selection in Fishes. Marine Behaviour and Physiology, Vol.23, pp. 105-118, ISSN 0091-
181X
Kapoor, B.G., Smit, H. & Verighina, I.A. (1975). The Alimentary Canal and Digestion in
Teleosts. Advances in Marine Biology, Vol.13, 109-239, ISSN 0065-2881
Karachle, P.K. & Stergiou, K.I. (2004). Preliminary Results on Relationships between Tail
Area and Total Body Length for Four Fish Species. Rapports de la Commission
International de la Mer Méditerranée, Vol.37, pp. 376
Karachle, P.K. & Stergiou, K.I. (2005). Morphometric Relationships in Fishes. Proceedings of
the 3rd FishBase Mini Symposium “Fish and More”, pp. 45-47, Thessaloniki, Greece,
August 31, 2005
www.intechopen.com
Morphometrics 84
Karachle, P.K. & Stergiou, K.I. (2008a). Tail Shape of Various Fishes. Proceedings of the 30th
Scientific Conference of the Hellenic Association for Biological Sciences, pp. 188-189,
Thessaloniki, Greece, May 22-24, 2008, ISSN 1109-4885
Karachle, P.K. & Stergiou, K.I. (2008b). Length-Length and Length-Weight Relationships of
Several Fish Species from the North Aegean Sea (Greece). Journal of Biological
Research, Vol.10, pp. 149-157, ISSN 1790-045X
Karachle, P.K. & Stergiou, K.I. (2008c). The Effect of Season and Sex on Trophic Levels of
Marine Fishes. Journal of Fish Biology, Vol.72, pp. 1463-1487, ISSN 1095-8649
Karachle, P.K. & Stergiou, K.I. (2010a). Intestine Morphometrics: a Compilation and
Analysis of Bibliographic Data. Acta Ichthyologica et Piscatoria, Vol.40, No.1, pp. 45-
54, ISSN 0137-1592
Karachle, P.K. & Stergiou, K.I. (2010b). Gut Length for Several Marine Fishes: Relationships
with Body Length and Trophic Implications. Marine Biodiversity Records, 3: e106, pp.
1-10, ISSN 1755-2672
Karachle, P.K. & Stergiou, K.I. (2010c). Food and Feeding Habits for Eight Fish Species from
the North Aegean Sea. Proceedings of the 14thPanhellenic Symposium of Ichthyologists,
pp. 7-10, Piraeus, Greece, May 6-9, 2010
Karachle, P.K. & Stergiou, K.I. (2011a). Mouth Allometry and Feeding Habits in Fishes. Acta
Ichthyologica et Piscatoria, Vol.41, No.4, pp. 265-275, ISSN 0137-1592
Karachle, P.K. & Stergiou, K.I. (2011b). Feeding and Ecomorphology for Seven Flatfishes in
the N-NW Aegean Sea (Greece). African Journal of Marine Science, Vol.33, No.1, pp.
67-78, ISSN 1814-232X
Karpouzi, V.S. & Stergiou, K.I. (2003). The Relationships between Mouth Size and Shape and
Body Length for 18 Species of Marine Fishes and Their Trophic Implications.
Journal of Fish Biology, Vol.62, pp. 1353-1365, ISSN 1095-8649
Keast, A. & Webb, D. (1966). Mouth and Body Form Relative to Feeding Ecology in the Fish
Fauna of a Small Lake, Lake Opinicon, Ontario. Journal of Fish Research Board of
Canada, Vol.23, No.12, pp. 1845-1874, ISSN 0015-296X
Kramer, D.L. & Bryant, M.J. (1995a). Intestine Length in the Fishes of a Tropical Stream: 1.
Ontogenetic Allometry. Environmental Biology of Fishes, Vol.42, pp. 115-127, ISSN
0378-1909
Kramer, D.L. & Bryant, M.J. (1995b). Intestine Length in the Fishes of a Tropical Stream: 2.
Relationships to Diet – the Long and Short of a Convoluted Issue. Environmental
Biology of Fishes, Vol.42, pp. 129-141, ISSN 0378-1909
Lleonart, J., Salat, J. & Torres, G.J. (2000). Removing Allometric Effects of Body Size in
Morphological Analysis. Journal of Theoretical Biology, Vol.205, pp. 85-93, ISSN 0022-
5193
Motta, P.J., Norton, S.F. & Luczkovich, J.J. (1995). Perspectives on the Ecomorphology of
Bony Fishes. Environmental Biology of Fishes, Vol.44, pp. 11-20, ISSN 0378-1909
O’Grady, S.P., Morando, M., Avila, L. & Dearing, M.D. (2005). Correlating Diet and
Digestive Tract Specialization: Examples from the Lizard Family Liolaemidae.
Zoology, Vol.108, pp. 201-210, ISSN 0944-2006
www.intechopen.com
Morphometrics and Allometry in Fishes 85
Palomares, M.L. & Pauly, D. (1989). A Multiple Regression Model for Predicting the Food
Consumption of Marine Fish Populations. Australian Journal of Marine and
Freshwater Research, Vol.40, pp. 259-273, ISSN 0067-1940
Palomares, M.L. & Pauly, D. (1998). Predicting Food Consumption of Fish Populations as
Functions of Mortality, Food Type, Morphometrics, Temperature and Salinity.
Australian Journal of Marine and Freshwater Research, Vol.49, pp. 447-453, ISSN 0067-
1940
Pauly, D. (1989a). A Simple Index of Metabolic Level in Fishes. Fishbyte, Vol.7, No.1, pp. 22,
ISSN 0116-0079
Pauly, D. (1989b). Food Consumption by Tropical and Temperate Fish Populations: Some
Generalizations. Journal of Fish Biology, Vol.35, No. Supplement A, pp. 11-20, ISSN
1095-8649
Pauly, D. (1993). Fishbyte Section. Editorial. NAGA, The ICLARM Quarterly, Vol.16, pp26,
ISSN 0116-290X
Pauly, D., Palomares, M.L., Froese, R., Sa-a, P., Vakily, M., Preikshot, D. & Wallace, S. (2001).
Fishing Down Canadian Aquatic Food Webs. Canadian Journal of Fisheries and
Aquatic Sciences, Vol.58, pp. 51–62, ISSN 0706-652X
Pennisi, E. (2005). The dynamic gut. What’s eating you? Science, Vol.307, pp. 1896-1899, ISSN
0036-8075
Peters, R.H. (1983). The ecological implications of body size. Cambridge University Press,
ISBN 0-521-28886-X, New York, USA
Petrakis, G. & Stergiou, K.I. (1995). Weight-Length Relationships for 33 Fish Species in Greek
Waters. Fisheries Research, Vol.21, pp. 465-469, ISSN 0165-7836
Ribble, D.O. & Smith, M.H. (1983). Relative Intestine Length and Feeding Ecology of
Freshwater Fishes. Growth, Vol.47, pp. 292-300.
Ricklefs, R.E. (1996). Morphometry of the Digestive Tracts of Some Passerine Birds. Condor,
Vol.98, pp. 279-292, ISSN 0010-5422
Scharf, F.S., Juanes, F. & Rountree, R.A. (2000). Predator Size–Prey Size Relationships of
Marine Fish Predators: Interspecific Variation and Effects of Ontogeny and Body
Size on Trophic Niche Breadth. Marine Ecology Progress Series, Vol.208, pp. 229-248,
ISSN 0171-8630
Stergiou, K.I. & Karpouzi, V.S. (2002). Feeding Habits and Trophic Levels of Mediterranean
Fish. Reviews in Fish Biology and Fisheries, Vol.11, pp. 217-254, ISSN 0960-3166
Stergiou, K.I. (1991). Biology, ecology and dynamics of Cepola macrophthalma (L., 1758)
(Pisces Cepolidae) in the Euboikos and Pagasitikos Gulfs. PhD Thesis, Department
of Biology, Aristotle University of Thessaloniki, Greece, 221 pp.
Verigina, I.A. (1991). Basic Adaptations of the Digestive System in Bony Fishes as a Function
of Diet. Journal of Ichthyology, Vol.31, No.2, pp. 8-20, ISSN 0032-9452
Wainwright, P.C. & Richard, B.A. (1995). Predicting Patterns of Prey Use from Morphology
of Fishes. Environmental Biology of Fishes, Vol.44, pp. 97-113, ISSN 0378-1909
Ward-Campbell, B.M.S. & Beamish, F.W.H. (2005). Ontogenetic Changes in Morphology and
Diet in the Snakehead, Channa limbata, a Predatory Fish in Western Thailand.
Environmental Biology of Fishes, Vol.72, pp. 251-257, ISSN 0378-1909
www.intechopen.com

Morphometrics 86
Wilcox, C.D., Dove, S.B., McDavid, W.D. & Greer, D.B. (1997). UTHSCSA Image Tool User
Manual. University of Texas Health Science Center, San Antonio, Texas.
Wootton, R.J. (1998). Ecology of teleost fishes. 2nd Edition. Kluwer Academic Publishers,
ISBN 0-412-64200-X, Fish and Fisheries Series 24, London
Zar, J.H. (1999). Biostatistical analysis. 4th Edition. Prentice Hall, ISBN 0-13-081542-X, New
Jersey, USA.
www.intechopen.com
MorphometricsEdited by Prof. Christina Wahl
ISBN 978-953-51-0172-7Hard cover, 108 pagesPublisher InTechPublished online 02, March, 2012Published in print edition March, 2012
InTech EuropeUniversity Campus STeP Ri Slavka Krautzeka 83/A 51000 Rijeka, Croatia Phone: +385 (51) 770 447 Fax: +385 (51) 686 166www.intechopen.com
InTech ChinaUnit 405, Office Block, Hotel Equatorial Shanghai No.65, Yan An Road (West), Shanghai, 200040, China
Phone: +86-21-62489820 Fax: +86-21-62489821
It is human nature to measure things, and this holds true for science as well as everyday life. The five papersin this book demonstrate the usefulness of a morphometric approach to a variety of subjects in natural history,including systematics, phenotypic plasticity in response to environmental variation, and ontogenetic adaptation.As our understanding of genetic control mechanisms and epigenetics has matured over the last severaldecades, it has become clear that morphometric assessment continues to be important to our overallunderstanding of natural variability in growth and form. The tremendous growth of our knowledge base duringthe last century has necessitated that we find new ways to measure and track greater detail as well as greaternumbers of parameters among populations and individuals.
How to referenceIn order to correctly reference this scholarly work, feel free to copy and paste the following:
Paraskevi K. Karachle and Konstantinos I. Stergiou (2012). Morphometrics and Allometry in Fishes,Morphometrics, Prof. Christina Wahl (Ed.), ISBN: 978-953-51-0172-7, InTech, Available from:http://www.intechopen.com/books/morphometrics/morphometrics-and-allometry-in-fishes

© 2012 The Author(s). Licensee IntechOpen. This is an open access articledistributed under the terms of the Creative Commons Attribution 3.0License, which permits unrestricted use, distribution, and reproduction inany medium, provided the original work is properly cited.