mortality and healthnbs.go.tz/nbs/takwimu/census2012/mortality_and_health...this mortality and...
TRANSCRIPT

The United Republic of Tanzania
Mortality and Health
and
July, 2015
Office of Chief Government Statistician
Ministry of State, President Office, State
House and Good Governance
National Bureau of Statistics
Ministry of Finance
Dar es Salaam

UNITED REPUBLIC OF TANZANIA, ADMINISTRATIVE BOUNDARIES

i
Foreword
The 2012 Population and Housing Census (PHC) for the United Republic of Tanzania was carried out
on the 26th August, 2012. This was the fifth Census after the Union of Tanganyika and Zanzibar in
1964. Other Censuses were carried out in 1967, 1978, 1988 and 2002. The 2012 PHC, like previous
others, will contribute to the improvement of quality of life of Tanzanians through the provision of
current and reliable data for policy formulation, development planning and services delivery as well as
for monitoring and evaluating national and international development frameworks.
The 2012 PHC was unique as the collected information will be used in monitoring and evaluating the
Development Vision 2025 for Tanzania Mainland and Zanzibar Development Vision 2020, Five Year
Development Plan 2011/12–2015/16, National Strategy for Growth and Reduction of Poverty
(NSGRP) commonly known as MKUKUTA and Zanzibar Strategy for Growth and Reduction of
Poverty (ZSGRP) commonly known as MKUZA. The census will also provide information for the
evaluation of the Millennium Development Goals (MDGs) in 2015. The Poverty Monitoring Master
Plan, which is the monitoring tool for NSGRP and ZSGRP, mapped out core indicators for poverty
monitoring against the sequence of surveys, with the 2012 PHC being one of them. Several of these
core indicators for poverty monitoring are measured directly from the 2012 PHC. The census provides
a denominator for the determination of other indicators such as childhood mortality, rates of maternal
mortality and others.
The success of the census depended upon the cooperation and contributions from the government,
development partners, various institutions and the public at large. A special word of thanks should go
to the government leaders at all levels, particularly the Minister for Finance; Minister of State,
President’s Office, Finance, Economy and Development Planning, Zanzibar; Members of Parliament;
Members of House of Representatives; Councilors; Regional and District Census Committees chaired
by Regional and District Commissioners; Field Assistants; Enumerators; Supervisors; local leaders and
heads of households.
Our special gratitude should go to the following; DfID, Government of Japan, JICA, UNDP, UNFPA,
UNICEF, USAID, World Bank and other development partners for providing assistance in terms of
equipment, long and short term consultancies, training and funding. We would like to thank religious

ii
and political party leaders, as well as Non-Governmental Organisations (NGOs), mass media and the
general public for their contribution towards successful implementation of the census.
Last but not least, we would wish to acknowledge the vital contributions to the project by Hajjat
Amina Mrisho Said, the 2012 Commissioner for Population and Housing Census and Mr. Mwalim
Haji Ameir, the Census Commissar for Zanzibar. Special thanks should also go to the Management
and staff of the National Bureau of Statistics and Office of Chief Government Statistician, Zanzibar.
Their commitment and dedication made significant contributions to the overall efficiency of the census
operations. We would also like to convey our appreciation to all other Government Officials who
worked tirelessly to ensure successful implementation of the 2012 Population and Housing Census.
Hon. Mizengo Peter Pinda (MP),
Prime Minister, United Republic of Tanzania
Hon. Ambassador Seif Ali Iddi (MP and MHR),
Second Vice President, Zanzibar

iii
Executive Summary
This Mortality and Health Monograph provides in-depth analysis of the level, trend and pattern of
mortality in Tanzania. Specifically, it analyses and provides information on infant, child, under-five,
adult and maternal mortality indicators using data from the 2012 Population and Housing Census
(PHC). Where data allows, comparisons are made with estimates from previous censuses, other
sources as well as with other countries. The information is presented at national level then
disaggregated by the area of Tanzania Mainland and Tanzania Zanzibar, rural and urban. It is also
disaggregated by the 30 administrative regions in the country (25 in Tanzania Mainland and 5 in
Tanzania Zanzibar). In general the analysis presented in this report shows that there was a decline in
mortality as compared to the previous census.
Chapter one highlights the methodology used in the estimation of mortality indicators. The estimated
values of mortality were derived using indirect techniques. This is due to the fact that household deaths
reported in Tanzania’s census, like many other developing countries, are affected by under-reporting
and thus cannot be used without evaluation and adjustment.
Chapter two presents the overall mortality in Tanzania. The country’s Crude Death Rate (CDR) lies at
around 9 deaths per 1,000 persons; and this is the level recorded in other Eastern African countries in
the 2010 round of censuses. There was an overall decline in CDR for Tanzania, Tanzania Mainland,
Tanzania Zanzibar and Tanzania Rural from 2002. However, there was a slight increase in CDR for
Tanzania Urban. Njombe reported the highest CDR of 13.5 deaths per 1,000 persons. It was followed
by Iringa (12.5 percent), Pwani (12.2 percent), Kagera (11.4 percent), Mbeya (10.7 percent), Lindi
(10.2 percent) and Rukwa (10.1 percent). The remaining regions recorded a level of less than 10 deaths
per 1,000 persons.
Life expectancy at birth (e0) provides the most useful summary measure of the mortality level of a
country’s population. The estimates presented in this report show overall life expectancy at birth in
Tanzania was 61.8 years. It was higher in Tanzania Zanzibar (65.2 years, see tables 2.10 and 2.11)
compared to Tanzania Mainland (61.7 years). It was also higher among rural population (62.4 years)
compared to urban populations (59.7 years). As regards sex, there was an overall difference of
approximately four years, with women having higher life expectancy (63.8 years) compared to men

iv
(59.8 years). Arusha region had the highest life expectancy (70.5 years) and Njombe had the lowest
life expectancy (52.8 years).
Chapter three gives information on childhood mortality. The overall infant mortality rate (IMR) was
estimated to 46 deaths per 1,000 live births. This implies that nearly five in every 100 newborn die
before reaching their first birthdays. Child and under-five mortality rates were estimated to be 21 and
66 deaths per 1,000 live births respectively. The estimated rates for Tanzania Mainland are about the
same as the national estimates; however, the rates for Tanzania Zanzibar were higher than the national
rates for childhood mortality (22 deaths per 1,000 live births) but the same for under-five mortality (67
deaths per 1,000 live births).
Infant Mortality Rate for males stood at 51 deaths per 1,000 live births and for female it was 41 deaths
per 1,000 live births. The child mortality rates for males were 23 deaths and around 20 deaths per
1,000 live-births for females. The mortality level for male children under five years of age was
estimated at 73 deaths per 1,000 live births and for females it was 60 deaths per 1,000 live births.
Kagera region had the highest IMR of 62 deaths per 1,000 live births. Arusha and Kilimanjaro regions
reported the lowest levels in infant mortality of around 29 and 30 deaths per 1,000 live births
respectively.
Chapter four presents the maternal mortality ratio for Tanzania, which was estimated at 432 maternal
deaths per 100,000 live births. In other words, for every 1,000 live births in Tanzania in the year
preceding the 2012 PHC about 4 women died of pregnancy-related causes. Maternal mortality was
higher in urban areas (443 deaths per 100,000 live births) than in rural areas (336 deaths per 100,000
live births). The maternal mortality ratio for Tanzania Mainland was estimated at 435 deaths per
100,000 live births, which was significantly higher than that of Tanzania Zanzibar (307 deaths per
100,000 live births). It was also found that, MMR for teenage (15-19 years) was 341 deaths per
100,000 live births.
v
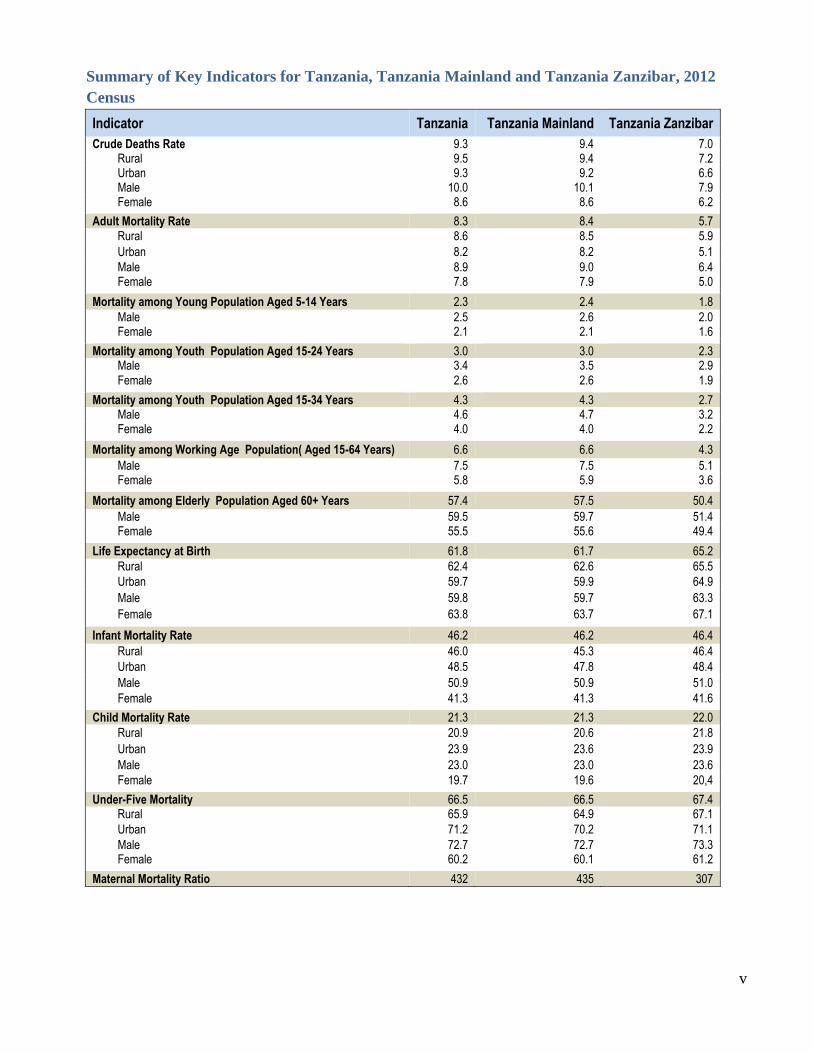
Summary of Key Indicators for Tanzania, Tanzania Mainland and Tanzania Zanzibar, 2012
Census
Indicator Tanzania Tanzania Mainland Tanzania Zanzibar
Crude Deaths Rate 9.3 9.4 7.0 Rural 9.5 9.4 7.2 Urban 9.3 9.2 6.6 Male 10.0 10.1 7.9 Female 8.6 8.6 6.2
Adult Mortality Rate 8.3 8.4 5.7
Rural 8.6 8.5 5.9
Urban 8.2 8.2 5.1
Male 8.9 9.0 6.4 Female 7.8 7.9 5.0
Mortality among Young Population Aged 5-14 Years 2.3 2.4 1.8
Male 2.5 2.6 2.0 Female 2.1 2.1 1.6
Mortality among Youth Population Aged 15-24 Years 3.0 3.0 2.3 Male 3.4 3.5 2.9
Female 2.6 2.6 1.9
Mortality among Youth Population Aged 15-34 Years 4.3 4.3 2.7 Male 4.6 4.7 3.2 Female 4.0 4.0 2.2
Mortality among Working Age Population( Aged 15-64 Years) 6.6 6.6 4.3
Male 7.5 7.5 5.1 Female 5.8 5.9 3.6
Mortality among Elderly Population Aged 60+ Years 57.4 57.5 50.4
Male 59.5 59.7 51.4 Female 55.5 55.6 49.4
Life Expectancy at Birth 61.8 61.7 65.2
Rural 62.4 62.6 65.5
Urban 59.7 59.9 64.9
Male 59.8 59.7 63.3
Female 63.8 63.7 67.1
Infant Mortality Rate 46.2 46.2 46.4
Rural 46.0 45.3 46.4
Urban 48.5 47.8 48.4
Male 50.9 50.9 51.0
Female 41.3 41.3 41.6
Child Mortality Rate 21.3 21.3 22.0
Rural 20.9 20.6 21.8
Urban 23.9 23.6 23.9
Male 23.0 23.0 23.6
Female 19.7 19.6 20,4
Under-Five Mortality 66.5 66.5 67.4 Rural 65.9 64.9 67.1
Urban 71.2 70.2 71.1
Male 72.7 72.7 73.3 Female 60.2 60.1 61.2
Maternal Mortality Ratio 432 435 307

vi
Contents
Page
Foreword .......................................................................................................................................... i
Executive Summary ....................................................................................................................... iii
Summary of Key Indicators for Tanzania, Tanzania Mainland and Tanzania Zanzibar, 2012
Census .................................................................................................................................. v
Contents .......................................................................................................................................... vi
List of Tables .................................................................................................................................. ix
List of Figures ................................................................................................................................. x
List of Maps .................................................................................................................................... x
List of Abbreviation and Acronyms ............................................................................................... xi
Chapter One ................................................................................................................................. 12
Introduction ................................................................................................................................. 12
1.0 Background ........................................................................................................................ 12
1.1 Concepts and Definitions ................................................................................................... 13
1.1.1 Crude Death Rate (CDR) ................................................................................................... 13
1.1.2 “Age-Specific” Death Rates (ASDR)................................................................................. 13
1.1.3 Infant Mortality Rate (IMR) ............................................................................................... 13
1.1.4 Under 5 Mortality Rate (U5MR) ........................................................................................ 13
1.1.5 Maternal Mortality ............................................................................................................. 13
1.1.6 Lifetime Risk ...................................................................................................................... 14
1.1.7 Life Expectancy .................................................................................................................. 14
1.1.8 Life Expectancy at Birth (eo) .............................................................................................. 14
1.2 Overview of Mortality-Related Census Questions and Changes since 2002 .................... 14
1.3 Evaluation of Quality of Data ............................................................................................ 15
1.4 Construction of Life Tables and Estimation of Life Expectancy at Birth .......................... 15
Chapter Two ................................................................................................................................ 17
General Mortality ........................................................................................................................ 17
2.0 Introduction ........................................................................................................................ 17
2.1 General Mortality Indicators .............................................................................................. 17
2.1.1 Age-Specific Deaths Rates ................................................................................................. 17
2.1.2 Crude Death Rates .............................................................................................................. 18
2.1.3 Change in CDR for Tanzania, Tanzania Mainland, Tanzania Zanzibar, Tanzania Rural
and Tanzania Urban (2002 – 2012) ................................................................................... 21
2.1.4 Change in CDR by Administrative Region or Area (2002 – 2012) ................................... 21

vii
2.2 Adult Mortality by Specific Age Groups ........................................................................... 23
2.2.1 Mortality among Population of Age 5 Years and Above ................................................... 23
2.2.2 Mortality among Young People (5–14 years) .................................................................... 23
2.2.3 Mortality among Youth (15–24 and 15–34 years) ............................................................. 24
2.2.4 Mortality among Working Age Population (15–64 years) and the Elderly (60+ and
65+ years) Populations ...................................................................................................... 25
2.2.4.1 Mortality among Working Age (15–64 years) Population ................................................ 25
2.2.4.2 Mortality among the Elderly (60+ and 65+ years) Population .......................................... 25
2.2.5 Regional Variations in Adult Mortality ............................................................................. 26
2.2.6 Life Expectancy .................................................................................................................. 28
Chapter Three ............................................................................................................................. 30
Levels, Trends and Differentials in Infant and Child Mortality ............................................. 30
3.0 Introduction ........................................................................................................................ 30
3.1 Measurement of Early Childhood Mortality ...................................................................... 30
3.2 Levels and Trends of Infant and Child Mortality ............................................................... 31
3.2.1 Levels of Infant and Child Mortality .................................................................................. 31
3.3 Differentials in Infant and Child Mortality ........................................................................ 31
3.3.1 Rural-Urban Differentials of Infant and Child Mortality ................................................... 31
3.3.2 Regional Differentials in Infant and Child Mortality ......................................................... 32
3.3.3 Sex Differentials in Childhood Mortality within the Regions ........................................... 36
3.3.4 Trends in Infant and Child Mortality (1978 – 2012) .......................................................... 37
3.3.5 Trends in Infant and Under-Five Mortality in Rural and Urban Areas .............................. 37
3.3.6 Mortality Differentials by Socio-Economic Determinants ................................................ 38
3.3.6.1 Differentials by Marital Status ......................................................................................... 38
3.3.6.2 Differentials by Educational Attainment .......................................................................... 39
3.3.6.3 Differentials by Main Occupation ..................................................................................... 39
3.4 Changes in Infant and Under-Five Mortality: Tanzania 2002 and 2012 Censuses ............ 41
3.5 Comparison with other Sources and other Countries ......................................................... 44
3.5.1 Comparison of Level of Early Childhood Mortality between Censuses and Surveys ....... 44
3.5.2 Comparison with Other Countries ...................................................................................... 45
Chapter Four ............................................................................................................................... 46
Levels and Patterns of Maternal Mortality .............................................................................. 46
4.0 Introduction ........................................................................................................................ 46
4.1 Data Used and there Quality .............................................................................................. 47
4.2 Reported Female Deaths, Pregnancy-Related Deaths and Births ...................................... 48
4.3 Estimates of Maternal Mortality ........................................................................................ 49

viii
4.4. Regional Differentials in Maternal Mortality ..................................................................... 52
4.5 Lifetime Risk ...................................................................................................................... 54
4.6 Comparison of Maternal Mortality between 2012 Census and Tanzania Demographic
and Health Surveys (TDHSs) ............................................................................................ 54
4.7 Comparison of Maternal Mortality in Tanzania with Other “Sub-Saharan” Countries ..... 55
Chapter Five ................................................................................................................................ 57
Conclusion, Policy Implications and Recommendations ......................................................... 57
5.0 Progress towards International Goals - MDGs .................................................................. 57
5.1 Progress towards National Policies - MKUKUTA and MKUZA ...................................... 57
5.2 Maternal Mortality ............................................................................................................. 59
References .................................................................................................................................... 60
Appendices .................................................................................................................................... 61
Appendix 1: Life Tables ........................................................................................................... 61
Appendix 2: District Childhood Mortality, Tanzania 2012 Census ....................................... 101
Appendix 3: Census Questionnaires ....................................................................................... 106

ix
List of Tables
Table 2. 1: Unadjusted and Estimated CDRs by Region/Area, Tanzania, 2012 Census .................. 20
Table 2. 2: Change in CDR Based on 2002 and 2012 Tanzania Censuses ..................................... 21
Table 2. 3: Change in CDR by Region/Area and Sex, 2002 and 2012 Tanzania Censuses .............. 22
Table 2. 4: Mortality among Population of age 5+ Years by Area, Tanzania 2012 Census ............. 23
Table 2. 5: Mortality among Population of age 5–14 Years by Area, Tanzania 2012 Census ......... 24
Table 2. 6: Mortality among Population of age 15–24 and 15–34 Years, Tanzania, 2012 Census .. 24
Table 2. 7: Mortality among Working Age (15–64 years Population by Area, Tanzania 2012
Census ............................................................................................................................. 25
Table 2. 8: Mortality among the Elderly (60+ and 65+ years) Population by Area, Tanzania 2012
Census ............................................................................................................................. 26
Table 2. 9: Adult Mortality by Region and Sex, Tanzania 2012 Census .......................................... 27
Table 2. 10: Life Expectancy at Birth in Tanzania; 2002 and 2012 Censuses .................................... 28
Table 2. 11: Life Expectancy at Birth by Region Tanzania, 2002 and 2012 Censuses ....................... 29
Table 3. 1: Infant, Child and Under-Five Mortality by Area and Sex, Tanzania 2012 Census ........ 31
Table 3. 2: Rural-Urban Infant, Child and Under-Five Mortality by Sex, Tanzania 2012 Census ... 32
Table 3. 3: Infant, Child and Under-Five Mortality Rates by Region and Sex, Tanzania 2012
Census ............................................................................................................................. 33
Table 3. 4: Sex Differentials in Infant and Under-Five Mortality by Region, Tanzania, 2012
Census ............................................................................................................................ 36
Table 3. 5: Trends in Infant and Under-Five Mortality Rates; for Tanzania, Tanzania Mainland
and Tanzania Zanzibar, 1978 to 2012 Censuses ............................................................. 37
Table 3. 6: Trends in Infant and Under-Five Mortality Rates by Rural and Urban Areas, Tanzania,
2002 and 2012 Censuses ................................................................................................. 38
Table 3. 7: Infant and Under-Five Mortality Rates by Marital Status, Education Attainment and
Occupation of the Mothers, Tanzania, 2012 Census ....................................................... 40
Table 3. 8: Percentage Change of Infant and Under-Five Mortality for Tanzania, Tanzania
Mainland, Tanzania Zanzibar: Tanzania 2002 and 2012 Censuses ................................ 41
Table 3. 9: Percentage Change of Infant and Under-Five Mortality by Region, Tanzania, 2002 and
2012 Censuses ................................................................................................................. 43
Table 3. 10: Infant and Under-Five Mortality Rates from Other African Countries........................... 45
Table 4. 1: Pregnancy-Related Deaths, Tanzania, 2012 Census ....................................................... 48
Table 4. 2: Maternal Mortality Ratio by 5-year Age Groups, Tanzania, 2012 Census ..................... 49
Table 4. 3: Maternal Mortality Ratios by Age Group and Rural-Urban Areas, Tanzania, 2012
Census ............................................................................................................................. 51
Table 4. 4: Maternal Mortality Ratios by Age Group, Tanzania, 2012 Census ................................ 52

x
List of Figures
Figure 2. 1: Estimated Deaths per 1,000 by Age and Sex, Tanzania 2012 Census ............................ 18
Figure 3. 1: Infant and Under-Five Mortality Rates from Censuses and Surveys for Tanzania,
Tanzania Mainland and Tanzania Zanzibar, Tanzania, 2002 and 2012 Censuses and
2004/05 and 2009/10 DHSs ............................................................................................ 44
Figure 4. 1 Proportional Deaths and Births, Tanzania, 2012 Census ................................................ 48
Figure 4. 2 Maternal Mortality Ratio by 5-year Age Groups, Tanzania, 2012 Census ..................... 49
Figure 4. 3 Maternal Mortality Ratio, Tanzania, 2012 Census.......................................................... 50
Figure 4. 4 Maternal Mortality Ratio by Age Group, Tanzania, 2012 Census .................................. 51
Figure 4. 5 Estimated Maternal Mortality Ratio by Region, Tanzania, 2012 Census ....................... 53
Figure 4. 6 Trends in Maternal Mortality Ratio, Tanzania, 1996 TDHS, 2004/05 TDHS, 2010
TDHS and 2012 Census .................................................................................................. 55
Figure 4. 7 Maternal Mortality Ratio by Selected Country ............................................................... 56
Figure 5. 1: Trend in Infant Mortality Rates against 2015 MKUZA Target for Tanzania Zanzibar,
2002 to 2012 Censuses and Surveys ............................................................................... 58
Figure 5. 2: Trends in Under-Five Mortality Rates against 2015 MKUKUTA Target for Tanzania
and Tanzania Mainland, 2002 to 2012 Censuses and Surveys........................................ 58
Figure 5. 3: Trends in Infant Mortality Rates against 2012 MKUKUTA/MKUZA Targets for
Tanzania, Tanzania Mainland and Tanzania Zanzibar, 2002 to 2012 Censuses and
Surveys ............................................................................................................................ 59
List of Maps
Map 3. 1: Infant Mortality Rate by Region, Tanzania 2012 Census ............................................... 34
Map 3. 2: Under-Five Mortality Rate by Region: Tanzania 2012 Census ...................................... 35

xi
List of Abbreviation and Acronyms
ASDR - Age-Specific Death Rate
CDR - Crude Death Rate
CMR - Child Mortality Rate
DfID - Department for International Development
DRC - Democratic Republic of Congo
DSS(s) - Demographic Surveillance Sentinel Sites
EA - Enumeration Area
HDI - Human Development Index
HSSP II - Health Sector Strategic Plan II
IMR - Infant Mortality Rate
JICA - Japanese International Co-operation Agency
LTR - Lifetime Risk
MDAs - Ministries, Departments and Agencies
MDG - Millennium Development Goal
MMR - Maternal Mortality Ratio
NA - Not Applicable
NBS - National Bureau of Statistics
NGO - Non-Governmental Organization
OCGS - Office of Chief Government Statistician
PASEX - Population Analysis System Spreadsheets
PHC - Population and Housing Census
RUPEX - Rural & Urban Projection program with Excel interface
SADC - Southern Africa Development Community
TDHS - Tanzania Demographic and Health Survey
UN - United Nations
UNDP - United Nations Development Programme
UNFPA - United Nations Population Fund
UNICEF - United Nations Children’s Fund
USA - United States of America
USAID - United States Agency for International Development
U5MR - Under-5 Mortality Rate
e0 - Life Expectancy at Birth
1q0 - Infant mortality
4q1 - Child Mortality
5q0 - Under-Five Mortality

12
Chapter One
Introduction
1.0 Background
Mortality refers to deaths that occur within a population. The probability of dying during a given time
period is linked to socio-demographic factors such as age, sex, race, occupation and social class. The
level of mortality reflects the country’s conditions of morbidity and related factors including
prevalence of diseases, environmental and nutritional factors as well as the functioning of the health
care systems. The analysis of mortality levels and trends in a country is, therefore, important for
various reasons, among which are the use of the various mortality indicators in policy formulation,
strategic planning, monitoring and evaluation of various health and other socio-economic programmes,
as well as in facilitating other demographic analyses of a population. Further, it provides important
indicators used in the assessment of the socio-economic status of a population, including indicators
needed to calculate the Human Development Index (HDI) for assessing progress made towards
achieving national and international goals.
The main objective of this monograph is to analyze and provide information on levels and trends of
mortality in Tanzania. Specifically, it analyses and provides estimates of infant, child, under-five,
adult and maternal mortality as reported in 2012 Population and Housing Census (PHC). Where data
allow, comparisons with previous censuses or estimates from other sources as well as with other
countries are presented. The information is presented at national level, and for Tanzania Mainland and
Tanzania Zanzibar. It is further disaggregated by rural and urban areas as well as by the 30
administrative regions in the country (25 regions in Tanzania Mainland and 5 regions in Tanzania
Zanzibar).
The analysis relies on indirect techniques for estimating mortality. This is because Tanzania, like many
other developing countries, lacks a robust vital registration system which could produce adequate and
accurate data to facilitate the calculation of reliable mortality estimates for all the indicators using
direct techniques. Instead, the country relies on censuses as its main source of demographic data,
especially those related to mortality. Moreover, some of the questions and therefore the data ensuing
from the 2012 PHC (for example, information on child survivorship and survivorship of parents)
require the use of indirect techniques. The census data are supplemented by data from other sources

13
like the Tanzania Demographic and Health Surveys (TDHS) since 1992; and of recent, the
Demographic Surveillance Sentinel Sites (DSS), which provide important information on Burden of
Disease (BOD). In addition to supplementing census information, data from these other sources are
used to verify the quality of the indicators resulting from the calculations.
1.1 Concepts and Definitions
The concepts and definitions of various measures of mortality adopted in this monograph are as
follows:
1.1.1 Crude Death Rate (CDR)
The CDR is the number of deaths occurring in a calendar year per 1,000 population. It is, however,
affected by age structure, such that comparison between two different populations requires that the
data are standardized for age.
1.1.2 “Age-Specific” Death Rates (ASDR)
The ASDR is the number of deaths among the population of a specific age group per 1,000 population.
1.1.3 Infant Mortality Rate (IMR)
Infant mortality refers to deaths occurring to children under one year of age. It is measured by a rate
denoted as IMR, which is the number of deaths of children under the age of one year per 1,000 live
births.
1.1.4 Under 5 Mortality Rate (U5MR)
Deaths occurring to children aged below five years are referred to as under-five mortality. The under-
five mortality rate is the number of deaths of children below 5 years of age per 1,000 live births.
1.1.5 Maternal Mortality
Maternal mortality refers to deaths occurring to women of reproductive age due to causes related to
pregnancy and child birth. Such deaths can occur during pregnancy, during delivery or within a period
of 42 days after delivery due to complications associated with child bearing.

14
1.1.6 Lifetime Risk
Lifetime Risk (LTR) reflects the risk that a woman who survives to age 45 will die of maternal causes
at some point during her reproductive lifespan.
1.1.7 Life Expectancy
Life expectancy is the estimated average number of additional years a person could expect to live if the
“age-specific” death rates for a given year prevailed for the rest of his or her lifetime. The estimated
number of years an individual is expected to live generally decreases with increasing age.
1.1.8 Life Expectancy at Birth (eo)
Life expectancy at birth is an estimate of the average number of years a new born baby is expected to
live subject to the mortality risks prevailing for the cross-section of the population at the time of its
birth.
1.2 Overview of Mortality-Related Census Questions and Changes since 2002
The 2012 PHC Questionnaires had a total of eight questions that are directly related to mortality in
general. Five of them solicited information on the total number of deaths that occurred in the
household by sex and age of the deceased as well as the cause of death. The questions on causes of
death centered on whether the cause was road traffic accidents, other injuries, suicide, domestic
violence, sickness/diseases, maternal and other causes. The other three questions concerned maternal
deaths, focusing on whether the death occurred during pregnancy, at the time of delivery or within six
weeks after delivery (puerperium period). There were also questions related to orphan-hood that
provided information on whether one or both of the parents were alive or not. There were also
questions on fertility which provided information on the number of children ever born and children
surviving to women aged 12-49 years. Such data are useful in indirect estimation of mortality, which
relies in part on model life tables in deriving childhood mortality and life expectancy.
Comparing the 2002 and 2012 PHC questions, there were significant improvements in 2012. The
questions on maternal deaths (in the 2012 PHC) facilitated a detailed analysis of maternal mortality in
the country for the first time using census data. Such questions were not included in the 2002 Census.

15
1.3 Evaluation of Quality of Data
Data on mortality from censuses have all along been unreliable. This is because of errors and several
reporting (and often measurement) biases that affect the quality of data. Respondents in the households
may be reluctant to report the death of a household member, especially if it occurred recently, or if it
occurred to an infant especially within its first few days after birth. Moreover, some deaths of members
of households may be reported more than once or omitted if the death occurred elsewhere. There are
also problems in identifying the cause of death as well as misreporting the age of the deceased. The
way the questions were asked and the probing on deaths coupled with the characteristics of the
respondents may also result in errors in the reported deaths.
Briefly, mortality data suffer from errors resulting from under- and over-reporting of deaths, errors in
reporting the age of the deceased as well as errors in reporting the cause of death. These errors affect
the levels and patterns of mortality in general and also in childhood, adult and maternal mortality.
Therefore, evaluating and hence adjusting the reported death data is inevitable.
Various methods and techniques were applied to evaluate and adjust the information on deaths
collected from the 2012 Population and Housing Census, including the smoothing of age-specific death
rates.
1.4 Construction of Life Tables and Estimation of Life Expectancy at Birth
Life tables were constructed by indirectly estimating under-5 mortality from child survivorship data
from 2002 and 2012 censuses, then modeling mortality at age 5 and above. For Tanzania and Tanzania
Mainland, estimates of 2012 infant and child mortality (ages 1 to 4) were derived from child
survivorship data from the 2002 and 2012 PHCs and Brass’ child survivorship technique, assuming
North model mortality. Infant (under 1 year) and child mortality (Ages 1 to 4) were then extrapolated
to midyear 2012. AIDS mortality rates nmx’s were calculated using an epidemiological model at
national level based on antenatal care (ANC) sentinel site data. A series of AIDS m(x)s adjusted
upward or downward for sub-areas based on 2011/12 HIV prevalence estimates, were subtracted from
the estimated 1m0 and 4m1, and the associated l5 values were used to model life table nmx’s at ages 5
and above. Under-five mortality was combined with mortality at ages 5 and above to generate a
hypothetical “without-AIDS” life table and AIDS mortality was then added to age – sex-specific nmx’s
to give a “with-AIDS” life table.

16
For Mainland, the estimation approach used involved estimation of under-5 mortality from census
questions about children ever born and surviving from the 2002 and 2012 censuses, and modeling
mortality at ages above age 5 using Coale-Demeny North regional model mortality (Coale and
Demeny 1966, United Nations 1983). Non-AIDS age-specific central death rates were calculated for
ages under 5, AIDS mortality from epidemiological modeling was subtracted to give non-AIDS rates,
non-AIDS mortality above age 5 was modeled using the North regional mortality, and AIDS mortality
was then added to the non-AIDS death rates at all ages, completing life tables and generating death
rates for specific adult age groups.
For Zanzibar, under-5 mortality was also indirectly calculated from child survivorship data and
mortality above age 5 was modeled using North Regional Model Mortality. However, AIDS mortality
was not incorporated into the estimation for Zanzibar because of the concentrated nature of the
epidemic, the low HIV prevalence level, and the absence of approved sentinel surveillance site data for
epidemiological modeling for Zanzibar. This chapter presents results on adult mortality in general, as
well as mortality of population groups of interest based on the 2012 PHC data.

17
Chapter Two
General Mortality
2.0 Introduction
Adult mortality and morbidity in “Sub-Saharan” Africa are not well understood. Compared to
childhood and maternal mortality, little attention has been directed towards understanding the
magnitude and trends of adult mortality. Yet, this is the most economically and biologically productive
population sub-group. Moreover, any meaningful health intervention to reduce mortality and ill-health
must be informed on the magnitude, the spatial distribution and cause of illness and death.
Understanding adult health is, therefore, important for health, economic and social planning.
In this chapter, adult mortality is distinguished from under-5 mortality and refers to mortality at all
ages 5 and above. The 2012 PHC asked questions about deaths in the household during the year
preceding the census, about orphan-hood, and about child survivorship. Each of these types of data
can be used to calculate mortality at ages 5 and above. However, after review of the quality of the
household deaths data and the assumptions required by the methodology available to estimate adult
deaths from the distribution of deaths by age or from orphan-hood, an indirect estimation approach
making use of child survivorship data was used to calculate mortality at ages 5 and above from the
2012 national population and household census (PHC). In addition to presenting crude death rates and
age-specific death rates, this chapter presents estimated mortality among youths, the working-age
population and the older population.
2.1 General Mortality Indicators
Three indicators commonly used in the analysis of mortality were calculated and analysed. These are
the crude death rate, age-specific death rates and life expectancy at birth.
2.1.1 Age-Specific Deaths Rates
Estimated age-specific death rates for Tanzania, its regions, and rural and urban areas are taken from
the indirectly derived life tables calculated for 2012 (August). For comparison purpose Figure 2.1
shows the age-specific death rates for 2002 census and the recent census (2012). Death rates were
generally higher in 2002 than 2012 for both males and females.

18
Figure 2. 1: Estimated Deaths per 1,000 by Age and Sex, Tanzania 2012 Census
2.1.2 Crude Death Rates
The Crude Death Rate (CDR) is a crude measure of overall level of mortality in a given population.
CDR may be obtained by dividing the number of reported deaths occurring in a calendar year by the
mid-year population and multiplying the results by 1,000. The calculated value is the level of mortality
per 1,000 persons. In the 2012 TPHC, the reported deaths were generally low, indicating under-
reporting of the deaths (see chapter 1). Here, deaths have been calculated as the product of census
population and indirectly-derived age-specific death rates. CDR has been calculated as the ratio of the
sum of all deaths to total census population for Tanzania and its sub-areas.
Unadjusted deaths were obtained from reported deaths occurring in the households during the 12
months before census night. This information was collected by asking the head of household whether
there was any death that occurred in the household within the 12 months prior to the census reference
date. Information on deaths that occurred in a household in the past 12 months prior to the census date
could be used in the estimation of crude death rates (CDR), age-specific death rates. As known that,
information on mortality derived from censuses has all along been unreliable, this has necessitated the
need to evaluate and hence adjust the reported death data to get desired mortality levels, quality data is
of importance hence evaluation of data has to be done before embarking on estimation of mortality
indices.

19
Estimated deaths have been obtained by taking adjusted nmx from the raked final life table multiplying
by the population from private households.
Table 2.1 shows the reported and adjusted CDRs. The country’s CDR lies at around 9 deaths per 1,000
population; and this is within the levels recorded in other eastern African countries in the 2010 round
of censuses. There are slight higher CDR in urban areas (10 deaths per 1,000 population) compared to
rural areas (9 deaths per 1,000 population).
Njombe Region reported to have the highest CDR (13.5 deaths per 1,000 persons) followed by Iringa
(12.5 deaths per 1,000 persons), Pwani (12.2 deaths per 1,000 persons), Kagera (11.4 deaths per 1,000
persons), Mbeya (10.7 deaths per 1,000 persons), Katavi (10.7 deaths per 1,000 persons), Mtwara (10.6
deaths per 1,000 persons) and Lindi (10.2 deaths per 1,000 persons) and Rukwa (10.1 deaths per 1,000
persons). On the low side are Geita, Simiyu, Kusini Pemba, Kaskazini Unguja, Kaskazini Pemba,
Singida, Mjini Magharibi, Arusha and Manyara. These regions recorded a CDR less than 8 deaths per
1,000 persons.

20
Table 2. 1: Unadjusted and Estimated CDRs by Region/Area, Tanzania, 2012 Census
Region/Area 2012 Unadjusted CDR 2012 Estimated CDR
Total Male Female Total Male Female
Tanzania 9.3 9.8 8.9 9.3 10.0 8.6
Tanzania Rural 8.9 9.3 8.4 9.5 10.2 8.8
Tanzania Urban 10.4 11.1 9.9 9.3 10.1 8.5
Tanzania Mainland 9.3 9.8 8.9 9.4 10.1 8.6
Mainland Rural 8.9 9.4 8.4 9.4 10.1 8.7
Mainland Urban 10.5 11.1 9.9 9.2 10.0 8.4
Tanzania Zanzibar 9.3 9.6 9.0 7.0 7.9 6.2
Zanzibar Rural 8.6 8.7 8.5 7.2 8.2 6.3
Zanzibar Urban 10.1 10.7 9.5 6.6 7.7 5.6
Dodoma 8.8 9.3 8.4 9.0 10.1 7.9
Arusha 8.0 8.7 7.3 5.4 5.9 4.9
Kilimanjaro 9.3 10.3 8.4 9.3 9.4 9.2
Tanga 12.1 12.6 11.6 9.1 9.6 8.6
Morogoro 9.9 10.2 9.6 9.2 10.0 8.5
Pwani 13.0 13.5 12.6 12.2 12.3 12.2
Dar es Salaam 10.5 10.9 10.1 9.1 10.2 8.1
Lindi 12.1 12.8 11.5 10.2 11.5 9.0
Mtwara 12.1 13.2 11.1 10.6 11.2 10.0
Ruvuma 8.9 9.5 8.4 9.9 10.5 9.3
Iringa 10.9 11.9 10.0 12.5 13.0 11.9
Mbeya 10.4 11.0 10.0 10.7 11.4 10.1
Singida 9.0 8.2 9.7 7.8 8.1 7.4
Tabora 7.8 8.1 7.5 9.5 10.5 8.4
Rukwa 10.9 11.8 10.1 10.1 11.2 9.0
Kigoma 8.2 8.8 7.6 9.6 10.2 9.0
Shinyanga 7.2 7.6 6.9 9.7 10.7 8.7
Kagera 9.8 10.4 9.3 11.4 12.1 10.7
Mwanza 7.9 8.5 7.4 8.4 9.2 7.6
Mara 8.7 9.4 8.0 9.5 10.1 8.9
Manyara 7.6 8.0 7.2 6.9 7.4 6.5
Njombe 6.0 6.6 5.5 13.5 14.9 12.4
Katavi 8.4 8.7 8.1 10.7 12.3 9.0
Simiyu 7.4 8.0 6.8 7.4 7.8 7.1
Geita 6.7 7.0 6.4 7.6 8.3 6.9
Kaskazini Unguja 7.5 7.7 7.3 7.1 8.2 6.1
Kusini Unguja 9.7 10.1 9.4 9.0 9.9 8.1
Mjini Magharibi 10.1 10.6 9.6 6.5 7.6 5.6
Kaskazini Pemba 9.5 9.2 9.8 7.0 7.8 6.2
Kusini Pemba 7.7 8.3 7.3 7.4 7.7 7.2

21
2.1.3 Change in CDR for Tanzania, Tanzania Mainland, Tanzania Zanzibar,
Tanzania Rural and Tanzania Urban (2002 – 2012)
Table 2.2 compares estimated CDR of the 2012 census with that of 2002 for the country and for rural
and urban areas. There is an overall decline in CDR for Tanzania, Tanzania Mainland and Tanzania
Zanzibar, and also in the rural areas. However, there is a slight increase in CDR for Tanzania Urban.
Data indicate that the crude death rate for Tanzania has declined from 16 deaths per 1,000 persons in
2002 to 9.3 deaths per 1,000 persons in 2012. In the Tanzania Mainland it has declined from 16 to 9.4
deaths per 1,000 persons while in the rural areas the decline was from 18 to 9.5 deaths per 1000
persons. In Tanzania Zanzibar, there is also decline from 10 to 7.0 deaths per 1,000 persons.
Table 2. 2: Change in CDR Based on 2002 and 2012 Tanzania Censuses
Administrative Area
2002 Estimated CDRs 2012 Estimated CDRs Percentage Change
since 2002
Total Male Female Total Male Female Total Male Female
Tanzania 16 15 8.6 9.3 10.0 8.6 -41.9 -33.3 0.0
Tanzania Rural 18 17 8.5 9.5 10.2 8.8 -47.2 -40.0 +3.5
Tanzania Urban 9 10 8.8 9.3 10.1 8.5 +3.3 +1.0 -3.4
Tanzania Mainland 16 15 8.7 9.4 10.1 8.6 -41.2 -32.7 -1.1
Tanzania Zanzibar 10 10 5.9 7.0 7.9 6.2 -30.0 -21.0 +5.1
2.1.4 Change in CDR by Administrative Region or Area (2002 – 2012)
At regional level (Table 2.3), the decline in CDR is observed in majority of the regions in Tanzania.
Mjini Magharibi was the only region with an increase of CDR during the 2002-2012 period. Regions
recording the highest decline were Rukwa (from 30 deaths per 1,000 persons in 2002 to 10 deaths per
1,000 persons in 2012), Dodoma (from 24 deaths per 1,000 to 9 deaths per 1,000 persons), Tanga
(from 23 deaths per 1,000 to 9.0 deaths per 1,000 persons), Kaskazini Pemba (from 18 deaths per
1,000 to 7 deaths per 1,000 persons), Iringa (from 29 deaths per 1,000 to 13 deaths per 1,000 persons)
and Singida (from 18 deaths per 1,000 to 8 deaths per 1,000 persons).

22
Table 2. 3: Change in CDR by Region/Area and Sex, 2002 and 2012 Tanzania Censuses
Region/Area 2002 Estimated CDRs 2012 Estimated CDRs
Percentage Change since 2002
Total Male Female Total Male Female Total Male Female
Tanzania 16 15 16 9.3 10.0 8.6 -41.9 -33.3 -46.3
Tanzania Mainland 16 15 16 9.4 10.1 8.6 -41.3 -32.7 -46.3
Dodoma 24 23 24 9.0 10.1 7.9 -62.5 -56.1 -67.1
Arusha 12 9 19 5.4 5.9 4.9 -55.0 -34.4 -74.2
Kilimanjaro 15 14 15 9.3 9.4 9.2 -38.0 -32.9 -38.7
Tanga 23 21 24 9.1 9.6 8.6 -60.4 -54.3 -64.2
Morogoro 15 14 14 9.2 10.0 8.5 -38.7 -28.6 -39.3
Pwani 14 12 15 12.2 12.3 12.2 -12.9 2.5 -18.7
Dar es Salaam 10 11 9 9.1 10.2 8.1 -9.0 -7.3 -10.0
Lindi 17 17 17 10.2 11.5 9.0 -40.0 -32.4 -47.1
Mtwara 23 23 23 10.6 11.2 10.0 -53.9 -51.3 -56.5
Ruvuma 14 16 13 9.9 10.5 9.3 -29.3 -34.4 -28.5
Iringa 29 25 33 12.5 13.0 11.9 -56.9 -48.0 -63.9
Mbeya 24 21 27 10.7 11.4 10.1 -55.4 -45.7 -62.6
Singida 18 18 18 7.8 8.1 7.4 -56.7 -55.0 -58.9
Tabora 12 12 12 9.5 10.5 8.4 -20.8 -12.5 -30.0
Rukwa 30 33 27 10.1 11.2 9.0 -66.3 -66.1 -66.7
Kigoma 13 12 13 9.6 10.2 9.0 -26.2 -15.0 -30.8
Shinyanga 17 17 17 9.7 10.7 8.7 -42.9 -37.1 -48.8
Kagera 14 15 13 11.4 12.1 10.7 -18.6 -19.3 -17.7
Mwanza 14 14 13 8.4 9.2 7.6 -40.0 -34.3 -41.5
Mara 18 16 20 9.5 10.1 8.9 -47.2 -36.9 -55.5
Manyara 13 12 13 6.9 7.4 6.5 -46.9 -38.3 -50.0
Njombe* * * * 13.5 14.9 12.4 * * *
Katavi* * * * 10.7 12.3 9.0 * * *
Simiyu* * * * 7.4 7.8 7.1 * * *
Geita* * * * 7.6 8.3 6.9 * * *
Tanzania Zanzibar 10 10 10 7.0 7.9 6.2 -30.0 -21.0 -38.0
Kaskazini Unguja 16 15 17 7.1 8.2 6.1 -55.6 -45.3 -64.1
Kusini Unguja 10 10 9 9.0 9.9 8.1 -10.0 -1.0 -10.0
Mjini Magharibi 6 6 6 6.5 7.6 5.6 8.3 26.7 -6.7
Kaskazini Pemba 18 17 19 7.0 7.8 6.2 -61.1 -54.1 -67.4
Kusini Pemba 15 16 17 7.4 7.7 7.2 -50.7 -51.9 -57.6
Note: regions marked * were formed/created after 2002 Census

23
2.2 Adult Mortality by Specific Age Groups
The occurrence of deaths varies between population age groups due to a number of factors.
Occupations and other lifestyle aspects are often associated with these variations. Moreover, the
implications of mortality levels of specific age groups need to be well understood for meaningful
interventions in people’s health. This section examines mortality by different age groups.
2.2.1 Mortality among Population of Age 5 Years and Above
The overall mortality among Tanzania adult population (persons of age 5 years and above) is shown in
Table 2.4. Its mortality was 8.3 deaths per 1,000 persons and it was slightly higher among males (8.9
deaths per 1,000 persons) than females (7.8 deaths per 1,000 persons). This is common in many
populations, as men are generally reported to have higher mortality compared to women. The rates for
Tanzania and those for Tanzania Mainland are generally comparable. That of Tanzania Zanzibar is
slightly lower and the difference is significant.
Comparing rural population with urban population, mortality is slightly lower in urban population (8.2
deaths per 1,000 persons) than in rural population (8.6 deaths per 1,000 persons). This pattern is
maintained for Tanzania, Tanzania Mainland and Tanzania Zanzibar. However, the difference is small
in each area. There are also variations in mortality rates between sexes with males having higher rates
than females.
Table 2. 4: Mortality among Population of age 5+ Years by Area, Tanzania 2012 Census
Tanzania Tanzania Mainland Tanzania Zanzibar
Total Male Female Total Male Female Total Male Female
Total 8.3 8.9 7.8 8.4 9.0 7.9 5.7 6.4 5.0
Rural 8.6 9.2 8.0 8.5 9.1 8.0 5.9 6.7 5.2
Urban 8.2 8.9 7.6 8.2 8.8 7.6 5.1 5.9 4.4
2.2.2 Mortality among Young People (5–14 years)
Overall, mortality among young people of age 5 to 14 was 2.3 deaths per 1,000 persons (Table 2.5).
The levels are generally similar in Tanzania, the Tanzania Mainland and Tanzania Zanzibar. The
pattern of higher mortality for males than for females is still evident. When mortality is compared
between rural and urban areas, the pattern of higher mortality in urban areas than in rural is still
evident. retained. In Tanzania, mortality for this age group was 2.2 deaths per 1,000 persons in the

24
rural areas, and 2.7 deaths per 1,000 persons in the urban areas. This pattern is maintained in the
overall population of Tanzania, Tanzania Mainland and Tanzania Zanzibar.
Table 2. 5: Mortality among Population of age 5–14 Years by Area, Tanzania 2012 Census
Tanzania Tanzania Mainland Tanzania Zanzibar
Total Male Female Total Male Female Total Male Female
Total 2.3 2.5 2.1 2.4 2.6 2.1 1.8 2.0 1.6
Rural 2.2 2.5 2.0 2.2 2.4 2 1.6 1.8 1.5
Urban 2.7 2.9 2.5 2.7 2.9 2.5 1.8 2.1 1.5
2.2.3 Mortality among Youth (15–24 and 15–34 years)
Internationally, youth population is the population aged 15 to 24 years. However, according to the
Tanzania’s Youth Policy, youth population is the population aged 15 to 34 years. The overall mortality
level among youths of age 15 to 34 years was 4.3 deaths per 1,000 persons; higher in Tanzania
Mainland (4.3 deaths per 1,000 persons) than in Zanzibar (2.7 deaths per 1,000 persons). In Tanzania,
mortality was higher among males (4.7 deaths per 1,000 persons) than females (4.0 per 1,000), but
lower among rural dwellers (4.0) than among urban dwellers (5.1) (Table 2.6).
Table 2. 6: Mortality among Population of age 15–24 and 15–34 Years, Tanzania, 2012 Census
Administrative Area 15 - 24 years 15 - 34 years
Total Male Female Total Male Female
Tanzania 3.0 3.4 2.6 4.3 4.6 4.0
Rural 2.9 3.3 2.4 4.0 4.4 3.6
Urban 3.4 3.9 3.0 5.1 5.5 4.8
Tanzania Mainland 3.0 3.5 2.6 4.3 4.7 4.0
Rural 2.8 3.3 2.4 3.9 4.3 3.6
Urban 3.3 3.8 2.9 5.0 5.4 4.8
Tanzania Zanzibar 2.3 2.9 1.9 2.7 3.2 2.2
Rural 2.2 2.7 1.8 2.5 3.0 2.1
Urban 2.4 3.0 1.8 2.7 3.4 2.1

25
2.2.4 Mortality among Working Age Population (15–64 years) and the Elderly (60+
and 65+ years) Populations
2.2.4.1 Mortality among Working Age (15–64 years) Population
The overall mortality among the 15 to 64 years age group, the age range comprising most of
Tanzania’s labour force, was 6.6 deaths per 1,000 persons; higher among males (7.5 deaths per 1,000
persons) than among females (5.8 deaths per 1,000 persons). However, mortality was lower for rural
dwellers (6.3 deaths per 1,000 persons) than for urban dwellers (7.5 deaths per 1,000 persons). The
same pattern was observed in Tanzania Mainland. In Tanzania Zanzibar mortality was the same for
rural and urban dwellers (Table 2.7).
Table 2. 7: Mortality among Working Age (15–64 years Population by Area, Tanzania 2012
Census
Tanzania Tanzania Mainland Tanzania Zanzibar
Total Male Female Total Male Female Total Male Female
Total 6.6 7.5 5.8 6.6 7.5 5.9 4.3 5.1 3.6
Rural 6.3 7.2 5.5 6.3 7.1 5.5 4.2 5.0 3.4
Urban 7.5 8.4 6.6 7.4 8.3 6.6 4.2 5.2 3.3
2.2.4.2 Mortality among the Elderly (60+ and 65+ years) Population
The magnitude of mortality among the elderly people of 60 years and above was 57.4 deaths per 1,000
persons and that of 65 years and above was 74.8 deaths per 1,000 persons. Mortality was higher
among males than among females for both age groups in Tanzania Mainland as well as in Tanzania
Zanzibar. Rural areas had higher mortality than urban areas, and this pattern was observed in Tanzania,
Tanzania Mainland and Tanzania Zanzibar (Table 2.8).

26
Table 2. 8: Mortality among the Elderly (60+ and 65+ years) Population by Area, Tanzania
2012 Census
Administrative Area 60 Years and Above 65 Years and Above
Total Male Female Total Male Female
Tanzania 57.4 59.5 55.5 74.8 77.3 72.5
Rural 59.0 61.8 56.4 76.1 79.3 73.2
Urban 53.6 53.5 53.6 72.4 72.7 72.1
Tanzania Mainland 57.5 59.7 55.6 74.9 77.5 72.6
Rural 58.6 61.3 56.1 75.5 78.6 72.7
Urban 53.4 53.3 53.5 72.0 72.3 71.8
Tanzania Zanzibar 50.4 51.4 49.4 69.3 70.5 68.2
Rural 51.6 53.8 49.3 70.0 72.2 67.7
Urban 47.5 47.6 47.5 66.9 67.6 66.3
2.2.5 Regional Variations in Adult Mortality
Table 2.9 presents the adult mortality by region. The results reveal that, in all regions, the mortality
level was higher for males than females. Regions with a higher adult mortality rate than the national
average of 8.3 deaths per 1,000 persons were Njombe (13 deaths per 1,000 persons), Pwani (11.5
deaths 1,000 persons), Iringa (11.3 deaths per 1,000 persons), Mtwara (10.1 deaths per 1,000 persons),
Mbeya (9.9 deaths per 1,000 persons), Lindi (9.6 deaths per 1,000 persons), Kilimanjaro (9.5 deaths
per 1,000 persons), Kagera (9.4 deaths per 1,000 persons), Ruvuma (9.0 deaths per 1,000 persons)
Shinyanga (8.7 deaths per 1,000 persons), Katavi (8.6 deaths per 1,000 persons), Dodoma and Tabora
(each with 8.4 deaths per 1,000 persons).

27
Table 2. 9: Adult Mortality by Region and Sex, Tanzania 2012 Census
Region Both Sexes Male Female
Tanzania 8.3 8.9 7.8
Tanzania Mainland 8.4 9.0 7.9
Dodoma 8.4 9.4 7.5
Arusha 4.9 5.4 4.5
Kilimanjaro 9.5 9.6 9.4
Tanga 8.2 8.6 7.9
Morogoro 8.3 8.8 7.8
Pwani 11.5 11.3 11.8
Dar es Salaam 8.1 9.0 7.2
Lindi 9.6 10.6 8.8
Mtwara 10.1 10.4 9.7
Ruvuma 9.0 9.5 8.5
Iringa 11.3 11.6 11.1
Mbeya 9.9 10.5 9.4
Singida 7.6 7.8 7.3
Tabora 8.4 9.4 7.4
Rukwa 8.1 9.1 7.2
Kigoma 8.3 8.6 8.0
Shinyanga 8.7 9.6 7.8
Kagera 9.4 10.0 8.9
Mwanza 7.2 7.9 6.6
Mara 8.1 8.4 7.7
Manyara 6.4 6.7 6.1
Njombe 13.0 14.3 11.9
Katavi 8.6 10.2 7.0
Simiyu 6.6 6.9 6.3
Geita 6.5 7.2 5.8
Tanzania Zanzibar 5.7 6.4 5.0
Kaskazini Unguja 6.1 7.1 5.2
Kusini Unguja 7.4 8.0 6.7
Mjini Magharibi 5.1 5.8 4.4
Kaskazini Pemba 5.7 6.5 5.0
Kusini Pemba 6.1 6.4 5.8

28
2.2.6 Life Expectancy
Life expectancy at birth (e0) provides the most useful summary measure of the overall level of
mortality in a population. Life expectancy at birth is calculated as part of a life table, and the
methodologies for life table construction on Tanzania Mainland and Tanzania Zanzibar have already
been described. The life tables for Tanzania Mainland and its regions were calculated by incorporating
estimated AIDS mortality while those for Tanzania Zanzibar and its regions were calculated without
incorporating AIDS. Table 2.10 presents the estimates of life expectancy at birth for Tanzania,
Tanzania Mainland, Tanzania Zanzibar and Table 2.11 presents the same for the 30 administrative
regions.
In 2012, the estimates show that the overall life expectancy at birth was 61.8 years in Tanzania and
61.7 years for Tanzania Mainland. The observed value is lower than that of Tanzania Zanzibar (63.5
years). It is also slightly lower among urban populations (59.7 years) compared to rural populations
(62.4 years)., Women have higher life expectancy at birth of four years more than their counterpart
male (63.8 years for women and 59.8 years for male). Male mortality is higher and male life
expectancy at birth lower in both parts of URT (Mainland and Zanzibar).
Table 2. 10: Life Expectancy at Birth in Tanzania; 2002 and 2012 Censuses
Administrative Area Life Expectancy at Birth, 2002 Life Expectancy at Birth, 2012
Total Male Female Total Male Female
Tanzania 50.9 51.0 51.0 61.8 59.8 63.8
Tanzania Rural 50.0 49.9 50.4 62.4 60.3 64.4
Tanzania Urban 56.8 55.8 58.8 59.7 57.7 61.7
Tanzania Mainland 50.4 50.8 51.0 61.7 59.7 63.7
Mainland Rural 49.4 49.4 51.2 62.6 60.6 64.6
Mainland Urban 56.4 55.5 58.8 59.9 58.0 61.8
Tanzania Zanzibar 59.0 59.7 60.3 65.2 63.3 67.1
Zanzibar Rural 58.7 58.0 59.9 65.5 64.0 66.9
Zanzibar Urban 56.8 55.5 57.8 64.9 62.2 67.6
Life expectancy at birth varies by administrative region. Some regions had life expectancies that were
below the national average (62 years). Njombe had the lowest life expectancy at birth (52.8 years)
among all regions. Arusha had the highest life expectancy at birth (over 71 years).

29
Table 2. 11: Life Expectancy at Birth by Region Tanzania, 2002 and 2012 Censuses
Region Life Expectancy at Birth, 2002 Life Expectancy at Birth, 2012
Total Male Female Total Male Female
Tanzania 50.9 51.0 51.0 61.8 59.8 63.8
Tanzania Mainland 50.9 51.0 51.0 61.7 59.7 63.7
Dodoma 45.1 46.5 44.9 64.3 60.8 67.9
Arusha 60.4 58.9 53.3 70.5 68.8 72.3
Kilimanjaro 54.8 54.8 54.7 67.3 66.3 68.4
Tanga 43.6 42.2 43.2 64.3 63.3 65.3
Morogoro 50.4 50.5 50.7 62.3 60.4 64.3
Pwani 52.3 52.6 51 60.2 59.7 60.7
Dar es Salaam 53.9 52.5 54.6 59.4 57.2 61.6
Lindi 48 48.1 48.3 63.8 61.2 66.4
Mtwara 43.6 43.1 44.5 63.4 61.8 65.1
Ruvuma 52.2 50.8 53.9 60.2 59.0 61.5
Iringa 39 36.7 37.7 55.4 53.2 57.7
Mbeya 40.6 41.9 39 58.1 56.3 60.0
Singida 50.3 50.9 50.1 67.0 65.7 68.2
Tabora 56.6 56.8 57.1 60.7 58.1 63.3
Rukwa 44.5 42.9 46.9 58.3 55.9 60.8
Kigoma 61.1 63.2 59.9 62.1 60.4 63.8
Shinyanga 51.4 50.8 52.7 59.6 57.0 62.3
Kagera 52.6 51.7 54.2 57.5 55.5 59.7
Mwanza 53.2 51.9 54.5 62.4 60.3 64.6
Mara 49.3 49.6 49.3 60.8 58.9 62.8
Manyara 59.2 59.2 59.5 68.1 66.8 69.5
Njombe* -- -- -- 52.8 49.3 56.4
Katavi* -- -- -- 57.3 53.9 60.9
Simiyu* -- -- -- 64.6 63.2 66.0
Geita* -- -- -- 63.2 61.6 64.8
Tanzania Zanzibar 57.0 59.7 60.3 65.2 63.3 67.1
Kaskazini Unguja 58.0 58.2 55.6 66.6 64.5 68.8
Kusini Unguja 62.5 61.7 63.1 62.3 60.1 64.5
Mjini Magharibi 64.9 64.9 65.7 65.0 62.6 67.5
Kaskazini Pemba 53.2 54.0 53.2 66.2 64.8 67.5
Kusini Pemba 57.8 55.9 60.3 65.3 64.8 65.8
Note: regions marked * were formed/created after the 2002 Census

30
Chapter Three
Levels, Trends and Differentials in Infant and Child Mortality
3.0 Introduction
This chapter gives estimates of levels and trends as well as several differentials in infant, child and
under-five mortality. These rates are important in measuring the country’s health status and the quality
of the life of its people. Childhood mortality estimates are used to identify vulnerable populations,
particularly where data on the incidences and prevalence of diseases are not readily available. A main
objective of this report is to provide early childhood mortality estimates as an input in monitoring and
evaluation of health interventions as well as the national strategy towards improving welfare and health
of its society.
The analysis will focus on data from 2012 PHC and other previous censuses. For comparison
purposes, information from different national surveys undertaken during the period of ten years will be
used. In addition, the level of child mortality (4q1) also will be taken into consideration. Progress
towards national (MKUKUTA and MKUZA) and international goals (MGDs) set and achieved will be
highlighted.
3.1 Measurement of Early Childhood Mortality
The rate of infant mortality (1q0) measures the number of children dying before reaching the age of one
year per 1,000 live births in a given year. Child and under-five mortality measure the probability of
child dying between age of 1 and 4 years (4q1) and from birth to 5 years (5q0), respectively.
Survivorship of children on these ages is influenced by both biological and behavioural factors. Thus,
early childhood mortality estimates reflect social, economic and environmental conditions and
children’s’ health care.
Like previous censuses, the 2012 PHC had questions that provided data for both direct and indirect
estimates of infant and child mortality. For direct estimation, census questions were asked about
deaths which occurred within the household, age of the deceased and causes of death for the past 12
months prior to the night of the census date. Females aged 12-49 were asked to provide information
about children born during the previous 12 months, whether each child was still alive and for those
who died, age at death. For indirect estimation, census questions were asked about children ever born
and children surviving. This report relies on indirectly estimated infant and child mortality rates
because of the poor quality of data on deaths in the household from the 2012 Census.

31
3.2 Levels and Trends of Infant and Child Mortality
3.2.1 Levels of Infant and Child Mortality
Table 3.1 indicates the levels of early childhood mortality disaggregated by sex and area. The overall
infant mortality rate (IMR) was estimated to be 46 deaths per 1,000 live births. Both Tanzania
Mainland and Zanzibar had almost the same level of infant mortality. The observed rate implies that
for every 100 newborn about five die before reaching their first birthday. Child and under-five
mortality rates were estimated at 21 and 67 deaths per 1,000 live births, respectively. Like in other
developing countries, the level of childhood mortality was still high which underscores the need to
develop and implement programmes targeting children survival.
As expected, male children experienced higher mortality in infancy, childhood, and up to their fifth
birthdays than females. Male IMR was 51 deaths per 1,000 live births while that of females was 41
deaths per 1,000 live births. The child mortality for male children was 23 and about 20 deaths per
1,000 live-births for female children. The mortality level for male children under five years of age was
estimated at 73 deaths per 1,000 live births and 60 deaths for female children. Generally, both male
and female childhood estimates for Tanzania Mainland and Tanzania Zanzibar follow the same pattern
as that of Tanzania.
Table 3. 1: Infant, Child and Under-Five Mortality by Area and Sex, Tanzania 2012 Census
Administrative Area
Infant Mortality (1q0) Child Mortality (4q1) Under-Five Mortality (5q0)
Total Male Female Total Male Female Total Male Female
Tanzania 46.2 50.9 41.3 21.3 23.0 19.7 66.5 72.7 60.2
Tanzania Mainland 46.2 50.9 41.3 21.3 23.0 19.6 66.5 72.7 60.1
Tanzania Zanzibar 46.4 51.0 41.6 22.0 23.6 20.4 67.4 73.3 61.2
3.3 Differentials in Infant and Child Mortality
3.3.1 Rural-Urban Differentials of Infant and Child Mortality
Table 3.2 presents infant and child mortality estimates for rural and urban areas of Tanzania. Overall,
infant mortality estimates for the urban areas of Tanzania, Tanzania Mainland and Tanzania Zanzibar
were higher than those of the corresponding rural areas. The infant mortality rate for Tanzania urban
was estimated at 48.5 deaths per 1,000 live births and that of Tanzania rural was 46.0 deaths per 1,000
live births. Likewise, the infant mortality rates for Tanzania Mainland urban and Tanzania Zanzibar

32
urban were 47.8 and 48.4 deaths per 1,000 live births respectively while those of the corresponding
rural areas were estimated at 45.3 and 44.9 deaths per 1,000 live births respectively. The 2012 PHC
data show, in short, that levels of infant mortality in rural areas were lower than those in urban areas.
This pattern is also noted for both males and females. Furthermore, under-five mortality rates and child
mortality rates have similar rural-urban patterns to those observed for the infant mortality rates.
Table 3. 2: Rural-Urban Infant, Child and Under-Five Mortality by Sex, Tanzania 2012 Census
Administrative Area Infant Mortality (1q0) Child Mortality (4q1) Under-5 Mortality (5q0)
Total Male Female Total Male Female Total Male Female
Tanzania 46.2 50.9 41.3 21.3 23.0 19.7 66.5 72.7 60.2
Rural 46.0 50.5 41.3 20.9 22.4 19.3 65.9 71.8 59.9
Urban 48.5 53.9 42.9 23.9 25.9 21.8 71.2 78.4 63.8
Tanzania Mainland 46.2 50.9 41.3 21.3 23.0 19.6 66.5 72.7 60.1
Rural 45.3 49.7 40.7 20.6 22.1 19.1 64.9 70.6 59.0
Urban 47.8 53.1 42.3 23.6 25.6 21.5 70.2 77.3 62.9
Tanzania Zanzibar 46.4 51.0 41.6 22.0 23.6 20.5 67.4 73.3 61.2
Rural 44.9 49.5 40.1 20.4 22.0 18.7 64.3 70.4 58.0
Urban 48.0 55.5 40.4 23.5 27.3 19.5 70.3 81.3 59.1
3.3.2 Regional Differentials in Infant and Child Mortality
Table 3.3 and Map 3.1 and Map 3.2 present infant and child mortality estimates by administrative
region. The analysis of 2012 Census data on child survivorship, significant differentials in early
childhood mortality exist among the regions. While Tanzania’s estimated IMR was 46.2 per 1,000 live
births, the estimates for 13 out of the 30 administrative regions were below that of national average,
the 16 regions had rates above the national average, and one region (Shinyanga) had the same rate as
the national average. As was true in 2002, Arusha and Kilimanjaro regions reported the lowest levels
of infant mortality rates (29.0 and 29.6 deaths per 1,000 live births, respectively). These were followed
by Singida (32.4 deaths per1000 live births), Manyara (33.3 deaths per 1000 live births) and Simiyu
(39.4 deaths per 1000 live births). Regions with highest level of infant mortality had the rates above
the national level and ranged from 47.5 to 61.8 deaths per 1,000 live births.
As with infant mortality, Arusha and Kilimanjaro reported the lowest levels of under-five mortality
rates compared to other regions. Under-five mortality rates for Arusha and Kilimanjaro were estimated
at 37.3 and 38.5 deaths per 1,000 live births respectively. The results show that out of the 30 regions,
13 regions had under-five mortality rates below the national figure of 66.5 deaths per 1,000 live births.

33
The remaining 17 regions recorded higher under-five mortality rates (between 66.7 and 93.9 under-five
deaths per 1,000 live births). Overall, the 2012 PHC reveals that for Tanzania as a whole for every 100
live births nearly seven children die before reaching five years of age.
Table 3. 3: Infant, Child and Under-Five Mortality Rates by Region and Sex, Tanzania 2012
Census
Region Infant Mortality (1q0) Child Mortality (4q1) Under-5 Mortality (5q0)
Total Male Female Total Male Female Total Male Female
Tanzania 46.2 50.9 41.3 21.3 23.0 19.7 66.5 72.7 60.2
Tanzania Mainland 46.2 50.9 41.3 21.3 23.0 19.6 66.5 72.7 60.1
Dodoma 42.1 47.5 36.5 16.1 18.8 13.4 57.5 65.5 49.4
Arusha 29.0 32.1 25.8 8.6 9.5 7.7 37.3 41.3 33.3
Kilimanjaro 29.6 31.8 27.3 9.2 9.3 9.0 38.5 40.8 36.1
Tanga 44.7 48.6 40.8 20.1 21.3 19.0 64.0 68.8 59.0
Morogoro 47.6 54.3 40.7 22.1 25.5 18.7 68.7 78.4 58.6
Pwani 51.3 57.0 45.5 25.3 27.6 23.0 75.4 83.1 67.4
Dar es Salaam 49.0 54.4 43.4 24.6 26.5 22.5 72.3 79.5 64.9
Lindi 47.0 56.5 37.2 19.0 24.9 12.8 65.0 80.0 49.5
Mtwara 45.2 52.3 38.0 18.0 21.9 13.9 62.3 73.0 51.4
Ruvuma 47.6 52.4 42.6 22.2 23.9 20.4 68.7 75.0 62.2
Iringa 59.8 66.6 52.7 33.0 35.8 30.0 90.7 100.0 81.2
Mbeya 49.0 53.7 44.2 23.7 25.1 22.2 71.5 77.5 65.5
Singida 32.4 35.6 29.2 10.6 11.6 9.7 42.7 46.8 38.6
Tabora 47.5 52.4 42.4 23.0 24.8 21.2 69.4 75.9 62.6
Rukwa 54.8 59.9 49.5 27.9 29.4 26.3 81.2 87.6 74.6
Kigoma 48.9 54.3 43.4 24.0 26.1 21.8 71.7 78.9 64.2
Shinyanga 46.2 50.8 41.5 21.6 23.1 20.0 66.7 72.7 60.6
Kagera 61.8 67.1 56.4 34.2 35.6 32.7 93.9 100.3 87.2
Mwanza 44.3 48.2 40.3 20.4 21.3 19.5 63.8 68.5 59.0
Mara 50.7 55.1 46.2 24.2 25.6 22.8 73.6 79.2 67.9
Manyara 33.3 37.7 28.9 11.6 13.4 9.7 44.5 50.6 38.3
Njombe 54.5 59.8 49.0 28.5 30.3 26.7 81.4 88.3 74.4
Katavi 58.2 64.2 52.0 31.7 33.9 29.4 88.0 95.9 79.9
Simiyu 39.4 41.8 37.0 15.4 15.2 15.6 54.3 56.4 52.1
Geita 41.0 44.1 37.7 17.6 17.9 17.2 57.8 61.2 54.3
Tanzania Zanzibar 46.4 51.0 41.6 22.0 23.6 20.4 67.4 73.3 61.2
Kaskazini Unguja 42.1 47.2 36.9 18.1 20.5 15.6 59.5 66.8 51.9
Kusini Unguja 56.8 63.4 50.1 30.8 33.5 28.0 85.9 94.8 76.7
Mjini Magharibi 47.1 53.6 40.4 23.0 26.1 19.8 69.0 78.3 59.4
Kaskazini Pemba 43.4 45.9 40.8 19.3 19.4 19.2 61.8 64.4 59.2
Kusini Pemba 45.8 46.0 45.6 21.9 19.6 24.3 66.7 64.7 68.8

34
Map 3. 1: Infant Mortality Rate by Region, Tanzania 2012 Census

35
Map 3. 2: Under-Five Mortality Rate by Region: Tanzania 2012 Census

36
3.3.3 Sex Differentials in Childhood Mortality within the Regions
As shown in Table 3.4, males had higher infant and under-five mortality rates than females. IMRs for
males ranged between 31.8 deaths per 1,000 live births observed in Kilimanjaro and 67.1deaths per
1,000 live births in Kagera. The estimated infant mortality rates for females were between 25.8 deaths
per 1,000 live births in Arusha region and 56.4 deaths per 1,000 live births in Kagera. The under-five
mortality rates males ranged between 40.8 observed in Kilimanjaro region and 100.3 deaths per 1,000
live births found in Kagera. On the other hand, the under-five mortality rates for females between 33.3
deaths per 1,000 live births in Arusha region and 87.2 deaths per 1,000 live births in Kagera.
Table 3. 4: Sex Differentials in Infant and Under-Five Mortality by Region,
Tanzania, 2012 Census
Region Infant Mortality (1q0) Under-Five Mortality (5q0)
Males Females Males Females
Tanzania 50.9 41.3 72.7 60.2
Tanzania Mainland 50.9 41.3 72.7 60.1
Dodoma 47.5 36.5 65.5 49.4
Arusha 32.1 25.8 41.3 33.3
Kilimanjaro 31.8 27.3 40.8 36.1
Tanga 48.6 40.8 68.8 59.0
Morogoro 54.3 40.7 78.4 58.6
Pwani 57.0 45.5 83.1 67.4
Dar es Salaam 54.4 43.4 79.5 64.9
Lindi 56.5 37.2 80.0 49.5
Mtwara 52.3 38.0 73.0 51.4
Ruvuma 52.4 42.6 75.0 62.2
Iringa 66.6 52.7 100.0 81.2
Mbeya 53.7 44.2 77.5 65.5
Singida 35.6 29.2 46.8 38.6
Tabora 52.4 42.4 75.9 62.6
Rukwa 59.9 49.5 87.6 74.6
Kigoma 54.3 43.4 78.9 64.2
Shinyanga 50.8 41.5 72.7 60.6
Kagera 67.1 56.4 100.3 87.2
Mwanza 48.2 40.3 68.5 59.0
Mara 55.1 46.2 79.2 67.9
Manyara 37.7 28.9 50.6 38.3
Njombe 59.8 49.0 88.3 74.4
Katavi 64.2 52.0 95.9 79.9
Simiyu 41.8 37.0 56.4 52.1
Geita 44.1 37.7 61.2 54.3
Tanzania Zanzibar 51.0 41.6 73.3 61.2
Kaskazini Unguja 47.2 36.9 66.8 51.9
Kusini Unguja 63.4 50.1 94.8 76.7
Mjini Magharibi 53.6 40.4 78.3 59.4
Kaskazini Pemba 45.9 40.8 64.4 59.2
Kusini Pemba 46.0 45.6 64.7 68.8

37
3.3.4 Trends in Infant and Child Mortality (1978 – 2012)
Table 3.5 shows trend of two measures of early childhood mortality at national level based on different
censuses from 1978 to 2012. Results from the 2012 PHC indicate that early childhood mortality in
Tanzania is declining. The overall infant mortality decreased to 46 deaths per 1,000 live births in 2012
census from 137, 115 and 95 deaths per 1,000 live births in 1978, 1988 and 2002 censuses
respectively. This means that, during the 34 years from 1978 to 2012, infant mortality was reduced by
about two-thirds. During the same period, under-five mortality rate dropped to nearly 67 deaths in
2012 from 231 (1978), 191 (1988) and 153 (2002) deaths for every 1,000 live births. The results
further reveal that childhood mortality for Tanzania Mainland follows a similar pattern as that of the
nation.
Under the period of review, Tanzania Zanzibar also shows remarkable declines in both measures of
child mortality. Infant mortality was reduced from 125 deaths in 1978 census to 120 deaths in 1988
Census, 89 deaths in 2002 Census and to 46 deaths per 1,000 live births in 2012 Census. Furthermore,
the under-five mortality rate declined from 209 deaths in 1978 Census to 67 deaths per 1,000 live
births in 2012 Census.
Table 3. 5: Trends in Infant and Under-Five Mortality Rates; for Tanzania, Tanzania
Mainland and Tanzania Zanzibar, 1978 to 2012 Censuses
Census Year Tanzania Tanzania Mainland Tanzania Zanzibar
IMR U5MR IMR U5MR IMR U5MR
1978 137 231 137 271 125 209
1988 115 191 115 191 120 202
2002 95 153 95 154 89 141
2012 46 67 46 67 46 67
3.3.5 Trends in Infant and Under-Five Mortality in Rural and Urban Areas
Infant and under-five mortality rates for rural and urban areas of Tanzania are presented in Table 3.6.
In the 2012 Census, the estimates of infant and under-five mortality rates were higher in urban than in
rural areas of Tanzania, Tanzania Mainland and Tanzania Zanzibar. But, in the 2002 census, the
estimates for the three areas were higher in rural than in urban areas. For example, rural Tanzania
recorded an estimated infant mortality rate of 99 deaths per 1,000 live births and 78 deaths per 1,000
live in urban areas in 2002 while in 2012 census the infant mortality in urban areas (49 deaths per
1,000 live births) was higher than rural areas (46 deaths per 1,000 live births). A similar pattern was

38
also observed in Tanzania Mainland and Tanzania Zanzibar. Likewise, Tanzania had higher under-five
mortality rates in urban areas (71 deaths per 1,000 live births) in 2012 than those observed in rural
areas (66 deaths per 1,000 live births).
Table 3. 6: Trends in Infant and Under-Five Mortality Rates by Rural and
Urban Areas, Tanzania, 2002 and 2012 Censuses
Administrative Area IMR (1q0) U5MR (5q0)
2002 2012 2002 2012
Tanzania 95 46 153 67
Rural 99 46 162 66
Urban 78 49 123 71
Tanzania Mainland 95 46 154 67
Rural 99 45 162 65
Urban 78 48 123 70
Tanzania Zanzibar 89 46 141 67
Rural 98 46 159 67
Urban 67 48 105 71
3.3.6 Mortality Differentials by Socio-Economic Determinants
Socio-economic and demographic characteristics such as mother’s age when giving birth, marital
status, education, occupation and survival of preceding sibling(s) are frequently the most important
determinants of infant and child mortality. All these factors are considered to have an impact on
survivorship of the newborn. The discussion in this area focuses on marital status, mother’s level of
education and occupation in determining the level of childhood mortality. In this report, marital status
is categorized into four groups: those never-married, married or living together, divorced or separated
and widowed. Table 3.7 presents infant and under-5 mortality differentials for the different categories
of selected socio-economic and demographic characteristics.
3.3.6.1 Differentials by Marital Status
Generally, the national mortality rate based for all four categories of marital status follows the same
pattern. The rate for IMR ranges between 40.0 deaths to 52.7 deaths per 1,000 live births and 45.3
deaths to 78.5 deaths per 1,000 live births for under-five mortality. However, Zanzibar had the highest
rates for women who were never married of 52.7 and 78.5 deaths per 1,000 live births among infants
and under-5 respectively.

39
3.3.6.2 Differentials by Educational Attainment
Mother’s education level enhances the survival of a child. The educational status of mothers is
categorized as never attended (including pre-primary and nursery), primary, secondary and tertiary
(those reaching post- secondary education). As expected, childhood mortality rate was higher among
the never-attended women. The national IMR for mother who never attended school was 46.8 deaths
per 1,000 live-births; this implies for every 100 newborn in Tanzania five of them died before reaching
age one. The rate was slightly higher in Zanzibar (53.8 deaths per 1000 live-births). The situation
remains the same for the deaths of under-five children of these mothers. Almost 67 Tanzanian
children per 1000 live-births of this age die before celebrating their fifth birthday.
Unlike Tanzania Mainland where the pattern of mortality follows the same as the national ones; for
Zanzibar the higher the education attainment of the mother, the lower the mortality rate. The IMR for
mother’s who attained tertiary level is 32.2 deaths and 42.1 deaths per 1000 live-births for Zanzibar
and Mainland, respectively.
3.3.6.3 Differentials by Main Occupation
Infant and under-five mortality rates were found to vary with the occupation of the women in
Tanzania, Tanzania Mainland and Tanzania Zanzibar. Table 3.7 shows variations of the infant and
under-five mortality rates according to the main occupation of women of age 15-49 years. Occupation
groups analysed were:
i. Professional, Managers and Technicians
ii. Small Business, Service and Sales, and Crafts
iii. Agriculture
iv. Street Vendors
v. Elementary Occupation
vi. Not Working
There was a marked difference between the infant and under-5 mortality rates of the women who were
“Not-Working” and the “Street Vendors” categories. Women in the “Street Vendors” category had
IMRs of 42.9 in Tanzania and 42.8 in Tanzania Mainland and under-five mortality rates of 61.0 in
Tanzania and 60.7 in Tanzania Mainland, which were less than other categories in both Tanzania and
Tanzania Mainland.

40
In Tanzania, women who were in the “Not-Working” category had higher infant and under-five
mortality rates than the rest with 49.3 and 72.5 children per every 1000 live births respectively. The
same situation was found in Tanzania Mainland where the women who were in the “Not-Working”
category had higher infant and under-five mortality rates than other categories, with 49.4 and 72.5
deaths per 1000 live births, respectively.
The situation was different in Tanzania Zanzibar as the women who were in the “Street Vendors”
category had the highest infant and under-five mortality rates of 49.1 and 72.1 deaths per 1000 live
births, respectively. Women in “Elementary Occupations” had the lowest infant and under-five
mortality rates of 39.2 and 53.8 deaths per every 1000 live births, respectively.
Table 3. 7: Infant and Under-Five Mortality Rates by Marital Status, Education
Attainment and Occupation of the Mothers, Tanzania, 2012 Census
Socio Economic/Demographic Characteristics
Tanzania Tanzania Mainland Tanzania Zanzibar
IMR U5MR IMR U5MR IMR U5MR
Marital Status
Never Married 46.8 66.6 46.7 66.3 52.7 78.5
Married/Living Together 43.6 62.1 43.6 62.1 45.3 65.3
Divorced/Separated 40.6 57.1 40.0 56.0 43.5 62.4
Widowed 41.6 65.4 42.1 66.5 31.6 45.3
Education Attainment
Never Attended 46.8 66.6 46.6 66.3 53.8 80.7
Primary 44.6 64.1 44.6 64.1 46.3 67.2
Secondary 44.7 64.8 44.8 64.9 44.4 64.2
Tertiary 41.6 65.4 42.1 66.4 32.2 46.6
Occupation Status
Professional, Managers, Technicians 45.8 66.6 46.0 67.0 40.4 56.9
Small Business, Service and Sales, Crafts 47.7 69.8 47.9 70.2 43.1 61.3
Agriculture 43.9 62.1 43.9 62.1 45.3 64.9
Street Vendors 42.9 61.0 42.8 60.7 49.1 72.1
Elementary Occupation 46.2 66.2 46.4 66.7 39.2 53.8
Not Working 49.3 72.5 49.4 72.5 48.3 71.0

41
3.4 Changes in Infant and Under-Five Mortality: Tanzania 2002 and 2012
Censuses
Table 3.8 shows the percentage change and average annual change in infant and under-five mortality
from the 2002 Census to the 2012 Census. At the national level, the percentage change in infant
mortality was 51.4 with an average annual decline of 4.9 infant deaths per 1,000 live births. The
change in mortality for children under-five years of age was 56.5 percent whereas the average annual
decline was 8.7 deaths per 1,000.
During the same period, reduction of mortality for children under-one year for Tanzania Mainland was
51.4 deaths per 1,000 live births and 47.9 deaths per 1,000 live births for Tanzania Zanzibar at an
average annual change of 4.9 and 4.3 deaths per 1,000, respectively. Percentage change in under-five
mortality was 59.0 for Tanzania Mainland and 52.2 for Tanzania Zanzibar at an average annual change
(reduction) of 9.6 and 7.4 deaths per 1,000, respectively. Significant level of achievement has been
made in under-five mortality where the percentage reduction between two censuses was slightly more
than fifty percent.
Table 3. 8: Percentage Change of Infant and Under-Five Mortality for Tanzania, Tanzania
Mainland, Tanzania Zanzibar: Tanzania 2002 and 2012 Censuses
Area Infant Mortality
% Change
Average Annual
Change in IMR
Under-five Mortality %
Change
Average Annual
Change in U5MR
2002 2012 2002 2012
Tanzania 95 46.2 -51.4 -4.9 153 66.5 -56.5 -8.7 Rural 99 46.0 -53.5 -5.3 162 65.9 -59.3 -9.6 Urban 78 48.5 -37.8 -3.0 123 71.2 -42.1 -5.2
Tanzania Mainland 95 46.2 -51.4 -4.9 154 66.5 -59.0 -9.6
Rural 99 45.3 -54.2 -5.4 162 64.9 -59.9 -9.7
Urban 78 47.8 -38.7 -3.0 123 70.2 -42.9 -5.3
Tanzania Zanzibar 89 46.4 -47.9 -4.3 141 67.4 -52.2 -7.4
Rural 98 46.4 -52.7 -5.2 159 67.1 -57.8 -9.2
Urban 67 48.4 -27.8 -1.9 105 71.1 -32.3 -3.4
The regional percentage change in IMR and U5MR over the period 2002 to 2012 and the
corresponding average changes per annum are given in Table 3.9. Out of 26 regions (excluding 4
newly formed regions), 15 regions reduced infant mortality by more than 50 percent. These regions are
Kaskazini Unguja (68.1 percent), Kaskazini Pemba (66.1 percent), Mtwara (64.1 percent), Lindi (63.6
percent), Dodoma (63.1 percent), Kusini Pemba (62.8 percent), Singida (60.5 percent), Mjini

42
Magharibi (57.9 percent), Mara (55.1 percent), Tanga (54.4 percent), Ruvuma (54.2 percent), Kusini
Unguja (52.7 percent), Morogoro (52.4 percent), Manyara (51.7 percent) and Mbeya (51.5 percent).
The percentage change for the remaining regions ranges between 29.3 percent (Arusha) and 49.8
percent in Shinyanga region.
In respect to the under-five mortality, 22 regions managed to achieve a convincing reduction in under-
five mortality of between 51.6 and 70.6 percent. The eight regions with less reductions (below 50
percentage) in under-five mortality include: Arusha (35.7 percent) Mjini Magharibi (36.7 percent),
Kusini Unguja (39.1 percent),), Dar es Salaam (41.2 percent), Kilimanjaro (42.5 percent), Iringa (45.4
percent), Tabora (47.8 percent) and Kagera (48.4 percent). Some regions had reductions of under-five
mortality rate that were 60 percent or more. These are Tanga (60.5 percent), Mara (60.9 percent),
Kaskazini Pemba (62.8 percent), Kaskazini Unguja (65.0 percent), Singida (67.7 percent), Dodoma
(69.9 percent), Lindi (70.0 percent) and Mtwara (70.6 percent).

43
Table 3. 9: Percentage Change of Infant and Under-Five Mortality by Region,
Tanzania, 2002 and 2012 Censuses
Region
Infant Mortality %
Change
Average Annual
change in IMR
Under five Mortality %
Change
Average Annual change
in U5MR 2002 2012 2002 2012
Tanzania 95 46.2 -51.4 -4.9 153 66.5 -56.5 -8.6
Tanzania Mainland 95 46.2 -51.4 -4.9 154 66.5 -56.8 -9.6
Dodoma 114 42.1 -63.1 -7.2 191 57.5 -69.9 -13.3
Arusha 41 29.0 -29.3 -1.2 58 37.3 -35.7 -2.1
Kilimanjaro 46 29.6 -35.7 -1.6 67 38.5 -42.5 -2.9
Tanga 98 44.7 -54.4 -5.3 162 64.0 -60.5 -9.8
Morogoro 100 47.6 -52.4 -5.2 163 68.7 -57.9 -9.4
Pwani 101 51.3 -49.2 -5.0 166 75.4 -54.6 -9.1
Dar es Salaam 79 49.0 -38.0 -3.0 123 72.3 -41.2 -5.1
Lindi 129 47.0 -63.6 -8.2 217 65.0 -70.0 -15.2
Mtwara 126 45.2 -64.1 -8.1 212 62.3 -70.6 -15.0
Ruvuma 104 47.6 -54.2 -5.6 171 68.7 -59.8 -10.2
Iringa 102 59.8 -41.4 -4.2 166 90.7 -45.4 -7.5
Mbeya 101 49.0 -51.5 -5.2 165 71.5 -567 -9.4
Singida 82 32.4 -60.5 -5.0 132 42.7 -67.7 -8.9
Tabora 83 47.5 -42.8 -3.6 133 69.4 -47.8 -6.4
Rukwa 106 54.8 -48.3 -5.1 175 81.2 -53.6 -9.4
Kigoma 92 48.9 -46.8 -4.3 148 71.7 -51.6 -7.6
Shinyanga 92 46.2 -49.8 -4.6 149 66.7 -55.2 -8.2
Kagera 110 61.8 -43.8 -4.8 182 93.9 -48.4 -8.8
Mwanza 87 44.3 -49.1 -4.3 139 63.8 -54.1 -7.5
Mara 113 50.7 -55.1 -6.2 188 73.6 -60.9 -11.4
Manyara 69 33.3 -51.7 -3.6 107 44.5 -58.4 -6.3
Njombe * -- 54.5 -- -- -- 81.4 -- -- Katavi * -- 58.2 -- -- -- 88.0 -- -- Simiyu * -- 39.4 -- -- -- 54.3 -- -- Geita * -- 41.0 -- -- -- 57.8 -- -- Tanzania Zanzibar 89 46.4 -47.9 -4.3 141 67.4 -52.2 -7.4
Kaskazini Unguja 132 42.1 -68.1 -9.0 170 59.5 -65.0 -11.1
Kusini Unguja 120 56.8 -52.7 -6.3 141 85.9 -39.1 -5.5
Mjini Magharibi 112 47.1 -57.9 -6.5 109 69.0 -36.7 -4.0
Kaskazini Pemba 128 43.4 -66.1 -8.5 166 61.8 -62.8 -10.4
Kusini Pemba 123 45.8 -62.8 -7.7 154 66.7 -56.7 -8.7
Note:
1. * - New Regions: Njombe, Katavi, Simiyu and Geita are new administrative regions formed in 2012
2. Childhood Mortality Rates at District level are available in Appendix 2
3. “Average annual change” in IMR or U5MT is the average annual reduction in infant or under-5
deaths per 1,000 live birth from 2002 to 2012

44
3.5 Comparison with other Sources and other Countries
3.5.1 Comparison of Level of Early Childhood Mortality between Censuses and
Surveys
Figure 3.2 shows childhood mortality estimates obtained from censuses and surveys undertaken in
Tanzania from 2002 to 2012. Two national surveys (2004/05 TDHS and 2009/10 TDHS) were
conducted before the 2012 Census. The obtained information shows that there was a downward trend
in early childhood mortality (infant and under-five) between the two censuses. Rapid declines of
childhood mortality indicators were observed; at national level, infant mortality rate went down from
95 deaths per 1,000 live births in 2002 Census to 46 deaths in 2012 Census, in other words, more than
half of infant deaths were reduced within the 10 year period.
The under-five mortality rate from 2012 Census stands at 67 for Tanzania, Tanzania Mainland and
Tanzania Zanzibar which is a decline from 153, 154 and 141 deaths per 1,000 live births for Tanzania,
Tanzania Mainland and Tanzania Zanzibar respectively.
Figure 3. 1: Infant and Under-Five Mortality Rates from Censuses and Surveys for
Tanzania, Tanzania Mainland and Tanzania Zanzibar, Tanzania, 2002 and 2012
Censuses and 2004/05 and 2009/10 DHSs

45
3.5.2 Comparison with Other Countries
The levels of infant and under-five mortality rates for Tanzania in comparison with some other African
countries are presented in Table 3.10. According to a UN Inter-Agency Group for Child Mortality
Estimation report (2011), the infant mortality rate of Tanzania was estimated to be 50 deaths per 1,000
live births in 2010, which was significantly lower than those of Kenya, Uganda, Zambia, Malawi and
Burundi. As revealed by the 2012 PHC, Tanzanian infant mortality dropped to 46 deaths per 1,000 live
births.
Furthermore, the estimated under-five mortality rate for Tanzania for the year 2010 was 76 deaths per
1,000 live births which was also lower than rates in the mentioned countries. The results from the 2012
census show further decline in under-five mortality to 67 deaths per every 1,000 live births.
Table 3. 10: Infant and Under-Five Mortality Rates from Other African Countries
Country
Infant Mortality Under-Five Mortality
1990 2010
1990 2010 2015 MDG Target Average Annual Rate of
Reduction (%) 1990-2010
Tanzania 95 50 155 76 52 3.6
Kenya 64 55 99 85 33 0.8
Uganda 106 63 175 99 58 2.8
Zambia 109 69 183 111 61 2.5
Malawi 131 58 222 92 74 4.4
Burundi 110 88 183 142 61 1.3
Source: UN Inter-Agency Group for Child Mortality Estimation, Levels & Trends in Child Mortality; 2011

46
Chapter Four
Levels and Patterns of Maternal Mortality
4.0 Introduction
This chapter presents information on maternal mortality in Tanzania. Maternal mortality is widely
regarded as key indicator of a population’s health and of a society’s development. The estimation of
maternal mortality serves the needs of health sector by identifying population groups that are at high
risk. A number of interventions are taken by the government of Tanzania through Ministry of Health
aiming at reducing the deaths of pregnant women, such as increasing the coverage of deliveries
attended by skilled health personnel; the number of health facilities providing neonatal, child and
maternal health services to the lowest of health facilities; and expansion of Emergency Obstetric Care
(EMOC) coverage.
Maternal mortality indicators obtained from the 2012 Population and Housing Census provide an
opportunity to monitor and evaluate health programs. Moreover, these indicators will be used in
assessing progress in achieving the objectives of the National Strategy for Growth and Reduction of
Poverty II (NSGRP II), the Zanzibar Strategy for Growth and Reduction of Poverty II (ZSGRP II); and
also in assessing progress towards achievement of the Millennium Development Goals (MDGs) of
improving maternal health (Goal number five) as we understand that Tanzania has its own goal and
target in reducing maternal mortality ratio by 2015.
Given the shortcomings of civil registration in many Sub-Saharan countries and sample-based
methodologies, it has been suggested that census measurement could be more appropriate for
producing acceptably precise, cost-effective estimates of maternal mortality and worth further
exploration (Hill, Stanton and Gupta, 2001). Tanzania included maternal mortality questions in the
2012 Census questionnaires for the first time in the history of conducting population and housing
censuses. Before that, the maternal mortality data were estimated by using information collected from
Demographic and Health Surveys (DHSs). The first data on maternal mortality using survivorship, the
age of surviving siblings, the age at death of siblings who died, and the number of years since the
sibling died were collected in the 1996 Tanzania Demographic and Health Survey (TDHS). This
method allows the data to be aggregated to determine the number of person-years of exposure to
mortality and the number of deaths which have occurred to siblings in a particular calendar year.
According to Rutenberg and Sullivan (1991), it is possible to compute maternal mortality rates by

47
dividing maternal deaths by person-years of exposure. Two subsequent demographic surveys which
collected maternal mortality data were in the 2004/05 TDHS and 2010 TDHS.
4.1 Data Used and there Quality
The maternal mortality data were taken from the 2012 Population and Housing Census. Respondents in
all households were asked whether any deaths occurred in the household in the last 12 months prior to
the census reference date and if so, the sex and age of the deceased at the time of death, and the cause
of death. To establish whether deaths were pregnancy-related, respondents were further asked
questions for women who died between age 12 and 49 years: "Did the death occur during pregnancy?";
and if not, "Did the death occur during childbirth?"; and if not, "Did the death occur during the 6
weeks period following the end of a pregnancy or childbirth, irrespective of the way the pregnancy
ended?".
The questions on fertility were directed to all females aged 12 years and above, who were asked if they
had biological children living in the household, living elsewhere and children dead. From these three
questions, the number of children ever born and children surviving were obtained. To obtain current
fertility, women aged 12 to 49 years were asked additional questions about the number of children born
alive in the last 12 months and the number of children who were still alive. This information allowed
for the estimation of maternal mortality rates, age-specific maternal deaths and maternal mortality
ratio.
Maternal mortality estimation requires accurate reporting of the number of females who have died and
the number of females who have died of maternity-related causes (to estimate maternal mortality
indices). Although efforts have been made to collect complete and accurate data on mortality, common
problems of census in developing countries, such as over-reporting, under-reporting of deaths, age-
misreporting and wrong dating of events had to be tackled in this analysis.

48
4.2 Reported Female Deaths, Pregnancy-Related Deaths and Births
Table 4.1 provides the information on female deaths, pregnancy-related deaths and births in the 12
months prior to the 2012 Population and Housing Census reference date. The results reveal that, out of
the 56,178 female deaths that occurred in the households, 15,056 deaths were pregnancy-related.
Table 4. 1: Pregnancy-Related Deaths, Tanzania, 2012 Census
Age Group
Female Deaths Births Pregnancy Related to
Total Deaths Total Female
Deaths Pregnancy
Related Proportion
Pregnancy-Related
Number of Births
Proportion of Births
15-19 4,333 1,250 0.083 166,488 0.104 0.288
20-24 5,547 2,211 0.147 426,485 0.266 0.399
25-29 7,112 2,300 0.153 399,821 0.250 0.323
30-34 8,536 2,244 0.149 298,876 0.187 0.263
35-39 10,495 2,343 0.156 194,146 0.121 0.223
40-44 9,613 2,324 0.154 83,241 0.052 0.242
45-49 10,542 2,384 0.158 32,356 0.020 0.226
Total 56,178 15,056 1.000 1,601,413 1.000 0.268
Figure 4.1 shows the relationship between the proportion of births and pregnancy-related deaths. The
proportion of births and deaths were higher at younger ages although there were more births than
deaths. The proportion of births reached its peak among women of 20-24 age group, and fell gradually
from 25-29 age group onwards. Of note, the proportion of deaths that were pregnancy-related were
about the same among women of 20-24 to 30-34 age groups, then increased slightly at higher ages.
Figure 4. 1 Proportional Deaths and Births, Tanzania, 2012 Census

49
4.3 Estimates of Maternal Mortality
Maternal mortality is usually measured by three indicators, namely maternal mortality ratio, maternal
mortality rate and lifetime risk (LTR). The most commonly used measure, however, is the maternal
mortality ratio (MMR). This is the number of women who die from maternal causes per 100,000 live
births. However, the computed estimates in this report are MMR and LTR. The maternal mortality
estimation was done by using a maternal mortality package developed by the World Health
Organization (WHO 2014). The Generalized Growth Balance technique and the Synthetic Extinct
Generations method were applied to evaluate the census information on reported household deaths,
estimating the completeness of reporting of deaths over age 5 years by comparing the age distribution
of deaths to the age distribution of the population.
These techniques assume that the population has stable characteristics: mortality and fertility were
constant during the past, and there was no migration. They assume that completeness of death
registration is the same for all age groups; such as 5-years age groups or 10-years age groups and that
there is no age misreporting of the population or of deaths. The two techniques provide information on
the quality of the death data and permit adjustment in cases where estimated completeness is less than
100 percent. Pregnancy-related maternal deaths are then adjusted using the inverse of the estimated
proportion complete. The adjusted maternal deaths for Tanzania are presented in Table 4.2.
Table 4.2 presents the maternal mortality ratio for Tanzania, estimated as 432 maternal deaths per
100,000 live births. In other words, for every 1,000 live births in Tanzania during this period, about 4
women died of pregnancy-related causes. The comparison of maternal mortality ratio between urban
and rural areas (Table 4.3) show that urban mortality (443 deaths per 100,000 live births) was higher
than rural mortality (336 deaths per 100,000 live births).
Figure 4. 2 Maternal Mortality Ratio by 5-year Age Groups, Tanzania, 2012 Census
Age Group Adjusted
Deaths Adjusted Pregnancy
Related Deaths Adjusted
Births Maternal
Mortality Ratio Maternal to Total
Deaths
15-19 3,195 687 201,644 341 0.215
20-24 4,412 1,215 538,582 226 0.275
25-29 5,986 1,263 491,082 257 0.211
30-34 6,321 1,233 348,694 354 0.195
35-39 6,035 1,287 211,917 607 0.213
40-44 4,876 1,277 91,143 1401 0.262
45-49 4,397 1,310 32,154 4074 0.298
Total 35,222 8,271 1,915,215 432 0.235

50
Table 4.4 and Figure 4.2 show maternal mortality ratio for Tanzania, Tanzania Mainland and Tanzania
Zanzibar. The maternal mortality ratio for Tanzania Mainland was estimated as 434 deaths per 100,000
live births which is significantly higher than the estimate for Tanzania Zanzibar (307 deaths per
100,000 live births).
Figure 4. 3 Maternal Mortality Ratio, Tanzania, 2012 Census
Age specific maternal mortality ratio is presented in Figure 4.3. In general, maternal mortality ratio
increases with age; women with higher ages have higher maternal mortality ratios than those at lower
ages. The ratio for 20-24 age group was much lower than those of other age groups, then the ratio
increases slightly to 30-34 age group. The oldest age groups had higher mortality ratios. A similar
pattern was observed in Tanzania Mainland. With the exception of 15-19 age group, maternal mortality
ratio was lower in Tanzania Zanzibar than in Tanzania Mainland.
The maternal mortality ratio among teenagers (15-19 years) was higher in Tanzania (341 deaths per
100,000 live births) Tanzania Mainland (339 deaths per 100,000 live births) but lower in Tanzania
Zanzibar (424 deaths per 100,000 live births).

51
Figure 4. 4 Maternal Mortality Ratio by Age Group, Tanzania, 2012 Census
Note: Tanzania and Tanzania Mainland overlapping
Table 4. 2: Maternal Mortality Ratios by Age Group and Rural-Urban Areas, Tanzania, 2012
Census
Age Group
Tanzania Rural Urban
Adjusted Maternal
Deaths
Adjusted Births
Materna to Total
Deaths
Maternal Mortality
Ratio
Adjusted Maternal
Deaths
Adjusted Births
Maternal to Total
Deaths
Maternal Mortality
Ratio
Adjusted Maternal
Deaths
Adjusted Births
Maternal to Total Deaths
Maternal Mortality
Ratio
15-19 687 201,644 0.215 341 412 163,822 0.199 252 170 42,301 0.254 401
20-24 1,215 538,582 0.275 226 755 418,243 0.285 181 282 131,422 0.254 214
25-29 1,263 491,082 0.211 257 792 377,043 0.228 210 288 123,566 0.179 233
30-34 1,233 348,694 0.195 354 735 272,536 0.197 270 309 82,336 0.186 375
35-39 1,287 211,917 0.213 607 794 172,510 0.220 460 303 43,062 0.195 703
40-44 1,277 91,143 0.262 1,401 795 77,108 0.268 1031 295 15,586 0.245 1893
45-49 1,310 32,154 0.298 4,074 792 27,087 0.281 2924 319 5,517 0.332 5,788
Total 8,271 1,915,215 0.235 432 5,075 1,508,349 0.238 336 1,965 443,791 0.224 443
Note: MMR = Adjusted maternal deatsh divide by adjusted births and multiplied by 100,000

52
Table 4. 3: Maternal Mortality Ratios by Age Group, Tanzania, 2012 Census
Age Group
Tanzania Tanzania Mainland Tanzania Zanzibar
Adjusted Maternal
Deaths
Adjusted Births
Maternal to Total Deaths
Maternal Mortality
Ratio
Adjusted Maternal
Deaths
Adjusted Births
Maternal to Total Deaths
Maternal Mortality
Ratio
Adjusted Maternal
Deaths
Adjusted Births
Maternal to Total Deaths
Maternal Mortality
Ratio
15-19 687 201,644 0.215 341 673 198,651 0.214 339 13 3,061 0.265 424
20-24 1,215 538,582 0.275 226 1,196 525,880 0.276 227 18 12,825 0.254 140
25-29 1,263 491,082 0.211 257 1,233 476,319 0.209 259 30 14,773 0.332 203
30-34 1,233 348,694 0.195 354 1,203 337,109 0.194 357 29 11,554 0.240 251
35-39 1,287 211,917 0.213 607 1,258 203,467 0.212 618 29 8,390 0.270 346
40-44 1,277 91,143 0.262 1,401 1,245 87,997 0.260 1,415 31 3,140 0.373 987
45-49 1,310 32,154 0.298 4,074 1,291 31,209 0.301 4,137 18 945 0.185 1,905
Total 8,271 1,915,215 0.235 432 8,099 1,860,632 0.234 434 168 54,687 0.271 350
4.4. Regional Differentials in Maternal Mortality
Figure 4.4 shows estimated maternal mortality ratio by region. The results reveal that there were
marked differences in maternal mortality ratio across regions ranging from 860 deaths per 100,000 live
births in Rukwa region to 187 deaths per 100,000 live births in Simiyu region. Regions with MMR of
more than 500 deaths per 100,000 live births were; Rukwa (860), Njombe (788), Mbeya (776), Pwani
(687), Katavi (670), Tanga (593), Arusha (585), Mtwara (579) and Dodoma (512). Simiyu region
reported the lowest MMR of 187 deaths per 100,000 live births.

53
Figure 4. 5 Estimated Maternal Mortality Ratio by Region, Tanzania, 2012 Census

54
4.5 Lifetime Risk
Lifetime Risk (LTR) reflects the risk that a woman who would otherwise survive to age 49 will die of
maternal causes at some point during her reproductive lifespan, given current rates of maternal
mortality and fertility. The calculation of Lifetime Risk then, requires consideration of competing
risks, and thus level of overall mortality. The Lifetime Risk is calculated by:
LTR = MMRatio*35
Where MMR = Maternal Mortality Ratio
Note: average number of years lived between ages 14 and 50 – up to a maximum of 35 years – among
survivors to age 15).
Maternal Mortality rate is obtained by multiplying the adjusted maternal deaths by the length of the
reproductive lifetime (15-49). About 3 women per 1,000 of reproductive age in Tanzania have the risk
of dying from maternal causes. The lifetime risk was lower for Tanzania Zanzibar (about 2 women).
The maternal risk was higher in rural areas, where about 3 women per 1,000 of that age have the risk
of dying of maternal causes, as compared with about 2 women per 1,000 in urban areas.
4.6 Comparison of Maternal Mortality between 2012 Census and Tanzania
Demographic and Health Surveys (TDHSs)
Two sources of data were used in comparing maternal mortality ratio in Tanzania: The 2012 Population
and Housing Census, from which it was computed for the first time in the history of conducting
censuses in Tanzania; and Tanzania Demographic and Health Surveys (TDHSs) from 1996 to 2010.
The 1996 and 2004/05 TDHSs indicated that MMR was over 500 maternal deaths per 100,000 live
births. However, the 2010 TDHS and the 2012 Census suggest that MMR has declined by roughly 100
maternal deaths per 100,000 and is now as low as 432 per 100,000 live births.

55
Figure 4. 6 Trends in Maternal Mortality Ratio, Tanzania, 1996 TDHS,
2004/05 TDHS, 2010 TDHS and 2012 Census
4.7 Comparison of Maternal Mortality in Tanzania with Other “Sub-Saharan”
Countries
Figure 4.6 shows the maternal mortality ratio in Tanzania in 2012 also those of selected countries
mainly for the year 2010. The MMR in Tanzania was 442 deaths per 100,000 live births which was
higher than those of Kenya, Ghana and Botswana with 360, 350 and 160 deaths per 100,000 live births
respectively. Mozambique had higher MMR (490 deaths per 100,000 live births). Maternal mortality in
Sub-Saharan countries is much higher compared with China (37 deaths per 100,000 live births) and
developed countries such as Sweden (4 maternal deaths per 100,000 live births).

56
Figure 4. 7 Maternal Mortality Ratio by Selected Country
Source: WHO, UNICEF, UNFPA and the World Bank estimates; Trends in Maternal Mortality: 1990-2010 and 2012
Population and Housing Census

57
Chapter Five
Conclusion, Policy Implications and Recommendations
5.0 Progress towards International Goals - MDGs
Tanzania has shown successive improvement in reducing childhood mortality to targets set in the
Millennium Development Goals (International goals) as well as in MKUKUTA and MKUZA goals
(National goals). Target 5 under MGD-Goal 4 is to reduce child mortality by two thirds between 1990
and 2015. That means Tanzania seeks to reduce under-five mortality from 191 deaths per 1,000 live
births in 1990 to 64 deaths per 1,000 live births in 2015. For infant mortality the target is 48 deaths in
2015 a reduction from 115 deaths per 1,000 live births in 1990 (2010 Tanzania Country Report on
MDGs). Cluster II of 2005 National Strategy for Growth and Poverty Reduction (NSGPR) sought to
reduce infant and under-five mortality rates to 50 and 79 deaths per 1,000 live births in 2010 from 95
and 153 deaths per 1,000 live births in 2002 respectively. For maternal mortality (MDGs 5 – Improve
maternal health) the target is 133 maternal deaths by 2015.
Based on the previous census (2002) and TDHS (2004/05, 2009/10), infant mortality rates for
Tanzania has declined from 95 (2002 Census), 68 (TDHS 2004/05) and 51(TDHS 2009/10) to 46
deaths per 1,000 livebirths in 2012 Census. Furthermore, child and under-five mortality rates has fell to
21 and 67 from 47 in 2004/05 TDHS and 153 deaths per 1,000 live births in 2002 census, respectively.
The 2012 PHC estimates show progress towards reaching the MDGs by 2015.
5.1 Progress towards National Policies - MKUKUTA and MKUZA
The Ministry of Health and Social Welfare (Mainland) through its Health Sector Strategic Plan II
(HSSP II) seeks to reach 50 and 48 deaths per 1,000 live births in IMR and U5MR respectively by
2015. In line with that, Zanzibar’s target in 2010 Mpango wa Kupunguza Umaskini na Kukuza
Uchumi Zanzibar – (2010 MKUZA II) is to reach 48deaths per 1,000 live births for IMR and 50 deaths
per 1,000 live births in U5MR by 2015. Figures 5.1 and 5.2 show that infant mortality in both
Mainland and Zanzibar has surpassed the targets set on HSSP II as well as 2010 MKUZA II. Based on
these targets, under-five mortality is on track. However the 2012 targets for infant mortality rate have
been achieved (Figure 5.3).

58
Figure 5. 1: Trend in Infant Mortality Rates against 2015 MKUZA Target for Tanzania
Zanzibar, 2002 to 2012 Censuses and Surveys
Figure 5. 2: Trends in Under-Five Mortality Rates against 2015 MKUKUTA Target for
Tanzania and Tanzania Mainland, 2002 to 2012 Censuses and Surveys

59
Figure 5. 3: Trends in Infant Mortality Rates against 2012 MKUKUTA/MKUZA
Targets for Tanzania, Tanzania Mainland and Tanzania Zanzibar, 2002 to
2012 Censuses and Surveys
5.2 Maternal Mortality
The analysis shows that, maternal mortality in Tanzania was high (432 deaths per 100,000 live births),
and it was higher in urban areas (443 deaths per 100,000 live births) than in to rural areas (336 deaths
per 100,000 live births). It was also found that MMR for teenage (15-19 years) was high (341 deaths
per 100,000 live births). The MDG target by 2015 is to reach 133 maternal deaths per 100,000 live
births. The observed level of maternal mortality from 2012 PHC nonetheless falls short of Tanzania’s
national target. This fact invites additional efforts to save mother’s lives during pregnancy and
childbirth.
Maternal mortality is difficult to measure accurately, even in countries with complete vital registration.
Those countries which lacking the complete vital registration, no approach is guaranteed to give
accurate estimates, the data obtained needs careful evaluation. It is recommended that Tanzania
improve its vital registration system as one part of a larger effort aimed at improving the quality of
maternal care and reducing maternal mortality in the long run.

60
References
WHO/UNICEF/UNFPA/World Bank: Maternal mortality in 2005. Estimates developed by WHO,
UNICEF, UNFPA and The World Bank. Geneva, World Health Organization, 2007.
Rutenberg N. and J. Sullivan. 1991. Direct and indirect estimates of maternal mortality from the
sisterhood method. In Proceedings of the Demographic and Health Surveys World Conference,
Vol.3, 1669-1696. Columbia, Maryland: IRD/Macro International Inc.
Wilmoth J., 2009. The lifetime risk of maternal mortality: concept and measurement. Bulletin of the
WorldHealth Organization, 2009, 87:256-262.
WHO/UNICEF/UNFPA/World Bank: Maternal mortality in 2005. Estimates developed by WHO,
UNICEF, UNFPA and The World Bank. Geneva, World Health Organization, 2007.
Hill, Kenneth, Cynthia Stanton, and Neeru Gupta, 2001: Measuring Maternal Mortality from a
Census: Guidelines for Potential Users. MEASURE Evaluation Manual Series, No. 4. Carolina
Population Center, University of North Carolina at Chapel Hill.
Ansley J . Coale and Paul Demeny, 1966. Regional Model Tables and Stable Populations. Princeton,
New Jersey: Princeton University Press.
United Nations,1983. Manual X. Indirect Techniques for Demographic Estimation. Population Studies
No. 81. New York.

61
Appendices
Appendix 1: Life Tables
nMx = Age-specific central death rate.
nax = Average person-years lived by those who die between ages x and x+n
nqx = Probability of dying between exact ages x and x+n (age-specific mortality rate)
lx = Number of survivors at age x.
ndx = Number of deaths occurring between ages x and x+n.
nLx = Number of person-years lived between ages x and x+n.
5Px = Survival ratio for persons aged x to x+5 surviving 5 years to ages x+5 to x+10 = 5Lx+5/5Lx
(first 5Px = 5L0/5l0, second 5Px= 5L5/5L0, last 5Px = Tx+5/Tx).
Tx = Number of person-years lived after age x.
ex = Life expectancy at age x.

62
Tanzania
Abridged Life Table Based on Deaths and Population: Male
Age,
x
Width,
n nMx nax nqx lx ndx nLx 5Px Tx ex
0 1 0.05306 0.189 0.05087 100,000 5,087 95,873 0.94104 5,984,297 59.84
1 4 0.00582 1.706 0.02297 94,913 2,180 374,649 0.97874 5,888,424 62.04
5 5 0.00273 2.500 0.01356 92,733 1,257 460,520 0.98740 5,513,775 59.46
10 5 0.00234 2.500 0.01163 91,475 1,064 454,716 0.98646 5,053,255 55.24
15 5 0.00312 2.500 0.01548 90,411 1,399 448,558 0.98274 4,598,539 50.86
20 5 0.00385 2.500 0.01907 89,012 1,697 440,816 0.97723 4,149,981 46.62
25 5 0.00538 2.500 0.02654 87,315 2,318 430,779 0.96875 3,709,165 42.48
30 5 0.00735 2.500 0.03609 84,997 3,067 417,317 0.95698 3,278,386 38.57
35 5 0.01030 2.500 0.05021 81,930 4,113 399,365 0.94868 2,861,069 34.92
40 5 0.01078 2.500 0.05249 77,816 4,084 378,871 0.94745 2,461,704 31.63
45 5 0.01081 2.500 0.05263 73,732 3,880 358,959 0.94544 2,082,833 28.25
50 5 0.01165 2.500 0.05660 69,852 3,954 339,374 0.93698 1,723,874 24.68
55 5 0.01447 2.500 0.06982 65,898 4,601 317,987 0.91603 1,384,500 21.01
60 5 0.02087 2.500 0.09918 61,297 6,079 291,286 0.87865 1,066,513 17.40
65 5 0.03149 2.500 0.14596 55,218 8,060 255,939 0.82021 775,227 14.04
70 5 0.04929 2.500 0.21941 47,158 10,347 209,923 0.73205 519,288 11.01
75 5 0.07908 2.500 0.33013 36,811 12,153 153,674 0.50326 309,365 8.40
80 + 0.15838 6.314 1.00000 24,658 24,658 155,692 155,692 6.31
Abridged Life Table Based on Deaths and Population: Female
Age,
x
Width,
n nMx nax nqx lx ndx nLx 5Px Tx ex
0 1 0.04277 0.174 0.04131 100,000 4,131 96,587 0.95133 6,377,916 63.78
1 4 0.00497 1.666 0.01965 95,869 1,884 379,078 0.98250 6,281,329 65.52
5 5 0.00221 2.500 0.01099 93,985 1,033 467,343 0.98938 5,902,251 62.80
10 5 0.00206 2.500 0.01025 92,952 953 462,379 0.98946 5,434,908 58.47
15 5 0.00218 2.500 0.01084 92,000 997 457,505 0.98720 4,972,529 54.05
20 5 0.00298 2.500 0.01479 91,002 1,346 451,646 0.97996 4,515,024 49.61
25 5 0.00514 2.500 0.02537 89,656 2,275 442,594 0.97113 4,063,378 45.32
30 5 0.00660 2.500 0.03246 87,381 2,837 429,815 0.96221 3,620,784 41.44
35 5 0.00885 2.500 0.04329 84,545 3,660 413,573 0.95825 3,190,968 37.74
40 5 0.00819 2.500 0.04013 80,885 3,246 396,308 0.96145 2,777,396 34.34
45 5 0.00752 2.500 0.03691 77,639 2,865 381,030 0.96128 2,381,087 30.67
50 5 0.00829 2.500 0.04061 74,773 3,036 366,276 0.95520 2,000,057 26.75
55 5 0.01008 2.500 0.04916 71,737 3,527 349,868 0.93875 1,633,781 22.77
60 5 0.01536 2.500 0.07396 68,210 5,045 328,439 0.90482 1,283,913 18.82
65 5 0.02510 2.500 0.11809 63,165 7,459 297,179 0.84854 955,474 15.13
70 5 0.04182 2.500 0.18931 55,706 10,546 252,167 0.76329 658,294 11.82
75 5 0.06926 2.500 0.29519 45,161 13,331 192,476 0.52607 406,127 8.99
80 + 0.14898 6.712 1.00000 31,830 31,830 213,651 213,651 6.71

63
Tanzania Urban
Abridged Life Table Based on Deaths and Population: Male
Age,
x
Width,
n nMx nax nqx lx ndx nLx 5Px Tx ex
0 1 0.05629 0.197 0.05386 100,000 5,386 95,677 0.93699 5,774,636 57.75
1 4 0.00657 1.697 0.02589 94,614 2,449 372,816 0.97604 5,678,959 60.02
5 5 0.00311 2.500 0.01543 92,165 1,422 457,269 0.98540 5,306,143 57.57
10 5 0.00277 2.500 0.01375 90,743 1,248 450,594 0.98439 4,848,874 53.44
15 5 0.00353 2.500 0.01750 89,495 1,566 443,559 0.98090 4,398,280 49.15
20 5 0.00419 2.500 0.02073 87,929 1,823 435,087 0.97425 3,954,721 44.98
25 5 0.00627 2.500 0.03087 86,106 2,658 423,885 0.96297 3,519,634 40.88
30 5 0.00887 2.500 0.04339 83,448 3,621 408,189 0.94755 3,095,749 37.10
35 5 0.01278 2.500 0.06192 79,828 4,943 386,780 0.93731 2,687,560 33.67
40 5 0.01312 2.500 0.06352 74,884 4,756 362,531 0.93748 2,300,780 30.72
45 5 0.01268 2.500 0.06145 70,128 4,310 339,866 0.93841 1,938,249 27.64
50 5 0.01274 2.500 0.06173 65,819 4,063 318,935 0.93206 1,598,382 24.28
55 5 0.01549 2.500 0.07456 61,755 4,605 297,265 0.91166 1,279,448 20.72
60 5 0.02177 2.500 0.10323 57,151 5,900 271,004 0.87474 982,183 17.19
65 5 0.03239 2.500 0.14982 51,251 7,678 237,059 0.81613 711,179 13.88
70 5 0.05043 2.500 0.22392 43,573 9,757 193,471 0.72753 474,120 10.88
75 5 0.08049 2.500 0.33503 33,816 11,329 140,756 0.49846 280,649 8.30
80 + 0.16074 6.221 1.00000 22,486 22,486 139,893 139,893 6.22
Abridged Life Table Based on Deaths and Population: Female
Age,
x
Width,
n nMx nax nqx lx ndx nLx 5Px Tx ex
0 1 0.04449 0.179 0.04292 100,000 4,292 96,475 0.94886 6,168,198 61.68
1 4 0.00552 1.663 0.02180 95,708 2,086 377,956 0.98045 6,071,723 63.44
5 5 0.00254 2.500 0.01262 93,622 1,181 465,154 0.98743 5,693,767 60.82
10 5 0.00252 2.500 0.01252 92,440 1,157 459,306 0.98750 5,228,613 56.56
15 5 0.00251 2.500 0.01247 91,283 1,138 453,567 0.98520 4,769,307 52.25
20 5 0.00346 2.500 0.01715 90,144 1,546 446,855 0.97562 4,315,740 47.88
25 5 0.00645 2.500 0.03174 88,598 2,812 435,960 0.96359 3,868,885 43.67
30 5 0.00842 2.500 0.04123 85,786 3,537 420,087 0.95161 3,432,925 40.02
35 5 0.01149 2.500 0.05585 82,249 4,593 399,761 0.94731 3,012,837 36.63
40 5 0.01012 2.500 0.04935 77,656 3,832 378,697 0.95376 2,613,076 33.65
45 5 0.00878 2.500 0.04296 73,823 3,171 361,188 0.95662 2,234,379 30.27
50 5 0.00896 2.500 0.04382 70,652 3,096 345,520 0.95257 1,873,191 26.51
55 5 0.01051 2.500 0.05120 67,556 3,459 329,133 0.93686 1,527,670 22.61
60 5 0.01574 2.500 0.07572 64,097 4,853 308,351 0.90299 1,198,538 18.70
65 5 0.02554 2.500 0.12004 59,244 7,111 278,439 0.84639 890,186 15.03
70 5 0.04242 2.500 0.19176 52,132 9,997 235,668 0.76078 611,747 11.73
75 5 0.07002 2.500 0.29794 42,135 12,554 179,291 0.52326 376,079 8.93
80 + 0.15032 6.652 1.00000 29,581 29,581 196,788 196,788 6.65

64
Tanzania Rural
Abridged Life Table Based on Deaths and Population: Male
Age,
x
Width,
n nMx nax nqx lx ndx nLx 5Px Tx ex
0 1 0.05271 0.188 0.05055 100,000 5,055 95,895 0.94159 6,032,518 60.33
1 4 0.00568 1.707 0.02243 94,945 2,129 374,898 0.97923 5,936,623 62.53
5 5 0.00266 2.500 0.01321 92,816 1,226 461,014 0.98787 5,561,725 59.92
10 5 0.00222 2.500 0.01104 91,590 1,011 455,421 0.98702 5,100,711 55.69
15 5 0.00301 2.500 0.01494 90,579 1,353 449,511 0.98321 4,645,290 51.28
20 5 0.00377 2.500 0.01867 89,226 1,666 441,963 0.97798 4,195,779 47.02
25 5 0.00515 2.500 0.02542 87,559 2,226 432,232 0.97029 3,753,817 42.87
30 5 0.00694 2.500 0.03411 85,333 2,911 419,391 0.95955 3,321,585 38.92
35 5 0.00963 2.500 0.04702 82,423 3,875 402,426 0.95177 2,902,194 35.21
40 5 0.01015 2.500 0.04949 78,547 3,888 383,018 0.95011 2,499,768 31.82
45 5 0.01032 2.500 0.05030 74,660 3,756 363,910 0.94723 2,116,750 28.35
50 5 0.01139 2.500 0.05537 70,904 3,926 344,706 0.93813 1,752,840 24.72
55 5 0.01424 2.500 0.06875 66,978 4,605 323,378 0.91697 1,408,134 21.02
60 5 0.02069 2.500 0.09836 62,373 6,135 296,528 0.87936 1,084,755 17.39
65 5 0.03135 2.500 0.14536 56,238 8,175 260,754 0.82079 788,227 14.02
70 5 0.04914 2.500 0.21882 48,063 10,517 214,024 0.73265 527,474 10.97
75 5 0.07889 2.500 0.32947 37,546 12,370 156,805 0.49974 313,450 8.35
80 + 0.16072 6.222 1.00000 25,176 25,176 156,644 156,644 6.22
Abridged Life Table Based on Deaths and Population: Female
Age,
x
Width,
n nMx nax nqx lx ndx nLx 5Px Tx ex
0 1 0.04278 0.174 0.04132 100,000 4,132 96,587 0.95146 6,444,363 64.44
1 4 0.00489 1.666 0.01934 95,868 1,854 379,144 0.98287 6,347,776 66.21
5 5 0.00213 2.500 0.01059 94,014 996 467,580 0.98995 5,968,632 63.49
10 5 0.00191 2.500 0.00950 93,018 884 462,880 0.99013 5,501,052 59.14
15 5 0.00206 2.500 0.01025 92,134 944 458,309 0.98789 5,038,172 54.68
20 5 0.00282 2.500 0.01400 91,190 1,277 452,757 0.98152 4,579,862 50.22
25 5 0.00466 2.500 0.02303 89,913 2,071 444,388 0.97398 4,127,105 45.90
30 5 0.00590 2.500 0.02907 87,842 2,554 432,827 0.96633 3,682,717 41.92
35 5 0.00783 2.500 0.03840 85,289 3,275 418,255 0.96250 3,249,890 38.10
40 5 0.00745 2.500 0.03657 82,014 2,999 402,570 0.96438 2,831,634 34.53
45 5 0.00705 2.500 0.03464 79,014 2,737 388,230 0.96292 2,429,064 30.74
50 5 0.00808 2.500 0.03960 76,277 3,021 373,836 0.95588 2,040,835 26.76
55 5 0.01001 2.500 0.04883 73,257 3,577 357,342 0.93897 1,666,999 22.76
60 5 0.01534 2.500 0.07387 69,680 5,147 335,532 0.90487 1,309,657 18.80
65 5 0.02510 2.500 0.11809 64,533 7,621 303,612 0.84850 974,126 15.10
70 5 0.04184 2.500 0.18939 56,912 10,779 257,614 0.76320 670,513 11.78
75 5 0.06929 2.500 0.29530 46,134 13,623 196,610 0.52383 412,899 8.95
80 + 0.15031 6.653 1.00000 32,510 32,510 216,289 216,289 6.65

65
Tanzania Mainland
Abridged Life Table Based on Deaths and Population: Male
Age,
x
Width,
n nMx nax nqx lx ndx nLx 5Px Tx ex
0 1 0.05306 0.189 0.05087 100,000 5,087 95,873 0.94105 5,974,205 59.74
1 4 0.00582 1.706 0.02296 94,913 2,179 374,654 0.97873 5,878,331 61.93
5 5 0.00274 2.500 0.01361 92,734 1,262 460,517 0.98731 5,503,677 59.35
10 5 0.00237 2.500 0.01176 91,472 1,075 454,673 0.98634 5,043,161 55.13
15 5 0.00314 2.500 0.01559 90,397 1,410 448,461 0.98265 4,588,487 50.76
20 5 0.00386 2.500 0.01913 88,987 1,702 440,681 0.97707 4,140,026 46.52
25 5 0.00543 2.500 0.02680 87,285 2,339 430,578 0.96839 3,699,345 42.38
30 5 0.00745 2.500 0.03655 84,946 3,105 416,969 0.95636 3,268,767 38.48
35 5 0.01047 2.500 0.05101 81,841 4,175 398,770 0.94789 2,851,798 34.85
40 5 0.01094 2.500 0.05326 77,667 4,137 377,991 0.94673 2,453,028 31.58
45 5 0.01095 2.500 0.05327 73,530 3,917 357,857 0.94497 2,075,036 28.22
50 5 0.01171 2.500 0.05689 69,613 3,960 338,164 0.93674 1,717,179 24.67
55 5 0.01451 2.500 0.07001 65,653 4,596 316,772 0.91589 1,379,016 21.00
60 5 0.02089 2.500 0.09928 61,056 6,062 290,128 0.87859 1,062,243 17.40
65 5 0.03149 2.500 0.14597 54,995 8,028 254,905 0.82020 772,116 14.04
70 5 0.04929 2.500 0.21940 46,967 10,305 209,074 0.73205 517,211 11.01
75 5 0.07908 2.500 0.33014 36,662 12,104 153,052 0.50330 308,137 8.40
80 + 0.15836 6.315 1.00000 24,559 24,559 155,085 155,085 6.31
Abridged Life Table Based on Deaths and Population: Female
Age,
x
Width,
n nMx nax nqx lx ndx nLx 5Px Tx ex
0 1 0.04276 0.174 0.04130 100,000 4,130 96,588 0.95135 6,367,606 63.68
1 4 0.00496 1.666 0.01963 95,870 1,882 379,088 0.98249 6,271,018 65.41
5 5 0.00222 2.500 0.01103 93,988 1,037 467,349 0.98930 5,891,930 62.69
10 5 0.00208 2.500 0.01036 92,951 963 462,350 0.98936 5,424,581 58.36
15 5 0.00220 2.500 0.01093 91,988 1,005 457,429 0.98708 4,962,232 53.94
20 5 0.00301 2.500 0.01493 90,983 1,358 451,520 0.97970 4,504,803 49.51
25 5 0.00522 2.500 0.02576 89,625 2,308 442,353 0.97067 4,053,283 45.22
30 5 0.00671 2.500 0.03300 87,316 2,881 429,379 0.96153 3,610,929 41.35
35 5 0.00902 2.500 0.04413 84,435 3,726 412,860 0.95753 3,181,551 37.68
40 5 0.00832 2.500 0.04073 80,709 3,287 395,327 0.96094 2,768,690 34.30
45 5 0.00760 2.500 0.03731 77,422 2,889 379,886 0.96100 2,373,363 30.66
50 5 0.00832 2.500 0.04076 74,533 3,038 365,069 0.95511 1,993,477 26.75
55 5 0.01009 2.500 0.04920 71,495 3,517 348,680 0.93877 1,628,409 22.78
60 5 0.01534 2.500 0.07389 67,977 5,023 327,331 0.90487 1,279,728 18.83
65 5 0.02509 2.500 0.11806 62,955 7,433 296,193 0.84858 952,398 15.13
70 5 0.04180 2.500 0.18923 55,522 10,507 251,345 0.76333 656,205 11.82
75 5 0.06926 2.500 0.29518 45,016 13,288 191,858 0.52611 404,860 8.99
80 + 0.14895 6.713 1.00000 31,728 31,728 213,002 213,002 6.71

66
Tanzania Mainland Urban
Abridged Life Table Based on Deaths and Population: Male
Age,
x
Width,
n nMx nax nqx lx ndx nLx 5Px Tx ex
0 1 0.05542 0.195 0.05305 100,000 5,305 95,730 0.93785 5,802,417 58.02
1 4 0.00650 1.699 0.02563 94,695 2,427 373,195 0.97630 5,706,687 60.26
5 5 0.00308 2.500 0.01529 92,268 1,411 457,810 0.98543 5,333,493 57.80
10 5 0.00279 2.500 0.01383 90,857 1,257 451,141 0.98443 4,875,682 53.66
15 5 0.00350 2.500 0.01733 89,600 1,553 444,116 0.98113 4,424,541 49.38
20 5 0.00413 2.500 0.02044 88,047 1,800 435,734 0.97481 3,980,425 45.21
25 5 0.00610 2.500 0.03003 86,247 2,590 424,759 0.96399 3,544,691 41.10
30 5 0.00862 2.500 0.04218 83,657 3,528 409,463 0.94891 3,119,932 37.29
35 5 0.01245 2.500 0.06039 80,129 4,839 388,545 0.93862 2,710,469 33.83
40 5 0.01289 2.500 0.06243 75,290 4,700 364,698 0.93833 2,321,924 30.84
45 5 0.01255 2.500 0.06085 70,589 4,296 342,208 0.93894 1,957,226 27.73
50 5 0.01264 2.500 0.06127 66,294 4,062 321,314 0.93260 1,615,018 24.36
55 5 0.01535 2.500 0.07392 62,232 4,600 299,658 0.91224 1,293,704 20.79
60 5 0.02165 2.500 0.10270 57,632 5,919 273,361 0.87529 994,046 17.25
65 5 0.03226 2.500 0.14925 51,713 7,718 239,270 0.81675 720,684 13.94
70 5 0.05025 2.500 0.22322 43,995 9,820 195,423 0.72814 481,414 10.94
75 5 0.08033 2.500 0.33449 34,174 11,431 142,295 0.50245 285,991 8.37
80 + 0.15828 6.318 1.00000 22,743 22,743 143,696 143,696 6.32
Abridged Life Table Based on Deaths and Population: Female
Age,
x
Width,
n nMx nax nqx lx ndx nLx 5Px Tx ex
0 1 0.04382 0.177 0.04230 100,000 4,230 96,519 0.94959 6,184,360 61.84
1 4 0.00544 1.664 0.02147 95,770 2,056 378,279 0.98068 6,087,841 63.57
5 5 0.00253 2.500 0.01258 93,714 1,179 465,624 0.98740 5,709,562 60.93
10 5 0.00254 2.500 0.01261 92,535 1,167 459,759 0.98753 5,243,938 56.67
15 5 0.00248 2.500 0.01232 91,368 1,126 454,027 0.98543 4,784,179 52.36
20 5 0.00340 2.500 0.01685 90,243 1,520 447,412 0.97610 4,330,151 47.98
25 5 0.00631 2.500 0.03107 88,722 2,756 436,720 0.96423 3,882,739 43.76
30 5 0.00829 2.500 0.04062 85,966 3,492 421,100 0.95199 3,446,019 40.09
35 5 0.01146 2.500 0.05571 82,474 4,594 400,884 0.94725 3,024,920 36.68
40 5 0.01017 2.500 0.04961 77,880 3,864 379,739 0.95357 2,624,036 33.69
45 5 0.00881 2.500 0.04308 74,016 3,189 362,108 0.95658 2,244,297 30.32
50 5 0.00895 2.500 0.04379 70,827 3,101 346,384 0.95277 1,882,189 26.57
55 5 0.01043 2.500 0.05084 67,726 3,443 330,023 0.93728 1,535,805 22.68
60 5 0.01563 2.500 0.07523 64,283 4,836 309,326 0.90351 1,205,782 18.76
65 5 0.02541 2.500 0.11947 59,447 7,102 279,479 0.84712 896,456 15.08
70 5 0.04219 2.500 0.19083 52,345 9,989 236,751 0.76160 616,977 11.79
75 5 0.06981 2.500 0.29718 42,356 12,587 180,310 0.52578 380,226 8.98
80 + 0.14890 6.716 1.00000 29,768 29,768 199,915 199,915 6.72

67
Tanzania Mainland Rural
Abridged Life Table Based on Deaths and Population: Male
Age,
x
Width,
n nMx nax nqx lx ndx nLx 5Px Tx ex
0 1 0.05178 0.185 0.04968 100,000 4,968 95,953 0.94256 6,061,722 60.62
1 4 0.00559 1.709 0.02206 95,032 2,096 375,326 0.97956 5,965,769 62.78
5 5 0.00263 2.500 0.01304 92,936 1,212 461,648 0.98794 5,590,443 60.15
10 5 0.00222 2.500 0.01106 91,723 1,015 456,080 0.98708 5,128,795 55.92
15 5 0.00298 2.500 0.01480 90,709 1,342 450,188 0.98345 4,672,715 51.51
20 5 0.00370 2.500 0.01832 89,366 1,637 442,739 0.97850 4,222,527 47.25
25 5 0.00501 2.500 0.02473 87,729 2,170 433,221 0.97113 3,779,789 43.08
30 5 0.00673 2.500 0.03310 85,559 2,832 420,716 0.96067 3,346,568 39.11
35 5 0.00937 2.500 0.04576 82,727 3,786 404,170 0.95285 2,925,852 35.37
40 5 0.00996 2.500 0.04859 78,941 3,836 385,115 0.95086 2,521,682 31.94
45 5 0.01020 2.500 0.04972 75,105 3,734 366,189 0.94775 2,136,567 28.45
50 5 0.01129 2.500 0.05491 71,371 3,919 347,055 0.93869 1,770,378 24.81
55 5 0.01409 2.500 0.06807 67,451 4,591 325,779 0.91761 1,423,323 21.10
60 5 0.02056 2.500 0.09776 62,860 6,145 298,936 0.88001 1,097,544 17.46
65 5 0.03118 2.500 0.14463 56,715 8,203 263,066 0.82156 798,608 14.08
70 5 0.04893 2.500 0.21797 48,512 10,574 216,123 0.73341 535,542 11.04
75 5 0.07869 2.500 0.32876 37,938 12,472 158,507 0.50376 319,419 8.42
80 + 0.15826 6.319 1.00000 25,465 25,465 160,912 160,912 6.32
Abridged Life Table Based on Deaths and Population: Female
Age,
x
Width,
n nMx nax nqx lx ndx nLx 5Px Tx ex
0 1 0.04213 0.172 0.04071 100,000 4,071 96,630 0.95216 6,460,100 64.60
1 4 0.00482 1.667 0.01906 95,929 1,828 379,451 0.98309 6,363,470 66.34
5 5 0.00211 2.500 0.01052 94,101 990 468,030 0.98997 5,984,020 63.59
10 5 0.00192 2.500 0.00954 93,111 888 463,336 0.99017 5,515,989 59.24
15 5 0.00203 2.500 0.01012 92,223 933 458,782 0.98809 5,052,653 54.79
20 5 0.00276 2.500 0.01371 91,290 1,252 453,319 0.98192 4,593,871 50.32
25 5 0.00455 2.500 0.02251 90,038 2,027 445,122 0.97444 4,140,553 45.99
30 5 0.00582 2.500 0.02868 88,011 2,524 433,744 0.96657 3,695,430 41.99
35 5 0.00781 2.500 0.03832 85,487 3,276 419,244 0.96244 3,261,686 38.15
40 5 0.00749 2.500 0.03677 82,211 3,023 403,497 0.96422 2,842,442 34.57
45 5 0.00707 2.500 0.03475 79,188 2,752 389,059 0.96288 2,438,945 30.80
50 5 0.00807 2.500 0.03958 76,436 3,025 374,618 0.95606 2,049,886 26.82
55 5 0.00994 2.500 0.04848 73,411 3,559 358,159 0.93940 1,675,268 22.82
60 5 0.01523 2.500 0.07335 69,852 5,124 336,453 0.90542 1,317,109 18.86
65 5 0.02497 2.500 0.11750 64,729 7,605 304,631 0.84923 980,657 15.15
70 5 0.04161 2.500 0.18847 57,123 10,766 258,703 0.76405 676,026 11.83
75 5 0.06906 2.500 0.29447 46,358 13,651 197,661 0.52636 417,323 9.00
80 + 0.14889 6.716 1.00000 32,707 32,707 219,663 219,663 6.72

68
Tanzania Zanzibar
Abridged Life Table Based on Deaths and Population: Male
Age,
x
Width,
n nMx nax nqx lx ndx nLx 5Px Tx ex
0 1 0.05317 0.189 0.05097 100,000 5,097 95,866 0.94069 6,333,725 63.34
1 4 0.00597 1.705 0.02356 94,903 2,236 374,481 0.97928 6,237,858 65.73
5 5 0.00237 2.500 0.01179 92,667 1,092 460,604 0.99033 5,863,378 63.27
10 5 0.00151 2.500 0.00753 91,575 689 456,150 0.99033 5,402,774 59.00
15 5 0.00238 2.500 0.01184 90,885 1,076 451,737 0.98555 4,946,624 54.43
20 5 0.00345 2.500 0.01710 89,810 1,536 445,209 0.98262 4,494,887 50.05
25 5 0.00356 2.500 0.01766 88,274 1,559 437,473 0.98151 4,049,678 45.88
30 5 0.00390 2.500 0.01933 86,715 1,676 429,385 0.97939 3,612,205 41.66
35 5 0.00443 2.500 0.02190 85,039 1,863 420,537 0.97552 3,182,820 37.43
40 5 0.00550 2.500 0.02712 83,176 2,255 410,242 0.96947 2,762,282 33.21
45 5 0.00692 2.500 0.03403 80,921 2,754 397,718 0.95884 2,352,041 29.07
50 5 0.00995 2.500 0.04853 78,167 3,794 381,349 0.94400 1,954,322 25.00
55 5 0.01319 2.500 0.06385 74,373 4,749 359,994 0.92056 1,572,973 21.15
60 5 0.02019 2.500 0.09610 69,624 6,691 331,395 0.88050 1,212,979 17.42
65 5 0.03136 2.500 0.14539 62,934 9,150 291,794 0.82019 881,584 14.01
70 5 0.04946 2.500 0.22009 53,784 11,837 239,327 0.73060 589,790 10.97
75 5 0.07980 2.500 0.33263 41,947 13,953 174,851 0.50108 350,463 8.35
80 + 0.15941 6.273 1.00000 27,994 27,994 175,611 175,611 6.27
Abridged Life Table Based on Deaths and Population: Female
Age,
x
Width,
n nMx nax nqx lx ndx nLx 5Px Tx ex
0 1 0.04310 0.175 0.04162 100,000 4,162 96,566 0.95069 6,714,408 67.14
1 4 0.00517 1.665 0.02045 95,838 1,960 378,778 0.98283 6,617,842 69.05
5 5 0.00189 2.500 0.00941 93,879 884 467,183 0.99210 6,239,064 66.46
10 5 0.00128 2.500 0.00638 92,995 593 463,491 0.99269 5,771,881 62.07
15 5 0.00166 2.500 0.00825 92,402 762 460,103 0.99051 5,308,390 57.45
20 5 0.00216 2.500 0.01073 91,640 984 455,739 0.98836 4,848,286 52.91
25 5 0.00253 2.500 0.01255 90,656 1,138 450,436 0.98662 4,392,547 48.45
30 5 0.00286 2.500 0.01422 89,518 1,273 444,409 0.98458 3,942,112 44.04
35 5 0.00335 2.500 0.01663 88,245 1,467 437,558 0.98092 3,497,703 39.64
40 5 0.00436 2.500 0.02158 86,778 1,873 429,208 0.97639 3,060,145 35.26
45 5 0.00521 2.500 0.02570 84,905 2,182 419,072 0.96903 2,630,937 30.99
50 5 0.00741 2.500 0.03638 82,724 3,010 406,094 0.95769 2,211,865 26.74
55 5 0.00993 2.500 0.04846 79,714 3,863 388,911 0.93854 1,805,771 22.65
60 5 0.01561 2.500 0.07511 75,851 5,697 365,009 0.90300 1,416,860 18.68
65 5 0.02568 2.500 0.12066 70,153 8,464 329,604 0.84558 1,051,851 14.99
70 5 0.04268 2.500 0.19281 61,689 11,894 278,708 0.75953 722,247 11.71
75 5 0.07046 2.500 0.29952 49,795 14,915 211,687 0.52273 443,538 8.91
80 + 0.15044 6.647 1.00000 34,880 34,880 231,852 231,852 6.65

69
Tanzania Zanzibar Urban
Abridged Life Table Based on Deaths and Population: Male
Age,
x
Width,
n nMx nax nqx lx ndx nLx 5Px Tx ex
0 1 0.05807 0.202 0.05550 100,000 5,550 95,572 0.93484 6,232,424 62.32
1 4 0.00694 1.692 0.02731 94,450 2,579 371,847 0.97625 6,136,852 64.97
5 5 0.00266 2.500 0.01323 91,871 1,215 456,317 0.98937 5,765,005 62.75
10 5 0.00160 2.500 0.00799 90,656 725 451,468 0.98978 5,308,689 58.56
15 5 0.00251 2.500 0.01247 89,931 1,121 446,854 0.98484 4,857,221 54.01
20 5 0.00361 2.500 0.01790 88,810 1,589 440,078 0.98175 4,410,367 49.66
25 5 0.00376 2.500 0.01862 87,221 1,624 432,044 0.98075 3,970,290 45.52
30 5 0.00402 2.500 0.01990 85,597 1,703 423,726 0.97885 3,538,246 41.34
35 5 0.00453 2.500 0.02242 83,893 1,881 414,765 0.97518 3,114,520 37.12
40 5 0.00553 2.500 0.02728 82,013 2,237 404,470 0.96919 2,699,755 32.92
45 5 0.00701 2.500 0.03443 79,775 2,747 392,009 0.95804 2,295,285 28.77
50 5 0.01020 2.500 0.04975 77,028 3,832 375,562 0.94230 1,903,276 24.71
55 5 0.01366 2.500 0.06606 73,196 4,836 353,893 0.91794 1,527,714 20.87
60 5 0.02087 2.500 0.09919 68,361 6,780 324,853 0.87668 1,173,821 17.17
65 5 0.03246 2.500 0.15010 61,580 9,243 284,793 0.81461 848,968 13.79
70 5 0.05119 2.500 0.22692 52,337 11,876 231,994 0.72312 564,175 10.78
75 5 0.08237 2.500 0.34151 40,461 13,818 167,760 0.49498 332,181 8.21
80 + 0.16204 6.171 1.00000 26,643 26,643 164,421 164,421 6.17
Abridged Life Table Based on Deaths and Population: Female
Age,
x
Width,
n nMx nax nqx lx ndx nLx 5Px Tx ex
0 1 0.04177 0.171 0.04037 100,000 4,037 96,654 0.95228 6,774,871 67.75
1 4 0.00493 1.667 0.01949 95,963 1,870 379,488 0.98375 6,678,217 69.59
5 5 0.00176 2.500 0.00875 94,093 823 468,404 0.99269 6,298,729 66.94
10 5 0.00117 2.500 0.00585 93,269 545 464,982 0.99322 5,830,325 62.51
15 5 0.00155 2.500 0.00773 92,724 716 461,827 0.99098 5,365,343 57.86
20 5 0.00208 2.500 0.01033 92,007 951 457,660 0.98888 4,903,516 53.29
25 5 0.00240 2.500 0.01192 91,057 1,085 452,570 0.98735 4,445,856 48.83
30 5 0.00269 2.500 0.01338 89,971 1,204 446,846 0.98557 3,993,286 44.38
35 5 0.00312 2.500 0.01549 88,767 1,375 440,398 0.98209 3,546,440 39.95
40 5 0.00411 2.500 0.02036 87,392 1,779 432,511 0.97762 3,106,042 35.54
45 5 0.00495 2.500 0.02445 85,612 2,093 422,830 0.97017 2,673,531 31.23
50 5 0.00720 2.500 0.03535 83,519 2,952 410,216 0.95902 2,250,702 26.95
55 5 0.00959 2.500 0.04682 80,567 3,772 393,406 0.94021 1,840,485 22.84
60 5 0.01524 2.500 0.07339 76,795 5,636 369,886 0.90530 1,447,079 18.84
65 5 0.02501 2.500 0.11770 71,159 8,375 334,857 0.84896 1,077,194 15.14
70 5 0.04170 2.500 0.18883 62,784 11,855 284,280 0.76402 742,337 11.82
75 5 0.06897 2.500 0.29412 50,928 14,979 217,195 0.52583 458,056 8.99
80 + 0.14925 6.700 1.00000 35,949 35,949 240,862 240,862 6.70

70
Tanzania Zanzibar Rural
Abridged Life Table Based on Deaths and Population: Male
Age,
x
Width,
n nMx nax nqx lx ndx nLx 5Px Tx ex
0 1 0.05156 0.185 0.04948 100,000 4,948 95,966 0.94278 6,404,269 64.04
1 4 0.00557 1.710 0.02198 95,052 2,090 375,422 0.98058 6,308,303 66.37
5 5 0.00223 2.500 0.01108 92,962 1,030 462,236 0.99099 5,932,880 63.82
10 5 0.00139 2.500 0.00692 91,932 636 458,071 0.99090 5,470,644 59.51
15 5 0.00227 2.500 0.01129 91,296 1,031 453,905 0.98622 5,012,573 54.90
20 5 0.00329 2.500 0.01629 90,266 1,471 447,652 0.98346 4,558,669 50.50
25 5 0.00339 2.500 0.01679 88,795 1,491 440,247 0.98249 4,111,017 46.30
30 5 0.00368 2.500 0.01823 87,304 1,592 432,539 0.98073 3,670,770 42.05
35 5 0.00411 2.500 0.02032 85,712 1,742 424,205 0.97741 3,238,231 37.78
40 5 0.00504 2.500 0.02491 83,970 2,091 414,621 0.97164 2,814,026 33.51
45 5 0.00648 2.500 0.03190 81,879 2,612 402,863 0.96083 2,399,404 29.30
50 5 0.00956 2.500 0.04669 79,267 3,701 387,082 0.94578 1,996,541 25.19
55 5 0.01282 2.500 0.06211 75,566 4,694 366,095 0.92239 1,609,460 21.30
60 5 0.01976 2.500 0.09414 70,872 6,672 337,682 0.88251 1,243,364 17.54
65 5 0.03087 2.500 0.14327 64,201 9,198 298,007 0.82273 905,682 14.11
70 5 0.04867 2.500 0.21696 55,002 11,933 245,179 0.73413 607,674 11.05
75 5 0.07856 2.500 0.32833 43,069 14,141 179,994 0.50346 362,496 8.42
80 + 0.15851 6.309 1.00000 28,928 28,928 182,502 182,502 6.31
Abridged Life Table Based on Deaths and Population: Female
Age,
x
Width,
n nMx nax nqx lx ndx nLx 5Px Tx ex
0 1 0.04148 0.170 0.04010 100,000 4,010 96,673 0.95290 6,792,989 67.93
1 4 0.00472 1.668 0.01868 95,990 1,793 379,777 0.98429 6,696,316 69.76
5 5 0.00172 2.500 0.00858 94,197 808 468,963 0.99284 6,316,539 67.06
10 5 0.00115 2.500 0.00573 93,389 535 465,606 0.99332 5,847,576 62.62
15 5 0.00153 2.500 0.00763 92,854 709 462,497 0.99113 5,381,970 57.96
20 5 0.00203 2.500 0.01011 92,145 931 458,396 0.98907 4,919,473 53.39
25 5 0.00237 2.500 0.01176 91,213 1,073 453,385 0.98755 4,461,077 48.91
30 5 0.00265 2.500 0.01314 90,141 1,185 447,742 0.98580 4,007,692 44.46
35 5 0.00308 2.500 0.01526 88,956 1,358 441,386 0.98246 3,559,950 40.02
40 5 0.00401 2.500 0.01985 87,598 1,739 433,644 0.97804 3,118,565 35.60
45 5 0.00488 2.500 0.02412 85,859 2,071 424,120 0.97065 2,684,920 31.27
50 5 0.00707 2.500 0.03472 83,789 2,909 411,671 0.95930 2,260,800 26.98
55 5 0.00961 2.500 0.04691 80,880 3,794 394,915 0.94038 1,849,130 22.86
60 5 0.01515 2.500 0.07297 77,086 5,625 371,368 0.90542 1,454,215 18.86
65 5 0.02506 2.500 0.11789 71,461 8,425 336,244 0.84895 1,082,847 15.15
70 5 0.04166 2.500 0.18863 63,036 11,891 285,456 0.76460 746,603 11.84
75 5 0.06867 2.500 0.29304 51,146 14,988 218,259 0.52670 461,147 9.02
80 + 0.14887 6.717 1.00000 36,158 36,158 242,888 242,888 6.72

71
Dodoma
Abridged Life Table Based on Deaths and Population: Male
Age,
x
Width,
n nMx nax nqx lx ndx nLx 5Px Tx ex
0 1 0.04945 0.179 0.04752 100,000 4,752 96,099 0.94599 6,077,052 60.77
1 4 0.00476 1.716 0.01882 95,248 1,793 376,895 0.98182 5,980,953 62.79
5 5 0.00248 2.500 0.01232 93,455 1,151 464,395 0.98829 5,604,058 59.97
10 5 0.00223 2.500 0.01109 92,303 1,023 458,958 0.98703 5,139,663 55.68
15 5 0.00300 2.500 0.01487 91,280 1,358 453,005 0.98359 4,680,705 51.28
20 5 0.00363 2.500 0.01796 89,922 1,615 445,573 0.97843 4,227,700 47.02
25 5 0.00511 2.500 0.02524 88,307 2,229 435,963 0.96999 3,782,127 42.83
30 5 0.00711 2.500 0.03492 86,078 3,006 422,877 0.95800 3,346,164 38.87
35 5 0.01012 2.500 0.04934 83,073 4,099 405,116 0.94932 2,923,287 35.19
40 5 0.01069 2.500 0.05208 78,974 4,113 384,586 0.94794 2,518,171 31.89
45 5 0.01068 2.500 0.05203 74,861 3,895 364,566 0.94645 2,133,585 28.50
50 5 0.01134 2.500 0.05516 70,966 3,914 345,042 0.93877 1,769,019 24.93
55 5 0.01401 2.500 0.06766 67,051 4,537 323,915 0.91850 1,423,977 21.24
60 5 0.02024 2.500 0.09634 62,515 6,023 297,516 0.88189 1,100,062 17.60
65 5 0.03062 2.500 0.14220 56,492 8,033 262,376 0.82447 802,547 14.21
70 5 0.04803 2.500 0.21439 48,459 10,389 216,322 0.73727 540,170 11.15
75 5 0.07740 2.500 0.32426 38,070 12,344 159,488 0.50752 323,849 8.51
80 + 0.15652 6.389 1.00000 25,725 25,725 164,361 164,361 6.39
Abridged Life Table Based on Deaths and Population: Female
Age,
x
Width,
n nMx nax nqx lx ndx nLx 5Px Tx ex
0 1 0.03761 0.159 0.03645 100,000 3,645 96,936 0.95871 6,786,573 67.87
1 4 0.00337 1.674 0.01339 96,355 1,290 382,417 0.98781 6,689,637 69.43
5 5 0.00153 2.500 0.00762 95,064 724 473,511 0.99295 6,307,220 66.35
10 5 0.00130 2.500 0.00649 94,340 612 470,171 0.99284 5,833,709 61.84
15 5 0.00157 2.500 0.00783 93,728 734 466,806 0.99077 5,363,538 57.22
20 5 0.00214 2.500 0.01063 92,994 989 462,499 0.98705 4,896,733 52.66
25 5 0.00308 2.500 0.01529 92,005 1,407 456,510 0.98305 4,434,234 48.20
30 5 0.00376 2.500 0.01862 90,598 1,687 448,774 0.97878 3,977,724 43.91
35 5 0.00483 2.500 0.02386 88,911 2,121 439,251 0.97520 3,528,951 39.69
40 5 0.00522 2.500 0.02576 86,790 2,235 428,359 0.97353 3,089,699 35.60
45 5 0.00552 2.500 0.02721 84,554 2,300 417,020 0.96903 2,661,340 31.47
50 5 0.00709 2.500 0.03484 82,254 2,866 404,104 0.96034 2,244,320 27.29
55 5 0.00913 2.500 0.04465 79,388 3,544 388,078 0.94334 1,840,216 23.18
60 5 0.01434 2.500 0.06923 75,843 5,250 366,091 0.90989 1,452,138 19.15
65 5 0.02385 2.500 0.11256 70,593 7,946 333,101 0.85475 1,086,046 15.38
70 5 0.04007 2.500 0.18209 62,647 11,407 284,719 0.77061 752,945 12.02
75 5 0.06708 2.500 0.28722 51,240 14,717 219,408 0.53141 468,227 9.14
80 + 0.14679 6.813 1.00000 36,523 36,523 248,818 248,818 6.81

72
Arusha
Abridged Life Table Based on Deaths and Population: Male
Age,
x
Width,
n nMx nax nqx lx ndx nLx 5Px Tx ex
0 1 0.03300 0.135 0.03208 100,000 3,208 97,224 0.96467 6,875,587 68.76
1 4 0.00238 1.762 0.00948 96,792 918 385,113 0.99103 6,778,363 70.03
5 5 0.00114 2.500 0.00566 95,874 543 478,013 0.99508 6,393,250 66.68
10 5 0.00084 2.500 0.00418 95,331 399 475,659 0.99377 5,915,237 62.05
15 5 0.00167 2.500 0.00829 94,932 787 472,694 0.98985 5,439,578 57.30
20 5 0.00242 2.500 0.01203 94,145 1,132 467,895 0.98786 4,966,884 52.76
25 5 0.00247 2.500 0.01226 93,013 1,140 462,214 0.98716 4,498,989 48.37
30 5 0.00271 2.500 0.01344 91,873 1,235 456,278 0.98573 4,036,774 43.94
35 5 0.00305 2.500 0.01511 90,638 1,370 449,767 0.98296 3,580,497 39.50
40 5 0.00384 2.500 0.01900 89,268 1,696 442,101 0.97793 3,130,730 35.07
45 5 0.00511 2.500 0.02520 87,572 2,207 432,342 0.96814 2,688,628 30.70
50 5 0.00789 2.500 0.03869 85,365 3,303 418,568 0.95488 2,256,286 26.43
55 5 0.01064 2.500 0.05181 82,062 4,252 399,682 0.93384 1,837,718 22.39
60 5 0.01695 2.500 0.08129 77,811 6,325 373,240 0.89707 1,438,036 18.48
65 5 0.02701 2.500 0.12649 71,485 9,042 334,821 0.84156 1,064,795 14.90
70 5 0.04322 2.500 0.19501 62,443 12,177 281,773 0.75723 729,974 11.69
75 5 0.07117 2.500 0.30210 50,266 15,185 213,367 0.52395 448,202 8.92
80 + 0.14939 6.694 1.00000 35,081 35,081 234,834 234,834 6.69
Abridged Life Table Based on Deaths and Population: Female
Age,
x
Width,
n nMx nax nqx lx ndx nLx 5Px Tx ex
0 1 0.02635 0.127 0.02575 100,000 2,575 97,752 0.97142 7,226,592 72.27
1 4 0.00194 1.691 0.00774 97,425 754 387,957 0.99332 7,128,840 73.17
5 5 0.00073 2.500 0.00367 96,670 354 482,467 0.99658 6,740,883 69.73
10 5 0.00064 2.500 0.00317 96,316 306 480,817 0.99596 6,258,416 64.98
15 5 0.00098 2.500 0.00491 96,011 471 478,875 0.99408 5,777,599 60.18
20 5 0.00139 2.500 0.00693 95,539 662 476,041 0.99248 5,298,725 55.46
25 5 0.00163 2.500 0.00810 94,877 769 472,462 0.99148 4,822,684 50.83
30 5 0.00180 2.500 0.00895 94,108 842 468,435 0.99027 4,350,222 46.23
35 5 0.00211 2.500 0.01052 93,266 981 463,877 0.98723 3,881,787 41.62
40 5 0.00303 2.500 0.01505 92,285 1,389 457,952 0.98300 3,417,910 37.04
45 5 0.00383 2.500 0.01898 90,896 1,725 450,167 0.97627 2,959,958 32.56
50 5 0.00580 2.500 0.02857 89,171 2,548 439,485 0.96655 2,509,791 28.15
55 5 0.00785 2.500 0.03848 86,623 3,333 424,782 0.95019 2,070,306 23.90
60 5 0.01271 2.500 0.06158 83,290 5,129 403,626 0.91871 1,645,524 19.76
65 5 0.02156 2.500 0.10230 78,161 7,996 370,813 0.86624 1,241,898 15.89
70 5 0.03687 2.500 0.16881 70,165 11,845 321,212 0.78456 871,085 12.41
75 5 0.06284 2.500 0.27154 58,320 15,836 252,011 0.54169 549,872 9.43
80 + 0.14263 7.011 1.00000 42,484 42,484 297,861 297,861 7.01

73
Kilimanjaro
Abridged Life Table Based on Deaths and Population: Male
Age,
x
Width,
n nMx nax nqx lx ndx nLx 5Px Tx ex
0 1 0.03266 0.134 0.03177 100,000 3,177 97,249 0.96504 6,625,935 66.26
1 4 0.00234 1.763 0.00933 96,823 903 385,274 0.99059 6,528,686 67.43
5 5 0.00135 2.500 0.00675 95,920 647 477,983 0.99324 6,143,412 64.05
10 5 0.00136 2.500 0.00678 95,273 646 474,751 0.99135 5,665,429 59.47
15 5 0.00212 2.500 0.01054 94,627 997 470,642 0.98808 5,190,678 54.85
20 5 0.00268 2.500 0.01331 93,630 1,246 465,034 0.98459 4,720,036 50.41
25 5 0.00354 2.500 0.01755 92,384 1,621 457,867 0.97943 4,255,002 46.06
30 5 0.00479 2.500 0.02364 90,763 2,146 448,449 0.97192 3,797,135 41.84
35 5 0.00663 2.500 0.03262 88,617 2,891 435,857 0.96608 3,348,686 37.79
40 5 0.00718 2.500 0.03526 85,726 3,022 421,073 0.96369 2,912,829 33.98
45 5 0.00762 2.500 0.03740 82,703 3,093 405,785 0.95930 2,491,756 30.13
50 5 0.00902 2.500 0.04413 79,611 3,513 389,271 0.95014 2,085,971 26.20
55 5 0.01149 2.500 0.05586 76,098 4,250 369,862 0.93079 1,696,700 22.30
60 5 0.01740 2.500 0.08336 71,847 5,989 344,262 0.89582 1,326,839 18.47
65 5 0.02710 2.500 0.12689 65,858 8,356 308,397 0.84168 982,577 14.92
70 5 0.04305 2.500 0.19432 57,501 11,174 259,572 0.75830 674,179 11.72
75 5 0.07073 2.500 0.30051 46,328 13,922 196,834 0.52525 414,607 8.95
80 + 0.14881 6.720 1.00000 32,406 32,406 217,773 217,773 6.72
Abridged Life Table Based on Deaths and Population: Female
Age,
x
Width,
n nMx nax nqx lx ndx nLx 5Px Tx ex
0 1 0.02801 0.132 0.02735 100,000 2,735 97,626 0.96933 6,839,601 68.40
1 4 0.00226 1.689 0.00899 97,265 875 387,039 0.99149 6,741,975 69.32
5 5 0.00118 2.500 0.00587 96,391 566 480,539 0.99359 6,354,936 65.93
10 5 0.00139 2.500 0.00695 95,825 666 477,461 0.99276 5,874,397 61.30
15 5 0.00151 2.500 0.00753 95,159 717 474,006 0.99083 5,396,936 56.71
20 5 0.00218 2.500 0.01083 94,443 1,023 469,657 0.98494 4,922,930 52.13
25 5 0.00391 2.500 0.01934 93,420 1,807 462,583 0.97790 4,453,273 47.67
30 5 0.00504 2.500 0.02491 91,613 2,282 452,361 0.97066 3,990,691 43.56
35 5 0.00689 2.500 0.03388 89,331 3,026 439,091 0.96707 3,538,330 39.61
40 5 0.00649 2.500 0.03194 86,305 2,757 424,633 0.96921 3,099,239 35.91
45 5 0.00601 2.500 0.02960 83,548 2,473 411,559 0.96849 2,674,605 32.01
50 5 0.00681 2.500 0.03347 81,075 2,714 398,591 0.96297 2,263,047 27.91
55 5 0.00831 2.500 0.04070 78,361 3,189 383,832 0.94848 1,864,456 23.79
60 5 0.01297 2.500 0.06281 75,172 4,721 364,056 0.91763 1,480,623 19.70
65 5 0.02177 2.500 0.10325 70,450 7,274 334,068 0.86528 1,116,568 15.85
70 5 0.03712 2.500 0.16982 63,177 10,729 289,061 0.78357 782,500 12.39
75 5 0.06312 2.500 0.27259 52,448 14,297 226,498 0.54098 493,439 9.41
80 + 0.14292 6.997 1.00000 38,151 38,151 266,940 266,940 7.00

74
Tanga
Abridged Life Table Based on Deaths and Population: Male
Age,
x
Width,
n nMx nax nqx lx ndx nLx 5Px Tx ex
0 1 0.05059 0.182 0.04858 100,000 4,858 96,027 0.94393 6,332,834 63.33
1 4 0.00538 1.713 0.02128 95,142 2,024 375,936 0.98090 6,236,807 65.55
5 5 0.00228 2.500 0.01134 93,117 1,056 462,948 0.99037 5,860,871 62.94
10 5 0.00159 2.500 0.00790 92,062 727 458,491 0.99002 5,397,923 58.63
15 5 0.00243 2.500 0.01209 91,335 1,104 453,914 0.98565 4,939,432 54.08
20 5 0.00336 2.500 0.01664 90,231 1,502 447,400 0.98247 4,485,518 49.71
25 5 0.00372 2.500 0.01843 88,729 1,635 439,559 0.98004 4,038,117 45.51
30 5 0.00435 2.500 0.02152 87,094 1,874 430,785 0.97613 3,598,558 41.32
35 5 0.00532 2.500 0.02627 85,220 2,239 420,501 0.97144 3,167,773 37.17
40 5 0.00628 2.500 0.03091 82,981 2,565 408,492 0.96634 2,747,272 33.11
45 5 0.00744 2.500 0.03650 80,416 2,935 394,743 0.95743 2,338,779 29.08
50 5 0.01002 2.500 0.04886 77,481 3,786 377,940 0.94401 1,944,036 25.09
55 5 0.01311 2.500 0.06347 73,695 4,678 356,781 0.92127 1,566,097 21.25
60 5 0.01995 2.500 0.09503 69,017 6,559 328,690 0.88195 1,209,316 17.52
65 5 0.03092 2.500 0.14349 62,459 8,962 289,888 0.82228 880,626 14.10
70 5 0.04886 2.500 0.21769 53,497 11,646 238,369 0.73343 590,738 11.04
75 5 0.07877 2.500 0.32905 41,851 13,771 174,827 0.50385 352,369 8.42
80 + 0.15816 6.323 1.00000 28,080 28,080 177,542 177,542 6.32
Abridged Life Table Based on Deaths and Population: Female
Age,
x
Width,
n nMx nax nqx lx ndx nLx 5Px Tx ex
0 1 0.04221 0.172 0.04079 100,000 4,079 96,624 0.95213 6,530,652 65.31
1 4 0.00480 1.667 0.01897 95,921 1,820 379,439 0.98336 6,434,028 67.08
5 5 0.00202 2.500 0.01006 94,102 947 468,142 0.99065 6,054,589 64.34
10 5 0.00173 2.500 0.00862 93,155 803 463,767 0.99087 5,586,447 59.97
15 5 0.00194 2.500 0.00964 92,352 890 459,532 0.98870 5,122,680 55.47
20 5 0.00261 2.500 0.01297 91,461 1,187 454,340 0.98359 4,663,148 50.98
25 5 0.00402 2.500 0.01989 90,275 1,796 446,884 0.97768 4,208,809 46.62
30 5 0.00502 2.500 0.02481 88,479 2,195 436,908 0.97143 3,761,924 42.52
35 5 0.00659 2.500 0.03242 86,284 2,798 424,427 0.96749 3,325,016 38.54
40 5 0.00663 2.500 0.03259 83,487 2,721 410,630 0.96751 2,900,589 34.74
45 5 0.00658 2.500 0.03239 80,766 2,616 397,288 0.96451 2,489,958 30.83
50 5 0.00789 2.500 0.03869 78,150 3,024 383,188 0.95646 2,092,671 26.78
55 5 0.00996 2.500 0.04858 75,126 3,649 366,505 0.93906 1,709,483 22.75
60 5 0.01535 2.500 0.07393 71,476 5,284 344,171 0.90452 1,342,978 18.79
65 5 0.02525 2.500 0.11876 66,192 7,861 311,308 0.84775 998,807 15.09
70 5 0.04205 2.500 0.19026 58,331 11,098 263,912 0.76212 687,499 11.79
75 5 0.06968 2.500 0.29670 47,233 14,014 201,132 0.52517 423,588 8.97
80 + 0.14933 6.697 1.00000 33,219 33,219 222,456 222,456 6.70

75
Morogoro
Abridged Life Table Based on Deaths and Population: Male
Age,
x
Width,
n nMx nax nqx lx ndx nLx 5Px Tx ex
0 1 0.05678 0.199 0.05431 100,000 5,431 95,648 0.93675 6,040,204 60.40
1 4 0.00646 1.695 0.02548 94,569 2,409 372,725 0.97695 5,944,556 62.86
5 5 0.00282 2.500 0.01399 92,160 1,289 457,578 0.98770 5,571,830 60.46
10 5 0.00213 2.500 0.01058 90,871 962 451,951 0.98743 5,114,252 56.28
15 5 0.00294 2.500 0.01458 89,909 1,311 446,270 0.98326 4,662,302 51.86
20 5 0.00382 2.500 0.01894 88,599 1,678 438,799 0.97885 4,216,032 47.59
25 5 0.00473 2.500 0.02339 86,921 2,033 429,520 0.97347 3,777,233 43.46
30 5 0.00604 2.500 0.02974 84,887 2,524 418,126 0.96554 3,347,713 39.44
35 5 0.00802 2.500 0.03933 82,363 3,239 403,717 0.95863 2,929,588 35.57
40 5 0.00889 2.500 0.04351 79,124 3,442 387,014 0.95484 2,525,870 31.92
45 5 0.00960 2.500 0.04688 75,682 3,548 369,537 0.94901 2,138,857 28.26
50 5 0.01137 2.500 0.05530 72,133 3,989 350,694 0.93767 1,769,319 24.53
55 5 0.01446 2.500 0.06977 68,144 4,754 328,836 0.91515 1,418,625 20.82
60 5 0.02129 2.500 0.10105 63,390 6,406 300,935 0.87589 1,089,789 17.19
65 5 0.03238 2.500 0.14976 56,984 8,534 263,586 0.81548 788,854 13.84
70 5 0.05081 2.500 0.22540 48,450 10,921 214,950 0.72555 525,267 10.84
75 5 0.08128 2.500 0.33777 37,530 12,676 155,958 0.49743 310,317 8.27
80 + 0.16101 6.211 1.00000 24,853 24,853 154,359 154,359 6.21
Abridged Life Table Based on Deaths and Population: Female
Age,
x
Width,
n nMx nax nqx lx ndx nLx 5Px Tx ex
0 1 0.04209 0.172 0.04068 100,000 4,068 96,632 0.95235 6,427,315 64.27
1 4 0.00473 1.667 0.01870 95,932 1,794 379,544 0.98324 6,330,683 65.99
5 5 0.00213 2.500 0.01061 94,138 999 468,196 0.98980 5,951,139 63.22
10 5 0.00197 2.500 0.00979 93,140 912 463,419 0.98988 5,482,943 58.87
15 5 0.00210 2.500 0.01045 92,228 963 458,731 0.98770 5,019,524 54.43
20 5 0.00285 2.500 0.01417 91,265 1,293 453,090 0.98107 4,560,792 49.97
25 5 0.00481 2.500 0.02377 89,972 2,139 444,511 0.97298 4,107,702 45.66
30 5 0.00616 2.500 0.03035 87,833 2,666 432,500 0.96460 3,663,191 41.71
35 5 0.00829 2.500 0.04061 85,167 3,459 417,188 0.96045 3,230,691 37.93
40 5 0.00784 2.500 0.03844 81,708 3,141 400,689 0.96280 2,813,503 34.43
45 5 0.00731 2.500 0.03591 78,567 2,822 385,783 0.96203 2,412,815 30.71
50 5 0.00818 2.500 0.04010 75,746 3,038 371,135 0.95558 2,027,032 26.76
55 5 0.01003 2.500 0.04891 72,708 3,556 354,650 0.93896 1,655,897 22.77
60 5 0.01532 2.500 0.07379 69,152 5,103 333,002 0.90482 1,301,247 18.82
65 5 0.02514 2.500 0.11827 64,049 7,575 301,308 0.84837 968,245 15.12
70 5 0.04186 2.500 0.18948 56,474 10,701 255,620 0.76296 666,937 11.81
75 5 0.06940 2.500 0.29571 45,774 13,536 195,028 0.52584 411,317 8.99
80 + 0.14905 6.709 1.00000 32,238 32,238 216,289 216,289 6.71

76
Pwani
Abridged Life Table Based on Deaths and Population: Male
Age,
x
Width,
n nMx nax nqx lx ndx nLx 5Px Tx ex
0 1 0.05973 0.206 0.05702 100,000 5,702 95,475 0.93327 5,970,430 59.70
1 4 0.00702 1.687 0.02764 94,298 2,607 371,162 0.97514 5,874,956 62.30
5 5 0.00301 2.500 0.01492 91,691 1,368 455,035 0.98698 5,503,793 60.03
10 5 0.00223 2.500 0.01109 90,323 1,001 449,111 0.98693 5,048,758 55.90
15 5 0.00304 2.500 0.01507 89,321 1,346 443,241 0.98264 4,599,648 51.50
20 5 0.00397 2.500 0.01967 87,975 1,731 435,548 0.97812 4,156,407 47.25
25 5 0.00488 2.500 0.02412 86,244 2,080 426,020 0.97272 3,720,859 43.14
30 5 0.00620 2.500 0.03052 84,164 2,569 414,398 0.96469 3,294,838 39.15
35 5 0.00822 2.500 0.04026 81,595 3,285 399,763 0.95762 2,880,441 35.30
40 5 0.00912 2.500 0.04459 78,310 3,492 382,821 0.95366 2,480,677 31.68
45 5 0.00987 2.500 0.04816 74,818 3,603 365,082 0.94766 2,097,857 28.04
50 5 0.01168 2.500 0.05674 71,215 4,040 345,972 0.93605 1,732,775 24.33
55 5 0.01485 2.500 0.07159 67,174 4,809 323,848 0.91316 1,386,803 20.64
60 5 0.02178 2.500 0.10327 62,365 6,440 295,725 0.87340 1,062,954 17.04
65 5 0.03305 2.500 0.15262 55,925 8,535 258,287 0.81223 767,229 13.72
70 5 0.05179 2.500 0.22925 47,390 10,864 209,789 0.72154 508,943 10.74
75 5 0.08260 2.500 0.34232 36,526 12,503 151,370 0.49401 299,154 8.19
80 + 0.16255 6.152 1.00000 24,022 24,022 147,784 147,784 6.15
Abridged Life Table Based on Deaths and Population: Female
Age,
x
Width,
n nMx nax nqx lx ndx nLx 5Px Tx ex
0 1 0.04720 0.186 0.04545 100,000 4,545 96,302 0.94598 6,065,037 60.65
1 4 0.00582 1.659 0.02297 95,455 2,193 376,686 0.97911 5,968,735 62.53
5 5 0.00277 2.500 0.01374 93,262 1,281 463,107 0.98636 5,592,049 59.96
10 5 0.00273 2.500 0.01354 91,981 1,245 456,790 0.98658 5,128,942 55.76
15 5 0.00268 2.500 0.01330 90,735 1,207 450,659 0.98430 4,672,151 51.49
20 5 0.00366 2.500 0.01814 89,528 1,624 443,583 0.97420 4,221,492 47.15
25 5 0.00684 2.500 0.03360 87,905 2,954 432,139 0.96126 3,777,909 42.98
30 5 0.00901 2.500 0.04406 84,951 3,743 415,398 0.94812 3,345,770 39.38
35 5 0.01239 2.500 0.06007 81,208 4,878 393,847 0.94333 2,930,373 36.08
40 5 0.01090 2.500 0.05307 76,330 4,051 371,525 0.95048 2,536,526 33.23
45 5 0.00937 2.500 0.04577 72,280 3,308 353,128 0.95423 2,165,000 29.95
50 5 0.00937 2.500 0.04577 68,971 3,157 336,965 0.95065 1,811,872 26.27
55 5 0.01091 2.500 0.05311 65,815 3,495 320,335 0.93478 1,474,907 22.41
60 5 0.01624 2.500 0.07801 62,319 4,862 299,442 0.90019 1,154,572 18.53
65 5 0.02632 2.500 0.12346 57,458 7,093 269,554 0.84264 855,130 14.88
70 5 0.04347 2.500 0.19603 50,364 9,873 227,138 0.75616 585,576 11.63
75 5 0.07150 2.500 0.30330 40,491 12,281 171,754 0.52083 358,438 8.85
80 + 0.15111 6.618 1.00000 28,210 28,210 186,684 186,684 6.62

77
Dar es Salaam
Abridged Life Table Based on Deaths and Population: Male
Age,
x
Width,
n nMx nax nqx lx ndx nLx 5Px Tx ex
0 1 0.05684 0.199 0.05436 100,000 5,436 95,645 0.93623 5,724,098 57.24
1 4 0.00674 1.695 0.02654 94,564 2,510 372,471 0.97542 5,628,453 59.52
5 5 0.00321 2.500 0.01590 92,054 1,464 456,611 0.98481 5,255,982 57.10
10 5 0.00292 2.500 0.01447 90,590 1,311 449,674 0.98375 4,799,371 52.98
15 5 0.00364 2.500 0.01805 89,279 1,612 442,368 0.98044 4,349,697 48.72
20 5 0.00426 2.500 0.02109 87,668 1,849 433,717 0.97382 3,907,329 44.57
25 5 0.00638 2.500 0.03138 85,819 2,693 422,363 0.96209 3,473,613 40.48
30 5 0.00914 2.500 0.04466 83,126 3,713 406,350 0.94565 3,051,249 36.71
35 5 0.01333 2.500 0.06449 79,414 5,121 384,266 0.93433 2,644,899 33.31
40 5 0.01385 2.500 0.06693 74,293 4,972 359,032 0.93421 2,260,633 30.43
45 5 0.01335 2.500 0.06457 69,320 4,476 335,411 0.93594 1,901,601 27.43
50 5 0.01312 2.500 0.06350 64,844 4,118 313,926 0.93042 1,566,190 24.15
55 5 0.01582 2.500 0.07607 60,726 4,619 292,083 0.91016 1,252,264 20.62
60 5 0.02211 2.500 0.10475 56,107 5,877 265,842 0.87324 960,181 17.11
65 5 0.03275 2.500 0.15134 50,230 7,602 232,144 0.81443 694,339 13.82
70 5 0.05094 2.500 0.22591 42,628 9,630 189,065 0.72543 462,195 10.84
75 5 0.08118 2.500 0.33743 32,998 11,134 137,154 0.49785 273,130 8.28
80 + 0.16079 6.219 1.00000 21,864 21,864 135,977 135,977 6.22
Abridged Life Table Based on Deaths and Population: Female
Age,
x
Width,
n nMx nax nqx lx ndx nLx 5Px Tx ex
0 1 0.04501 0.180 0.04340 100,000 4,340 96,442 0.94809 6,158,395 61.58
1 4 0.00570 1.662 0.02251 95,660 2,153 377,604 0.97990 6,061,953 63.37
5 5 0.00260 2.500 0.01290 93,506 1,206 464,516 0.98726 5,684,349 60.79
10 5 0.00253 2.500 0.01258 92,300 1,161 458,599 0.98744 5,219,833 56.55
15 5 0.00253 2.500 0.01255 91,139 1,144 452,837 0.98519 4,761,234 52.24
20 5 0.00345 2.500 0.01710 89,995 1,539 446,131 0.97599 4,308,397 47.87
25 5 0.00631 2.500 0.03104 88,457 2,746 435,419 0.96430 3,862,266 43.66
30 5 0.00827 2.500 0.04051 85,711 3,472 419,874 0.95238 3,426,846 39.98
35 5 0.01132 2.500 0.05503 82,239 4,526 399,879 0.94779 3,006,973 36.56
40 5 0.01010 2.500 0.04923 77,713 3,826 378,999 0.95372 2,607,094 33.55
45 5 0.00882 2.500 0.04317 73,887 3,190 361,460 0.95627 2,228,095 30.16
50 5 0.00906 2.500 0.04432 70,697 3,133 345,653 0.95197 1,866,634 26.40
55 5 0.01066 2.500 0.05192 67,564 3,508 329,050 0.93595 1,520,981 22.51
60 5 0.01599 2.500 0.07685 64,056 4,923 307,973 0.90148 1,191,931 18.61
65 5 0.02598 2.500 0.12199 59,133 7,214 277,631 0.84425 883,958 14.95
70 5 0.04302 2.500 0.19419 51,919 10,082 234,390 0.75809 606,328 11.68
75 5 0.07090 2.500 0.30113 41,837 12,598 177,689 0.52226 371,937 8.89
80 + 0.15052 6.644 1.00000 29,239 29,239 194,249 194,249 6.64

78
Lindi
Abridged Life Table Based on Deaths and Population: Male
Age,
x
Width,
n nMx nax nqx lx ndx nLx 5Px Tx ex
0 1 0.05911 0.205 0.05645 100,000 5,645 95,511 0.93498 6,115,780 61.16
1 4 0.00633 1.689 0.02494 94,355 2,353 371,980 0.97720 6,020,269 63.80
5 5 0.00278 2.500 0.01379 92,001 1,269 456,834 0.98833 5,648,289 61.39
10 5 0.00191 2.500 0.00952 90,732 864 451,503 0.98839 5,191,454 57.22
15 5 0.00277 2.500 0.01373 89,869 1,234 446,259 0.98385 4,739,952 52.74
20 5 0.00375 2.500 0.01860 88,635 1,648 439,053 0.98011 4,293,693 48.44
25 5 0.00429 2.500 0.02121 86,986 1,845 430,320 0.97676 3,854,640 44.31
30 5 0.00513 2.500 0.02532 85,142 2,156 420,320 0.97152 3,424,320 40.22
35 5 0.00645 2.500 0.03173 82,986 2,633 408,347 0.96592 3,004,001 36.20
40 5 0.00744 2.500 0.03650 80,353 2,933 394,430 0.96090 2,595,654 32.30
45 5 0.00854 2.500 0.04180 77,419 3,236 379,006 0.95255 2,201,224 28.43
50 5 0.01096 2.500 0.05334 74,183 3,957 361,023 0.93927 1,822,218 24.56
55 5 0.01420 2.500 0.06855 70,226 4,814 339,097 0.91588 1,461,194 20.81
60 5 0.02124 2.500 0.10083 65,412 6,595 310,573 0.87568 1,122,098 17.15
65 5 0.03254 2.500 0.15044 58,817 8,848 271,963 0.81444 811,525 13.80
70 5 0.05119 2.500 0.22689 49,968 11,337 221,498 0.72389 539,561 10.80
75 5 0.08186 2.500 0.33977 38,631 13,126 160,340 0.49588 318,063 8.23
80 + 0.16171 6.184 1.00000 25,505 25,505 157,723 157,723 6.18
Abridged Life Table Based on Deaths and Population: Female
Age,
x
Width,
n nMx nax nqx lx ndx nLx 5Px Tx ex
0 1 0.03840 0.162 0.03721 100,000 3,721 96,881 0.95826 6,642,479 66.42
1 4 0.00323 1.672 0.01281 96,279 1,233 382,247 0.98769 6,545,598 67.99
5 5 0.00169 2.500 0.00842 95,046 800 473,231 0.99178 6,163,352 64.85
10 5 0.00161 2.500 0.00801 94,246 755 469,343 0.99155 5,690,121 60.38
15 5 0.00179 2.500 0.00889 93,491 831 465,377 0.98945 5,220,778 55.84
20 5 0.00246 2.500 0.01223 92,660 1,133 460,468 0.98384 4,755,401 51.32
25 5 0.00407 2.500 0.02014 91,527 1,843 453,027 0.97720 4,294,933 46.93
30 5 0.00517 2.500 0.02551 89,684 2,288 442,700 0.97029 3,841,906 42.84
35 5 0.00692 2.500 0.03403 87,396 2,974 429,546 0.96643 3,399,206 38.89
40 5 0.00673 2.500 0.03309 84,422 2,794 415,127 0.96762 2,969,660 35.18
45 5 0.00643 2.500 0.03164 81,629 2,583 401,685 0.96585 2,554,533 31.29
50 5 0.00749 2.500 0.03675 79,045 2,905 387,966 0.95905 2,152,848 27.24
55 5 0.00927 2.500 0.04532 76,141 3,451 372,078 0.94298 1,764,882 23.18
60 5 0.01435 2.500 0.06927 72,690 5,035 350,862 0.90999 1,392,805 19.16
65 5 0.02379 2.500 0.11229 67,655 7,597 319,282 0.85508 1,041,942 15.40
70 5 0.03996 2.500 0.18167 60,058 10,911 273,013 0.77109 722,660 12.03
75 5 0.06692 2.500 0.28663 49,147 14,087 210,518 0.53182 449,648 9.15
80 + 0.14662 6.821 1.00000 35,060 35,060 239,130 239,130 6.82

79
Mtwara
Abridged Life Table Based on Deaths and Population: Male
Age,
x
Width,
n nMx nax nqx lx ndx nLx 5Px Tx ex
0 1 0.05460 0.193 0.05230 100,000 5,230 95,779 0.94020 6,183,155 61.83
1 4 0.00553 1.701 0.02185 94,770 2,071 374,321 0.97974 6,087,376 64.23
5 5 0.00254 2.500 0.01261 92,699 1,169 460,573 0.98905 5,713,055 61.63
10 5 0.00186 2.500 0.00926 91,530 848 455,530 0.98869 5,252,482 57.39
15 5 0.00269 2.500 0.01338 90,682 1,214 450,376 0.98444 4,796,952 52.90
20 5 0.00359 2.500 0.01777 89,468 1,590 443,368 0.98060 4,346,576 48.58
25 5 0.00426 2.500 0.02106 87,879 1,851 434,767 0.97652 3,903,208 44.42
30 5 0.00526 2.500 0.02596 86,028 2,233 424,558 0.97031 3,468,441 40.32
35 5 0.00682 2.500 0.03351 83,795 2,808 411,955 0.96440 3,043,883 36.33
40 5 0.00770 2.500 0.03775 80,987 3,057 397,291 0.96012 2,631,928 32.50
45 5 0.00860 2.500 0.04210 77,930 3,281 381,446 0.95299 2,234,637 28.68
50 5 0.01071 2.500 0.05214 74,649 3,892 363,514 0.94086 1,853,192 24.83
55 5 0.01376 2.500 0.06653 70,757 4,708 342,015 0.91837 1,489,678 21.05
60 5 0.02056 2.500 0.09780 66,049 6,459 314,098 0.87923 1,147,663 17.38
65 5 0.03156 2.500 0.14624 59,590 8,715 276,163 0.81932 833,565 13.99
70 5 0.04970 2.500 0.22102 50,875 11,244 226,266 0.73006 557,402 10.96
75 5 0.07983 2.500 0.33275 39,631 13,187 165,187 0.50115 331,137 8.36
80 + 0.15935 6.276 1.00000 26,444 26,444 165,950 165,950 6.28
Abridged Life Table Based on Deaths and Population: Female
Age,
x
Width,
n nMx nax nqx lx ndx nLx 5Px Tx ex
0 1 0.03919 0.164 0.03795 100,000 3,795 96,827 0.95705 6,505,881 65.06
1 4 0.00351 1.671 0.01394 96,205 1,341 381,698 0.98658 6,409,054 66.62
5 5 0.00188 2.500 0.00936 94,864 888 472,101 0.99060 6,027,356 63.54
10 5 0.00190 2.500 0.00944 93,976 887 467,663 0.99034 5,555,256 59.11
15 5 0.00199 2.500 0.00989 93,089 921 463,144 0.98823 5,087,593 54.65
20 5 0.00275 2.500 0.01367 92,168 1,260 457,692 0.98114 4,624,448 50.17
25 5 0.00488 2.500 0.02412 90,908 2,193 449,061 0.97238 4,166,756 45.83
30 5 0.00634 2.500 0.03120 88,716 2,768 436,660 0.96339 3,717,696 41.91
35 5 0.00862 2.500 0.04221 85,948 3,627 420,672 0.95935 3,281,036 38.17
40 5 0.00796 2.500 0.03903 82,321 3,213 403,570 0.96269 2,860,364 34.75
45 5 0.00723 2.500 0.03552 79,107 2,810 388,512 0.96290 2,456,794 31.06
50 5 0.00790 2.500 0.03874 76,298 2,956 374,098 0.95749 2,068,282 27.11
55 5 0.00951 2.500 0.04642 73,342 3,405 358,197 0.94197 1,694,183 23.10
60 5 0.01455 2.500 0.07021 69,937 4,910 337,410 0.90904 1,335,986 19.10
65 5 0.02401 2.500 0.11327 65,027 7,366 306,721 0.85402 998,576 15.36
70 5 0.04026 2.500 0.18287 57,661 10,545 261,945 0.76986 691,855 12.00
75 5 0.06729 2.500 0.28799 47,117 13,569 201,660 0.53093 429,911 9.12
80 + 0.14698 6.804 1.00000 33,548 33,548 228,251 228,251 6.80

80
Ruvuma
Abridged Life Table Based on Deaths and Population: Male
Age,
x
Width,
n nMx nax nqx lx ndx nLx 5Px Tx ex
0 1 0.05472 0.193 0.05241 100,000 5,241 95,772 0.93921 5,897,000 58.97
1 4 0.00605 1.701 0.02388 94,759 2,262 373,836 0.97775 5,801,228 61.22
5 5 0.00290 2.500 0.01438 92,497 1,330 459,158 0.98650 5,427,392 58.68
10 5 0.00254 2.500 0.01260 91,166 1,149 452,960 0.98555 4,968,234 54.50
15 5 0.00329 2.500 0.01632 90,017 1,469 446,415 0.98202 4,515,275 50.16
20 5 0.00397 2.500 0.01967 88,549 1,742 438,389 0.97633 4,068,859 45.95
25 5 0.00563 2.500 0.02776 86,807 2,409 428,010 0.96699 3,630,471 41.82
30 5 0.00783 2.500 0.03842 84,397 3,242 413,881 0.95378 3,202,461 37.95
35 5 0.01117 2.500 0.05434 81,155 4,410 394,750 0.94426 2,788,580 34.36
40 5 0.01178 2.500 0.05722 76,745 4,391 372,748 0.94295 2,393,829 31.19
45 5 0.01171 2.500 0.05686 72,354 4,114 351,485 0.94204 2,021,081 27.93
50 5 0.01219 2.500 0.05912 68,240 4,035 331,112 0.93456 1,669,597 24.47
55 5 0.01497 2.500 0.07215 64,205 4,633 309,444 0.91378 1,338,484 20.85
60 5 0.02136 2.500 0.10137 59,573 6,039 282,765 0.87644 1,029,040 17.27
65 5 0.03203 2.500 0.14826 53,534 7,937 247,826 0.81766 746,275 13.94
70 5 0.05004 2.500 0.22236 45,597 10,139 202,637 0.72897 498,449 10.93
75 5 0.08008 2.500 0.33362 35,458 11,829 147,716 0.50064 295,812 8.34
80 + 0.15955 6.268 1.00000 23,629 23,629 148,096 148,096 6.27
Abridged Life Table Based on Deaths and Population: Female
Age,
x
Width,
n nMx nax nqx lx ndx nLx 5Px Tx ex
0 1 0.04415 0.178 0.04260 100,000 4,260 96,497 0.94977 6,150,902 61.51
1 4 0.00517 1.664 0.02043 95,740 1,956 378,389 0.98121 6,054,404 63.24
5 5 0.00254 2.500 0.01260 93,784 1,181 465,964 0.98726 5,676,015 60.52
10 5 0.00259 2.500 0.01288 92,602 1,193 460,029 0.98723 5,210,051 56.26
15 5 0.00255 2.500 0.01265 91,409 1,156 454,155 0.98502 4,750,023 51.96
20 5 0.00350 2.500 0.01734 90,253 1,565 447,351 0.97511 4,295,867 47.60
25 5 0.00662 2.500 0.03257 88,688 2,889 436,216 0.96241 3,848,517 43.39
30 5 0.00874 2.500 0.04278 85,799 3,670 419,819 0.94953 3,412,300 39.77
35 5 0.01205 2.500 0.05850 82,129 4,805 398,631 0.94487 2,992,481 36.44
40 5 0.01058 2.500 0.05154 77,324 3,986 376,655 0.95198 2,593,850 33.55
45 5 0.00906 2.500 0.04430 73,338 3,249 358,569 0.95571 2,217,195 30.23
50 5 0.00905 2.500 0.04427 70,089 3,103 342,689 0.95234 1,858,627 26.52
55 5 0.01051 2.500 0.05120 66,986 3,430 326,357 0.93696 1,515,937 22.63
60 5 0.01569 2.500 0.07551 63,556 4,799 305,784 0.90310 1,189,581 18.72
65 5 0.02554 2.500 0.12004 58,757 7,053 276,153 0.84648 883,796 15.04
70 5 0.04237 2.500 0.19157 51,704 9,905 233,757 0.76083 607,644 11.75
75 5 0.07005 2.500 0.29804 41,799 12,458 177,850 0.52432 373,887 8.94
80 + 0.14967 6.681 1.00000 29,341 29,341 196,037 196,037 6.68

81
Iringa
Abridged Life Table Based on Deaths and Population: Male
Age,
x
Width,
n nMx nax nqx lx ndx nLx 5Px Tx ex
0 1 0.07018 0.234 0.06660 100,000 6,660 94,898 0.92086 5,319,105 53.19
1 4 0.00914 1.658 0.03580 93,340 3,342 365,534 0.96714 5,224,207 55.97
5 5 0.00421 2.500 0.02084 89,998 1,875 445,302 0.98032 4,858,673 53.99
10 5 0.00373 2.500 0.01849 88,123 1,630 436,539 0.97979 4,413,371 50.08
15 5 0.00444 2.500 0.02196 86,493 1,899 427,716 0.97645 3,976,833 45.98
20 5 0.00510 2.500 0.02517 84,594 2,130 417,644 0.96826 3,549,116 41.95
25 5 0.00785 2.500 0.03848 82,464 3,173 404,387 0.95322 3,131,472 37.97
30 5 0.01140 2.500 0.05541 79,291 4,394 385,470 0.93236 2,727,085 34.39
35 5 0.01679 2.500 0.08058 74,897 6,035 359,399 0.91827 2,341,615 31.26
40 5 0.01731 2.500 0.08298 68,862 5,714 330,026 0.91913 1,982,217 28.79
45 5 0.01636 2.500 0.07857 63,148 4,962 303,337 0.92379 1,652,191 26.16
50 5 0.01529 2.500 0.07366 58,187 4,286 280,218 0.92002 1,348,854 23.18
55 5 0.01815 2.500 0.08680 53,901 4,679 257,807 0.89927 1,068,636 19.83
60 5 0.02462 2.500 0.11598 49,222 5,709 231,838 0.86146 810,829 16.47
65 5 0.03575 2.500 0.16406 43,513 7,139 199,719 0.80034 578,991 13.31
70 5 0.05512 2.500 0.24224 36,374 8,811 159,843 0.70864 379,272 10.43
75 5 0.08667 2.500 0.35619 27,563 9,818 113,271 0.48379 219,429 7.96
80 + 0.16716 5.982 1.00000 17,745 17,745 106,158 106,158 5.98
Abridged Life Table Based on Deaths and Population: Female
Age,
x
Width,
n nMx nax nqx lx ndx nLx 5Px Tx ex
0 1 0.05503 0.208 0.05273 100,000 5,273 95,825 0.93607 5,771,154 57.71
1 4 0.00765 1.647 0.03005 94,727 2,846 372,210 0.97311 5,675,329 59.91
5 5 0.00347 2.500 0.01721 91,880 1,581 455,450 0.98319 5,303,119 57.72
10 5 0.00331 2.500 0.01642 90,300 1,482 447,792 0.98386 4,847,669 53.68
15 5 0.00320 2.500 0.01585 88,817 1,408 440,566 0.98147 4,399,878 49.54
20 5 0.00430 2.500 0.02125 87,409 1,857 432,403 0.96975 3,959,312 45.30
25 5 0.00805 2.500 0.03944 85,552 3,374 419,324 0.95449 3,526,909 41.23
30 5 0.01064 2.500 0.05184 82,178 4,260 400,240 0.93904 3,107,585 37.82
35 5 0.01463 2.500 0.07059 77,918 5,500 375,840 0.93376 2,707,345 34.75
40 5 0.01270 2.500 0.06157 72,418 4,458 350,944 0.94289 2,331,504 32.20
45 5 0.01076 2.500 0.05237 67,960 3,559 330,900 0.94836 1,980,560 29.14
50 5 0.01044 2.500 0.05088 64,401 3,276 313,812 0.94545 1,649,660 25.62
55 5 0.01204 2.500 0.05843 61,124 3,571 296,692 0.92885 1,335,848 21.85
60 5 0.01768 2.500 0.08465 57,553 4,872 275,584 0.89266 1,039,156 18.06
65 5 0.02829 2.500 0.13213 52,681 6,961 246,002 0.83294 763,572 14.49
70 5 0.04626 2.500 0.20731 45,720 9,478 204,906 0.74452 517,569 11.32
75 5 0.07513 2.500 0.31624 36,242 11,461 152,557 0.51207 312,664 8.63
80 + 0.15478 6.461 1.00000 24,781 24,781 160,107 160,107 6.46

82
Mbeya
Abridged Life Table Based on Deaths and Population: Male
Age,
x
Width,
n nMx nax nqx lx ndx nLx 5Px Tx ex
0 1 0.05609 0.197 0.05367 100,000 5,367 95,689 0.93749 5,628,196 56.28
1 4 0.00638 1.697 0.02513 94,633 2,378 373,055 0.97604 5,532,507 58.46
5 5 0.00329 2.500 0.01629 92,255 1,503 457,514 0.98389 5,159,452 55.93
10 5 0.00321 2.500 0.01593 90,751 1,446 450,142 0.98240 4,701,938 51.81
15 5 0.00390 2.500 0.01929 89,306 1,723 442,221 0.97955 4,251,796 47.61
20 5 0.00437 2.500 0.02162 87,583 1,894 433,180 0.97203 3,809,575 43.50
25 5 0.00701 2.500 0.03445 85,689 2,952 421,064 0.95755 3,376,395 39.40
30 5 0.01041 2.500 0.05072 82,737 4,197 403,192 0.93752 2,955,331 35.72
35 5 0.01556 2.500 0.07487 78,540 5,880 378,000 0.92437 2,552,140 32.49
40 5 0.01590 2.500 0.07645 72,660 5,555 349,414 0.92590 2,174,139 29.92
45 5 0.01484 2.500 0.07155 67,105 4,801 323,524 0.93098 1,824,726 27.19
50 5 0.01371 2.500 0.06630 62,304 4,131 301,194 0.92811 1,501,202 24.09
55 5 0.01621 2.500 0.07788 58,173 4,531 279,540 0.90903 1,200,008 20.63
60 5 0.02220 2.500 0.10516 53,643 5,641 254,112 0.87344 920,468 17.16
65 5 0.03255 2.500 0.15048 48,002 7,224 221,951 0.81572 666,356 13.88
70 5 0.05047 2.500 0.22406 40,778 9,137 181,050 0.72753 444,406 10.90
75 5 0.08044 2.500 0.33486 31,642 10,596 131,719 0.49984 263,356 8.32
80 + 0.15988 6.255 1.00000 21,046 21,046 131,637 131,637 6.25
Abridged Life Table Based on Deaths and Population: Female
Age,
x
Width,
n nMx nax nqx lx ndx nLx 5Px Tx ex
0 1 0.04589 0.183 0.04423 100,000 4,423 96,385 0.94745 5,996,706 59.97
1 4 0.00562 1.661 0.02220 95,577 2,122 377,342 0.97952 5,900,321 61.73
5 5 0.00280 2.500 0.01389 93,454 1,298 464,027 0.98576 5,522,979 59.10
10 5 0.00294 2.500 0.01460 92,156 1,345 457,419 0.98572 5,058,952 54.90
15 5 0.00281 2.500 0.01395 90,811 1,267 450,887 0.98345 4,601,534 50.67
20 5 0.00387 2.500 0.01918 89,544 1,717 443,427 0.97191 4,150,646 46.35
25 5 0.00758 2.500 0.03719 87,827 3,266 430,970 0.95692 3,707,220 42.21
30 5 0.01009 2.500 0.04920 84,561 4,160 412,404 0.94179 3,276,250 38.74
35 5 0.01401 2.500 0.06769 80,401 5,442 388,397 0.93682 2,863,846 35.62
40 5 0.01202 2.500 0.05835 74,958 4,374 363,856 0.94625 2,475,449 33.02
45 5 0.01002 2.500 0.04886 70,584 3,448 344,300 0.95215 2,111,593 29.92
50 5 0.00958 2.500 0.04678 67,136 3,141 327,827 0.95022 1,767,293 26.32
55 5 0.01087 2.500 0.05292 63,995 3,387 311,508 0.93530 1,439,466 22.49
60 5 0.01605 2.500 0.07713 60,608 4,675 291,355 0.90138 1,127,957 18.61
65 5 0.02596 2.500 0.12191 55,934 6,819 262,621 0.84441 836,602 14.96
70 5 0.04295 2.500 0.19395 49,115 9,526 221,760 0.75838 573,981 11.69
75 5 0.07080 2.500 0.30077 39,589 11,907 168,178 0.52252 352,221 8.90
80 + 0.15041 6.648 1.00000 27,682 27,682 184,043 184,043 6.65

83
Singida
Abridged Life Table Based on Deaths and Population: Male
Age,
x
Width,
n nMx nax nqx lx ndx nLx 5Px Tx ex
0 1 0.03672 0.145 0.03561 100,000 3,561 96,955 0.96041 6,573,421 65.73
1 4 0.00291 1.752 0.01158 96,439 1,116 383,248 0.98871 6,476,466 67.16
5 5 0.00154 2.500 0.00769 95,323 733 474,783 0.99271 6,093,218 63.92
10 5 0.00138 2.500 0.00688 94,590 651 471,324 0.99117 5,618,435 59.40
15 5 0.00217 2.500 0.01079 93,939 1,014 467,163 0.98762 5,147,111 54.79
20 5 0.00282 2.500 0.01399 92,926 1,300 461,378 0.98424 4,679,948 50.36
25 5 0.00354 2.500 0.01755 91,625 1,608 454,108 0.97980 4,218,570 46.04
30 5 0.00463 2.500 0.02290 90,018 2,062 444,934 0.97325 3,764,462 41.82
35 5 0.00623 2.500 0.03069 87,956 2,700 433,030 0.96780 3,319,528 37.74
40 5 0.00687 2.500 0.03376 85,256 2,878 419,085 0.96492 2,886,498 33.86
45 5 0.00743 2.500 0.03645 82,378 3,003 404,383 0.95954 2,467,413 29.95
50 5 0.00913 2.500 0.04461 79,375 3,541 388,023 0.94931 2,063,030 25.99
55 5 0.01174 2.500 0.05704 75,834 4,326 368,356 0.92916 1,675,006 22.09
60 5 0.01786 2.500 0.08548 71,508 6,112 342,261 0.89319 1,306,650 18.27
65 5 0.02784 2.500 0.13013 65,396 8,510 305,706 0.83782 964,389 14.75
70 5 0.04421 2.500 0.19903 56,886 11,322 256,126 0.75320 658,684 11.58
75 5 0.07238 2.500 0.30645 45,564 13,963 192,913 0.52078 402,558 8.84
80 + 0.15074 6.634 1.00000 31,601 31,601 209,645 209,645 6.63
Abridged Life Table Based on Deaths and Population: Female
Age,
x
Width,
n nMx nax nqx lx ndx nLx 5Px Tx ex
0 1 0.02994 0.138 0.02918 100,000 2,918 97,483 0.96726 6,821,950 68.22
1 4 0.00244 1.686 0.00969 97,082 941 386,148 0.99083 6,724,467 69.27
5 5 0.00126 2.500 0.00627 96,140 603 479,196 0.99339 6,338,319 65.93
10 5 0.00139 2.500 0.00695 95,538 664 476,030 0.99271 5,859,123 61.33
15 5 0.00153 2.500 0.00763 94,874 724 472,562 0.99075 5,383,093 56.74
20 5 0.00219 2.500 0.01088 94,150 1,024 468,191 0.98516 4,910,531 52.16
25 5 0.00380 2.500 0.01884 93,126 1,755 461,243 0.97855 4,442,340 47.70
30 5 0.00488 2.500 0.02410 91,371 2,202 451,350 0.97169 3,981,098 43.57
35 5 0.00663 2.500 0.03262 89,169 2,909 438,571 0.96808 3,529,748 39.59
40 5 0.00634 2.500 0.03119 86,260 2,690 424,572 0.96969 3,091,177 35.84
45 5 0.00597 2.500 0.02940 83,569 2,457 411,703 0.96837 2,666,605 31.91
50 5 0.00690 2.500 0.03391 81,112 2,751 398,683 0.96244 2,254,901 27.80
55 5 0.00844 2.500 0.04133 78,361 3,239 383,710 0.94765 1,856,218 23.69
60 5 0.01319 2.500 0.06384 75,123 4,796 363,624 0.91638 1,472,508 19.60
65 5 0.02211 2.500 0.10474 70,327 7,366 333,219 0.86355 1,108,884 15.77
70 5 0.03761 2.500 0.17188 62,961 10,821 287,751 0.78135 775,665 12.32
75 5 0.06380 2.500 0.27513 52,140 14,345 224,835 0.53919 487,914 9.36
80 + 0.14366 6.961 1.00000 37,794 37,794 263,079 263,079 6.96

84
Tabora
Abridged Life Table Based on Deaths and Population: Male
Age,
x
Width,
n nMx nax nqx lx ndx nLx 5Px Tx ex
0 1 0.05473 0.193 0.05242 100,000 5,242 95,771 0.93882 5,811,060 58.11
1 4 0.00628 1.701 0.02475 94,758 2,346 373,641 0.97698 5,715,289 60.31
5 5 0.00302 2.500 0.01497 92,413 1,384 458,605 0.98570 5,341,648 57.80
10 5 0.00274 2.500 0.01361 91,029 1,239 452,048 0.98460 4,883,043 53.64
15 5 0.00347 2.500 0.01721 89,790 1,545 445,087 0.98128 4,430,995 49.35
20 5 0.00409 2.500 0.02026 88,245 1,788 436,755 0.97500 3,985,907 45.17
25 5 0.00606 2.500 0.02983 86,457 2,579 425,838 0.96408 3,549,152 41.05
30 5 0.00862 2.500 0.04220 83,878 3,540 410,541 0.94875 3,123,315 37.24
35 5 0.01252 2.500 0.06070 80,338 4,877 389,501 0.93809 2,712,774 33.77
40 5 0.01305 2.500 0.06320 75,462 4,769 365,386 0.93766 2,323,273 30.79
45 5 0.01268 2.500 0.06143 70,693 4,343 342,607 0.93858 1,957,887 27.70
50 5 0.01267 2.500 0.06141 66,350 4,075 321,564 0.93251 1,615,281 24.34
55 5 0.01536 2.500 0.07397 62,275 4,607 299,860 0.91225 1,293,717 20.77
60 5 0.02164 2.500 0.10263 57,669 5,919 273,547 0.87542 993,857 17.23
65 5 0.03221 2.500 0.14903 51,750 7,712 239,469 0.81697 720,310 13.92
70 5 0.05020 2.500 0.22299 44,038 9,820 195,638 0.72842 480,841 10.92
75 5 0.08022 2.500 0.33410 34,218 11,432 142,507 0.50033 285,203 8.33
80 + 0.15968 6.263 1.00000 22,785 22,785 142,695 142,695 6.26
Abridged Life Table Based on Deaths and Population: Female
Age,
x
Width,
n nMx nax nqx lx ndx nLx 5Px Tx ex
0 1 0.04390 0.177 0.04237 100,000 4,237 96,513 0.94966 6,332,533 63.33
1 4 0.00536 1.664 0.02117 95,763 2,027 378,317 0.98132 6,236,020 65.12
5 5 0.00233 2.500 0.01160 93,736 1,088 465,961 0.98889 5,857,702 62.49
10 5 0.00213 2.500 0.01060 92,648 982 460,787 0.98913 5,391,741 58.20
15 5 0.00224 2.500 0.01115 91,666 1,022 455,776 0.98688 4,930,954 53.79
20 5 0.00305 2.500 0.01511 90,644 1,370 449,797 0.97976 4,475,178 49.37
25 5 0.00516 2.500 0.02546 89,275 2,273 440,691 0.97100 4,025,381 45.09
30 5 0.00664 2.500 0.03264 87,002 2,840 427,910 0.96192 3,584,690 41.20
35 5 0.00893 2.500 0.04369 84,162 3,677 411,617 0.95766 3,156,781 37.51
40 5 0.00836 2.500 0.04092 80,485 3,294 394,189 0.96058 2,745,164 34.11
45 5 0.00771 2.500 0.03784 77,191 2,921 378,652 0.96029 2,350,975 30.46
50 5 0.00851 2.500 0.04166 74,270 3,094 363,614 0.95402 1,972,323 26.56
55 5 0.01036 2.500 0.05049 71,176 3,594 346,896 0.93721 1,608,709 22.60
60 5 0.01574 2.500 0.07574 67,582 5,119 325,115 0.90257 1,261,813 18.67
65 5 0.02573 2.500 0.12089 62,464 7,551 293,441 0.84543 936,698 15.00
70 5 0.04269 2.500 0.19288 54,913 10,592 248,084 0.75943 643,257 11.71
75 5 0.07049 2.500 0.29964 44,321 13,280 188,403 0.52324 395,174 8.92
80 + 0.15012 6.661 1.00000 31,040 31,040 206,770 206,770 6.66

85
Rukwa
Abridged Life Table Based on Deaths and Population: Male
Age,
x
Width,
n nMx nax nqx lx ndx nLx 5Px Tx ex
0 1 0.06291 0.215 0.05995 100,000 5,995 95,293 0.92980 5,589,046 55.89
1 4 0.00747 1.678 0.02939 94,005 2,762 369,607 0.97267 5,493,753 58.44
5 5 0.00355 2.500 0.01762 91,243 1,607 452,195 0.98339 5,124,146 56.16
10 5 0.00314 2.500 0.01558 89,635 1,396 444,685 0.98265 4,671,951 52.12
15 5 0.00387 2.500 0.01914 88,239 1,689 436,972 0.97922 4,227,266 47.91
20 5 0.00454 2.500 0.02245 86,550 1,943 427,892 0.97228 3,790,294 43.79
25 5 0.00673 2.500 0.03311 84,607 2,801 416,031 0.96010 3,362,402 39.74
30 5 0.00961 2.500 0.04693 81,806 3,839 399,430 0.94299 2,946,372 36.02
35 5 0.01399 2.500 0.06759 77,967 5,270 376,658 0.93114 2,546,942 32.67
40 5 0.01455 2.500 0.07021 72,697 5,104 350,723 0.93093 2,170,284 29.85
45 5 0.01405 2.500 0.06785 67,593 4,586 326,498 0.93281 1,819,561 26.92
50 5 0.01375 2.500 0.06649 63,006 4,189 304,559 0.92720 1,493,063 23.70
55 5 0.01657 2.500 0.07955 58,817 4,679 282,389 0.90641 1,188,504 20.21
60 5 0.02302 2.500 0.10884 54,138 5,892 255,960 0.86881 906,115 16.74
65 5 0.03391 2.500 0.15628 48,246 7,540 222,380 0.80884 650,155 13.48
70 5 0.05262 2.500 0.23249 40,706 9,464 179,871 0.71858 427,775 10.51
75 5 0.08343 2.500 0.34517 31,242 10,784 129,251 0.47862 247,904 7.93
80 + 0.17242 5.800 1.00000 20,458 20,458 118,653 118,653 5.80
Abridged Life Table Based on Deaths and Population: Female
Age,
x
Width,
n nMx nax nqx lx ndx nLx 5Px Tx ex
0 1 0.05158 0.199 0.04953 100,000 4,953 96,031 0.94068 6,078,774 60.79
1 4 0.00669 1.652 0.02635 95,047 2,504 374,309 0.97669 5,982,744 62.95
5 5 0.00291 2.500 0.01443 92,543 1,336 459,376 0.98641 5,608,434 60.60
10 5 0.00256 2.500 0.01273 91,207 1,161 453,134 0.98709 5,149,059 56.45
15 5 0.00264 2.500 0.01310 90,046 1,180 447,281 0.98474 4,695,925 52.15
20 5 0.00352 2.500 0.01744 88,866 1,550 440,457 0.97655 4,248,643 47.81
25 5 0.00600 2.500 0.02956 87,316 2,581 430,128 0.96628 3,808,187 43.61
30 5 0.00775 2.500 0.03799 84,735 3,219 415,626 0.95572 3,378,058 39.87
35 5 0.01043 2.500 0.05081 81,516 4,142 397,224 0.95106 2,962,432 36.34
40 5 0.00962 2.500 0.04696 77,374 3,634 377,785 0.95513 2,565,208 33.15
45 5 0.00872 2.500 0.04268 73,740 3,147 360,833 0.95586 2,187,423 29.66
50 5 0.00935 2.500 0.04567 70,593 3,224 344,905 0.94977 1,826,590 25.87
55 5 0.01131 2.500 0.05501 67,369 3,706 327,579 0.93213 1,481,685 21.99
60 5 0.01699 2.500 0.08148 63,663 5,187 305,346 0.89600 1,154,106 18.13
65 5 0.02747 2.500 0.12853 58,476 7,516 273,589 0.83688 848,760 14.51
70 5 0.04514 2.500 0.20282 50,960 10,336 228,960 0.74912 575,171 11.29
75 5 0.07370 2.500 0.31117 40,624 12,641 171,518 0.50458 346,210 8.52
80 + 0.16018 6.243 1.00000 27,983 27,983 174,692 174,692 6.24

86
Kigoma
Abridged Life Table Based on Deaths and Population: Male
Age,
x
Width,
n nMx nax nqx lx ndx nLx 5Px Tx ex
0 1 0.05675 0.199 0.05428 100,000 5,428 95,650 0.93651 6,042,087 60.42
1 4 0.00662 1.695 0.02609 94,572 2,467 372,604 0.97662 5,946,437 62.88
5 5 0.00282 2.500 0.01399 92,105 1,289 457,305 0.98775 5,573,833 60.52
10 5 0.00211 2.500 0.01048 90,817 952 451,704 0.98748 5,116,529 56.34
15 5 0.00294 2.500 0.01458 89,865 1,310 446,050 0.98323 4,664,825 51.91
20 5 0.00383 2.500 0.01899 88,555 1,682 438,571 0.97890 4,218,775 47.64
25 5 0.00470 2.500 0.02325 86,873 2,020 429,318 0.97374 3,780,204 43.51
30 5 0.00596 2.500 0.02935 84,854 2,490 418,044 0.96608 3,350,886 39.49
35 5 0.00788 2.500 0.03864 82,364 3,182 403,863 0.95927 2,932,843 35.61
40 5 0.00877 2.500 0.04291 79,181 3,398 387,412 0.95534 2,528,980 31.94
45 5 0.00952 2.500 0.04649 75,783 3,523 370,109 0.94926 2,141,568 28.26
50 5 0.01135 2.500 0.05521 72,260 3,989 351,329 0.93770 1,771,459 24.51
55 5 0.01447 2.500 0.06982 68,271 4,766 329,440 0.91506 1,420,130 20.80
60 5 0.02132 2.500 0.10119 63,505 6,426 301,459 0.87566 1,090,690 17.17
65 5 0.03246 2.500 0.15010 57,079 8,567 263,975 0.81507 789,231 13.83
70 5 0.05094 2.500 0.22591 48,511 10,959 215,158 0.72501 525,256 10.83
75 5 0.08146 2.500 0.33839 37,552 12,707 155,992 0.49696 310,097 8.26
80 + 0.16122 6.203 1.00000 24,845 24,845 154,105 154,105 6.20
Abridged Life Table Based on Deaths and Population: Female
Age,
x
Width,
n nMx nax nqx lx ndx nLx 5Px Tx ex
0 1 0.04501 0.180 0.04340 100,000 4,340 96,442 0.94842 6,382,533 63.83
1 4 0.00552 1.662 0.02178 95,660 2,084 377,768 0.98095 6,286,091 65.71
5 5 0.00232 2.500 0.01155 93,576 1,081 465,177 0.98927 5,908,324 63.14
10 5 0.00199 2.500 0.00989 92,495 915 460,187 0.98968 5,443,147 58.85
15 5 0.00216 2.500 0.01075 91,580 984 455,439 0.98745 4,982,960 54.41
20 5 0.00289 2.500 0.01437 90,596 1,302 449,725 0.98138 4,527,521 49.98
25 5 0.00464 2.500 0.02293 89,294 2,047 441,353 0.97412 4,077,797 45.67
30 5 0.00587 2.500 0.02891 87,247 2,522 429,930 0.96655 3,636,444 41.68
35 5 0.00777 2.500 0.03812 84,725 3,230 415,550 0.96238 3,206,513 37.85
40 5 0.00756 2.500 0.03709 81,495 3,023 399,918 0.96361 2,790,964 34.25
45 5 0.00726 2.500 0.03567 78,472 2,799 385,364 0.96173 2,391,046 30.47
50 5 0.00837 2.500 0.04098 75,673 3,101 370,615 0.95425 2,005,682 26.50
55 5 0.01041 2.500 0.05073 72,573 3,681 353,659 0.93671 1,635,067 22.53
60 5 0.01591 2.500 0.07653 68,891 5,272 331,275 0.90158 1,281,408 18.60
65 5 0.02601 2.500 0.12213 63,619 7,770 298,671 0.84399 950,132 14.93
70 5 0.04312 2.500 0.19460 55,849 10,868 252,076 0.75760 651,462 11.66
75 5 0.07107 2.500 0.30174 44,981 13,573 190,973 0.52183 399,386 8.88
80 + 0.15070 6.636 1.00000 31,408 31,408 208,413 208,413 6.64

87
Shinyanga
Abridged Life Table Based on Deaths and Population: Male
Age,
x
Width,
n nMx nax nqx lx ndx nLx 5Px Tx ex
0 1 0.05294 0.188 0.05076 100,000 5,076 95,880 0.94109 5,702,237 57.02
1 4 0.00586 1.706 0.02311 94,924 2,194 374,663 0.97783 5,606,356 59.06
5 5 0.00308 2.500 0.01527 92,730 1,416 460,111 0.98470 5,231,693 56.42
10 5 0.00309 2.500 0.01533 91,314 1,400 453,073 0.98303 4,771,583 52.25
15 5 0.00376 2.500 0.01865 89,915 1,677 445,383 0.98027 4,318,510 48.03
20 5 0.00421 2.500 0.02084 88,238 1,839 436,593 0.97292 3,873,128 43.89
25 5 0.00680 2.500 0.03344 86,399 2,890 424,771 0.95868 3,436,534 39.78
30 5 0.01015 2.500 0.04948 83,509 4,132 407,218 0.93898 3,011,764 36.06
35 5 0.01519 2.500 0.07316 79,378 5,807 382,371 0.92613 2,604,546 32.81
40 5 0.01550 2.500 0.07463 73,570 5,490 354,127 0.92775 2,222,175 30.20
45 5 0.01444 2.500 0.06968 68,080 4,744 328,542 0.93277 1,868,049 27.44
50 5 0.01335 2.500 0.06459 63,336 4,091 306,455 0.92997 1,539,507 24.31
55 5 0.01577 2.500 0.07584 59,245 4,493 284,994 0.91123 1,233,052 20.81
60 5 0.02167 2.500 0.10277 54,752 5,627 259,695 0.87606 948,058 17.32
65 5 0.03186 2.500 0.14753 49,126 7,247 227,509 0.81907 688,363 14.01
70 5 0.04947 2.500 0.22011 41,878 9,218 186,346 0.73167 460,854 11.00
75 5 0.07909 2.500 0.33017 32,660 10,784 136,343 0.50332 274,508 8.40
80 + 0.15834 6.316 1.00000 21,877 21,877 138,165 138,165 6.32
Abridged Life Table Based on Deaths and Population: Female
Age,
x
Width,
n nMx nax nqx lx ndx nLx 5Px Tx ex
0 1 0.04292 0.174 0.04145 100,000 4,145 96,577 0.95105 6,231,197 62.31
1 4 0.00505 1.666 0.01997 95,855 1,914 378,949 0.98185 6,134,620 64.00
5 5 0.00240 2.500 0.01195 93,940 1,123 466,894 0.98801 5,755,671 61.27
10 5 0.00242 2.500 0.01202 92,817 1,116 461,298 0.98799 5,288,777 56.98
15 5 0.00241 2.500 0.01200 91,702 1,100 455,757 0.98579 4,827,479 52.64
20 5 0.00332 2.500 0.01645 90,601 1,491 449,280 0.97675 4,371,721 48.25
25 5 0.00612 2.500 0.03016 89,111 2,687 438,836 0.96528 3,922,441 44.02
30 5 0.00804 2.500 0.03943 86,424 3,407 423,599 0.95358 3,483,606 40.31
35 5 0.01104 2.500 0.05371 83,016 4,459 403,934 0.94909 3,060,006 36.86
40 5 0.00983 2.500 0.04795 78,558 3,767 383,371 0.95496 2,656,072 33.81
45 5 0.00858 2.500 0.04199 74,791 3,140 366,103 0.95749 2,272,701 30.39
50 5 0.00880 2.500 0.04306 71,650 3,085 350,538 0.95335 1,906,599 26.61
55 5 0.01034 2.500 0.05039 68,565 3,455 334,187 0.93773 1,556,061 22.69
60 5 0.01553 2.500 0.07477 65,110 4,868 313,379 0.90390 1,221,874 18.77
65 5 0.02534 2.500 0.11916 60,242 7,178 283,263 0.84745 908,495 15.08
70 5 0.04210 2.500 0.19046 53,064 10,107 240,051 0.76196 625,232 11.78
75 5 0.06971 2.500 0.29681 42,957 12,750 182,910 0.52513 385,180 8.97
80 + 0.14934 6.696 1.00000 30,207 30,207 202,270 202,270 6.70

88
Kagera
Abridged Life Table Based on Deaths and Population: Male
Age,
x
Width,
n nMx nax nqx lx ndx nLx 5Px Tx ex
0 1 0.07070 0.235 0.06708 100,000 6,708 94,871 0.92049 5,546,176 55.46
1 4 0.00910 1.657 0.03565 93,292 3,326 365,376 0.96790 5,451,305 58.43
5 5 0.00391 2.500 0.01938 89,966 1,743 445,474 0.98268 5,085,929 56.53
10 5 0.00307 2.500 0.01523 88,223 1,343 437,758 0.98288 4,640,455 52.60
15 5 0.00384 2.500 0.01904 86,880 1,654 430,264 0.97876 4,202,697 48.37
20 5 0.00475 2.500 0.02347 85,226 2,001 421,127 0.97243 3,772,433 44.26
25 5 0.00645 2.500 0.03176 83,225 2,643 409,517 0.96287 3,351,306 40.27
30 5 0.00872 2.500 0.04268 80,582 3,439 394,310 0.94923 2,941,789 36.51
35 5 0.01220 2.500 0.05921 77,142 4,568 374,293 0.93888 2,547,479 33.02
40 5 0.01304 2.500 0.06315 72,575 4,583 351,416 0.93658 2,173,186 29.94
45 5 0.01316 2.500 0.06370 67,992 4,331 329,129 0.93474 1,821,771 26.79
50 5 0.01385 2.500 0.06691 63,660 4,260 307,652 0.92591 1,492,641 23.45
55 5 0.01705 2.500 0.08177 59,400 4,857 284,859 0.90311 1,184,989 19.95
60 5 0.02403 2.500 0.11335 54,543 6,183 257,259 0.86311 900,131 16.50
65 5 0.03560 2.500 0.16343 48,360 7,904 222,043 0.80042 642,872 13.29
70 5 0.05526 2.500 0.24278 40,457 9,822 177,729 0.70774 420,828 10.40
75 5 0.08709 2.500 0.35760 30,635 10,955 125,786 0.48258 243,100 7.94
80 + 0.16775 5.961 1.00000 19,680 19,680 117,314 117,314 5.96
Abridged Life Table Based on Deaths and Population: Female
Age,
x
Width,
n nMx nax nqx lx ndx nLx 5Px Tx ex
0 1 0.05902 0.219 0.05642 100,000 5,642 95,595 0.93151 5,965,965 59.66
1 4 0.00833 1.641 0.03267 94,358 3,083 370,162 0.97165 5,870,370 62.21
5 5 0.00338 2.500 0.01676 91,276 1,530 452,554 0.98494 5,500,208 60.26
10 5 0.00269 2.500 0.01334 89,746 1,197 445,737 0.98633 5,047,655 56.24
15 5 0.00282 2.500 0.01400 88,549 1,240 439,644 0.98390 4,601,918 51.97
20 5 0.00368 2.500 0.01824 87,309 1,592 432,564 0.97654 4,162,274 47.67
25 5 0.00584 2.500 0.02877 85,717 2,466 422,418 0.96749 3,729,709 43.51
30 5 0.00741 2.500 0.03636 83,250 3,027 408,685 0.95812 3,307,291 39.73
35 5 0.00975 2.500 0.04760 80,223 3,819 391,570 0.95341 2,898,606 36.13
40 5 0.00932 2.500 0.04553 76,405 3,479 373,325 0.95567 2,507,037 32.81
45 5 0.00880 2.500 0.04307 72,926 3,141 356,776 0.95455 2,133,711 29.26
50 5 0.00982 2.500 0.04794 69,785 3,346 340,560 0.94664 1,776,935 25.46
55 5 0.01217 2.500 0.05904 66,439 3,923 322,389 0.92721 1,436,375 21.62
60 5 0.01828 2.500 0.08741 62,516 5,464 298,921 0.88909 1,113,986 17.82
65 5 0.02934 2.500 0.13667 57,052 7,798 265,767 0.82772 815,065 14.29
70 5 0.04781 2.500 0.21353 49,255 10,517 219,979 0.73801 549,298 11.15
75 5 0.07722 2.500 0.32361 38,737 12,536 162,346 0.50702 329,319 8.50
80 + 0.15692 6.373 1.00000 26,201 26,201 166,973 166,973 6.37

89
Mwanza
Abridged Life Table Based on Deaths and Population: Male
Age,
x
Width,
n nMx nax nqx lx ndx nLx 5Px Tx ex
0 1 0.05016 0.181 0.04818 100,000 4,818 96,054 0.94429 6,032,223 60.32
1 4 0.00539 1.714 0.02132 95,182 2,029 376,089 0.98012 5,936,169 62.37
5 5 0.00260 2.500 0.01291 93,153 1,203 462,758 0.98784 5,560,080 59.69
10 5 0.00229 2.500 0.01139 91,950 1,047 457,133 0.98673 5,097,321 55.44
15 5 0.00306 2.500 0.01517 90,903 1,379 451,067 0.98322 4,640,188 51.05
20 5 0.00371 2.500 0.01840 89,524 1,648 443,500 0.97797 4,189,121 46.79
25 5 0.00521 2.500 0.02572 87,876 2,260 433,730 0.96948 3,745,621 42.62
30 5 0.00722 2.500 0.03545 85,616 3,035 420,491 0.95744 3,311,891 38.68
35 5 0.01024 2.500 0.04993 82,581 4,123 402,596 0.94867 2,891,400 35.01
40 5 0.01085 2.500 0.05282 78,458 4,144 381,929 0.94716 2,488,804 31.72
45 5 0.01086 2.500 0.05286 74,314 3,929 361,748 0.94555 2,106,875 28.35
50 5 0.01155 2.500 0.05611 70,385 3,950 342,053 0.93769 1,745,127 24.79
55 5 0.01427 2.500 0.06888 66,436 4,576 320,739 0.91718 1,403,074 21.12
60 5 0.02056 2.500 0.09780 61,860 6,050 294,175 0.88027 1,082,336 17.50
65 5 0.03105 2.500 0.14405 55,810 8,039 258,952 0.82236 788,161 14.12
70 5 0.04866 2.500 0.21690 47,771 10,361 212,950 0.73463 529,209 11.08
75 5 0.07826 2.500 0.32727 37,409 12,243 156,440 0.50534 316,259 8.45
80 + 0.15747 6.350 1.00000 25,166 25,166 159,819 159,819 6.35
Abridged Life Table Based on Deaths and Population: Female
Age,
x
Width,
n nMx nax nqx lx ndx nLx 5Px Tx ex
0 1 0.04167 0.171 0.04028 100,000 4,028 96,660 0.95238 6,457,627 64.58
1 4 0.00492 1.667 0.01947 95,972 1,869 379,530 0.98290 6,360,967 66.28
5 5 0.00211 2.500 0.01051 94,103 989 468,045 0.99003 5,981,437 63.56
10 5 0.00190 2.500 0.00944 93,115 879 463,376 0.99019 5,513,392 59.21
15 5 0.00205 2.500 0.01019 92,236 940 458,829 0.98800 5,050,015 54.75
20 5 0.00278 2.500 0.01382 91,296 1,262 453,324 0.98186 4,591,186 50.29
25 5 0.00456 2.500 0.02253 90,034 2,028 445,100 0.97449 4,137,862 45.96
30 5 0.00579 2.500 0.02856 88,006 2,513 433,746 0.96683 3,692,762 41.96
35 5 0.00773 2.500 0.03793 85,493 3,242 419,357 0.96278 3,259,017 38.12
40 5 0.00743 2.500 0.03649 82,250 3,001 403,748 0.96438 2,839,659 34.52
45 5 0.00707 2.500 0.03472 79,249 2,752 389,364 0.96282 2,435,912 30.74
50 5 0.00810 2.500 0.03971 76,497 3,038 374,889 0.95578 2,046,548 26.75
55 5 0.01003 2.500 0.04891 73,459 3,593 358,312 0.93887 1,671,658 22.76
60 5 0.01536 2.500 0.07398 69,866 5,168 336,408 0.90456 1,313,347 18.80
65 5 0.02522 2.500 0.11862 64,697 7,675 304,301 0.84797 976,938 15.10
70 5 0.04197 2.500 0.18993 57,023 10,830 258,038 0.76247 672,638 11.80
75 5 0.06957 2.500 0.29630 46,193 13,687 196,746 0.52546 414,599 8.98
80 + 0.14921 6.702 1.00000 32,506 32,506 217,854 217,854 6.70

90
Mara
Abridged Life Table Based on Deaths and Population: Male
Age,
x
Width,
n nMx nax nqx lx ndx nLx 5Px Tx ex
0 1 0.05760 0.201 0.05507 100,000 5,507 95,599 0.93600 5,893,390 58.93
1 4 0.00648 1.693 0.02555 94,493 2,414 372,403 0.97643 5,797,791 61.36
5 5 0.00300 2.500 0.01487 92,079 1,370 456,970 0.98640 5,425,387 58.92
10 5 0.00248 2.500 0.01230 90,709 1,116 450,757 0.98580 4,968,417 54.77
15 5 0.00325 2.500 0.01612 89,594 1,444 444,358 0.98200 4,517,660 50.42
20 5 0.00402 2.500 0.01992 88,150 1,756 436,359 0.97661 4,073,302 46.21
25 5 0.00546 2.500 0.02693 86,394 2,327 426,152 0.96841 3,636,944 42.10
30 5 0.00741 2.500 0.03638 84,067 3,058 412,690 0.95671 3,210,791 38.19
35 5 0.01035 2.500 0.05046 81,009 4,088 394,825 0.94787 2,798,101 34.54
40 5 0.01108 2.500 0.05389 76,921 4,146 374,242 0.94570 2,403,276 31.24
45 5 0.01125 2.500 0.05472 72,776 3,982 353,923 0.94321 2,029,033 27.88
50 5 0.01215 2.500 0.05898 68,793 4,058 333,823 0.93438 1,675,111 24.35
55 5 0.01508 2.500 0.07267 64,736 4,704 311,919 0.91283 1,341,287 20.72
60 5 0.02168 2.500 0.10281 60,032 6,172 284,728 0.87456 1,029,368 17.15
65 5 0.03259 2.500 0.15066 53,860 8,114 249,013 0.81478 744,640 13.83
70 5 0.05094 2.500 0.22591 45,745 10,334 202,891 0.72521 495,627 10.83
75 5 0.08133 2.500 0.33794 35,411 11,967 147,138 0.49737 292,736 8.27
80 + 0.16102 6.210 1.00000 23,444 23,444 145,598 145,598 6.21
Abridged Life Table Based on Deaths and Population: Female
Age,
x
Width,
n nMx nax nqx lx ndx nLx 5Px Tx ex
0 1 0.04797 0.189 0.04617 100,000 4,617 96,253 0.94539 6,282,100 62.82
1 4 0.00577 1.658 0.02278 95,383 2,173 376,443 0.97978 6,185,847 64.85
5 5 0.00252 2.500 0.01250 93,210 1,165 463,139 0.98832 5,809,403 62.33
10 5 0.00218 2.500 0.01086 92,045 999 457,728 0.98882 5,346,265 58.08
15 5 0.00231 2.500 0.01150 91,046 1,047 452,613 0.98656 4,888,536 53.69
20 5 0.00311 2.500 0.01541 89,999 1,387 446,529 0.97983 4,435,923 49.29
25 5 0.00507 2.500 0.02501 88,612 2,216 437,521 0.97164 3,989,394 45.02
30 5 0.00646 2.500 0.03180 86,396 2,747 425,113 0.96313 3,551,873 41.11
35 5 0.00860 2.500 0.04211 83,649 3,522 409,440 0.95881 3,126,761 37.38
40 5 0.00821 2.500 0.04023 80,127 3,223 392,576 0.96092 2,717,321 33.91
45 5 0.00773 2.500 0.03789 76,904 2,914 377,233 0.95983 2,324,745 30.23
50 5 0.00869 2.500 0.04253 73,989 3,147 362,081 0.95274 1,947,512 26.32
55 5 0.01072 2.500 0.05221 70,843 3,698 344,968 0.93510 1,585,431 22.38
60 5 0.01630 2.500 0.07829 67,144 5,257 322,580 0.89958 1,240,463 18.47
65 5 0.02654 2.500 0.12443 61,888 7,701 290,187 0.84144 917,883 14.83
70 5 0.04384 2.500 0.19754 54,187 10,704 244,175 0.75457 627,696 11.58
75 5 0.07201 2.500 0.30510 43,483 13,267 184,248 0.51959 383,520 8.82
80 + 0.15163 6.595 1.00000 30,216 30,216 199,272 199,272 6.59

91
Manyara
Abridged Life Table Based on Deaths and Population: Male
Age,
x
Width,
n nMx nax nqx lx ndx nLx 5Px Tx ex
0 1 0.03891 0.151 0.03766 100,000 3,766 96,802 0.95765 6,682,156 66.82
1 4 0.00338 1.746 0.01343 96,234 1,293 382,021 0.98764 6,585,355 68.43
5 5 0.00152 2.500 0.00759 94,941 720 472,904 0.99345 6,203,334 65.34
10 5 0.00110 2.500 0.00551 94,221 519 469,806 0.99243 5,730,429 60.82
15 5 0.00194 2.500 0.00964 93,702 903 466,250 0.98839 5,260,623 56.14
20 5 0.00274 2.500 0.01360 92,798 1,262 460,836 0.98595 4,794,373 51.66
25 5 0.00292 2.500 0.01451 91,536 1,329 454,359 0.98452 4,333,537 47.34
30 5 0.00332 2.500 0.01647 90,208 1,486 447,324 0.98206 3,879,178 43.00
35 5 0.00392 2.500 0.01943 88,722 1,724 439,299 0.97855 3,431,854 38.68
40 5 0.00476 2.500 0.02351 86,998 2,045 429,876 0.97372 2,992,555 34.40
45 5 0.00591 2.500 0.02912 84,953 2,474 418,579 0.96454 2,562,679 30.17
50 5 0.00858 2.500 0.04200 82,479 3,464 403,736 0.95146 2,144,100 26.00
55 5 0.01139 2.500 0.05538 79,015 4,376 384,137 0.92998 1,740,365 22.03
60 5 0.01787 2.500 0.08552 74,639 6,383 357,238 0.89240 1,356,228 18.17
65 5 0.02821 2.500 0.13174 68,256 8,992 318,799 0.83556 998,990 14.64
70 5 0.04497 2.500 0.20211 59,264 11,978 266,374 0.74970 680,191 11.48
75 5 0.07357 2.500 0.31070 47,286 14,692 199,700 0.51742 413,817 8.75
80 + 0.15223 6.569 1.00000 32,594 32,594 214,116 214,116 6.57
Abridged Life Table Based on Deaths and Population: Female
Age,
x
Width,
n nMx nax nqx lx ndx nLx 5Px Tx ex
0 1 0.02962 0.137 0.02888 100,000 2,888 97,506 0.96755 6,946,872 69.47
1 4 0.00244 1.686 0.00969 97,112 941 386,268 0.99119 6,849,366 70.53
5 5 0.00112 2.500 0.00557 96,170 536 479,513 0.99438 6,463,098 67.20
10 5 0.00114 2.500 0.00567 95,635 542 476,818 0.99378 5,983,585 62.57
15 5 0.00136 2.500 0.00677 95,092 644 473,851 0.99185 5,506,767 57.91
20 5 0.00192 2.500 0.00953 94,448 900 469,989 0.98783 5,032,916 53.29
25 5 0.00299 2.500 0.01484 93,548 1,388 464,267 0.98338 4,562,927 48.78
30 5 0.00372 2.500 0.01842 92,159 1,698 456,552 0.97871 4,098,659 44.47
35 5 0.00490 2.500 0.02421 90,461 2,190 446,831 0.97530 3,642,108 40.26
40 5 0.00510 2.500 0.02520 88,271 2,224 435,793 0.97455 3,195,277 36.20
45 5 0.00521 2.500 0.02571 86,046 2,212 424,702 0.97104 2,759,484 32.07
50 5 0.00657 2.500 0.03230 83,834 2,708 412,403 0.96354 2,334,781 27.85
55 5 0.00832 2.500 0.04075 81,127 3,306 397,369 0.94804 1,922,378 23.70
60 5 0.01315 2.500 0.06365 77,821 4,953 376,720 0.91641 1,525,010 19.60
65 5 0.02214 2.500 0.10487 72,867 7,642 345,232 0.86338 1,148,290 15.76
70 5 0.03766 2.500 0.17208 65,225 11,224 298,066 0.78109 803,058 12.31
75 5 0.06389 2.500 0.27546 54,001 14,875 232,817 0.53897 504,992 9.35
80 + 0.14375 6.956 1.00000 39,126 39,126 272,175 272,175 6.96

92
Njombe
Abridged Life Table Based on Deaths and Population: Male
Age,
x
Width,
n nMx nax nqx lx ndx nLx 5Px Tx ex
0 1 0.06276 0.214 0.05981 100,000 5,981 95,301 0.92955 4,927,689 49.28
1 4 0.00770 1.679 0.03026 94,019 2,845 369,471 0.96986 4,832,388 51.40
5 5 0.00453 2.500 0.02240 91,174 2,042 450,764 0.97590 4,462,917 48.95
10 5 0.00524 2.500 0.02585 89,132 2,304 439,899 0.97296 4,012,153 45.01
15 5 0.00573 2.500 0.02826 86,828 2,453 428,006 0.97195 3,572,254 41.14
20 5 0.00565 2.500 0.02784 84,375 2,349 416,000 0.95922 3,144,248 37.27
25 5 0.01112 2.500 0.05409 82,025 4,437 399,035 0.93038 2,728,248 33.26
30 5 0.01798 2.500 0.08603 77,589 6,675 371,255 0.89188 2,329,213 30.02
35 5 0.02833 2.500 0.13228 70,913 9,381 331,115 0.86856 1,957,958 27.61
40 5 0.02792 2.500 0.13047 61,533 8,028 287,592 0.87737 1,626,843 26.44
45 5 0.02409 2.500 0.11362 53,504 6,079 252,324 0.89859 1,339,251 25.03
50 5 0.01833 2.500 0.08765 47,425 4,157 226,735 0.90854 1,086,927 22.92
55 5 0.02009 2.500 0.09564 43,269 4,138 205,998 0.89388 860,192 19.88
60 5 0.02501 2.500 0.11771 39,130 4,606 184,137 0.86282 654,194 16.72
65 5 0.03461 2.500 0.15925 34,524 5,498 158,877 0.80751 470,058 13.62
70 5 0.05250 2.500 0.23203 29,026 6,735 128,295 0.72017 311,181 10.72
75 5 0.08253 2.500 0.34208 22,291 7,625 92,394 0.49480 182,886 8.20
80 + 0.16207 6.170 1.00000 14,666 14,666 90,492 90,492 6.17
Abridged Life Table Based on Deaths and Population: Female
Age,
x
Width,
n nMx nax nqx lx ndx nLx 5Px Tx ex
0 1 0.05105 0.197 0.04904 100,000 4,904 96,062 0.94099 5,643,765 56.44
1 4 0.00677 1.653 0.02665 95,096 2,534 374,435 0.97517 5,547,703 58.34
5 5 0.00348 2.500 0.01726 92,561 1,597 458,813 0.98201 5,173,268 55.89
10 5 0.00378 2.500 0.01873 90,964 1,704 450,560 0.98208 4,714,455 51.83
15 5 0.00345 2.500 0.01710 89,260 1,526 442,484 0.97972 4,263,895 47.77
20 5 0.00476 2.500 0.02352 87,734 2,063 433,510 0.96439 3,821,411 43.56
25 5 0.00984 2.500 0.04800 85,670 4,112 418,072 0.94411 3,387,901 39.55
30 5 0.01326 2.500 0.06419 81,558 5,235 394,704 0.92387 2,969,829 36.41
35 5 0.01860 2.500 0.08888 76,323 6,784 364,657 0.91806 2,575,125 33.74
40 5 0.01544 2.500 0.07432 69,539 5,168 334,777 0.93273 2,210,468 31.79
45 5 0.01230 2.500 0.05965 64,371 3,840 312,257 0.94363 1,875,692 29.14
50 5 0.01087 2.500 0.05289 60,532 3,202 294,654 0.94499 1,563,435 25.83
55 5 0.01179 2.500 0.05724 57,330 3,282 278,446 0.93100 1,268,781 22.13
60 5 0.01699 2.500 0.08148 54,048 4,404 259,232 0.89667 990,335 18.32
65 5 0.02715 2.500 0.12712 49,645 6,311 232,446 0.83868 731,103 14.73
70 5 0.04457 2.500 0.20051 43,334 8,689 194,947 0.75163 498,657 11.51
75 5 0.07288 2.500 0.30823 34,645 10,679 146,528 0.51754 303,710 8.77
80 + 0.15247 6.559 1.00000 23,966 23,966 157,182 157,182 6.56

93
Katavi
Abridged Life Table Based on Deaths and Population: Male
Age,
x
Width,
n nMx nax nqx lx ndx nLx 5Px Tx ex
0 1 0.06759 0.227 0.06423 100,000 6,423 95,036 0.92388 5,386,319 53.86
1 4 0.00864 1.665 0.03388 93,577 3,171 366,905 0.96880 5,291,283 56.54
5 5 0.00402 2.500 0.01991 90,406 1,800 447,530 0.98111 4,924,378 54.47
10 5 0.00360 2.500 0.01784 88,606 1,581 439,077 0.98044 4,476,849 50.53
15 5 0.00431 2.500 0.02132 87,025 1,855 430,487 0.97716 4,037,771 46.40
20 5 0.00494 2.500 0.02440 85,170 2,078 420,655 0.96919 3,607,284 42.35
25 5 0.00762 2.500 0.03738 83,092 3,106 407,695 0.95455 3,186,629 38.35
30 5 0.01106 2.500 0.05383 79,986 4,306 389,165 0.93424 2,778,934 34.74
35 5 0.01631 2.500 0.07836 75,680 5,931 363,574 0.92054 2,389,768 31.58
40 5 0.01681 2.500 0.08065 69,750 5,625 334,685 0.92135 2,026,194 29.05
45 5 0.01590 2.500 0.07647 64,124 4,904 308,363 0.92571 1,691,509 26.38
50 5 0.01492 2.500 0.07192 59,221 4,259 285,455 0.92183 1,383,147 23.36
55 5 0.01774 2.500 0.08491 54,962 4,667 263,141 0.90124 1,097,692 19.97
60 5 0.02415 2.500 0.11389 50,295 5,728 237,153 0.86369 834,551 16.59
65 5 0.03517 2.500 0.16162 44,567 7,203 204,827 0.80306 597,398 13.40
70 5 0.05431 2.500 0.23907 37,364 8,933 164,488 0.71192 392,571 10.51
75 5 0.08558 2.500 0.35249 28,431 10,022 117,102 0.48658 228,082 8.02
80 + 0.16588 6.028 1.00000 18,409 18,409 110,980 110,980 6.03
Abridged Life Table Based on Deaths and Population: Female
Age,
x
Width,
n nMx nax nqx lx ndx nLx 5Px Tx ex
0 1 0.05428 0.206 0.05204 100,000 5,204 95,869 0.93702 6,088,900 60.89
1 4 0.00747 1.648 0.02936 94,796 2,783 372,639 0.97457 5,993,031 63.22
5 5 0.00304 2.500 0.01508 92,013 1,387 456,596 0.98631 5,620,392 61.08
10 5 0.00247 2.500 0.01227 90,625 1,112 450,346 0.98736 5,163,796 56.98
15 5 0.00262 2.500 0.01300 89,513 1,164 444,656 0.98496 4,713,450 52.66
20 5 0.00345 2.500 0.01710 88,349 1,510 437,970 0.97790 4,268,794 48.32
25 5 0.00551 2.500 0.02719 86,839 2,361 428,291 0.96929 3,830,824 44.11
30 5 0.00699 2.500 0.03433 84,478 2,900 415,138 0.96036 3,402,532 40.28
35 5 0.00923 2.500 0.04513 81,578 3,682 398,684 0.95579 2,987,394 36.62
40 5 0.00884 2.500 0.04325 77,896 3,369 381,056 0.95787 2,588,711 33.23
45 5 0.00836 2.500 0.04095 74,527 3,052 365,002 0.95666 2,207,655 29.62
50 5 0.00938 2.500 0.04582 71,474 3,275 349,185 0.94897 1,842,652 25.78
55 5 0.01163 2.500 0.05648 68,200 3,852 331,367 0.93018 1,493,467 21.90
60 5 0.01753 2.500 0.08396 64,347 5,403 308,230 0.89303 1,162,100 18.06
65 5 0.02828 2.500 0.13208 58,945 7,786 275,259 0.83283 853,870 14.49
70 5 0.04633 2.500 0.20759 51,159 10,620 229,244 0.74416 578,611 11.31
75 5 0.07527 2.500 0.31674 40,539 12,840 170,594 0.51171 349,367 8.62
80 + 0.15494 6.454 1.00000 27,699 27,699 178,773 178,773 6.45

94
Simiyu
Abridged Life Table Based on Deaths and Population: Male
Age,
x
Width,
n nMx nax nqx lx ndx nLx 5Px Tx ex
0 1 0.04331 0.163 0.04179 100,000 4,179 96,500 0.95294 6,319,606 63.20
1 4 0.00384 1.733 0.01525 95,821 1,461 379,971 0.98524 6,223,105 64.95
5 5 0.00201 2.500 0.01001 94,360 944 469,438 0.99049 5,843,135 61.92
10 5 0.00181 2.500 0.00901 93,415 842 464,973 0.98911 5,373,697 57.52
15 5 0.00257 2.500 0.01278 92,574 1,184 459,909 0.98562 4,908,724 53.03
20 5 0.00323 2.500 0.01600 91,390 1,463 453,294 0.98137 4,448,815 48.68
25 5 0.00431 2.500 0.02130 89,927 1,916 444,848 0.97501 3,995,521 44.43
30 5 0.00584 2.500 0.02876 88,012 2,531 433,731 0.96584 3,550,673 40.34
35 5 0.00810 2.500 0.03972 85,481 3,395 418,916 0.95884 3,116,941 36.46
40 5 0.00872 2.500 0.04267 82,086 3,502 401,673 0.95664 2,698,025 32.87
45 5 0.00901 2.500 0.04408 78,583 3,464 384,258 0.95311 2,296,353 29.22
50 5 0.01022 2.500 0.04983 75,120 3,743 366,241 0.94414 1,912,095 25.45
55 5 0.01284 2.500 0.06220 71,377 4,440 345,785 0.92394 1,545,853 21.66
60 5 0.01903 2.500 0.09084 66,937 6,080 319,485 0.88759 1,200,068 17.93
65 5 0.02922 2.500 0.13614 60,857 8,285 283,572 0.83112 880,583 14.47
70 5 0.04613 2.500 0.20678 52,572 10,871 235,682 0.74511 597,011 11.36
75 5 0.07493 2.500 0.31554 41,701 13,158 175,609 0.51399 361,328 8.66
80 + 0.15369 6.507 1.00000 28,543 28,543 185,719 185,719 6.51
Abridged Life Table Based on Deaths and Population: Female
Age,
x
Width,
n nMx nax nqx lx ndx nLx 5Px Tx ex
0 1 0.03822 0.161 0.03703 100,000 3,703 96,894 0.95715 6,598,343 65.98
1 4 0.00395 1.673 0.01564 96,297 1,506 381,682 0.98590 6,501,450 67.51
5 5 0.00180 2.500 0.00896 94,791 850 471,829 0.99136 6,119,767 64.56
10 5 0.00167 2.500 0.00832 93,941 781 467,751 0.99125 5,647,939 60.12
15 5 0.00185 2.500 0.00919 93,159 856 463,657 0.98913 5,180,188 55.61
20 5 0.00253 2.500 0.01258 92,303 1,161 458,615 0.98347 4,716,531 51.10
25 5 0.00415 2.500 0.02054 91,143 1,872 451,033 0.97673 4,257,916 46.72
30 5 0.00528 2.500 0.02606 89,271 2,326 440,538 0.96974 3,806,882 42.64
35 5 0.00704 2.500 0.03458 86,945 3,006 427,207 0.96588 3,366,344 38.72
40 5 0.00684 2.500 0.03364 83,938 2,824 412,631 0.96702 2,939,137 35.02
45 5 0.00656 2.500 0.03229 81,114 2,619 399,023 0.96516 2,526,506 31.15
50 5 0.00764 2.500 0.03748 78,495 2,942 385,120 0.95823 2,127,483 27.10
55 5 0.00946 2.500 0.04623 75,553 3,493 369,034 0.94188 1,742,363 23.06
60 5 0.01463 2.500 0.07058 72,060 5,086 347,587 0.90847 1,373,329 19.06
65 5 0.02420 2.500 0.11408 66,974 7,640 315,771 0.85308 1,025,743 15.32
70 5 0.04053 2.500 0.18399 59,334 10,917 269,378 0.76867 709,971 11.97
75 5 0.06766 2.500 0.28935 48,417 14,009 207,062 0.53004 440,593 9.10
80 + 0.14734 6.787 1.00000 34,408 34,408 233,531 233,531 6.79

95
Geita
Abridged Life Table Based on Deaths and Population: Male
Age,
x
Width,
n nMx nax nqx lx ndx nLx 5Px Tx ex
0 1 0.04577 0.169 0.04409 100,000 4,409 96,337 0.94960 6,161,262 61.61
1 4 0.00453 1.726 0.01794 95,591 1,715 378,464 0.98295 6,064,924 63.45
5 5 0.00229 2.500 0.01139 93,876 1,069 466,708 0.98909 5,686,460 60.57
10 5 0.00210 2.500 0.01043 92,807 968 461,616 0.98771 5,219,753 56.24
15 5 0.00286 2.500 0.01418 91,839 1,302 455,941 0.98431 4,758,137 51.81
20 5 0.00348 2.500 0.01723 90,537 1,560 448,785 0.97940 4,302,197 47.52
25 5 0.00486 2.500 0.02402 88,977 2,138 439,542 0.97139 3,853,411 43.31
30 5 0.00677 2.500 0.03331 86,840 2,892 426,967 0.95998 3,413,869 39.31
35 5 0.00962 2.500 0.04696 83,947 3,942 409,881 0.95172 2,986,903 35.58
40 5 0.01019 2.500 0.04967 80,005 3,974 390,091 0.95025 2,577,022 32.21
45 5 0.01022 2.500 0.04983 76,031 3,789 370,684 0.94846 2,186,931 28.76
50 5 0.01096 2.500 0.05334 72,243 3,853 351,580 0.94068 1,816,247 25.14
55 5 0.01357 2.500 0.06564 68,389 4,489 330,724 0.92063 1,464,667 21.42
60 5 0.01974 2.500 0.09407 63,900 6,011 304,474 0.88435 1,133,943 17.75
65 5 0.02999 2.500 0.13947 57,889 8,074 269,261 0.82752 829,469 14.33
70 5 0.04714 2.500 0.21083 49,815 10,503 222,819 0.74097 560,208 11.25
75 5 0.07622 2.500 0.32011 39,312 12,584 165,102 0.51065 337,390 8.58
80 + 0.15514 6.446 1.00000 26,728 26,728 172,288 172,288 6.45
Abridged Life Table Based on Deaths and Population: Female
Age,
x
Width,
n nMx nax nqx lx ndx nLx 5Px Tx ex
0 1 0.03898 0.163 0.03775 100,000 3,775 96,842 0.95578 6,475,337 64.75
1 4 0.00434 1.672 0.01719 96,225 1,654 381,050 0.98458 6,378,496 66.29
5 5 0.00198 2.500 0.00986 94,571 933 470,524 0.99027 5,997,446 63.42
10 5 0.00193 2.500 0.00959 93,639 898 465,948 0.99016 5,526,922 59.02
15 5 0.00203 2.500 0.01009 92,741 936 461,363 0.98803 5,060,974 54.57
20 5 0.00279 2.500 0.01387 91,805 1,273 455,840 0.98112 4,599,610 50.10
25 5 0.00485 2.500 0.02397 90,531 2,170 447,232 0.97266 4,143,770 45.77
30 5 0.00626 2.500 0.03080 88,361 2,722 435,003 0.96395 3,696,538 41.83
35 5 0.00847 2.500 0.04146 85,640 3,551 419,323 0.95987 3,261,535 38.08
40 5 0.00790 2.500 0.03874 82,089 3,180 402,497 0.96279 2,842,212 34.62
45 5 0.00725 2.500 0.03562 78,910 2,810 387,521 0.96259 2,439,715 30.92
50 5 0.00801 2.500 0.03928 76,099 2,989 373,023 0.95673 2,052,194 26.97
55 5 0.00972 2.500 0.04743 73,110 3,468 356,882 0.94075 1,679,171 22.97
60 5 0.01486 2.500 0.07165 69,643 4,990 335,738 0.90734 1,322,289 18.99
65 5 0.02447 2.500 0.11528 64,653 7,453 304,630 0.85175 986,551 15.26
70 5 0.04090 2.500 0.18552 57,199 10,612 259,468 0.76707 681,921 11.92
75 5 0.06815 2.500 0.29115 46,588 13,564 199,029 0.52887 422,453 9.07
80 + 0.14781 6.766 1.00000 33,024 33,024 223,425 223,425 6.77

96
Kaskazini Unguja
Abridged Life Table Based on Deaths and Population: Male
Age,
x
Width,
n nMx nax nqx lx ndx nLx 5Px Tx ex
0 1 0.04912 0.178 0.04721 100,000 4,721 96,120 0.94554 6,444,669 64.45
1 4 0.00519 1.717 0.02053 95,279 1,956 376,650 0.98177 6,348,549 66.63
5 5 0.00212 2.500 0.01056 93,323 986 464,151 0.99128 5,971,899 63.99
10 5 0.00138 2.500 0.00685 92,337 633 460,104 0.99103 5,507,748 59.65
15 5 0.00223 2.500 0.01110 91,704 1,018 455,977 0.98651 5,047,644 55.04
20 5 0.00321 2.500 0.01590 90,686 1,442 449,828 0.98388 4,591,667 50.63
25 5 0.00329 2.500 0.01634 89,245 1,458 442,578 0.98290 4,141,839 46.41
30 5 0.00361 2.500 0.01788 87,787 1,569 435,010 0.98095 3,699,261 42.14
35 5 0.00409 2.500 0.02024 86,217 1,745 426,723 0.97732 3,264,252 37.86
40 5 0.00510 2.500 0.02516 84,472 2,125 417,047 0.97146 2,837,528 33.59
45 5 0.00651 2.500 0.03201 82,347 2,636 405,143 0.96092 2,420,482 29.39
50 5 0.00950 2.500 0.04639 79,710 3,698 389,308 0.94637 2,015,339 25.28
55 5 0.01263 2.500 0.06123 76,013 4,654 368,428 0.92336 1,626,031 21.39
60 5 0.01952 2.500 0.09305 71,358 6,640 340,192 0.88391 1,257,604 17.62
65 5 0.03045 2.500 0.14148 64,718 9,157 300,701 0.82450 917,411 14.18
70 5 0.04821 2.500 0.21513 55,562 11,953 247,926 0.73586 616,711 11.10
75 5 0.07806 2.500 0.32658 43,609 14,242 182,439 0.50530 368,784 8.46
80 + 0.15759 6.345 1.00000 29,367 29,367 186,346 186,346 6.35
Abridged Life Table Based on Deaths and Population: Female
Age,
x
Width,
n nMx nax nqx lx ndx nLx 5Px Tx ex
0 1 0.03811 0.161 0.03693 100,000 3,693 96,901 0.95728 6,881,648 68.82
1 4 0.00393 1.673 0.01558 96,307 1,500 381,738 0.98668 6,784,747 70.45
5 5 0.00150 2.500 0.00748 94,807 709 472,263 0.99361 6,403,008 67.54
10 5 0.00106 2.500 0.00529 94,098 498 469,245 0.99379 5,930,746 63.03
15 5 0.00143 2.500 0.00713 93,600 668 466,333 0.99170 5,461,500 58.35
20 5 0.00190 2.500 0.00947 92,933 881 462,463 0.98973 4,995,168 53.75
25 5 0.00223 2.500 0.01106 92,052 1,019 457,715 0.98824 4,532,705 49.24
30 5 0.00251 2.500 0.01246 91,034 1,134 452,333 0.98647 4,074,990 44.76
35 5 0.00294 2.500 0.01460 89,899 1,313 446,215 0.98301 3,622,656 40.30
40 5 0.00392 2.500 0.01941 88,587 1,720 438,634 0.97853 3,176,441 35.86
45 5 0.00477 2.500 0.02356 86,867 2,047 429,217 0.97141 2,737,808 31.52
50 5 0.00686 2.500 0.03374 84,820 2,862 416,946 0.96072 2,308,591 27.22
55 5 0.00921 2.500 0.04502 81,958 3,690 400,567 0.94261 1,891,645 23.08
60 5 0.01458 2.500 0.07034 78,269 5,505 377,581 0.90853 1,491,078 19.05
65 5 0.02422 2.500 0.11420 72,764 8,310 343,043 0.85296 1,113,497 15.30
70 5 0.04056 2.500 0.18412 64,454 11,867 292,601 0.76856 770,454 11.95
75 5 0.06768 2.500 0.28944 52,587 15,220 224,882 0.52939 477,853 9.09
80 + 0.14771 6.770 1.00000 37,366 37,366 252,970 252,970 6.77

97
Kusini Unguja
Abridged Life Table Based on Deaths and Population: Male
Age,
x
Width,
n nMx nax nqx lx ndx nLx 5Px Tx ex
0 1 0.06662 0.225 0.06335 100,000 6,335 95,088 0.92485 6,005,963 60.06
1 4 0.00855 1.668 0.03353 93,665 3,140 367,337 0.97093 5,910,875 63.11
5 5 0.00324 2.500 0.01609 90,525 1,457 448,982 0.98703 5,543,538 61.24
10 5 0.00197 2.500 0.00980 89,068 873 443,158 0.98804 5,094,556 57.20
15 5 0.00285 2.500 0.01415 88,195 1,248 437,856 0.98288 4,651,398 52.74
20 5 0.00406 2.500 0.02012 86,947 1,749 430,362 0.97954 4,213,543 48.46
25 5 0.00421 2.500 0.02082 85,198 1,774 421,554 0.97825 3,783,181 44.40
30 5 0.00459 2.500 0.02271 83,424 1,894 412,385 0.97576 3,361,626 40.30
35 5 0.00523 2.500 0.02582 81,530 2,105 402,387 0.97121 2,949,242 36.17
40 5 0.00647 2.500 0.03185 79,425 2,529 390,801 0.96425 2,546,855 32.07
45 5 0.00812 2.500 0.03978 76,896 3,059 376,831 0.95272 2,156,054 28.04
50 5 0.01133 2.500 0.05509 73,837 4,067 359,015 0.93668 1,779,223 24.10
55 5 0.01494 2.500 0.07203 69,769 5,026 336,282 0.91143 1,420,209 20.36
60 5 0.02247 2.500 0.10638 64,744 6,888 306,499 0.86907 1,083,927 16.74
65 5 0.03440 2.500 0.15840 57,856 9,164 266,369 0.80526 777,428 13.44
70 5 0.05401 2.500 0.23793 48,692 11,585 214,495 0.71194 511,058 10.50
75 5 0.08598 2.500 0.35385 37,106 13,130 152,707 0.48508 296,563 7.99
80 + 0.16667 6.000 1.00000 23,976 23,976 143,856 143,856 6.00
Abridged Life Table Based on Deaths and Population: Female
Age,
x
Width,
n nMx nax nqx lx ndx nLx 5Px Tx ex
0 1 0.05218 0.200 0.05009 100,000 5,009 95,994 0.93942 6,451,060 64.51
1 4 0.00711 1.651 0.02799 94,991 2,659 373,718 0.97662 6,355,066 66.90
5 5 0.00255 2.500 0.01269 92,332 1,172 458,730 0.98955 5,981,348 64.78
10 5 0.00164 2.500 0.00818 91,160 746 453,936 0.99084 5,522,618 60.58
15 5 0.00204 2.500 0.01015 90,414 917 449,778 0.98850 5,068,682 56.06
20 5 0.00259 2.500 0.01288 89,497 1,153 444,603 0.98604 4,618,904 51.61
25 5 0.00303 2.500 0.01506 88,344 1,330 438,396 0.98389 4,174,301 47.25
30 5 0.00346 2.500 0.01717 87,014 1,494 431,335 0.98141 3,735,905 42.93
35 5 0.00405 2.500 0.02004 85,520 1,714 423,314 0.97743 3,304,571 38.64
40 5 0.00510 2.500 0.02516 83,806 2,108 413,759 0.97268 2,881,257 34.38
45 5 0.00600 2.500 0.02954 81,698 2,413 402,455 0.96509 2,467,498 30.20
50 5 0.00826 2.500 0.04045 79,284 3,207 388,404 0.95298 2,065,043 26.05
55 5 0.01107 2.500 0.05388 76,077 4,099 370,139 0.93234 1,676,639 22.04
60 5 0.01715 2.500 0.08224 71,979 5,919 345,095 0.89474 1,306,499 18.15
65 5 0.02789 2.500 0.13034 66,059 8,610 308,771 0.83477 961,405 14.55
70 5 0.04577 2.500 0.20534 57,449 11,797 257,754 0.74637 652,634 11.36
75 5 0.07461 2.500 0.31439 45,652 14,353 192,380 0.51281 394,880 8.65
80 + 0.15457 6.470 1.00000 31,300 31,300 202,500 202,500 6.47

98
Mjini Magharibi
Abridged Life Table Based on Deaths and Population: Male
Age,
x
Width,
n nMx nax nqx lx ndx nLx 5Px Tx ex
0 1 0.05602 0.197 0.05360 100,000 5,360 95,694 0.93714 6,259,090 62.59
1 4 0.00662 1.697 0.02607 94,640 2,467 372,878 0.97724 6,163,397 65.12
5 5 0.00258 2.500 0.01282 92,173 1,182 457,909 0.98955 5,790,519 62.82
10 5 0.00162 2.500 0.00806 90,991 733 453,121 0.98980 5,332,610 58.61
15 5 0.00249 2.500 0.01236 90,258 1,116 448,499 0.98502 4,879,489 54.06
20 5 0.00356 2.500 0.01764 89,142 1,572 441,779 0.98209 4,430,989 49.71
25 5 0.00367 2.500 0.01819 87,570 1,592 433,867 0.98098 3,989,210 45.55
30 5 0.00401 2.500 0.01987 85,977 1,708 425,615 0.97881 3,555,343 41.35
35 5 0.00456 2.500 0.02255 84,269 1,900 416,595 0.97480 3,129,727 37.14
40 5 0.00566 2.500 0.02793 82,369 2,300 406,095 0.96847 2,713,132 32.94
45 5 0.00717 2.500 0.03524 80,069 2,821 393,291 0.95751 2,307,038 28.81
50 5 0.01026 2.500 0.05001 77,247 3,863 376,579 0.94233 1,913,747 24.77
55 5 0.01359 2.500 0.06574 73,384 4,824 354,860 0.91838 1,537,168 20.95
60 5 0.02075 2.500 0.09863 68,560 6,762 325,895 0.87769 1,182,308 17.24
65 5 0.03210 2.500 0.14857 61,798 9,182 286,036 0.81642 856,413 13.86
70 5 0.05063 2.500 0.22470 52,616 11,823 233,525 0.72580 570,377 10.84
75 5 0.08136 2.500 0.33804 40,794 13,790 169,493 0.49683 336,852 8.26
80 + 0.16135 6.198 1.00000 27,004 27,004 167,359 167,359 6.20
Abridged Life Table Based on Deaths and Population: Female
Age,
x
Width,
n nMx nax nqx lx ndx nLx 5Px Tx ex
0 1 0.04179 0.171 0.04039 100,000 4,039 96,652 0.95213 6,747,939 67.48
1 4 0.00501 1.667 0.01979 95,961 1,900 379,412 0.98344 6,651,286 69.31
5 5 0.00182 2.500 0.00903 94,061 850 468,182 0.99240 6,271,874 66.68
10 5 0.00123 2.500 0.00615 93,212 574 464,624 0.99291 5,803,692 62.26
15 5 0.00161 2.500 0.00804 92,638 744 461,329 0.99074 5,339,068 57.63
20 5 0.00211 2.500 0.01050 91,894 965 457,056 0.98862 4,877,740 53.08
25 5 0.00247 2.500 0.01227 90,929 1,115 451,856 0.98693 4,420,684 48.62
30 5 0.00280 2.500 0.01388 89,813 1,247 445,951 0.98495 3,968,828 44.19
35 5 0.00328 2.500 0.01624 88,567 1,439 439,238 0.98132 3,522,877 39.78
40 5 0.00428 2.500 0.02115 87,128 1,843 431,034 0.97675 3,083,639 35.39
45 5 0.00514 2.500 0.02538 85,285 2,165 421,014 0.96948 2,652,605 31.10
50 5 0.00729 2.500 0.03579 83,120 2,975 408,165 0.95835 2,231,590 26.85
55 5 0.00978 2.500 0.04773 80,145 3,825 391,164 0.93946 1,823,425 22.75
60 5 0.01537 2.500 0.07399 76,320 5,647 367,483 0.90429 1,432,262 18.77
65 5 0.02534 2.500 0.11917 70,673 8,422 332,310 0.84735 1,064,778 15.07
70 5 0.04215 2.500 0.19067 62,251 11,869 281,582 0.76170 732,468 11.77
75 5 0.06980 2.500 0.29716 50,382 14,971 214,480 0.52432 450,887 8.95
80 + 0.14979 6.676 1.00000 35,410 35,410 236,407 236,407 6.68

99
Kaskazini Pemba
Abridged Life Table Based on Deaths and Population: Male
Age,
x
Width,
n nMx nax nqx lx ndx nLx 5Px Tx ex
0 1 0.04776 0.175 0.04595 100,000 4,595 96,207 0.94723 6,483,202 64.83
1 4 0.00490 1.721 0.01938 95,405 1,849 377,407 0.98269 6,386,995 66.95
5 5 0.00203 2.500 0.01011 93,556 946 465,418 0.99163 6,009,588 64.23
10 5 0.00133 2.500 0.00661 92,611 612 461,523 0.99128 5,544,171 59.87
15 5 0.00218 2.500 0.01085 91,999 998 457,498 0.98682 5,082,648 55.25
20 5 0.00313 2.500 0.01555 91,001 1,415 451,467 0.98425 4,625,150 50.83
25 5 0.00322 2.500 0.01596 89,586 1,430 444,355 0.98329 4,173,683 46.59
30 5 0.00353 2.500 0.01747 88,156 1,540 436,929 0.98139 3,729,327 42.30
35 5 0.00399 2.500 0.01978 86,616 1,713 428,797 0.97784 3,292,398 38.01
40 5 0.00498 2.500 0.02460 84,903 2,088 419,293 0.97206 2,863,602 33.73
45 5 0.00637 2.500 0.03136 82,814 2,597 407,580 0.96161 2,444,308 29.52
50 5 0.00934 2.500 0.04565 80,218 3,662 391,934 0.94719 2,036,728 25.39
55 5 0.01244 2.500 0.06031 76,556 4,617 371,237 0.92438 1,644,794 21.48
60 5 0.01927 2.500 0.09191 71,939 6,612 343,165 0.88519 1,273,558 17.70
65 5 0.03011 2.500 0.14003 65,327 9,148 303,767 0.82616 930,393 14.24
70 5 0.04772 2.500 0.21316 56,180 11,976 250,960 0.73793 626,625 11.15
75 5 0.07739 2.500 0.32422 44,204 14,332 185,191 0.50703 375,666 8.50
80 + 0.15683 6.376 1.00000 29,872 29,872 190,475 190,475 6.38
Abridged Life Table Based on Deaths and Population: Female
Age,
x
Width,
n nMx nax nqx lx ndx nLx 5Px Tx ex
0 1 0.04218 0.172 0.04076 100,000 4,076 96,626 0.95205 6,751,616 67.52
1 4 0.00486 1.667 0.01920 95,924 1,842 379,399 0.98376 6,654,990 69.38
5 5 0.00181 2.500 0.00899 94,082 846 468,297 0.99243 6,275,590 66.70
10 5 0.00123 2.500 0.00613 93,237 571 464,754 0.99293 5,807,293 62.29
15 5 0.00161 2.500 0.00801 92,665 742 461,470 0.99077 5,342,539 57.65
20 5 0.00210 2.500 0.01047 91,923 962 457,209 0.98865 4,881,069 53.10
25 5 0.00246 2.500 0.01223 90,961 1,113 452,022 0.98697 4,423,859 48.63
30 5 0.00279 2.500 0.01384 89,848 1,243 446,133 0.98499 3,971,837 44.21
35 5 0.00327 2.500 0.01620 88,605 1,435 439,437 0.98137 3,525,704 39.79
40 5 0.00427 2.500 0.02110 87,170 1,839 431,251 0.97681 3,086,268 35.41
45 5 0.00513 2.500 0.02533 85,330 2,161 421,248 0.96954 2,655,017 31.11
50 5 0.00728 2.500 0.03573 83,169 2,972 408,415 0.95842 2,233,769 26.86
55 5 0.00976 2.500 0.04765 80,197 3,822 391,432 0.93955 1,825,354 22.76
60 5 0.01534 2.500 0.07388 76,376 5,643 367,770 0.90441 1,433,922 18.77
65 5 0.02531 2.500 0.11903 70,733 8,419 332,615 0.84751 1,066,152 15.07
70 5 0.04211 2.500 0.19048 62,313 11,869 281,894 0.76189 733,537 11.77
75 5 0.06974 2.500 0.29694 50,444 14,979 214,773 0.52446 451,643 8.95
80 + 0.14972 6.679 1.00000 35,465 35,465 236,870 236,870 6.68

100
Kusini Pemba
Abridged Life Table Based on Deaths and Population: Male
Age,
x
Width,
n nMx nax nqx lx ndx nLx 5Px Tx ex
0 1 0.04781 0.175 0.04600 100,000 4,600 96,204 0.94710 6,479,607 64.80
1 4 0.00494 1.720 0.01956 95,400 1,866 377,348 0.98257 6,383,403 66.91
5 5 0.00204 2.500 0.01015 93,534 950 465,298 0.99160 6,006,055 64.21
10 5 0.00133 2.500 0.00663 92,585 614 461,389 0.99126 5,540,757 59.85
15 5 0.00219 2.500 0.01087 91,971 1,000 457,355 0.98679 5,079,368 55.23
20 5 0.00314 2.500 0.01558 90,971 1,417 451,313 0.98421 4,622,012 50.81
25 5 0.00323 2.500 0.01600 89,554 1,433 444,188 0.98325 4,170,699 46.57
30 5 0.00353 2.500 0.01751 88,121 1,543 436,749 0.98135 3,726,510 42.29
35 5 0.00400 2.500 0.01982 86,578 1,716 428,602 0.97779 3,289,761 38.00
40 5 0.00499 2.500 0.02465 84,863 2,092 419,083 0.97201 2,861,159 33.72
45 5 0.00638 2.500 0.03142 82,771 2,601 407,352 0.96155 2,442,076 29.50
50 5 0.00936 2.500 0.04572 80,170 3,665 391,688 0.94712 2,034,724 25.38
55 5 0.01245 2.500 0.06039 76,505 4,620 370,974 0.92429 1,643,036 21.48
60 5 0.01929 2.500 0.09201 71,885 6,614 342,887 0.88507 1,272,062 17.70
65 5 0.03015 2.500 0.14016 65,270 9,148 303,480 0.82600 929,175 14.24
70 5 0.04776 2.500 0.21335 56,122 11,973 250,676 0.73774 625,695 11.15
75 5 0.07745 2.500 0.32444 44,148 14,324 184,933 0.50687 375,019 8.49
80 + 0.15690 6.373 1.00000 29,825 29,825 190,087 190,087 6.37
Abridged Life Table Based on Deaths and Population: Female
Age,
x
Width,
n nMx nax nqx lx ndx nLx 5Px Tx ex
0 1 0.04735 0.187 0.04559 100,000 4,559 96,292 0.94526 6,584,619 65.85
1 4 0.00616 1.659 0.02429 95,441 2,318 376,337 0.97974 6,488,326 67.98
5 5 0.00221 2.500 0.01101 93,123 1,025 463,052 0.99086 6,111,990 65.63
10 5 0.00146 2.500 0.00725 92,098 668 458,821 0.99179 5,648,938 61.34
15 5 0.00184 2.500 0.00918 91,430 839 455,053 0.98952 5,190,117 56.77
20 5 0.00237 2.500 0.01179 90,591 1,068 450,286 0.98722 4,735,064 52.27
25 5 0.00278 2.500 0.01378 89,523 1,234 444,532 0.98528 4,284,778 47.86
30 5 0.00316 2.500 0.01566 88,290 1,383 437,990 0.98303 3,840,246 43.50
35 5 0.00369 2.500 0.01830 86,907 1,591 430,556 0.97921 3,402,256 39.15
40 5 0.00472 2.500 0.02333 85,316 1,991 421,603 0.97454 2,971,700 34.83
45 5 0.00561 2.500 0.02765 83,325 2,304 410,867 0.96708 2,550,097 30.60
50 5 0.00782 2.500 0.03834 81,021 3,106 397,342 0.95541 2,139,230 26.40
55 5 0.01049 2.500 0.05109 77,915 3,981 379,624 0.93556 1,741,889 22.36
60 5 0.01634 2.500 0.07850 73,935 5,804 355,162 0.89906 1,362,264 18.43
65 5 0.02673 2.500 0.12529 68,130 8,536 319,311 0.84045 1,007,102 14.78
70 5 0.04413 2.500 0.19872 59,594 11,843 268,364 0.75328 687,791 11.54
75 5 0.07243 2.500 0.30663 47,752 14,642 202,153 0.51803 419,427 8.78
80 + 0.15239 6.562 1.00000 33,110 33,110 217,274 217,274 6.56

101
Appendix 2: District Childhood Mortality, Tanzania 2012 Census
Area/Region/District
IMR CMR U5MR
Both
Sexes Male Female
Both
Sexes Male Female
Both
Sexes Male Female
Tanzania 46.2 50.9 41.3 21.3 23.0 19.7 66.5 72.7 60.2
Urban 48.5 53.9 42.9 23.9 25.9 21.8 71.2 78.4 63.8
Rural 46.0 50.5 41.3 20.9 22.4 19.3 65.9 71.8 59.9
Tanzania Mainland 46.2 50.9 41.3 21.3 23.0 19.6 66.5 72.7 60.1
Urban 47.8 53.1 42.3 23.6 25.6 21.5 70.2 77.3 62.9
Rural 45.3 49.7 40.7 20.6 22.1 19.1 64.9 70.6 59.0
Tanzania Zanzibar 46.4 51.0 41.6 22.0 23.6 20.4 67.4 73.3 61.2
Urban 48.0 55.5 40.4 23.5 27.3 19.5 70.3 81.3 59.1
Rural 44.9 49.5 40.1 20.4 22.0 18.7 64.3 70.4 58.0
Dodoma 42.1 47.5 36.5 16.1 18.8 13.4 57.5 65.5 49.4
Kondoa District Council 33.4 36.7 30.1 11.0 11.8 10.2 44.1 48.0 39.9
Mpwapwa District Council 39.8 46.2 33.1 12.6 15.6 9.5 51.9 61.1 42.3
Kongwa District Council 40.6 43.5 37.6 15.2 16.1 14.2 55.1 58.9 51.2
Chamwino District Council 42.5 44.4 40.4 16.5 17.2 15.7 58.2 60.9 55.5
Dodoma Municipal Council 43.6 50.6 36.4 18.4 22.0 14.6 61.2 71.5 50.5
Bahi District Council 45.5 54.5 36.4 16.9 22.1 11.6 61.6 75.3 47.5
Chemba District Council 49.3 58.6 39.6 23.0 28.4 17.6 71.1 85.3 56.5
Arusha 29.0 32.1 25.8 8.6 9.5 7.7 37.3 41.3 33.3
Monduli District Council 27.9 30.6 25.2 7.5 8.1 6.9 35.2 38.4 31.9
Meru District Council 32.8 32.8 32.8 9.7 9.4 10.1 42.2 41.9 42.5
Arusha City Council 31.7 40.9 22.2 9.0 12.2 5.7 40.4 52.5 27.8
Karatu District Council 34.2 35.8 32.5 12.1 11.5 12.8 45.9 46.8 44.9
Ngorongoro District Council 12.6 14.6 10.5 1.8 1.9 1.6 14.3 16.5 12.1
Arusha District Council 32.6 36.4 28.8 10.7 12.0 9.4 43.0 48.0 37.9
Longido District Council 33.9 39.3 28.3 11.5 13.6 9.3 45.0 52.4 37.4
Kilimanjaro 29.6 31.8 27.3 9.2 9.3 9.0 38.5 40.8 36.1
Rombo District Council 31.8 36.7 26.8 10.1 11.1 9.0 41.5 47.3 35.5
Mwanga District Council 27.5 27.9 27.1 8.6 8.0 9.2 35.8 35.7 36.0
Same District Council 26.3 26.8 25.8 6.9 6.6 7.3 33.1 33.2 32.9
Moshi District Council 32.6 36.4 28.7 10.5 10.9 10.0 42.7 46.9 38.4
Hai District Council 30.7 33.0 28.4 9.3 12.5 6.0 39.7 45.1 34.3
Moshi Municipal Council 35.7 38.8 32.5 12.7 12.3 13.2 47.9 50.6 45.2
Siha District Council 28.0 29.1 26.8 7.6 6.7 8.5 35.3 35.6 35.1
Tanga 44.7 48.6 40.8 20.1 21.3 19.0 64.0 68.8 59.0
Lushoto District Council 44.8 45.6 43.9 21.1 20.3 22.0 64.9 65.0 64.9
Korogwe District Council 37.3 41.9 32.5 11.8 14.2 9.3 48.6 55.5 41.5
Muheza District Council 43.1 46.8 39.4 18.5 19.7 17.3 60.8 65.6 56.0
Tanga City Council 39.5 42.8 36.0 16.0 16.8 15.1 54.8 58.9 50.6
Pangani District Council 52.7 59.6 45.7 25.7 29.0 22.4 77.1 86.9 67.0
Handeni District Council 56.9 61.5 52.2 29.5 30.7 28.3 84.8 90.4 79.0
Kilindi District Council 42.1 46.0 38.0 16.0 17.6 14.4 57.4 62.8 51.9
Mkinga District Council 49.7 55.2 43.9 25.5 31.1 19.6 73.8 84.6 62.7
Korogwe Town Council 44.3 46.6 41.9 19.5 19.0 20.1 62.9 64.7 61.1
Handeni Town Council 35.0 38.0 31.9 19.0 20.7 17.3 53.4 57.9 48.7

102
Area/Region/District
IMR CMR U5MR
Both
Sexes Male Female
Both
Sexes Male Female
Both
Sexes Male Female
Morogoro 47.6 54.3 40.7 22.1 25.5 18.7 68.7 78.4 58.6
Kilosa District Council 40.2 43.5 36.7 14.9 15.2 14.5 54.4 58.0 50.7
Morogoro District Council 58.6 62.1 54.9 32.2 34.3 30.1 88.9 94.3 83.3
Kilombero District Council 50.3 57.6 42.8 24.0 27.4 20.4 73.1 83.4 62.4
Ulanga District Council 48.9 57.2 40.3 23.1 27.4 18.6 70.8 83.0 58.1
Morogoro Municipal Council 46.8 55.8 37.6 22.2 27.3 17.0 68.0 81.6 53.9
Mvomero District Council 44.7 53.4 35.8 19.8 24.9 14.6 63.6 76.9 49.9
Gairo District Council 47.6 56.4 38.5 22.3 27.3 17.2 68.8 82.1 55.0
Pwani 51.3 57.0 45.5 25.3 27.6 23.0 75.4 83.1 67.4
Bagamoyo District Council 53.0 57.4 48.5 26.5 27.4 25.5 78.1 83.3 72.8
Kibaha District Council 43.8 49.9 37.5 18.1 21.5 14.6 61.1 70.3 51.5
Kisarawe District Council 55.8 60.5 51.0 30.0 30.7 29.4 84.2 89.3 78.9
Mkuranga District Council 52.0 57.0 46.9 25.4 27.0 23.6 76.0 82.5 69.4
Rufiji District Council 49.4 55.6 43.0 23.7 26.5 20.8 71.9 80.6 62.9
Mafia District Council 61.4 62.9 60.0 37.0 37.2 36.7 96.1 97.7 94.5
Kibaha Town Council 46.2 52.7 39.5 21.2 29.3 12.8 66.4 80.5 51.8
Dar es Salaam 49.0 54.4 43.4 24.6 26.5 22.5 72.3 79.5 64.9
Kinondoni Municipal Council 49.2 55.0 43.2 24.6 26.9 22.3 72.6 80.4 64.5
Ilala Municipal Council 42.4 47.7 37.0 19.1 21.4 16.8 60.7 68.1 53.2
Temeke Municipal Council 54.4 59.3 49.2 29.2 30.6 27.8 82.0 88.1 75.7
Lindi 47.0 56.5 37.2 19.0 24.9 12.8 65.0 80.0 49.5
Kilwa District Council 44.9 55.5 34.0 16.9 23.9 9.7 61.0 78.1 43.4
Lindi District Council 50.7 62.2 38.9 22.1 29.4 14.6 71.7 89.8 53.0
Nachingwea District Council 44.6 50.5 38.5 17.5 20.3 14.7 61.3 69.7 52.6
Liwale District Council 42.2 51.9 32.2 13.3 19.4 7.0 54.8 70.2 39.0
Ruangwa District Council 47.5 58.6 36.2 19.1 26.6 11.4 65.7 83.6 47.2
Lindi Municpal Council 53.7 60.9 46.2 27.7 31.4 23.9 79.9 90.4 69.0
Mtwara 45.2 52.3 38.0 18.0 21.9 13.9 62.3 73.0 51.4
Mtwara District Council 41.7 49.7 33.3 13.8 18.2 9.2 54.8 67.0 42.2
Newala District Council 45.8 54.2 37.1 19.3 24.4 14.0 64.1 77.3 50.6
Masasi District Council 40.1 47.1 32.9 13.4 17.3 9.3 52.9 63.6 41.8
Tandahimba District Council 44.8 49.4 40.0 17.5 19.1 15.7 61.5 67.6 55.1
Mtwara Municipal Council 43.5 47.1 39.8 19.9 22.0 17.8 62.5 68.1 56.9
Nanyumbu District Council 63.4 71.3 55.3 33.0 36.5 29.3 94.2 105.1 83.1
Masasi District Council 36.8 47.0 26.3 11.4 18.5 4.0 47.6 64.6 30.2
Ruvuma 47.6 52.4 42.6 22.2 23.9 20.4 68.7 75.0 62.2
Tunduru District Council 43.3 48.0 38.5 16.0 17.6 14.3 58.6 64.7 52.3
Songea District Council 54.1 55.9 52.2 30.6 30.8 30.5 83.0 84.9 81.1
Mbinga District Council 42.8 47.9 37.5 19.4 21.2 17.5 61.3 68.1 54.3
Songea Municipal Council 47.5 51.8 43.2 22.4 23.4 21.4 68.9 74.0 63.7
Namtumbo District Council 68.1 77.0 58.9 39.0 42.8 35.1 104.4 116.4 92.0
Nyasa District Council 30.9 34.0 27.7 7.1 8.2 6.0 37.8 41.9 33.5

103
Area/Region/District
IMR CMR U5MR
Both
Sexes Male Female
Both
Sexes Male Female
Both
Sexes Male Female
Iringa 59.8 66.6 52.7 33.0 35.8 30.0 90.7 100.0 81.2
Iringa District Council 56.1 60.2 51.9 30.3 32.1 28.4 84.7 90.4 78.8
Mufindi District Council 64.5 69.5 59.4 36.5 36.8 36.2 98.7 103.8 93.5
Iringa Municipal Council 49.1 58.1 39.7 23.6 28.3 18.6 71.4 84.8 57.6
Kilolo District Council 67.5 78.3 56.4 38.8 44.6 32.9 103.6 119.4 87.4
Mafinga Town Council 50.1 58.7 41.2 24.5 28.8 20.0 73.3 85.8 60.4
Mbeya 49.0 53.7 44.2 23.7 25.1 22.2 71.5 77.5 65.5
Chunya District Council 38.2 41.3 35.0 13.7 14.3 13.0 51.4 55.0 47.6
Mbeya District Council 53.1 59.3 46.7 25.9 28.8 23.0 77.6 86.4 68.6
Kyela District Council 42.1 47.9 36.0 17.0 20.4 13.5 58.4 67.4 49.1
Rungwe District Council 47.8 52.8 42.6 23.1 24.9 21.3 69.8 76.4 63.0
Ileje District Council 51.9 59.4 44.2 27.7 31.2 24.0 78.1 88.7 67.1
Mbozi District Council 48.1 51.0 45.1 24.2 23.9 24.5 71.1 73.7 68.5
Mbarali District Council 49.6 54.2 44.9 14.8 24.6 4.6 63.6 77.5 49.4
Mbeya City Council 52.7 57.7 47.5 29.0 30.2 27.8 80.2 86.2 73.9
Momba District Council 57.5 61.8 53.0 30.4 30.9 29.9 86.1 90.8 81.3
Tunduma Town Council 54.9 57.8 51.9 30.8 29.8 31.9 84.0 85.8 82.2
Singida 32.4 35.6 29.2 10.7 11.6 9.7 42.8 46.8 38.6
Iramba District Council 33.6 34.1 33.1 13.6 14.1 13.1 46.8 47.7 45.8
Singida District Council 21.8 25.8 17.6 3.8 4.7 2.9 25.5 30.4 20.5
Manyoni District Council 40.3 43.7 36.8 15.6 16.0 15.1 55.2 59.0 51.3
Singida Municipal Council 34.3 39.0 29.4 12.0 13.9 10.1 45.9 52.3 39.2
Ikungi District Council 29.4 33.8 24.9 7.8 9.7 5.8 37.0 43.2 30.6
Mkalama District Council 33.2 35.4 30.9 11.0 11.0 11.1 43.8 46.0 41.6
Tabora 47.5 52.4 42.4 23.0 24.8 21.2 69.4 75.9 62.6
Nzega District Council 41.6 46.2 36.9 17.4 18.8 16.0 58.3 64.1 52.3
Igunga District Council 42.0 47.1 36.6 17.8 19.6 15.9 59.0 65.8 51.9
Uyui District Council 54.7 57.8 51.4 30.0 31.1 28.9 83.0 87.1 78.8
Urambo District Council 48.7 54.5 42.8 22.7 24.7 20.7 70.3 77.8 62.5
Sikonge District Council 47.4 56.2 38.2 22.2 26.9 17.4 68.5 81.6 55.0
Tabora Municipal Council 57.0 59.1 54.7 32.7 33.4 32.1 87.8 90.6 85.0
Kaliua District Council 49.5 55.3 43.6 23.6 25.6 21.6 71.9 79.4 64.3
Rukwa 54.8 59.9 49.5 27.9 29.4 26.3 81.2 87.6 74.6
Kalambo District Council 53.9 59.6 48.0 25.3 26.5 24.1 77.9 84.5 71.0
Sumbawanga District Council 56.2 58.2 54.0 31.4 32.5 30.3 85.8 88.8 82.7
Nkasi District Council 59.7 68.2 50.9 30.7 33.9 27.4 88.5 99.8 77.0
Sumbawanga Municipal Council 44.7 48.3 41.0 20.0 20.0 20.0 63.8 67.3 60.2
Kigoma 48.9 54.3 43.4 24.0 26.1 21.8 71.7 78.9 64.2
Kibondo District Council 40.7 46.2 34.9 17.4 20.2 14.5 57.3 65.5 48.9
Kasulu District Council 44.0 48.9 39.0 21.0 22.7 19.2 64.1 70.5 57.4
Kigoma District Council 64.0 67.8 60.1 37.4 37.0 37.8 99.1 102.3 95.7
Kigoma-Ujiji Munic. Council 65.4 73.4 57.3 39.3 42.2 36.2 102.1 112.5 91.5
Uvinza District Council 50.2 55.5 44.7 24.9 27.3 22.4 73.8 81.2 66.2
Buhigwe District Council 47.4 51.3 43.4 24.0 24.5 23.4 70.2 74.5 65.8
Kakonko District Council 49.1 56.2 41.8 24.9 28.4 21.2 72.8 83.0 62.2
Kaulu Town Council 36.1 41.0 31.0 14.3 16.6 11.9 49.8 57.0 42.4

104
Area/Region/District
IMR CMR U5MR
Both
Sexes Male Female
Both
Sexes Male Female
Both
Sexes Male Female
Shinyanga 46.2 50.8 41.5 21.6 23.1 20.0 66.7 72.7 60.6
Shinyanga Municipal Council 49.3 53.1 45.3 24.7 25.0 24.4 72.7 76.7 68.6
Kishapu District Council 36.6 39.0 34.1 14.0 14.6 13.3 50.0 53.0 46.9
Shinyanga District Council 36.9 39.2 34.5 14.5 15.4 13.6 50.9 54.1 47.7
Kahama District Council 53.2 60.1 46.1 27.5 30.4 24.5 79.2 88.7 69.5
Kahama Town Council 50.7 55.6 45.6 25.7 26.8 24.6 75.1 80.9 69.1
Kagera 61.8 67.1 56.4 34.2 35.6 32.7 93.9 100.3 87.2
Karagwe District Council 56.5 61.7 51.1 29.0 30.0 27.9 83.8 89.9 77.6
Bukoba District Council 69.8 76.7 62.7 40.7 42.5 38.8 107.6 115.9 99.0
Muleba District Council 64.6 70.8 58.2 36.0 37.6 34.4 98.3 105.7 90.6
Biharamulo District Council 50.9 57.6 44.1 24.1 26.6 21.6 73.8 82.6 64.7
Ngara District Council 68.2 73.1 63.2 38.0 38.2 37.8 103.6 108.5 98.5
Bukoba Municipal Council 62.3 71.2 53.1 34.8 38.8 30.7 94.9 107.3 82.2
Missenyi District Council 55.1 57.7 52.3 27.4 27.7 27.2 81.0 83.8 78.0
Kyerwa District Council 66.1 67.7 64.6 42.2 43.8 40.5 105.5 108.5 102.4
Mwanza 44.3 48.2 40.3 20.4 21.3 19.5 63.8 68.5 59.0
Ukerewe District Council 55.8 58.6 52.9 31.7 32.3 31.0 85.7 89.1 82.3
Magu District Council 42.0 45.8 38.2 17.9 18.2 17.6 59.2 63.1 55.1
Nyamagana Municipal Council 51.3 56.5 46.0 26.2 27.1 25.3 76.1 82.0 70.1
Kwimba District Council 45.1 51.3 38.6 20.6 22.9 18.3 64.7 73.0 56.2
Sengerema District Council 38.1 40.0 36.1 16.2 16.6 15.8 53.7 56.0 51.3
Ilemela Municipal Council 42.2 46.7 37.7 18.1 19.1 17.1 59.6 64.9 54.1
Misungwi District Council 40.5 44.9 35.9 16.6 17.7 15.6 56.4 61.8 50.9
Mara 50.7 55.1 46.2 24.2 25.6 22.8 73.6 79.2 67.9
Tarime District Council 37.9 39.2 36.6 13.2 13.3 13.2 50.7 52.0 49.4
Serengeti District Council 45.2 50.1 40.2 18.9 20.8 16.9 63.2 69.8 56.3
Musoma District Council 58.8 65.4 51.9 30.6 33.0 28.0 87.5 96.3 78.5
Bunda District Council 49.2 55.0 43.2 23.1 25.2 20.8 71.1 78.8 63.1
Musoma Municipal Council 54.6 62.9 46.1 28.0 31.9 23.9 81.1 92.8 68.9
Rorya District Council 72.3 72.3 72.2 44.3 41.5 47.2 113.3 110.8 116.0
Butiama District Council 45.9 53.4 38.2 18.5 23.0 13.9 63.5 75.2 51.6
Manyara 33.3 37.7 28.9 11.6 13.4 9.7 44.5 50.6 38.3
Babati District Council 35.2 38.0 32.3 13.5 14.1 12.9 48.3 51.6 44.8
Hanang District Council 29.5 34.8 24.0 8.6 11.5 5.5 37.8 45.9 29.4
Mbulu District Council 38.0 41.2 34.8 15.8 16.5 15.1 53.2 57.0 49.3
Simanjiro District Council 27.8 31.8 23.7 8.3 9.6 6.9 35.8 41.1 30.4
Kiteto District Council 33.4 40.3 26.3 9.9 14.0 5.7 42.9 53.7 31.9
Babati Town Council 34.1 37.0 31.1 12.6 13.2 12.0 46.3 49.8 42.8
Njombe 54.5 59.8 49.0 28.5 30.3 26.7 81.4 88.3 74.4
Njombe Town Council 54.7 58.4 50.9 28.5 28.2 28.7 81.6 85.0 78.1
Wanging'ombe Dist. Council 51.1 54.3 47.8 25.6 25.7 25.4 75.3 78.6 71.9
Makete District Council 60.1 68.9 51.0 33.0 38.3 27.5 91.1 104.6 77.1
Njombe District Council 44.9 48.0 41.7 18.6 19.1 18.2 62.7 66.2 59.1
Ludewa District Council 55.9 63.5 48.0 30.4 34.3 26.4 84.5 95.6 73.1
Makambako Town Council 61.4 67.5 55.0 36.0 37.9 34.0 95.1 102.9 87.1

105
Area/Region/District
IMR CMR U5MR
Both
Sexes Male Female
Both
Sexes Male Female
Both
Sexes Male Female
Katavi 58.2 64.2 52.0 31.7 33.9 29.4 88.0 95.9 79.9
Mpanda Town Council 57.1 70.0 43.8 29.4 39.1 19.5 84.7 106.4 62.4
Mpanda District Council 62.6 66.2 58.9 34.4 34.3 34.6 94.9 98.2 91.4
Mlele District Council 56.0 61.1 50.8 30.5 32.1 28.9 84.8 91.2 78.2
Simiyu 39.4 41.8 37.0 15.4 15.2 15.6 54.3 56.4 52.1
Bariadi District Council 40.8 42.8 38.9 16.7 16.0 17.5 56.9 58.1 55.7
Itilima District Council 28.1 28.8 27.4 6.0 6.0 6.0 33.9 34.6 33.2
Meatu District Council 37.2 39.7 34.6 13.2 13.2 13.3 49.9 52.3 47.5
Maswa District Council 43.5 47.6 39.3 20.2 21.0 19.5 62.9 67.6 58.0
Busega District Council 49.3 51.7 46.7 24.5 23.3 25.7 72.5 73.8 71.2
Geita 41.0 44.1 37.7 17.6 17.9 17.2 57.8 61.2 54.3
Geita District Council 42.3 44.9 39.6 18.8 18.6 19.0 60.3 62.7 57.9
Nyang'hwale District Council 34.6 38.5 30.5 11.9 13.2 10.6 46.1 51.2 40.8
Mbogwe District Council 36.8 40.9 32.5 13.6 14.6 12.7 49.9 54.9 44.8
Bukombe District Council 41.3 43.2 39.4 18.7 18.7 18.7 59.3 61.1 57.4
Chato District Council 42.6 46.8 38.2 18.6 19.7 17.4 60.4 65.6 55.0
Kaskazini Unguja 42.1 47.2 36.9 18.1 20.5 15.6 59.5 66.8 51.9
Kaskazini A District 42.9 50.6 35.0 20.0 24.7 15.1 62.0 74.1 49.5
Kaskazini B District 37.4 39.2 35.6 14.8 14.3 15.4 51.7 52.9 50.4
Kusini Unguja 56.8 63.4 50.1 30.8 33.5 28.0 85.9 94.8 76.7
Kati District 60.4 67.9 52.6 32.9 35.1 30.7 91.3 100.7 81.7
Kusini District 49.7 54.6 44.6 26.2 30.1 22.2 74.6 83.1 65.8
Mjini Magharibi 47.1 53.6 40.4 23.0 26.1 19.8 69.0 78.3 59.4
Magharibi District 47.4 53.6 41.0 23.2 26.1 20.3 69.5 78.3 60.5
Mjini District 51.5 55.0 47.8 27.2 27.2 27.1 77.2 80.7 73.6
Kaskazini Pemba 43.4 45.9 40.8 19.3 19.4 19.2 61.8 64.4 59.2
Wete District 37.5 42.2 32.7 14.3 16.5 12.1 51.3 58.0 44.4
Micheweni District 49.7 50.0 49.5 24.2 22.2 26.1 72.7 71.1 74.3
Kusini Pemba 45.8 46.0 45.6 21.9 19.6 24.3 66.7 64.7 68.8
Chake Chake District 44.7 47.0 42.4 20.0 18.6 21.3 63.8 64.8 62.8
Mkoani District 46.8 45.0 48.7 23.7 20.4 27.1 69.4 64.5 74.5

106
Appendix 3: Census Questionnaires
Short Questionnaire
PHCF 2
FORM NO. OF
Region ……………… District……………….. Ward/Shehia………........... Village/Street …….................. EA
Please state the names of
all persons who spent the
census night, that is Sunday
26th August, 2012 in your
household, starting with the
name of the head of
household
(01) (02) 06 (09) (10) (11)
1
2
If an extra Questionnaire has been used put an "X" in the box
(08)
Does (NAME) have difficulty
remembering or concentrating?
No Difficulty = 1
Some Difficulty = 2
A lot of Difficulty = 3
Unable to Remember = 4
Not Applicable = 5
(07)
REMEMBERING
(03) (04) (05)
Does [NAME] have
difficulty walking or
climbing steps?
No Difficulty = 1
Some Difficulty = 2
A lot of Difficulty = 3
Unable to Walk = 4
Not Applicable = 5
WALKINGHEARINGALBINISMAGE
Does (NAME) have
difficulty hearing, even if
using a hearing aid?
No Difficulty = 1
Some Difficulty = 2
A lot of Difficulty = 3
Unable to Hear = 4
Not Applicable = 5
Does (NAME) have
difficulty seeing, even if
wearing glasses?
No Difficulty = 1
Some Difficulty = 2
A lot of Difficulty = 3
Unable to See = 4
Not Applicable = 5
STRICTLY CONFIDENTIAL
B: ALL PERSONS
No. HOUSEHOLD
MEMBERS
RELATIONSHIP TO
THE HEAD OF
HOUSEHOLD
SEX
Is [NAME] an
albino?
Yes = 1
No = 2
What is the relationship of
[NAME] to the head of
the household?
Head = 1
Spouse = 2
Son/Daughter = 3
Parent = 4
Grand Child = 5
Other Relative = 6
Not Related = 7
SEEING
Is [NAME] a
male or a
female?
MALE = 1
FEMALE = 2
HOUSEHOLD NO.
A: IDENTIFICATION
How old is [NAME]?
WRITE AND
SHADE AGE IN
COMPLETE
YEARS.
IF UNDER ONE
YEAR WRITE "00"
FOR 97 YEARS
AND ABOVE
WRITE '97'
THE UNITED REPUBLIC OF TANZANIA
2012 POPULATION AND HOUSING CENSUS
SHORT QUESTIONNAIRE
DISABILITY
Does (NAME) have difficulty
with self-care, such as washing
all over or dressing?
No Difficulty = 1
Some Difficulty = 2
A lot of Difficulty = 3
Unable to Care = 4
Not Applicable = 5
SELF-CARE

107
(01)
Ye
s
No
Cle
ft P
ala
te
Spin
al befida
Spin
al cord
inju
ries
Menta
l health
Psoriasis
1 1 2 1 2 3 4 5
2 1 2 1 2 3 4 5
3 1 2 1 2 3 4 5
4 1 2 1 2 3 4 5
5 1 2 1 2 3 4 5
6 1 2 1 2 3 4 5
7 1 2 1 2 3 4 5
B: ALL PERSONS
What is current marital
status of [NAME]?
READ ALL
RESPONSES TO
RESPONDENT
Never Married = 1
Married = 2
Living together = 3
Divorced = 4
Separated = 5
Widowed = 6
Not Stated = 7
[NAME] is a citizen of which
country?
IF TANZANIAN, WRITE CODE
1 IN THE BOX ON THE LEFT
WRITE CODE OF THE
COUNTRY IN THE TWO
BOXES ON THE RIGHT.
FOR DUAL CITIZENSHIP,
WRITE CODE "98"
CODES ARE ON A SEPARATE
SHEET
Which region/country does
[NAME] usually live?
WRITE AND SHADE CODE
FOR THE REGION AND
DISTRICT IF LIVING IN
TANZANIA, OR THE
COUNTRY CODE
FOLLOWED BY "44" IF
LIVING OUTSIDE
TANZANIA.
Where do you spend most of your time
during a day?
WRITE AND SHADE REGION
AND DISTRICT CODES IF
SPENDS MOST OF THE DAY
TIME IN TANZANIA OR THE
COUNTRY CODE FOLLOWED BY
"444" IF OUTSIDE TANZANIA
CODES FOR THE 5th BOX
Rural =1
Regional /District Headquarters =2
Other Urban= 3
PLACE OF RESIDENCE BIRTH CERTIFICATENo. WHERE RESPONDENT SPENDS
MOST OF THE DAY TIME
Does (NAME) has birth
certificate/notification?
Yes birth certificate= 1
Yes birth notification= 2
No = 3
Don't Know = 4
DISABILITY
OTHER DISABILITIES
11A)
Does, [NAME] have other type of disabilities/difficulties
among the following?
READ ALL TYPES OF DISABILITIES/DIFFICULTIES
TO RESPONDENT.
(12) (13) (14) (15)
MARITAL STATUS CITIZENSHIP
(16)
IF ANSWER IS NO, GO
TO QUESTION 12MULTIPLE RESPONSE IS ALLOWED

108
No.
(01) (17) (18)
1
2
3
4
5
6
7
8
C: EDUCATION: ALL PERSONS AGED 4 YEARS AND ABOVE
(19)
LITERACY EDUCATION ATTAINMENT LEVEL OF EDUCATION
Can [NAME] read and write
a short sentence in Kiswahili,
English, Kiswahili and English
or any other language?
Kiswahili = 1
English = 2
Kiswahili and English = 3
Other Languages = 4
Illiterate = 5
Are you/Is [NAME] currently attending, partially
attended, completed or never attended school?
Now attending =1
Partially attended =2
Completed =3
Never attended =4
IF THE ANSWER IS 'NEVER ATTENDED' SKIP TO
SECTION D
What level of education has [NAME]
completed or is currently attending?
WRITE AND SHADE THE
APPROPRIATE CODE.
CODES ARE IN SEPARATE
HANDBOOK

109
Yes = 1
No = 2
IF THE ANSWER IS YES, RECORD THE NUMBER OF DEATHS
(21) (22) (24) (25) (26) (27)
1
2
3
4
5
6
If number of death is more than 8, use an extra questionnaire
What was the cause
of death?
Road Accident = 1
Other Injuries = 2
Suicide = 3
Violence = 4
Sickness/Disease = 5
Martenal Death = 6
Other = 7
How old was the deceased at the
time of death?
WRITE AGE IN COMPLETED
YEARS. IF UNDER ONE YEAR
WRITE "00" IF IS 97 YEARS
OR ABOVE WRITE '97'
D: GENERAL AND MATERNAL DEATHS
IF THE ANSWER IS NO, SKIP TO SECTION E
(23)
PLEASE RECORD INFORMATION ON DEATHS THAT OCCURRED IN THE HOUSEHOLD DURING THE LAST 12 MONTHS.
DO NOT FORGET CHILDHOOD MORTALITY
Did the death occur during
pregnancy?
Yes = 1
No = 2
IF THE ANSWER IS YES,
SKIP TO SECTION E
Did the death occur during
childbirth
Yes = 1
No = 2
IF THE ANSWER IS YES
SKIP TO SECTION E
Did the death occur during
the 6 weeks period following
the end of pregnancy,
irrespective of the way the
pregnancy ended?
Yes = 1
No = 2
IF DEATH IS OF WOMAN AGED BETWEEN 12 AND 49 YEARS
(20) Was there any death which occurred in this household during the last 12 months?
Dea
th S
eria
l N
um
ber
Was the
deceased a male
or a female?
Male =1
Female =2

110
Yes No
Maize 1 2 Cattle
Paddy 1 2 Goats
Cassava 1 2 Sheeps
Banana 1 2 Poultry
Other Crops 1 2
Has/is any member of this
household operated/operating
any land for agricultural
purposes during 2011/12
agricultural year?
Yes = 1
No = 2
IF THE ANSWER IS NO,
SKIP TO QUESTION 30
Which of the following crops did the
household grow?
Was any member of this
household engaged in raising
cattle, goats, sheep or poultry
up to the census night?
Yes = 1
No = 2
IF THE ANSWER IS NO,
SKIP TO QUESTION 32
How many cattle, goats or sheep were
available during the Census night?
IF NO, WRITE AND SHADE CODE
"00000"
E: AGRICULTURE AND LIVESTOCK
Is there any member of this
household who is currently
engaged in fish farming?
Yes = 1
No = 2
AGRICULTURE LIVESTOCK FISH FARMING
(28) (29) (30) (31) (32)

111
33) Is there any person who was a member of this household currently living outside Tanzania?
Yes = 1
No = 2
34) Write the number of males and females living outside Tanzania?
CODES ARE IN SEPARATE HANDBOOK
1st
HH Member 6th
HH Member
2nd
HH Member 7th
HH Member
3rd
HH Member 8th
HH Member
4th
HH Member 9th
HH Member
5th
HH Member 10th
HH Member
IF THE NUMBER OF DIASPORA IS MORE THAN 10, USE EXTRA QUESTIONNAIRE
1st
HH Member 6th
HH Member
2nd
HH Member 7th
HH Member
3rd
HH Member 8th
HH Member
4th
HH Member 9th
HH Member
5th
HH Member 10th
HH Member
36) Have you or anyone in this household received remitance in the form of cash or in kind from them
during the last 12 months? Yes =1, No =2
F
IF THE ANSWER IS NO, SKIP TO SECTION G
F: CITIZENS IN DIASPORA
M
35) In which country are they living?

112
37) Is there a person in this household who is a member of the following social security funds?
Yes = 1
No = 2
Fund
National Social Security Fund (NSSF) =1
Zanzibar Social Security Fund (ZSSF) =2
Parastatal Pension Fund (PPF) =3
Public Service Pension Fund (PSPF) =4
Government Employee Provident Fund (GEPF) =5
Local Authority Pension Fund (LAPF) =6
National Health Insurance Fund/Community Health Fund (NHIF/CHF) =7
Other Funds =8
H: TOTAL NUMBER OF PERSONS IN THE HOUSEHOLD
Males
Females
Total
DATE HOUSEHOLD ENUMERATED
NAME OF SUPERVISOR
DATE OF EDITING QUESTIONNAIRE
IF THE ANSWER IS NO, GO TO SECTION H, MULTIPLE RESPONSE IS ALLOWED
Day Month
G: SOCIAL SECURITY FUNDS
Day Month

113
Long Questionnaire
FO RM NO . O F
A: IDENTIFICATION
Region ……………………… District………………..… Ward/Shehia……………..………… Village/Street ………………. EA .............................. HOUSEHOLD NO.
Please state the
names of all
persons who spent
the census night,
that is Sunday 26th
August, 2012 in
your household,
starting with the
name of the head
of household
(01) (02) '(06) (09) (10)
1
2
If an extra Questionnaire has been used put an "X" in the box
Does (NAME) have difficulty
remembering or
concentrating?
No Difficulty = 1
Some Difficulty = 2
A lot of Difficulty = 3
Unable to Remember = 4
Not Applicable = 5
Does (NAME) have
difficulty with self-care,
such as washing all over
or dressing?
No Difficulty = 1
Some Difficulty = 2
A lot of Difficulty = 3
Unable to Care = 4
Not Applicable = 5
(03) (04) (05) (07) (08) (11)
WALKING REMEMBERING SELFCARE
What is the
relationship of
[NAME] to the head
of the household?
Head = 1
Spouse = 2
Son/Daughter = 3
Parent = 4
Grand Child = 5
Other Relative = 6
Not Related = 7
Is [NAME]
a male or a
female?
Male = 1
Female = 2
How old is [NAME]?
WRITE AND
SHADE AGE IN
COMPLETE
YEARS.
IF UNDER ONE
YEAR WRITE "00"
FOR 97 YEARS
AND ABOVE
WRITE '97'
Is [NAME] an
albino?
Yes = 1
No = 2
Does (NAME) have
difficulty seeing,
even if wearing
glasses?
No Difficulty = 1
Some Difficulty = 2
A lot of Difficulty =
3
Unable to See = 4
Not Applicable = 5
Does (NAME) have
difficulty hearing,
even if using a
hearing aid?
No Difficulty = 1
Some Difficulty = 2
A lot of Difficulty =
3
Unable to Hear = 4
Not Applicable = 5
Does [NAME]
have difficulty
walking or climbing
steps?
No Difficulty = 1
Some Difficulty = 2
A lot of Difficulty =
3
Unable to Walk = 4
Not Applicable = 5
B: ALL PERSONS
No .
HOUSEHOLD
MEMBERS
RELATIONSHIP
TO THE HEAD
OF HOUSEHOLD
SEX AGE
DISABILITY
ALBINISM SEEING HEARING
PHCF 3
THE UNITED REPUBLIC OF TANZANIA
2012 POPULATION AND HOUSING CENSUS STRICTLY CONFIDENTIAL
LONG QUESTIONNAIRE

114
B: ALL PERSONS
(01)
Ye
s
No
Cle
ft P
ala
te
Spin
al befida
Spin
al cord
inju
ries
Menta
l health
Psoriasis
1 1 2 1 2 3 4 5
2 1 2 1 2 3 4 5
3 1 2 1 2 3 4 5
4 1 2 1 2 3 4 5
5 1 2 1 2 3 4 5
6 1 2 1 2 3 4 5
7 1 2 1 2 3 4 5
8 1 2 1 2 3 4 5
No.DISABILITY
OTHER DISABILITIES
11A)
Does, [NAME] have other type of disabilities/difficulties
among the following?
READ ALL TYPES OF DISABILITIES/DIFFICULTIES
TO RESPONDENT.
IF ANSWER IS NO, GO
TO QUESTION 12MULTIPLE RESPONSE IS ALLOWED
What is current marital
status of [NAME]?
READ ALL
RESPONSES TO
RESPONDENT
Never Married = 1
Married = 2
Living together = 3
Divorced = 4
Separated = 5
Widowed = 6
Not Stated = 7
[NAME] is a citizen of which
country?
IF TANZANIAN, WRITE
CODE 1 IN THE BOX ON
THE LEFT
WRITE CODE OF THE
COUNTRY IN THE TWO
BOXES ON THE RIGHT.
FOR DUAL CITIZENSHIP,
WRITE CODE "98"
CODES ARE ON A
SEPARATE SHEET
MARITAL STATUS CITIZENSHIP
(12) (13)

115
(15) (18) (20) (21)
Father Mother
1
2
3
4
5
6
C: EDUCATION: ALL PERSONS AGED 4 YEARS AND
ABOVE
LITERACYEDUCATION
ATTAINMENT
LEVEL OF
EDUCATION
Which region/country
does [NAME] usually
live?
WRITE AND SHADE
CODE FOR THE
REGION AND
DISTRICT IF LIVING
IN TANZANIA, OR
THE COUNTRY
CODE FOLLOWED
BY "44" IF LIVING
OUTSIDE
TANZANIA.
CODES ARE IN
SEPARATE
HANDBOOK
B: ALL PERSONS
PLACE OF
RESIDENCENo.
(22)(16)
PLACE OF
RESIDENCE IN 2011
Where was [NAME] living
in 2011?
WRITE AND SHADE
CODE FOR THE
REGION AND
DISTRICT IF LIVING IN
THE COUNTRY, OR
THE COUNTRY CODE
FOLLOWED BY "44" IF
LIVING OUTSIDE
TANZANIA.
FOR CHILDREN AGED
'00' IN QUESTION 05
WRITE CODE '9798'
PLACE OF BIRTH
In which region/country
was [NAME] born?
WRITE CODE FOR THE
REGION AND
DISTRICT IF BORN IN
THE COUNTRY, OR
THE COUNTRY CODE
FOLLOWED BY "44" IF
BORN OUTSIDE
TANZANIA.
CODES ARE IN
SEPARATE
HANDBOOK
Is [NAME]'s
Father alive?
Is [NAME]'s
Mother alive?
Yes = 1
No = 2
Don't Know = 3
What level of
education has
[NAME]
completed or is
currently
attending?
WRITE AND
SHADE THE
APPROPRIAT
E CODE.
CODES ARE
IN SEPARATE
HANDBOOK
(14) (19)(17)
Are you/is [NAME]
currently attending,
partially attended,
completed or never
attended school?
Now attending =1
Partially attended =2
Completed =3
Never attended =4
IF THE ANSWER IS
'NEVER
ATTENDED' SKIP
TO SECTION D
BIRTH CERTIFICATE
Does (NAME) has birth
certificate/notification?
Yes birth certificate= 1
Yes birth notification= 2
No = 3
Don't Know = 4
Can [NAME] read
and write a short
sentence in Kiswahili,
English, Kiswahili and
English or any other
language?
Kiswahili = 1
English = 2
Kiswahili and English =
3
Other Languages = 4
Illiterate = 5
WHERE
RESPONDENT
SPENDS MOST OF
Where do you spend most
of your time during the
day?
WRITE AND SHADE
REGION AND
DISTRICT CODES IF
SPENDS MOST OF
THE DAY TIME IN
TANZANIA OR THE
COUNTRY CODE
FOLLOWED BY "444"
IF OUTSIDE
TANZANIA. CODES
ARE IN SEPARATE
HANDBOOK
CODES FOR THE 5th
BOX
Rural =1
Regional /District
Headquarters =2
Other Urban= 3
SURVIVAL OF
PARENTS

116
(25)
M F M F
1
2
3
4
5
6
7
8
(27)(23) (24)
No.
In the last 12 months, did
[NAME] mainly….
Worked for payment,
worked without payment,
worked for own benefit, not
worked but actively seeking
for work, available for work
but not actively seeking for
work, household chores (e.g.
cooking), full time student or
unable to work/sick/too
old/disable
WRITE AND SHADE THE
APPROPRIATE CODE.
CODES ARE IN
SEPARATE HANDBOOK
In the week preceding
census’ night, did [NAME]
mainly….
Worked for payment,
worked without payment,
worked for own benefit,
not worked but actively
seeking for work, available
for work but not actively
seeking for work,
household chores (e.g.
cooking), full time student
or unable to work/sick/too
old/disable
WRITE AND SHADE
THE APPROPRIATE
CODE. IF CODE
GREATER THAN '3'
SKIP TO SECTION E
CODES ARE IN
SEPARATE
HANDBOOK
Was [NAME] an
employer, employee,
own account worker
non-agriculture, own
account worker
agriculture, contributing
family worker, or an
apprentice in the week
preceding the census'
night?
WRITE AND SHADE
THE APPROPRIATE
CODE.
CODES ARE IN
SEPARATE
HANDBOOK
How many
male/female
children were
born alive to
[NAME] and are
now living
elsewhere?
IF SHE HAS
NO CHILDREN
LIVING
ELSEWHERE
WRITE AND
SHADE ''00''
How many
male/female
children were
born alive to
[NAME] and are
now
unfortunately
dead?
IF NONE OF
HER
CHILDREN
HAS DIED
WRITE AND
SHADE ''00''
How many of the
male/female children
who were born alive
to [NAME] in the last
12 months are still
alive?
IF THERE IS NO
CHILD SURVIVING
WRITE AND
SHADE ''0''
CHILDREN EVER BORN
INDUSTRY
What is the main
activity at
[NAME'S] place of
work for the week
preceding the
census' night?
WRITE AND
SHADE THE
APPROPRIATE
CODE.
CODES ARE IN
SEPARATE
HANDBOOK
How many
male/female children
were born alive to
[NAME] in the last 12
months (i.e. 26 August
2011 - 25 August
2012)?
IF THERE IS NO
CHILD BORN
ALIVE IN THE
LAST 12 MONTHS
WRITE AND
SHADE ''0''. DON’T
ASK FEMALES
AGED 50 YEARS
AND ABOVE
(32)(28)
D: ECONOMIC ACTIVITY: ALL PERSONS AGED 5 YEARS AND ABOVE
(26)
What type of work
did [NAME] do in
the week preceding
the census' night?
WRITE AND
SHADE THE
APPROPRIATE
CODE.
CODES ARE IN
SEPARATE
HANDBOOK
ECONOMIC ACTIVITY OCCUPATION EMPLOYMENT
STATUS
E: FEMALES AGED 12 YEARS AND ABOVE
How many
male/female children
were born alive to
[NAME] and are
now living with
you/her in this
household?
IF SHE IS NOT
LIVING WITH
ANY OF HER
CHILDREN
WRITE AND
SHADE ''00''
(31)
FERTILITY IN LAST 12 MONTHS
FOR WOMEN AGED 12 TO 49 YEARS
M F
(29) (30)
M F M F

117
F: GENERAL AND MATERNAL DEATHS IN THE HOUSEHOLD
IF THE ANSWER IS NO, SKIP TO SECTION G
RECORD THE NUMBER OF DEATHS
(34) (37)
1
2
3
4
5
6
7
8
If number of death is more than 8, use an extra questionnaire
PLEASE RECORD INFORMATION ON DEATHS THAT OCCURRED IN THE HOUSEHOLD DURING THE LAST 12 MONTHS. DO NOT FORGET CHILDHOOD
MORTALITY
Did the death occur during pregnancy?
Yes = 1
No = 2
IF THE ANSWER IS YES SKIP TO
SECTION G
Did the death occur during
childbirth?
Yes = 1
No = 2
IF THE ANSWER IS YES
SKIP TO SECTION G
Did the death occur during
the 6 weeks period following
the end of pregnancy,
irrespective of the way the
pregnancy ended?
Yes = 1
No = 2
IF DEATH IS OF A WOMAN AGED 12 TO 49 YEARS
Dea
th S
eria
l Num
ber
Was the deceased a
male or a female?
Male =1
Female =2
(40)(35)
What was the cause of
death?
Road Accident = 1
Other Injuries = 2
Suicide = 3
Domestic Violence = 4
Sickness/Disease = 5
Martenal Death = 6
Other = 7
(33) Was there any death which occurred in this household during the last 12 months? YES=1 NO=2
(38) (39)
How old was the deceased at the
time of death?
WRITE AGE IN COMPLETED
YEARS. IF UNDER ONE YEAR
WRITE "00" IF 97 YEARS OR
ABOVE WRITE '97'
(36)

118
Owned by household=1
Title deed= 1
Iron sheets =1
Cement =1
Stones =1
Lived in without paying any rent=2
Residential Licence= 2
Tiles =2
Ceramic tiles =2
Cement bricks =2
Rented privately =3 Offer = 3 Concrete =3 Parquet or Polished wood =3 Sundried bricks =3
Rented by employer =4 Customary ownership = 4 Asbestos =4 Terazzo =4 Baked bricks =4
Rented by government at a subsidized rent =5 Contract = 5 Grass/Leaves =5 Vinyl or Asphalt strips =5 Timber =5
Owned by Employer - Free of charge =6 Registration (Zanzibar) = 6 Mud and Leaves =6 Wood Planks =6 Timber ana Sheets =6
Owned by Employer - With rent =7 No legal right = 7 Plastics/Box =7 Palm/Bamboo =7 Poles and Mud =7
Tent =8 Earth/Sand =8 Grass =8
Dung =9 Tent =9
1-Modern floor
0-Non modern floor
(43)
What is the ownership status of the main dwelling used
by the household?
IF THE ANSWER IS CODE 2 OR ABOVE, SKIP
TO QUESTION 43
(42)
What legal right do you have
over the ownership of this land
where your house is built?
(45)
What are the main roofing
materials used for the
main building of this
household?
(44)
G: HOUSING CONDITIONS AND OWNERSHIP OF ASSETS
What are the main wall
materials used for the main
building of this household?
What are the main flooring materials
used for the main building of this
household?
(41)

119
(47)
Piped water into dwelling =01
Electricity (TANESCO/ZECO) =01
Electricity (TANESCO/ZECO) =01
Piped water in the yard/plot =02
Solar =02
Solar =02
Public tap/standpipe =03 Generator/private sources =03 Generator (private source) =03
Tubewell/borehole =04 Cooking Gas =04 Gas (Industrial) =04
Protected dug well =05 Gas (Biogas) =05 Gas (Biogas) =05
Unprotected dug well =06 Electricity (Wind) =06 Electricity (Wind) =06
Protected spring =07 Paraffin =07 Acetylene lamp =07
Unprotected spring =08 Coal =08 Kerosene (lantern/chimney) =08
Rainwater collection =09 Charcoal =09 Kerosene (Wick lamps) =09
Bottled water =10 Firewood =10 Candles =10
Cart with small tank/drum =11 Wood/ residuals =11 Firewood =11
Tanker truck =12 Animal residuals =12 Torch/Rechargeable lamps =12
Surface water (river, dam, lake, pond,
stream,charco, canal, irrigation channels)
=13 Not Applicable =13
Improved cooking fuel Have electricityNon improved cooking fuel Have no electricity
Improved source
Non improved source
What is the main source of drinking water for
this household?
(49)(48)
What is the main source of energy used by
this household for cooking?
What is the main source of energy used by
this household for lighting?
How many rooms are available
for sleeping in this household?
G: HOUSING CONDITIONS AND OWNERSHIP OF ASSETS
RECORD NUMBER OF
ROOMS FOR
SLEEPING
(46)

120
(47)
Piped water into dwelling =01
Electricity (TANESCO/ZECO) =01
Electricity (TANESCO/ZECO) =01
Piped water in the yard/plot =02
Solar =02
Solar =02
Public tap/standpipe =03 Generator/private sources =03 Generator (private source) =03
Tubewell/borehole =04 Cooking Gas =04 Gas (Industrial) =04
Protected dug well =05 Gas (Biogas) =05 Gas (Biogas) =05
Unprotected dug well =06 Electricity (Wind) =06 Electricity (Wind) =06
Protected spring =07 Paraffin =07 Acetylene lamp =07
Unprotected spring =08 Coal =08 Kerosene (lantern/chimney) =08
Rainwater collection =09 Charcoal =09 Kerosene (Wick lamps) =09
Bottled water =10 Firewood =10 Candles =10
Cart with small tank/drum =11 Wood/ residuals =11 Firewood =11
Tanker truck =12 Animal residuals =12 Torch/Rechargeable lamps =12
Surface water (river, dam, lake, pond,
stream,charco, canal, irrigation channels)
=13 Not Applicable =13
Improved cooking fuel Have electricityNon improved cooking fuel Have no electricity
Improved source
Non improved source
What is the main source of drinking water for
this household?
(49)(48)
What is the main source of energy used by
this household for cooking?
What is the main source of energy used by
this household for lighting?
How many rooms are available
for sleeping in this household?
G: HOUSING CONDITIONS AND OWNERSHIP OF ASSETS
RECORD NUMBER OF
ROOMS FOR
SLEEPING
(46)

121
YES NO
Flush/pour flush to piped sewer system =01 Regularly collected =1 Radio 1 2
Flush/pour flush to septic tank =02 Irregularly collected =2 Telephone (Land Line) 1 2
Flush/pour flush to covered pit =03 Burnt =3 Mobile Phone 1 2
Flush/pour flush to somewhere else =04 Roadside dumping =4 Bicycle 1 2
Ventilated improved pit (VIP) latrine =05 Burying/pit =5 Motor vehicle 1 2
Pit latrine with washable slab and with lid =06 Other dumping =6 Motorcycle/Vespa 1 2
Pit latrine with washable slab without lid =07 Tricycle (Guta) 1 2
Pit latrine with not-washable/ soil slab =08 Tri motorcycle (Bajaj) 1 2
Pit latrine without slab/ open pit =09 Television 1 2
Composting/ ecosan latrine =10 Electric Iron 1 2
Bucket =11 Charcoal Iron 1 2
No facility/bush/field/ beach =12 Cooker (Electric or Gas) 1 2
Refrigerator/Freezer 1 2
Improved 1 Computer /Laptop 1 2
Non improved 0 Internet Facility 1 2
Plough 1 2
Regarded as sanitation Power tiller 1 2
Hand hoe 1 2
Wheelbarrow 1 2
Oxen 1 2
Donkey/Camel 1 2
House 1 2
Land/Farm 1 21 At least two items out of the listed assets
0 Less than two items from the listed assets
G: HOUSING CONDITIONS
Does your household have/own the following assets?
FOR "YES" ANSWER, THESE ASSETS SHOULD
BE IN WORKING CONDITION. SHADE THE
APPROPRIATE ANSWER FOR EACH ITEM
(52)(51)(50)
What is the main type of toilet facility used by this
household?
How is the household refuse
disposed of?

122
Yes No
Maize 1 2
Paddy 1 2
Cassava 1 2
Banana 1 2
Other Crops 1 2
Cattle
GoatsSheepPoultry
LIVESTOCKAGRICULTURE
(54) (55) (56)
How many cattle, goats or sheep
were available during the Census
night?
IF NO, WRITE AND SHADE
CODE "00000"
Is there any member of
this household who is
currently engaged in fish
farming?
Yes = 1
No = 2
(57)(53)
H: AGRICULTURE AND LIVESTOCK
FISH FARMING
Has/is any member of this
household
operated/operating any land
for agricultural purposes
during 2011/12 agricultural
year?
Yes = 1
No = 2
IF THE ANSWER IS NO,
SKIP TO QUESTION 55
Which of the following crops did the household
grow?
Was any member of this
household engaged in
raising cattle, goats, sheep
or poultry up to the census
night?
Yes = 1
No = 2
IF THE ANSWER IS
NO, SKIP TO
QUESTION 57

123
59) Write the number of males and females living outside Tanzania? Males
Females
CODES ARE IN SEPARATE HANDBOOK
Total
1st
HH Member 6th
HH Member
2nd
HH Member 7th
HH Member
3rd
HH Member 8th
HH Member
4th
HH Member 9th
HH Member
5th
HH Member 10th
HH Member
IF THE NUMBER OF DIASPORA IS MORE THAN 10, USE EXTRA QUESTIONNAIRE
1st
HH Member 6th
HH Member
2nd
HH Member 7th
HH Member
3rd
HH Member 8th
HH Member
4th
HH Member 9th
HH Member
5th
HH Member 10th
HH Member
62) Is there a person in this household who is a member of the following social security funds?
National Social Security Fund (NSSF) =1
Zanzibar Social Security Fund (ZSSF) =2
Parastatal Pension Fund (PPF) =3
Public Service Pension Fund (PSPF) =4
Government Employee Provident Fund (GEPF) =5
Local Authority Pension Fund (LAPF) =6
National Health Insurance Fund/Community Health Fund (NHIF/CHF) =7
Other Fund =8
J: SOCIAL SECURITY FUNDS
60) In which country are they living?
Month
61) Have you or anyone in this household received remitance in the form of cash or in kind from them during the last 12 months?
Yes =1, No =2
DATE OF EDITING QUESTIONNAIREDay Month
Fund
NAME OF SUPERVISOR
Yes = 1 No = 2 IF THE ANSWER IS NO, GO TO SECTION H. MULTIPLE RESPONSE IS
ALLOWED
DATE HOUSEHOLD ENUMERATED
Day
I: CITIZENS IN DIASPORA K: TOTAL NUMBER OF PERSONS IN THE HOUSEHOLD
58) Is there any person who was a member of this household currently living outside Tanzania? Yes = 1 No = 2
IF THE ANSWER IS NO, SKIP TO SECTION J
M F