mortality, disability, and the normative economics of medicare · each age-specific mortality rate...
TRANSCRIPT

This PDF is a selection from an out-of-print volume from the National Bureau of Economic Research
Volume Title: The Role of Health Insurance in the Health Services Sector
Volume Author/Editor: Richard N. Rosett
Volume Publisher: NBER
Volume ISBN: 0-87014-272-0
Volume URL: http://www.nber.org/books/rose76-1
Publication Date: 1976
Chapter Title: Mortality, Disability, and the Normative Economics of Medicare
Chapter Author: Bernard Friedman
Chapter URL: http://www.nber.org/chapters/c3823
Chapter pages in book: (p. 363 - 390)

ng dynamics, twooth cases I think isboth here and in
lative relationshipimplication is that
ioners, may work aave found.e to estimate theician fees is whenon a disaggrega-
age of the averagemarket area. Suchigned survey, and PART N Healths billing records.
THREE Insurance
-I

I
t
BERNAIFRI EDMINorthwestern Univ
ABSTRACMedicarepersons.may be cfunctionand impran "equiexperiefl(
EconoiimproveWhetherstatisticalparamete
1. INTROCMedicar€opportun
365

9BERNARD Mortal ity, Disability,
an d t h e N o r m at i yeEconomics ofMedicare
ABSTRACTMedicare subsidizes the purchase of health services by elderlypersons. This paper supposes that several insurance alternativesmay be compared, or experience monitored, using a social welfarefunction that recognizes gains from risk spreading, cash transfers,and improved health statns. A particular measure of welfare gain,an "equivalent transfer," is derived and applied to the Medicareexperience.
Econometric analysis suggests that, owing to Medicare, someimprovement in mortality and disability is evident in 1969.Whether these health improvements are "large" is a question forstatistical hypothesis testing, but also it is a tractable question ofparameter values in the equivalent transfer formula.
1. INTRODUCTIONMedicare is one of several conceivable programs for improving theopportunity for elderly persons to spread individual monetary risk.
365
j

Each elderly person, under Medicare, is partially reimbursed for It iscertain expenses in what may be called a system of matching grants the groundconditional on validation by physicians and other health profes- these altersionals. A matching grant, instead of a more neutral cash transfer, is program foa natural instrument of policy by a central authority wishing to for reimbupartly overrule individually perceived values.' prejudging
This paper formulates the assessment of Medicare and some effective.limited alternatives by a central authority. Individual risk prefer- keepingence and individual valuation of cash transfers are to be honored, seeking mbut the improvement of health status is taken to be a matter foroutside valuation.2 The relevance of such a formulation for appliedwelfare analysis will be briefly discussed in this section. Then inSection 2 a particular measure of welfare gain, an "equivalenttransfer," is derived. The application of this measure to monitoring 2. A NORM4the early results of Medicare is sketched. The next two sections of ASSESSIthe paper apply econometric models for estimating improvementsassociated with Medicare in mortality and disability. S The centra
The problem for statistical inference is the adequate specification ofand testing of stochastic disturbance properties of age-specific monetaryrates. Each age-specific mortality rate should not be treated as an levels of Findependent time series, since over time different individuals are derive a mobserved, with different histories appearing elsewhere in the data. the aboveA related shortcoming is inherent in the cohort approach of equivalelepidemiology—technology is dated in time, affecting different programscohorts at different ages. These two observations motivate the equivalentstatistical tests in Section 3. Mortality rates for ages in five-year function.intervals, and for years at five-year intervals ending in 1969, suggest Economa significant improvement for elderly white males associated with the informMedicare. The result for older white women is less clear. Disability for a decirates for both elderly men and elderly women over the period1959-1971 show meaningful improvements relative to younger per- political rsons.3 Whether health gains are substantial is a question for statisti- limited tocal hypothesis testing and also a tractable question of parameter program Iivalues in the equivalent transfer formula. S More imp
The volumes of expert testimony and position papers during the if costs oearly 1960s indicate that the purchase of additional medical care for drasticallythe elderly was regarded as a key social goal.4 Such a goal is does notfurthered more by Medicare than by either of the two following would beinsurance alternatives: (1) A floor on disposable income for we inonhealth consumption, implemented by a subsidy with a means comparintest; (2) A system of cash indemnities that "compensates" for health applies toimpairment without encouraging the purchase of particular ser- limitationvices. poral and
366 Friedman
j
367 Mi

It is possible to criticize either of the insurance alternatives onthe grounds of practicality or human dignity. In addition, neither ofthese alternatives offer the potential leverage of a reimbursementprogram for promoting efficient supplier behavior. Finally, the casefor reimbursement contracts can be advanced directly, withoutprejudging whether experience indicates such contracts to be costeffective. The premise is that the high cost to a consumer ofkeeping well informed about health leads to overly long delays inseeking medical attention.
2. A NORMATIVE MODEL FOR QUANTITATIVEASSESSMENT OF MEDICAREThe central features of Medicare to be treated here are (1) a transferof resources to the elderly; (2) a presumably better spreading ofmonetary risk among the elderly; (3) presumably better averagelevels of health for the elderly. The purpose of this section is toderive a measure of welfare change that combines information onthe above three phenomena. measure may be called an"equivalent transfer" and may be used to compare hypotheticalprograms or to monitor the welfare change of a given program. Theequivalent transfer is derived with a particular social welfarefunction.
Economists use a social welfare function (SWF) to specify exactlythe information and ethical prescriptions that seem to be relevantfor a decision by some absolute authority. The SWF may becompletely irrelevant for understanding or participating in thepolitical process of voting. The economic content of voting islimited to the self-interest of each and every person who votes. Aprogram like Medicare has an effect on persons who do not vote.5More important, Medicare seems appropriate for the SWF approachif costs of information about the efficacy of medical care aredrastically lower for a central planning authority.6 The use of a SWFdoes not prejudge whether, as a result, a reimbursement programwould be found inferior to cash indemnity insurance.
If we ignore program features that involve redistributing orcomparing the preferences of different individuals, the SWFapplies to a representative individual. Analyses containing thislimitation have become conventional in the context of intertem-poral and life-cycle phenomena.
367 Mortality, Disability, and Medicare
reimbursed formatching grantsr health profes-cash transfer, isrity wishing to
icare and somelual risk prefer-to be honored,be a matter fortion for appliedection. Then inan "equivalent
to monitoringtwo sections ofimprovements
y.Lte specificationof age-specific
treated as anindividuals areere in the data.rt approach ofcting differents motivate thees in five-yearn 1969, suggestassociated withlear. Disabilityver the periodto younger per-tion for statisti-n of parameter
pers during thecare for
;uch a goal istwo following
le income forwith a means
ates" for healthparticular ser-
j

t
The representative individual is here assumed to be required to in situatioisave out of his current income while young, building up a sum of factor in thmoney, G. At a critical age, the saving ends and the individual Furtherreceives an annuity together with a reimbursement contract for the aversion. 1purchase of medical services. At this critical age, the future con- sion will bsumption of other goods and services per period is determined by (3) (c) = 1the following variables:
whereRisy = annuity income, plus actuarial value of the government reimburse- is now possment per yearz = out-of-pocket ("direct") expense on covered medical services, a to obtain
random variable= premium charges per year for health insurance plus the actuarial (4) = —
value of government reimbursementc = consumption of goods and services other than medical care. This speFrom the above, assuming no borrowing or lending, cash transf
(1) = — —For consta
and c is a random variable.7 The number of future periods that theindividual will enjoy, and his health status while alive, are obvious dwconcerns to him. In this analysis, however, a planning authority willbe assumed to partially overrule individual valuation of medical There isservices and health. in the rang
Define T to be an average health status variable perceived by the cal 1 perplanning authority and assume that u (c) is a function that displays K = 0.1. Nthe individual's degree of risk aversion, given typii
The function T [u(c)], which is a product of expectations, will For cornbe taken as the social perception of individual welfare at the critical z1 distribuage. This objective function is assumed to be unique except for security (sorigin and scale. It preserves the degree of risk aversion displayed the z2 distiby u. The variable T may be interpreted as the effective number of that direciperiods in which E [u (c)J is enjoyed.8 This objective function is premiumsomewhat analogous to the human capital criterion of benefits from nents of ihealth programs.9 previous
Suppose that two programs, labeled 1 and 2, or two situations average pe /(say, before and after Medicare), are to be compared. Required elderly wichanges in the quantity of saving before retirement will be ignored Medicare iin the welfare comparison. A measure of the welfare gain to the cash transelderly for situation 2 is the "equivalent transfer" r defined by premiums
(2) T2 . E {U(C2 — T)]— T1 . E [u (ci)]
The measure T is the amount of nonrnedical consumption whose reimburseloss in situation 2 leaves the objective function at the same value as Conceiv
368 Friedman 369 M

in situation 1. The introduction of an arbitrary constant or scalefactor in the objective function would not change r.'°
Further analysis ofT depends on a parametric specification of riskaversion. The following function with constant absolute risk aver-sion will be assumed:
(3) u(cj=1—exp
where R is the parameter measuring the degree of risk aversion." Itis now possible to solve (2), letting e T2/T, andK = ern" - ITI)E(eRz),
to obtain
This specific measure provides a means for comparing dollars ofcash transfer with relative improvement in average health status.'2For constant r, the rate of substitution between w and 112 is
(1—K) 1=—-—I I<Owhenw>1
R jThere is some evidence that plausible values for R currently lie
in the range to 10-s. Consider R = 5 Then a hypotheti-cal 1 per cent improvement in health status raises r by $172 atK = 0.1. Notice that relatively small values of K are appropriategiven typical values of R and y,.
For comparisons with and without Medicare, information on thez, distribution may be obtained from a 1962 survey by socialsecurity (see Epstein and Murray, 1967). Complete information onthe z2 distribution is not readily available, although it is presumedthat direct cost risk has been greatly reduced.'3 The increasedpremium cost — ir, has been rather high. There are two compo-nents of ir,, previous public reimbursement and the cost ofprevious private insurance. According to Cooper et al. (1973),average per capita reimbursement under all public programs to theelderly was $131 in fiscal 1966, and it rose to $498 in fiscal 1969.Medicare is a program for which 112 — = — there is no lumpcash transfer. There is an indirect cash transfer, that portion ofpremiums ir1 — representing previous private insurance that isdiscontinued. This transfer may be guessed for 1966 by using thebenefit ratio for all private insurance, which implies an averagereimbursement to the elderly of
Conceivable alternative programs could use a lower ir2, say
369I
Mortality, Disability, and Medicare
(4) T = — — — 3T,) + —log]
1
[ E R
to be required toding up a sum ofd the individualit contract for the
the future con-is determined by
mment reimburse-
edical services, a
plus the actuarial
edical care.
ding,
periods that thelive, are obviousng authority willation of medical
perceived by theion that displays
xpectations, willare at the criticalique except for
ersion displayedctive number oftive function isof benefits from
r two situationspared. Requiredwill be ignoredfare gain to theT defined by
umption whosee same value as
dy2dw

3
by reimbursing only "catastrophes" and in addition raise cashbenefits to with the same total cost if — Y2 = — ire. Whethersuch a strategy would promote much less average health improve-ment is a key question. The rest of this paper will concentrate oneconometric attempts to assess health status change. All ages
Age 45—64Age 65+
The inc3. MEDICARE AND AGGREGATE MORTALITY not unifoi
EXPERIENCE the largesdischarge
This section deals with a test of whether there was a biased share of dimprovement in U.S. mortality after 1966—i-biased in favor of arthritis,persons over age 65. A specification of the statistical properties of mean sta)aggregate mortality is applied to the data classified by year, 1934— personalil1969, and by age, 35 and over in five-year age intervals. Thestatistical specification is an application of econometric methods mortalitythat does not seem common in mortality studies. The deterministic Recentcore of the model is the Gompertz view of the aging process after gional vaimaturity, known in demography since 1825. ferences
Causality cannot be established at the level of aggregation used racial coihere. The more modest objective of a model is to monitor some ences in'potentially stable relationship suggested by firmer knowledge at a estimatelower level. For a particular disease process, a reimbursement expenditprogram like Medicare would promote earlier treatment and more in absoluintensive consumption of medical services.'5 When health results seems toare compared for different dates in time, technological or environ- significaimental change may swamp the price effects. The inference of ing for htechnical change from the stochastic properties of an otherwise The qistationary relationship is nothing new in econometrics.'6 not seem
Per capita expenses on personal health care for the elderly rose * mortalityfrom $440 in fiscal 1966 to $720 in fiscal 1969, a gain of 64 per cent. variableFor younger persons, the increase was only 32 per cent.'7 Expenses age grou:for hospital care accounted for $160 of the increase for the elderly, a partly berise of nearly 100 per cent. In the first year of the program, it seems The sethat as much as half of the increased hospital expense of $46 1966, whrepresented previous "charity" care.'8 After the first year, total variousexpense continued to rise rapidly. aging pn
The Health Interview Surveys provide additional information on by coho:the changes in use of health services by different age groups. The comparerelative increase in hospital care for the elderly represented higher follow Cadmission rates and longer stays, as shown below,'9 Five rec
370 Friedman 371

tion raise cash2 — ire. Whetheriealth improve-concentrate on
DiRate
1963—1965
schargeper 1,000
MeanStay
1968—1969
DischargeRate per 1,000
MeanStay
All ages 128.3 8.3 125.6 9.1Age 45—64 147.9 11.0 143.1 11.3Age 65+ 186.3 12.7 232.6 15.3
ITY
was a biaseded in favor ofa! properties ofby year, 1934—intervals. The
netric methodsdeterministic
ig process after
usedmonitor some
knowledge at areimbursementment and more
health resultsical or environ-te inference of
an otherwiserics.'6he elderly rosei of 64 per cent.ent.'7 Expensesor the elderly, aOgram, it seemsxpense of $46first year, total
information onge groups. Theesented higher
j
The increased discharge rate and mean stay for the elderly werenot uniform across disease categories. Certain diseases of the heart,the largest single category of discharges, rose from 11.2 per cent ofdischarges to 12.8 per cent. Other categories showing an increasedshare of discharges were diseases of the eye, respiratory conditions,arthritis, and diseases of bones and joints. Marked increases inmean stay occurred for infective and parasitic diseases, mental andpersonality disorders, and diseases of the nervous system. Thesecategories of increased hospital care suggest that declines inmortality may be only a small part of health improvement.
Recently, econometric studies of mortality have dealt with re-gional variation in age-specific or age-adjusted mortality rates. Dif-ferences in environment, medical care, income, education, andracial composition are taken to be causal determinants of differ-ences in regional death rates. Auster, Leveson, and Sarachek (1969)estimate an elasticity of mortality for whites with respect to healthexpenditure of about —0.1, with a standard deviation almost as largein absolute value. The independent effect of higher average incomeseems to be an increase in average mortality. Silver (1972) found nosignificant association between state and local government spend-ing for health and mortality in SMSA's.
The quantitative information generated by these studies wouldnot seem applicable to the problem at hand—predictions by age ofmortality over time. A relationship with an age-adjusted dependentvariable cannot be an aggregate of the same relationship for eachage group.2° Moreover, an age-specific death rate changes over timepartly because it refers to different people with different histories.
The series in Figure 1 seems to display a change in trend after1966, which can be compared with other age-specific series. Yet thevarious age-specific series are not independent because of theaging process. Biometricians often present mortality data organizedby cohort—i.e., the mortality rate for the same group of peoplecompared over time as the group ages. After age 35, cohorts seem tofollow Gompertz' Law—the logarithm of mortality is linear in age.2'Five recentcohort curves are plotted in Figure 2.
371 Mortality, Disability, and Medicare

1 Mortality for Age 65-69; All Races and Sex FIGURE 2 T(per 100,000) A
C
9.5 —
9.4 -9.3-9.2 -9.1-9.0 -8.9-8.8 -8.7 -8.6 -8.5 -8.4 -
8.3 -8.2 -8.1 -8.0 -7.9 -7.8 -7.7
§ 7.67.57.47.37.27.17.06.90
• 6.86.7 :6.6 -6.5
1934 1939
* Define I
= moa11 = thec1=acB=ac'
Then Figicomplete]
(5) mu = 'Cii
FurtherSOURCE: US. National Center for Health Statistics, as in Figu*Calculated from preliminary 10% sample for 1970—1972. seems tha
higher B;careful inscohort mo
372 Friedman 373 Mt
4,300
4,200
4,100
1930 '32 '34 '36 '38 '40 '42 '44 '46 '48 '50 '52 '54 '56 '58 '60 '62 '64 '66 '68
Year

I Sex FIGURE 2
9.59.49.39.29.19.08.98.88.78.68.58.48.38.28.18.07.97.87.77.6
The Logarithm of Mortality as a Function ofAge: Cohort Curves, All Races and Self,Combined
60-64
55-59
0 50-54
"4'''66 '68 '72
Define the following variables:rn1 = mortality rate for cohort i in year ta1 = the age of cohort i in year tc, = a cohort-specific constantB = a constant common to all cohorts
Then Figure 2 might be described with a cohort model that is acomplete reconstruction of independent time series,
(5)
in the cohort model is suggested by data suchas in Figure 3, reprinted from Moriyama and Gustavus (1972). Itseems that more recent cohorts after age 35 have a lower c, and ahigher B; that is, they begin at a lower rate but rise faster. A morecareful inspection of this phenomenon reveals a flaw in the purecohort model. Two cohort curves in Figure 3 cross the previous
373I
Mortality, Disability, and Medicare
Cohort agein 1969
P80-84
75-79
70-74
65-69
6.86.76.66.5
1934 1939 1944 1949 1954 1959 1964 1969

10,000
8,000
6,000
4,000 —
1,000
800
600
400
200 —
cohorts atseem to aF
A modifimortality tmortality ima_it_i. T
(6)
where Uatmat is an 0each obsewill be hfurtherepidemics
The. mgeneralizefor whichused areyear tenrate analy
A test ofor 1969estimatedparamete:t statistic.overall fithood searUa_I,g_i P'
from zeroThe re
statisticalof equal I
TABLE 1 E
374 Friedman 375
2,000 —
t
FIGURE 3 Cohort Mortality, White Female
C0
0.0
w0.a)
a,
10 I I
0 10 20 30 40 50 60 .70 80
Average Age at Death
SOURCE: Moriyama and Guslavus (1972).
100
80
60
40
1896-1900 Cohort1906-1910 Cohort1916-1920 Cohort1926-1930 Cohort
20(
White male
White female

cohorts at the same date. In Figure 2, the older cohortsseem to abruptly change slope after 1954.
A modification of the cohort model with a proportional shift in allmortality rates at each date will now be discussed. Let mat be themortality rate for the group age a in year t, and let m_1 stand forma_it_i. Then suppose that
(6) mat=(1 B m_i+uat
where Uat is a random disturbance with mean zero. Because eachis an observed relative frequency between 0 and 1, and becauseI each observation is for a group of different size, the disturbance/ will be heteroskedastic, but with easily estimated variance.22 A
further stochastic property of is suggested in discussions ofepidemics—that Uat may be negatively correlated with UQI.1_I.
The model (6) was estimated by the established two-step,generalized least squares procedure. Since 1969 is the latest yearfor which mortality by five-year age interval is tabulated, the yearsused are 1969, back by five-year intervals through 1934.23 In eachyear ten age groups are used, the youngest being age Sepa-rate analyses were made for white males and for white females.
A test of the effect of Medicare is whether the shift parameter, X,for 1969 is significantly lower for the elderly than a separatelyestimated value for the young.25 Since AB is an unrestricted linearparameter in (6), significance tests may be easily obtained with thet statistic. In Table 1 are the relevant parameter estimates. Theoverall fit of the model is extremely close, and a maximum likeli-hood search for a first-order negative correlation between Uag andUa_i,r_t produced too small a value to be meaningfully different
Cohort from zero.The relative improvement for older white males in 1969 is
Cohort statistically significant at the 5 per cent level, while the hypothesisof equal parameters in the female case cannot be rejected. Tables 2
TABLE 1 Estimates of Shift Coefficients XB for 1969(standard errors in parentheses)
UnderAge65 Age 65—84 B
White male .14(.04)
.03(.03)
1.436(.018)
White female .06(.09)
.15(.06)
1.437(.033)
I I I
60 70 80
375I
Mortality, Disability, and Medicare

Actual and Predicted(per 100,000)
tively autConstant Ithe disabi
The extimmediatto be theless thanmortalityTable 1,health stai
4. DISABILSERVICI
This sectcollectedin disabilireduction,easily infi
The firstime, 1951women siof restricactivities
In Figiclasses. Iitime senHere,too shortbility. Insporaneouservices.
Annualbeen caicconstantValues ofavailablepersons afor the ePREA1959—196
376I
Friedman 377 pd
TABLE 2 Actual and Predicted Mortality Rates forWhite Males (per 100,000)
Agea
Actual
1964
Actual
1969
Predicted
1969
95%
Interval
42 414 425 390 ± 1047 688 685 628 1652 1,133 1,108 1,044 2857 1,801 1,774 1,720 4662 2,694 2,758 2,734 7367 4,104 4,010 4,089 19872 5,876 6,107 6,230 16577 8,402 8,557 8,919 23782 12,698 12,191 12,754 339
'Midpoint of five-year interval.
and 3 compare actual mortality rates in 1969 with predicted valuesderived by fitting through 1964 and assuming that A for 1969 willbe the same as for 1964. These comparisons have the same obviousindications as the parameter tests.
It is puzzling that a gain for older men is apparent but not forolder women. Table 3 indicates that mortality was meaningfullylower for older women in 1969 than in 1964, but there was also astrong decrease predicted by cohort experience. The test for nega-
TABLE 3 Mortality for White Females
Age
Actual
1964
Actual
1969
Predicted
1969
95%
Interval
42 234 241 238 13
47 367 365 367 1952 562 551 576 3157 831 819 882 476267
1,2602,087
1,2311,966
1,3041,978
70106
72 3,364 3,278 3,276 17677 5,600 5,301 5,281 28482 9,794 8,998 8,792 47389

for
95%
Interval
± 1016284673
• 198165237339
redicted valuesX for 1969 will
e same obvious
ent but not fors meaningfully
e test for nega-
Females
95%
Interval
1319314770
106176284473
tively autocorrelated residuals did not indicate misspecification ofConstant B in (6). The difference in result by sex will not be seen inthe disability data of the next section.
The extent of improvement in mortality for white males is notimmediately suitable for the welfare assessment in (4). If we take Tto be the sum of annual survival rates, then T will rise somewhatless than in proportion to the fall in mortality. In particular, for amortality reduction of about 5 per cent at every age, suggested byTable 1, w would be about 1.03. This ignores improvement inhealth status of the living, to be discussed below.
4. DISABILITY AND THE CONSUMPTION OF HEALTHSERVICESThis section reports a study of disability using interview datacollected by the National Center for Health Statistics. Reductionsin disability augment social welfare gains stemming from mortalityreduction, and the extent of one type of improvement might not beeasily inferred from the extent of the other.26
The first data to be examined are disability rates overtime, 1959—1971. The data suggest relative gains for older men andwomen since 1965. The disability measure used here is the numberof restricted activity days, R, defined as days in which usualactivities are substantially reduced because of illness or injury.
In Figure 4, average R is plotted over time for four age-sexclasses. In the preceding section I stated that a set of age-specifictime series should not be treated as if each were independent.Here, however, the age categories are too broad and the time seriestoo short to adequately treat the autoregressive properties of disa-bility. Instead, it seems more plausible to test for a stable contem-poraneous relationship between R and the utilization of healthservices.
Annual expenditures on personal health care per capita havebeen calculated by Cooperet at. (1973). These may be converted toconstant dollar units with the BLS price index for medical care.Values of per capita real expense, PRE, for different age groups areavailable after 1966. For this period, per capita real expense forpersons over age 65, PREA, has been regularly about 2.5 times PREfor the entire population. Survey evidence for 1962 showedPREA 1.5 PRE. This factor was assumed to hold throughout1959—1965.
377 Morta'ity, Disability, and Medicare
42
41
40
3938
3736
35
34
33
32
3i302928
2726
25
2423222120
1918171959 '60
exogenouscause-spec
One po,reductiondiscussed.relative im
Recall tiannual exiservices. Igram i. Leting on the
= 1 —
One parthbetween s
(7) T,=a11+
whereing such afor situatiothe healthmortality
In thef(and womemortality 1
r d
it
o o.03 .10.06 .10.03 .20.06 .20
The imidestined ttreat disabmedicalliminary a
378j
Friedman 379 Mc
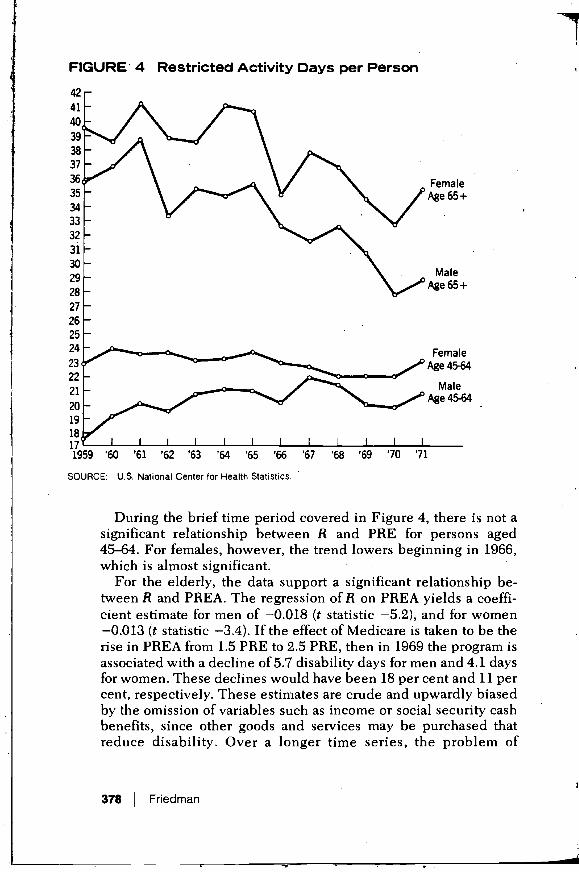
FIGURE 4 Restricted Activity Days per Person
FemaleAge 65 +
MaleAge 65+
FemaleAge 45-64
MaleAge 45-64
'61 '62 '63 '64 '65 '66 '67 '68 '69 '70 '71
SOURCE: U.S. National Center for Health Statistics.
During the brief time period covered in Figure 4, there is not asignificant relationship between R and PRE for persons aged45—64. For feniales, however, the trend lowers beginning in 1966,which is almost significant.
For the elderly, the data support a significant relationship be-tween R and PREA. The regression of R on PREA yields a coeffi-cient estimate for men of —0.018 (t statistic —5.2), and for women—0.013 (t statistic —3.4). If the effect of Medicare is taken to be therise in PREA from 1.5 PRE to 2.5 PRE, then in 1969 the program isassociated with a decline of 5.7 disability days for men and 4.1 daysfor women. These declines would have been 18 per cent and 11 percent, respectively. These estimates are crude and upwardly biasedby the omission of variables such as income or social security cashbenefits, since other goods and services may be purchased thatreduce disability. Over a longer time series, the problem of

exogenous technical progress might be treated by distinguishingcause-specific disability rates.
One possible means of combining information on disabilityreduction with information on mortality reduction will now bediscussed. The aim is to construct a useful scalar measure ofrelative improvement, co, to use in (4).
Recall that = where each T, is a factor multiplying theannual expected utility of consumption of goods other than healthservices. LetS1, be the probability of survival to year t under pro-gram i. Let a1, be a factor that reduces utility of those alive depend-ing on the level of average disability; specifically, let
disability days in year t365
One particular way of formulating the planning agency's tradeoffbetween survival and disability is
(7) T4=a11+
where =0 for all t > L. Perhaps the major reservation in advocat-ing such a measure is a suspicion that it would not be appropriatefor situations wherein mortality increases despite improvements inthe health of the living. In the practical application here, changes inmortality will be seen to govern the scalar index
In the following table (7) is used to compute values of a for menand women aged 65—69 in 1969, r being the relative decline inmortality rates and d the relative decline in disability days.
r d
Men
T w r d
Women
T w
0 0 11.32 0 0 16.44.03 .10 11.64 1.028 .03 .10 16.87 1.026.06 .10 11.85 1.047 .06 .10 17.13 1.042.03 .20 11.75 1.038 .03 .20 17.04 1.036.06 .20 11.97 1.057 .06 .20 17.31 1.052
The importance of disability and health status measures seemsdestined to grow. Further use of the Health Interview Surveys willtreat disability as an outcome of environmental, events, the use ofmedical services, and the lagged effects of past behavior. A pre-liminary approach to production function analysis in survey data is
IMortality, Disability, and Medicare
a11 = 1 —
FemaleAge 65+
MaleAge 65+
FemaleAge 4564
MaleAge 45-64
, there is not apersons aged
.nning in 1966,
elationship be-yields a coeffi-and for womentaken to be thethe program is
and 4.1 dayscent and 11 per)wardly biasedLl security cashpurchased thatie problem of

reported below. The results were not encouraging; they suggestrefinements in research methods and the need for longitudinalsamples.
Previously, Grossman (1972, pp. 55—66) has reported estimates ofthe determinants of cross-sectional variation in disability. Afterapplication of two models with disability as a dependent variable,he suggests that the more convincing interpretation of the data isgiven by a model of the demand for "flows" of good health.27
attempt to estimate with consistent methods theeffect of medical care in reducing disability did not yield reliableresults.28 My preliminary study led to a similar conclusion.,
The Health Interview Survey for 1969 provides the number ofrestricted activity days for an individual during the two weeks priorto interview. Each quarter of the year, however, is a separaterandom sample of the U.S. population. Therefore,_average disabil-ity for subpopulation i in a two-week period, is seasonallyunbiased. The method of choosing subpopulations will be consid-ered below. The probability of a disabling condition does notdepend on contemporaneous use of medical care, and by analogy toGompertz' Law is assumed to rise exponentially with age. Thelength of disability, given its occurrence, is assumed to dependnegatively on the intensity of medical care.
Define the following averages for subpopulation i:MDV = number of physician visits (12 mos.).HOS = number of hospital days (12 mos.)
HI = proportion with hospital insuranceHG = proportion with education at least through high school gradua-
tionINS = 0.25 (HI) + (1-HI) a crude estimate of average net price of
medical care.
Let the prefix L for any variable name denote a logarithmictransformation.
In the absence of data on past use of medical care, I attempted tospecify the static production function over groups
(8) LR, = + + a2LMDVf + + a4LHGf +u1
Problems of identification and simultaneity bias must now bediscussed, and methods for grouping and consistent estimationdescribed. In reality, there are a variety of illnesses, each with adifferent established method and intensity of medical treatment.Some conditions that are treated with more than average intensitymay nevertheless have worse than average disability results,which, of course, carries no implication that the choice of treatment
380 Friedman 381 Mo
was ineffj(amount ofnot be presHOSbutaiincome an
in
income ducomputedrnarilytorelion relatio
Fruitful:aided byregional qlonger-terncare may n
I
wasdemonstralinformatioisocial weifof formulatplanningseems obvf
NOTES1. The dor
grant. Tprivatequestior
2. Thepersons

g; they suggest was inefficient. One suspects, therefore, correlation betweenfor longitudinal amount of care and the residual in (8). Identifying information may
not be present in the sample—e.g., variables that affect MDV andrted estimates of HOS but are not correlated with the residual in (8). I assumed thatdisability. After income and price of care are variables that may be used asmdent variable, instruments in estimating (8). Only a crude measure of price wasrn of the data is available.)d health.27 The population over 45 was classified into 9 age categories and 7nt methods the income groups, yielding 63 subpopulations. The grouping strategy,ot yield reliable in addition to removing seasonality, sought to use an instrumentaliclusion. technique to purge LMDV and LHOS of correlations with is.
s the number of Classification by age may not advance the above strategy, so (8) wastwo weeks prior estimated by two-stage least squares with LINS, LHGP, ACE, andr, is a separate income dummy variables used as the exogenous variables. The'average disabil- computed estimates of a2 and a3 were positive, which seems pri-
is seasonally manly to reflect a failure to identify the true parameters of a produc-will be consid- tion relation.
dition does not Fruifful research on cross-sectional variation in disability may bend by analogy to aided by cause-specific analysis, or supplementary information on
with age. The regional quality variation and standards of medical care. Themed to depend longer-term effects of differences in intensity or quality of medical
care may require repeated interviews with the same individuals.
CONCLUDING REMARKSgb school gradua- It was not the purpose of this paper to conclude whether Medicare
is or was better than some other program. The purpose was torage net price of . . . . .demonstrate the feasibility of denying and usefully combininginformation on health status, cash transfers, and risk bearing. The
a logarithmic social welfare function suggested in this paper is one of an infinityof formulations. The need to use some such precise formulation for
e, I attempted to planning government intervention in personal health decisionsseems obvious.
+Uj
is must now be NOTES;tent estimation;es, each with a 1. The dominant private insurance plans also cover health loss with a matchingdical treatment. The welfare foniiulation in this paper is not meant to explain how theverage intensity private insurance system, or Medicare arose, but may be relevant to the
question of why they survive.sability results, 2. The effect of higher taxes and higher prices for health services on younger)ice of treatment persons will not be considered.
381 Mortality, Disability, and Medicare

I
T3. Despite the short time span, the data suggest a break in trend after 1965 that is cancer.
consistent with a stable relationship between real per capita health expense prices nand days of restricted activity. A cross-section multivariate analysis in 1969, treatmeihowever, did not permit the identification of such a "production" relationship. leeway
4. See H. Somers and A. Somers, Medicare and the Hospitals: Issues and responsProspects (Washington, D.C.: The Brookings Institution, 1967), Ch. I. 16. An early
5. Each person who votes may weigh his own potential gain or loss against the Changegain or loss of others. Pauly (1971) suggests that the existence of such Statisticonsumption externalities is the key impetus behind public reimbursement 17. Duringprograms for medical care. In the general analysis of government there will be The exrmany SWF's. Rothenberg (1961) argues that the community can come to a prior 18. See R.agreement on a single SWF to be implemented by neutral technocrats. Aged,"
6. The problem of adverse selection and other high private transaction costs argue 19. The utifor public administration of insurance, but this is not synonymous with the Illness,application of a SWF. 20. This pa
7. The exposition may be carried through with an addition to y of the annuity all the ivalue of other assets as long as these are unaffected by program change. Also, c Silveris assumed to be non-negative, regions
8. The same objective function may be offered with the following justification: 1960, aAssume that each period has independent and identically distributed outcomes 21. Since Cof current expense and that individual utility is the sum of utility in all periods have blived. Then, average summed utility will be mortali
E[u(c)]'(l+S+S,+...)22. Iftheti
where S) is the probability of survival to period j, averaging over all initial numbe:conditions. 23. I must
9. Both criteria are weighted sums of future planner-perceived gains to the assistanrepresentative individual. Use of the human capital criterion does not typically 24. The oprecognize risk preference. See, e.g., Weisbrod (1961) and Rice (1966). Both 25. A threecriteria override individual preferences with regard to discounting the future, seriousand individual subjective probabilities. Discounting could be incorporated in availabthe SWF used here. change
10. The concept is analogous to "certainty equivalence." Therefore, extrapolation propoilto situations with no risk would suffer from a recognized drawback—consumer greater
may be somewhat incomparable between the case of no risk and 26. Fuchssome risk. measui
11. The specification of Constant R has been applied in discussions of health Unitedinsurance by Zeckhauser (1970), Friedman (1971), Felclstein (1972), and Arrow possibi(1974). ages rn
12. Suppose that T is the sum of survival rates given in an earlier note. If the entire 27. Of prinsurvival curve is shifted up by proportion r > 1, then w is slightly less than r; capitalispecifically, 28. The
with so
13. This conclusion may depend on the precise manner of treating free care in thepre-Medicare period. The appropriate z1 distribution is what would have beenobserved in the year for which all comparisons are made, in this paper 1969.
14. Elderly persons were likely to have insurance with less extensive reimburse- REFERENCment, but were likely to be paying higher premiums for individual coverage.In 1969 they might have been paying more than this amount in the absence of 1. Auster,Medicare.
15. This distinction may have practical relevance for a minority of diseases such as
382I
Friedman 383 M

cancer. The distinction attempts to recognize that consumer response to lowerprices may be more directly relevant to early treatment than to the mode oftreatment. The behavior of physicians as decision-making agents with someleeway to exercise their own preferences may show a more complicatedresponse to public programs. See Fuchs (1972, Ch. 4) and Friedman (1974).
16. An early example in the literature on economic growth is R. Solow, "TechnicalChange and the Aggregate Production Function," Review of Economics andStatistics, 39 (1957), pp. 312—320.
17. During this period the CPI medical care component rose by about 15 per cent.The expenditure data are from Cooper et al. (1973).
18. See R. Lowenstein, "Early Effects of Medicare on the Health Care of theAged," Social Security Bulletin (April 1971).
19. The utilization data in this section are from "Age Patterns in Medical Care,Illness, and Disability," Vital and Health Statistics, Series 10, Nos. 32 and 70.
20. This particular problem could be corrected in the linear case by age-adjustingall the independent variables. The question of proper pooling is more serious.Silver computes a coefficient of concordance between separate rankings ofregions for age-specific mortality. The values for this statistic are quite low in1960, and are more troubling for men than for women.
21. Since Gompertz' initial suggestion, more complicated models and speculationshave been offered. For most of these formulations, the rate of increase inmortality is approximately constant from "maturity," falling off gradually atolder ages. See Spiegelman (1968), pp. 163—170.
22. If the true value of mat is then the varianceat beginning of year t.
23. I must thank Joan Kiebba, National Center for Health Statistics, for helpfulassistance with these data.
24. The open-ended group, age 85+, was ignored.25. A three-year period may be too soon to capture the effect of earlier treatment of
serious illness, as the trend in Figure 1 suggests. When later data becomeavailable, the possibility must be considered that technical or environmentchange has been slanted in favor of the elderly. For example, a decline in theproportion of cigarette smokers may have occurred more rapidly and withgreater effect among the elderly.
26. Fuchs has discussed the extent of correlation between mortality and disabilitymeasures across regions. See "Some Economic Aspects of Mortality in theUnited States," National Bureau of Economic Research, 1965, mimeo. Thepossibility should not be overlooked that over time, reduced mortality at olderages might raise the average observed disability of the living.
27. Of primary interest to Grossman is the stock of health that represents both thecapitalization of future flows and the lagged effects of past investment choices.
28. The regression used a NORC sample of 550 members of the labor force in 1963with some disability days.
REFERENCES1. Auster, R., I. Leveson, and D. Sarachek, "The Production of Health, an
Exploratory Study," Journal of Human Resources, 4 (Fall 1969), pp.411—436.
end after 1965 that isapita health expenseate analysis in 1969,Lction relationship.ospitals: and1967), Ch. I.
or loss against thee existence of suchiblic reimbursementrnnient there will be
ty can come to a priorLi technocrats.snsaction costs argueynonymous with the
to y of the annuitygram change. Also, c
Ilowing justification:listributed outcomesutility in all periods
ging over all initial
ceived gains to theon does not typicallyd Rice (1966). Bothcounting the future,d be incorporated in
refore, extrapolationrawback—.consumer
case of no risk and
scussions of healthin (1972), and
er note. If the entireslightly less than r;
ring free care in theat would have beenin this paper 1969.xtensive reimburse-ndividual coverage.nt in the absence of
of diseases such as
383 Mortality, Disability, and Medicare

2. Cooper, B., N. Worthmgton, and M. McGee, Compendium of National HealthExpenditure Data, Department of Health, Education and Welfare, Pub-lication No. (SSA) 73-11903, Washington, D.C.
3. Epstein, Lenore A., and Janet H. Murray, The Aged Population of the UnitedSates—The 1963 Social Security Survey of the Aged, Resarch ReportNo. 19, Social Security Administration, Washington, D.C., 1967. Stuart H.
4. Feldstein, M., "The Welfare Loss of Excess Health Insurance," Journal of Department of HealPolitical Economy, 81 (March—April 1973), pp. 251—280.
5. Friedman, B., A Study of Uncertainty and Health Insurance, Ph.D. disserta-tion, Massachusetts Institute of Technology, 1971. Bernard Fm
6. , "A Test of Alternative Demand-Shift Responses to the Medicare Pro- the bridgegram," in M. Perlman (editor), The Economics of Health and Medical applicationCare (London: Macmillan, 1974). The second
7. Fuchs, V. (editor), Essays in the Economics of Health and Medical Care (New health statuYork: National Bureau of Economic Research, 1972).
8. ,"Some Economic Aspects of Mortality in Developed Countries," in M. and the emjPerlman (editor), The Economics of Health and Medical Care (London: FriedmanMacmillan, 1974). before and
9. Grossman, M., The Demand for Health: A Theoretical and Empirical Investi- incor oratgation (New York: National Bureau of Economic Research, Occasional, P ePaper 119, 1972). corisumptioi
10. Moriyarna, 1., and S. Gustavus, Cohort Mortality and Survivorship: U.S. Death TheRegistration States, 1900—1968, Vital and Health Statistics, Series 3, . monetary vaNumber 16, U.S. Public Health Service, Washington, D.C., of the basi
11. Palmore, E. (editor), Normal Aging (Durham, North Carolina: Duke University attributed toPress, 1970).
S The mod12. Pauly, MV., Medical Care at Public Expense (New York: Praeger, 1961). representati13. Rice, D., Estimating the Cost of Illness, U.S. Public Health Service, Health critical age
Economics Series No. 6, Washington, D.C., 1966. and a reimt14. Rothenberg, J., The Measurement of Social Welfare (Englewood Cliffs, New consum tbJersey: Prentice-Hall, 1961). p15. Silver, M., "An Econometric Analysis of Spatial Variations in Mortality Rates a random v,
by Race and Sex," in V. Fuchs (editor), Essays in the Economics of services, arHealth and Medical Care (New York: National Bureau of Economic public and IResearch, 1972), Ch. 9. of goods an
16. Spiegelman, M., Introduction to Demography, Revised Edition (Cambridge, C =y—ir—ZMassachusetts: Harvard University Press, 1968). With this
17. Sullivan, 0., "Disability Components for an Index of Health," Vital and Health is T E [u(cStatistics, Series 2, Number 42, U.S. Public Health Service, Washington, central planD.C., 1971. Friedman c
18. Weisbrod, B., The Economics of Public Health (Philadelphia: University of individual vPennsylvania Press, 1961).ft M19. Zeckhauser, R., "Medical Insurance: A Case Study of the Trade-off Between anu a er
Risk Spreading and Appropriate Incentives," Journal of Economic objective tuTheory, 2 (March 1970).
T2 'E[u(c2
The authors arepartment of Heanecessariiy reprtcomments of GE
384 Friedman 385 M

of National Healtha and Welfare, Pub-
lotion of the Uniteded, Resarch ReportD.C., 1967.
urance," Journal of280.ace, Ph.D. disserta-
the Medicare Pro-fealth and Medical
Medical Core (New
d Countries," in M.icc! Care (London;
Empirical Investi-search, Occasional,
,orship: U.S. DeathStatistics, Series 3,
D.C.,a: Duke University
'raeger, 1961).Service, Health
ewood Cliffs, New
in Mortality Ratesthe Economics ofreau of Economic
dition (Cambridge,
Vital and Healthrvice, Washington,
ihia: University of
Trade-off Betweenreal of Economic
COMMENTSStuart H. Altman and Ira BurneyDepartment of Health, Education, and Welfare
Bernard Friedman's paper is really two very interesting papers. Unfortunately,the bridge between them is not as strong as it could be. The first is anapplication of welfare theory to provide a framework for analyzing Medicare.The second is an empirical investigation of the effects of Medicare on thehealth status of the aged. In these brief comments the model and itsassumptions are reviewed, other important issues to consider are identified,and the empirical results are examined,
Friedman proposes an intriguing model to compare the welfare of the agedbefore and after Medicare. The novel aspect of the model is the attempt toincorporate three health-related features into the welfare function. They are (1)consumption of medical services, (2) risk spreading, and (3) health status.The concept of "equivalent transfer," r, which purports to measure themonetary value of welfare gains in these three features, is developed. Oneof the basic ramifications of the model is that all welfare gains areattributed to Medicare.
The model is a two-period life-cycle formulation. It assumes that arepresentative individual (in period 1) saves out of current income. At thecritical age (period 2), all saving ends and the individual receives an annuityand a reimbursement contract for the purchase of medical services.1 Futureconsumption of goods and services is governed by two other variables: (1) Z,a random variable reflecting out-of-pocket expenses for noncovered medicalservices, and (2) ir, average spending on health insurance premiums, bothpublic and private. Assuming no borrowing, lending, or saving, consumptionof goods and services other than medical care, C, is defined by the identity2C =y—ir—Z.
With this consumption identity, Friedman specifies an objective function. Itis T E [u(c)J, the product of average health status T as perceived by thecentral planning authority and the expected value of a utility function u(c).Friedman comments that this objective function is "the social perception ofindividual welfare at the critical age." To compare welfare of the aged beforeand after Medicare, Friedman incorporates the equivalent transfer r into theobjective function. The definition of 'r is embodied in the following equation
T2'E[u(c2—r)] =T1 .E[u(c)}
The authors are Deputy Assistant Secretary for Health Planning and Evaluation, and St aft Economist, De-partment of Health. Education, and Welfare. The views expressed here are those of the authors and do notnecessarily represent the views of the Department. The authors would like to especially acknowledge the helpfulcomments of George Schleber.
385 Mortality, Disability, and Medicare

r
where subscripts 1 and 2 refer to pre- and post-Medicare, respectively. Medicare. CIFriedman describes T as "the amount of nonmedical consumption whose loss housing subsin situation 2 leaves the objective function at the same value as in situation i.' income (SodPositing a negative exponential utility function with the property of constant Two tests aabsolute risk aversion, Friedman solves the above equation for r. mortality datt
The model is an intriguing conceptual approach that incorporates the for white malconsumption of medical services, risk spreading, and health status in mortality forcomparing the welfare of the aged before and after Medicare. However, in retrogressionexamining Medicare (or other public programs) there are some other Impor- The seconitant issues to consider. For example, under what circumstances should the up to 1964. T'government intervene in the private market? If government intervenes, what would have Ipolicy instruments should be employed? What are the total (i.e., general the effect ofequilibrium) effects of intervention on the rest of society? Friedman's formula- different frortion does not address itself to these fundamental issues, males there i
In the case of Medicare, one key reason for public intervention was the 65 in 1969failure of the private market to provide health insurance for the elderly. Largely significantlyout of the labor force, the elderly lacked the opportunity to purchase health 62)
insurance at group rates. In addition, experience rating, the competitive tool Althoughof the commercial companies, forced the Blues to abandon community rating, view of the i
which to a certain extent had allowed some aged persons to purchase attribute impprotection at reasonable rates. Finally, an institutional feature of the market is many other sthat unlike insurance, one cannot purchase health insurance on an annuity may also bebasis. For these reasons an adequate market for health insurance for the aged health status,failed to develop. Distributional considerations provide yet another, albeit . might be affiinterrelated, rationale for the creation of Medicare, since many elements of Since imprsociety had empathy with the elderly, a majority of whom are poor. If these the health ofdistributional considerations are viewed in a more global framework, one model, Friedshould consider the welfare of the givers as well as the receivers.3 capita expe
Inasmuch as public intervention can lead to greater efficiency under these Friedman sucircumstances, the question becomes, "What policies should be used?" disability daWhen Medicare was being debated, several approaches—subsidies for the should be ii
purchase of private insurance, creation of insurance pools, and having the omitted fromgovernment act as underwriter—were considered. It would be useful to care" in thedevelop a model to compare the implications, of these alternative Friedmantmechanisms. Such a model could also be useful in addressing some of the likely rangeimportant questions in the current national health insurance debate. . possible set
The second part of Friedman's paper is an empirical investigation of specificationwhether the health status of the elderly improved after Medicare. Indeed, more helpfulthese results are encouraging, although they are far from definitive. First, he Medicare forattempts to measure improvements in mortality. Because this measure disability. Utignores improvements in the health status of the living, changes in disability calculate 'r,
are also measured, Finally, mortality and disability are integrated to obtain a In summa.
comprehensive indicator of the change in health status. welfare effecFriedman acknowledges the problem of attempting to discern causality results can I
with aggregate mortality data but aspires to a less grand objective of finding Nevertheless
an associative relationship. The critical assumption of this approach is thata// other importthe change in health status is attributed exclusively to one program—
386 Friedman 387 Moi

licare, respectively.sumption whose losslue as in situation 1,"property of constanttion for r.at incorporates the
nd health statUs indicare. However, ine some other mpor-
should theent intervenes, what
total (i.e., generalFriedman's formula-
intervention was thethe elderly. Largelyto purchase health
competitive tooln community rating,ersons to purchaseture of the market isrance on an annuity
surance for the agedyet another, albeit
e many elements ofm are poor. If thesebal framework, onereceivers.3liciency under theseshould be used?"
s—subsidies for theols, and having thevould be useful tothese alternative
ressing some of thece debate.
cal investigation ofMedicare. Indeed,definitive. First, he
ause this measurehanges in disabilitytegrated to obtain a
o discern causalityobjective of findingapproach is that allto one program—
Medicare. Changes in health status arising from other programs such ashousing subsidies, food stamps, cleaner environments, and increases in realincome (Social Security benefits) are not properly accounted for.
Two tests of improvement in mortality of the aged are performed with cohortmortality data. In the first test a modified cohort mortality model is estimatedfor white males and females. Although the model indicates improvements inmortality for white males, the hypothesis of no improvement or indeedretrogression in mortality for white females cannot be rejected.
The second test applies the model to mortality data for each of eight cohortsup to 1964. The estimated equation is then used to predict what 1969 mortalitywould have been if the underlying pre-Medicare trends continued. A test ofthe effect of Medicare is whether the actual 1969 mortality rate is significantlydifferent from the predicted 1969 mortality. Friedman finds that for whitemales there is a significant difference for six cohorts (four cohorts under age65 in 1969 and the oldest two over 65). For white females, the actual issignificantly different from the predicted for only one of the nine cohorts (age62).
Although these results are encouraging, they are hardly unambiguous. Inview of the insignificant result for white females, it may be premature toattribute improvements in mortality for males to Medicare, especially since somany other social programs were changing at the same time. In any case, itmay also be that a three-year period is too short to detect improvements inhealth status, especially for the aged, who have many chronic conditions thatmight be affected only slightly by medical care.
Since improvements in mortality do not take into account improvements inthe health of the living, changes in disability are also considered. In a crudemodel, Friedman regresses days of restricted activity for the aged on real percapita expenditures for the aged and reports highly significant results.Friedman suggests that in 1969 Medicare is "associated with a decline of 5.7disability days for men and 4.1 disability days for women." These resultsshould be interpreted cautiously since other important variables may beomitted from the model. Moreover, there is a problem of causality, and "freecare" in the pre-Medicare period may not be adequately accounted for.
Friedman then attempts to combine mortality and disability to determine thelikely range of the relative improvement in health status. He uses one of manypossible sets of assumptions, and in view of the value judgments thisspecification presumes, several alternative combinations might have beenmore helpful. Friedman computes the relative improvement in health afterMedicare for several possible values of the improvement in mortality anddisability. Unfortunately, he does not use the relative improvement in health tocalculate r, the dollar value of welfare gains.
In summary, Friedman has presented an interesting model to analyze thewelfare effects of Medicare on beneficiaries. To the extent that his empiricalresults can be attributed to Medicare, they reflect favorably on the program.Nevertheless, the model is limited in applicability and leaves untested manyother important aspects of a national health financing system.
387I
Mortality, Disability, and Medicare

I
NOTES A close exa1. That is; the Medicare reimbursement contract reimburses eligible persons for specified medical deviation betw
services if these services are rendered by recognized providers, relative deviati2. It is unclear how this model relates to the institutional features of Medicare. For example, Part A
1 belowof Medicare (primarily for institutional services) is mandatory and is financed by a payroll tax onemployers and currently employed workers. Benefits are paid out of current income and indeed
p ,, g
this feature may be viewed as an intergenerational transfer of wealth. Part B (primarily for care effect, bunoninstitutional services) is a voluntary program financed by premiums set annually and paid by between the olboth the beneficiary and government general revenues. Indeed, one can make an analogy real phenomenbetween the government and private employers if we consider Part B as a large group policy increasing agewith premiums paid by both enrollees and by government contributions. But the I
3. See especially Irwin Garfinkel, "Is In-Kind Redistribution Efficient?." Quarterly .Journal of . COflC Ii
Economics, 87 (May 1973), pp. 320—330. Friedman scan be followea given year isof care availatenvironmentalage, and year
Victor R. Fuchs .. completely ide
National Bureau of Economic Research I have atteiand Stanford University regressions of
1965 and 196I shall limit my comments to Friedman's attempt to determine the effect of difference betMedicare on mortality. This is, as he points out, a hazardous undertaking. The I have also Iavailable data cover only three full post-Medicare years, 1967—1 969, possibly the Medicaretoo short a period for any significant changes in mortality to emerg'e. In the predicted valtshort run death rates are subject to many random influences such as evidence thatinfluenza epidemics or variations in the severity of winter weather. aged.
Even if a longer period were available, however, the problem of establish- . I do not finding a causal connection between Medicare and mortality change would be view, are deteformidable. For the population as a whole, long-run trends in mortality are the 1960s, fordetermined primarily by environmental and behavioral changes and byadvances in medical technology, not by changes in quantity of medical care.From 1900 to the mid-i 930s, age-adjusted mortality of U.S. whites decreased TABLE 1at an average rate of about 1.3 per cent per year. The decline, which was onlyslightly more rapid for females than for males, was mostly the result of risingreal income and of basic public health measures. Very little was attributableto advances in medical science or increased quantity of medical care.
From the mid-1930s to the mid-1950s, age-adjusted death rates fell at a Agemuch faster rate: 1.7 per cent per year for white males and 2.9 per cent per
__________
year for white females. The acceleration was the result of rapid advances in 42medical technology, particularly the development of anti-infectious drugs. 47
Around 1954—1955 there was an abrupt change in trend (pointed out by 52
Friedman in his cohort charts). Since then, the age-adjusted male death rate 57
has been approximately constant. The female rate has continued to decline 62
but at a much slower pace: 0.7 per cent annually. 67
To test for the effects of Medicare, Friedman employs a cohort model withobservations at five-year intervals back to 1934. Regressions through 1964
82yield predicted age-specific mortality for 1969 that he compares with actualmortality. He finds a significant result for males but not for females. souRcE: Table2i
388 Friedman 389

rsons for specified medical
dicare. For example, Part Afinanced by a payroll tax oncurrent income and indeedealth. Part B (primarily forms set annually and paid byone can make an analogy
B as a large group policytions.nt?,' Quarterly Journal of
termine the effect ofous undertaking. The1967—1969, possiblyJity to emerge. In theinfluences such as
er weather.problem of establish-ity change would be?nds in mortality areral changes and byntity of medical care..S. whites decreaseddine, which was onlytly the result of risinglittle was attributabletf medical care.death rates fell at aand 2.9 per cent perof rapid advances inti-infectious drugs.rend (pointed out bysted male death ratecontinued to decline
a cohort model withssions through 1964
with actualfor females.
-i
A close examination of Friedman's Table 2 reveals a curious pattern ofdeviation between actual and predicted mortality rates in 1969, with therelative deviation decreasing systematically with age, as shown in my Table1 below.
By splitting the population at age 65, Friedman finds a significant "Medi-care effect," but if the population were split at 55 or 75, a significant differencebetween the older and younger ages would also emerge. There may be somereal phenomena at work that are systematically reducing mortality more withincreasing age, or the pattern may result from some bias in the cohort model.But the conclusion of a Medicare effect seems premature.
Friedman's cohort model is only one of several imperfect approaches thatcan be followed to test for Medicare effects. The mortality of any population ina given year is a function of its age, the state of medical science, the quantityof care available, the current environment, plus a host of past medical andenvironmental variables and previous mortality experience. Because cohort,age, and year are linked in an identity relationship, it is not possible tocompletely identify their separate effects.
I have attempted to test for a Medicare effect on mortality by fittingregressions of the form In M =a +bT to annual data for the periods 1955—1965 and 1967_1969.1 In no case can we reject the null hypothesis of nodifference between the periods. The F values are typically very small.
I have also used the 1955—1965 regressions to derive predicted values forthe Medicare years. The percentage difference between the actual and thepredicted values for these years is shown in Table 2. Again, there is noevidence that Medicare has had a significant effect on the mortality of theaged.
I do not find this result very surprising. Current changes in mortality, in myview, are determined primarily by nonmedical factors. During the decade ofthe 1960s, for instance, the death rate for emphysema for white males ages
TABLE 1 Relative Deviation betweenActual Mortality and Friedman'sPredicted Mortality, White Males,1969
Age (A—P)/P
42 +9.0%47 +9.152 +6.157 +3.162 +0.967 —1.972 —2.077 —4.1
82 . '—4.4
SOURCE: Table 2 in Frie dman's paper.
389 Mortality, Disability, and Medicare

TABLE 2 Percentage Deviation between Actual andPredicted Death Rates, 1967-1 969a
. ' Average
Sex Age 1967 1968 1969 1967—1969
Males 45—54
55—64
65—74
75—84
—1.4
+0,4—1.5
—1.4
+0.1+2.5+0.8+1.4
—2.3
+0.2—2.4
+0.5
—1.2
+1.1—1.0
+0.2
Females 45—54
55—64
65—74
75—84
—0.3
+1.2+0.3—2.8
+2.2+5.1+2.4+0.2
—0.6
+3.3+0.7—1.5
+0.5+3.2+1.1—1.4
'Predicted values based on regressions fitted to annual data. 1955—1965.
65—74 more than doubled, the rate for lung cancer increased by 25 per cent,and the rate for arteriosclerotic heart disease went up by 15 per cent. Theseincreases were not the result of a deterioration in the quantity or quality ofmedical care. During the same decade there were substantial (more than 25per cent) decreases in the death rates for cancer of the large intestine, rectum,and prostate. The medical profession has no firm explanation for thesedeclines and they are not believed to be the result of more medical care.
To pursue seriously the question of the effect of Medicare on mortality,several different approaches should be tried. For instance, it would bedesirable to disaggregate by cause of death. Particular attention could thenbe paid to those categories wherein there is some reason to believe thatincreased access to medical care should make a difference (e.g., infectiousdiseases). It might also be useful to disaggregate by state and region. Therewas probably some geographic variation in the impact of Medicare onutilization of care by the aged, and one could test for a relation between suchutilization and changes in mortality. Along the same Ilnes, it might be useful tolook at recent mortality experience in countries that did not experience anyshift in care for the elderly.
These comments, which have been limited to mortality, do not do justice tothe ambitious scope of Friedman's paper. They reflect my own belief in theneed for more intensive investigation of sharply defined questions.
390 Friedman 391
1(KARE
anROGE
REYN OLEThe Brookings Institu
MedicareAdministralgrams desigof a growinand most raprograms eexpenditurpected to 1million bybillion on rpeople.
Concernthe substanto medicalcharity car
The views expibustees, or othebeen provided
NOTES1. The year 1966 is omitted because Medicare was partially in effect.
M = age.sex.specilic death ratesT time