mott - ucsb physicsweb.physics.ucsb.edu/~balents/talks/mott.pdf · mott insulator imagine varying...
TRANSCRIPT

Mott transitionsOxide Interface Group Meeting
Outline
What is a Mott insulator?
Mott transitions as quantum phase transitions
Physics near the Mott transition
Mott Insulator
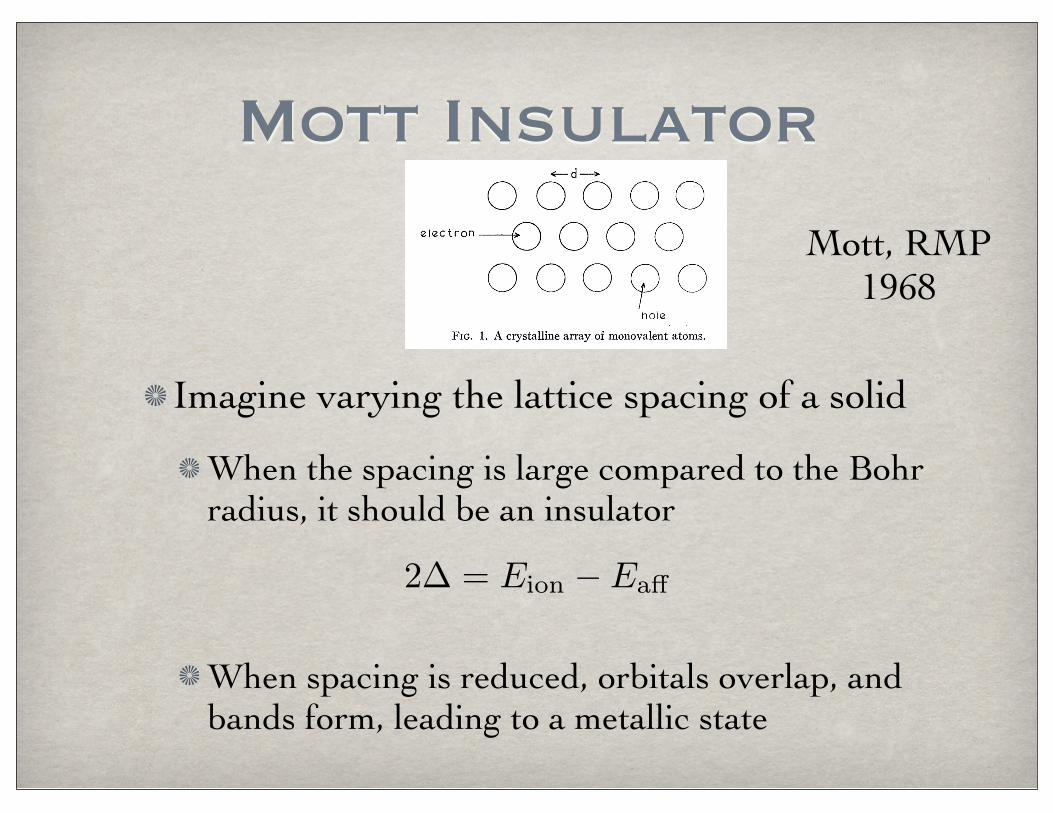
Imagine varying the lattice spacing of a solid
When the spacing is large compared to the Bohr radius, it should be an insulator
When spacing is reduced, orbitals overlap, and bands form, leading to a metallic state
2! = Eion ! Ea!
Mott, RMP 1968
Mott Insulator
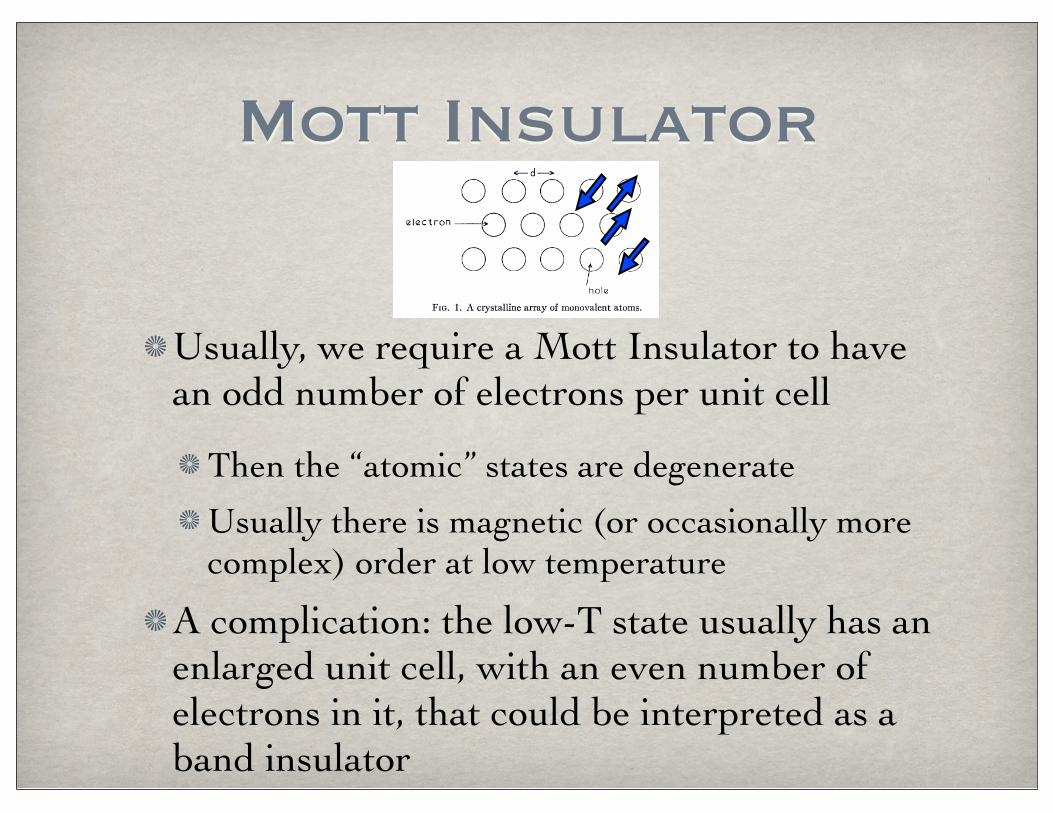
Usually, we require a Mott Insulator to have an odd number of electrons per unit cell
Then the “atomic” states are degenerate
Usually there is magnetic (or occasionally more complex) order at low temperature
A complication: the low-T state usually has an enlarged unit cell, with an even number of electrons in it, that could be interpreted as a band insulator
Mott Insulator
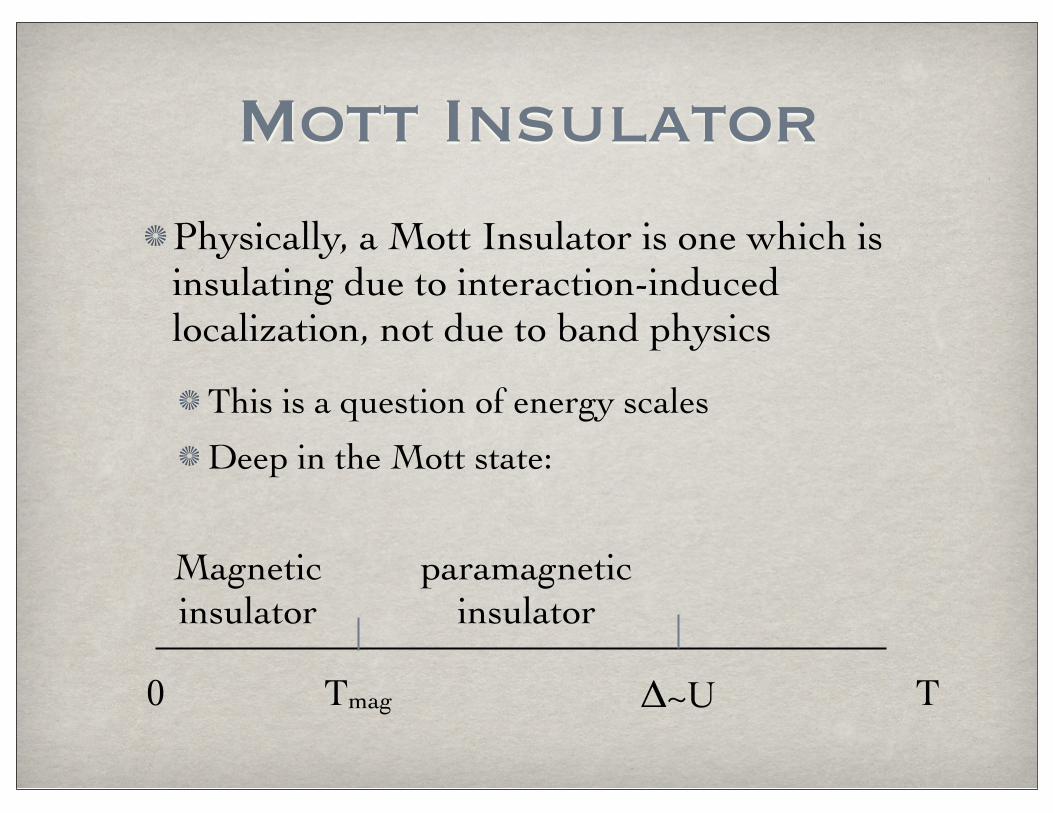
Physically, a Mott Insulator is one which is insulating due to interaction-induced localization, not due to band physics
This is a question of energy scales
Deep in the Mott state:
TΔ~UTmag
paramagnetic insulator
Magnetic insulator
0
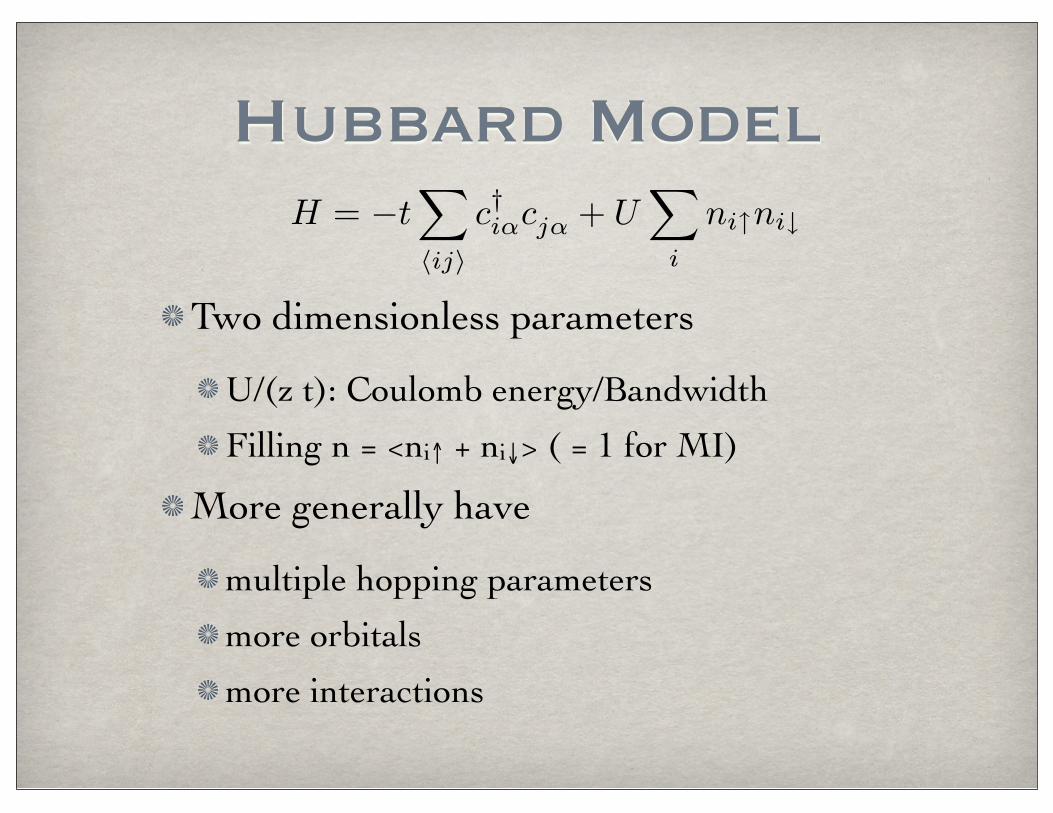
Hubbard Model
Two dimensionless parameters
U/(z t): Coulomb energy/Bandwidth
Filling n = <ni↑ + ni↓> ( = 1 for MI)
More generally have
multiple hopping parameters
more orbitals
more interactions
H = !t!
!ij"
c†i!cj! + U!
i
ni#ni$
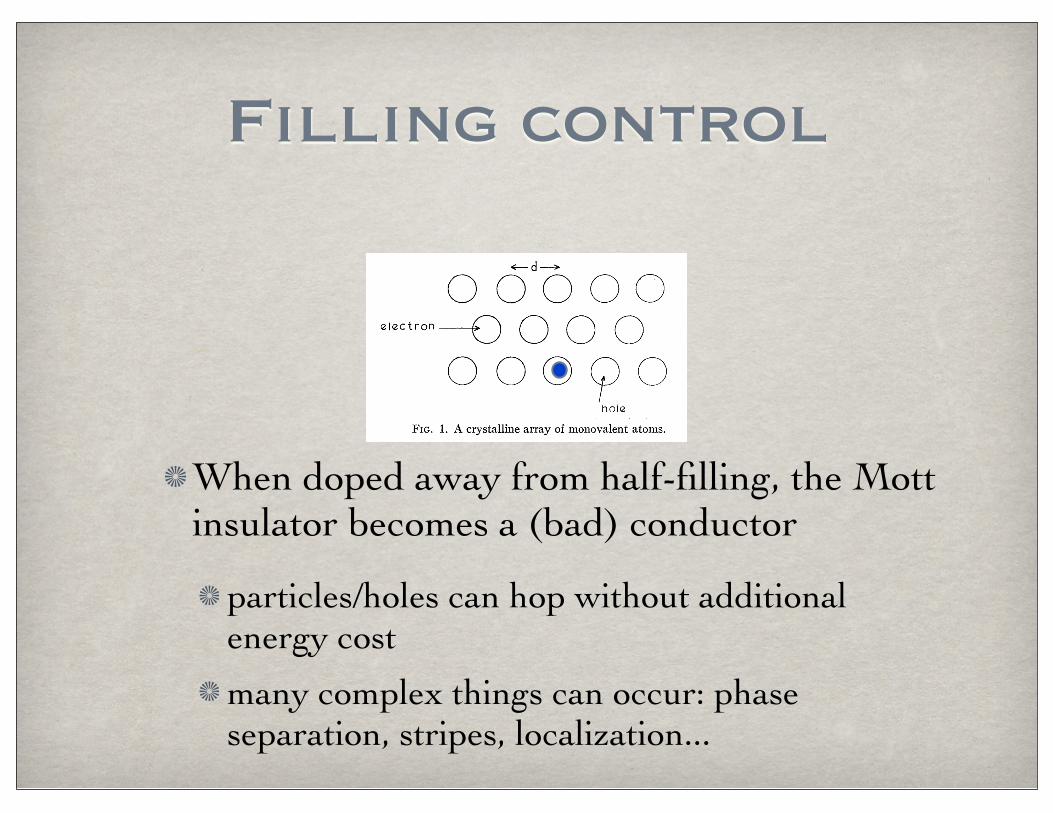
Filling control
When doped away from half-filling, the Mott insulator becomes a (bad) conductor
particles/holes can hop without additional energy cost
many complex things can occur: phase separation, stripes, localization...
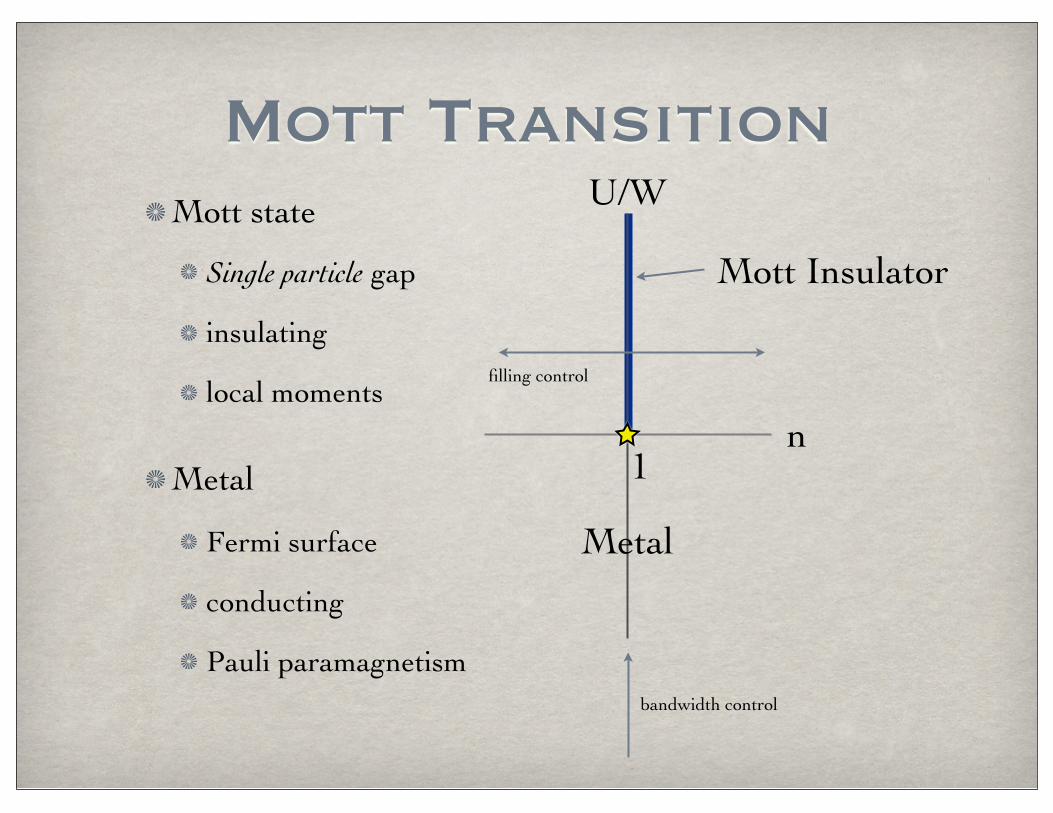
Mott TransitionMott state
Single particle gap
insulating
local moments
Metal
Fermi surface
conducting
Pauli paramagnetism
U/W
Mott Insulator
Metal
n1
filling control
bandwidth control
Quantum Phase Transitions
Any phase transition at T=0 is a quantum phase transition (QPT)
“Quantum” because at T=0 there is perfect phase coherence
At T>0, there is always some finite dephasing length, beyond which the physics is effectively classical
The Mott transition (at T=0) is a QPT.
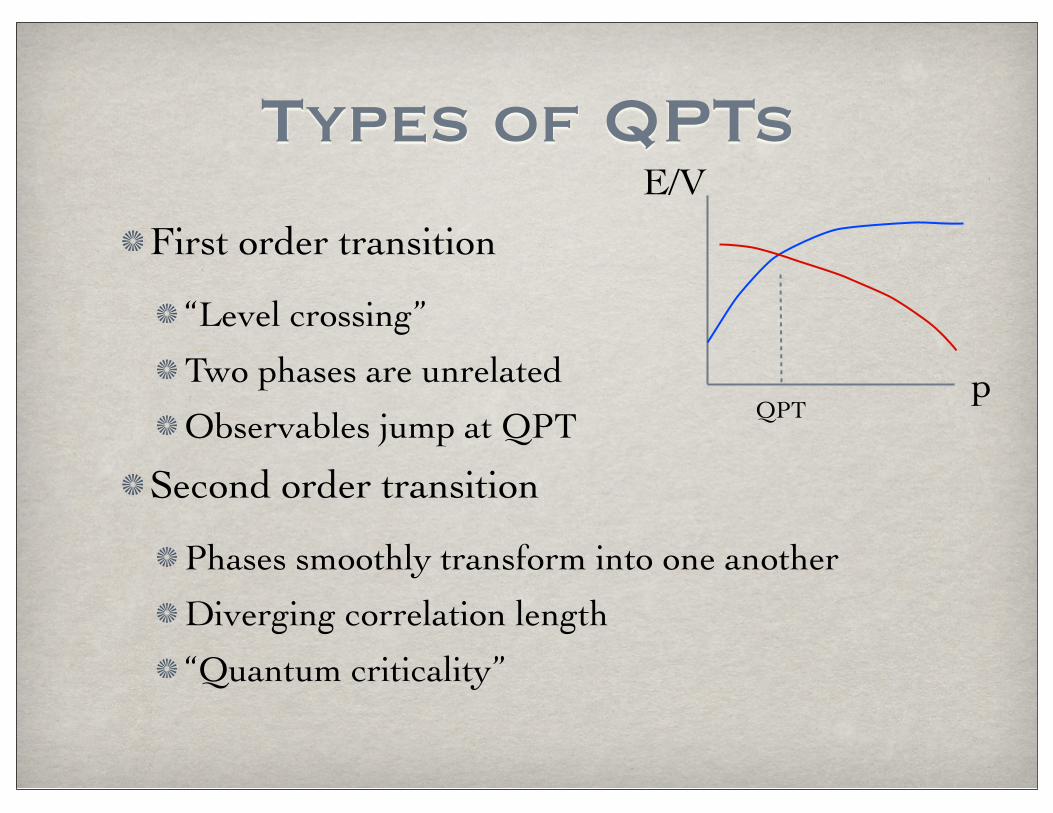
Types of QPTs
First order transition
“Level crossing”
Two phases are unrelated
Observables jump at QPT
Second order transition
Phases smoothly transform into one another
Diverging correlation length
“Quantum criticality”
p
E/V
QPT
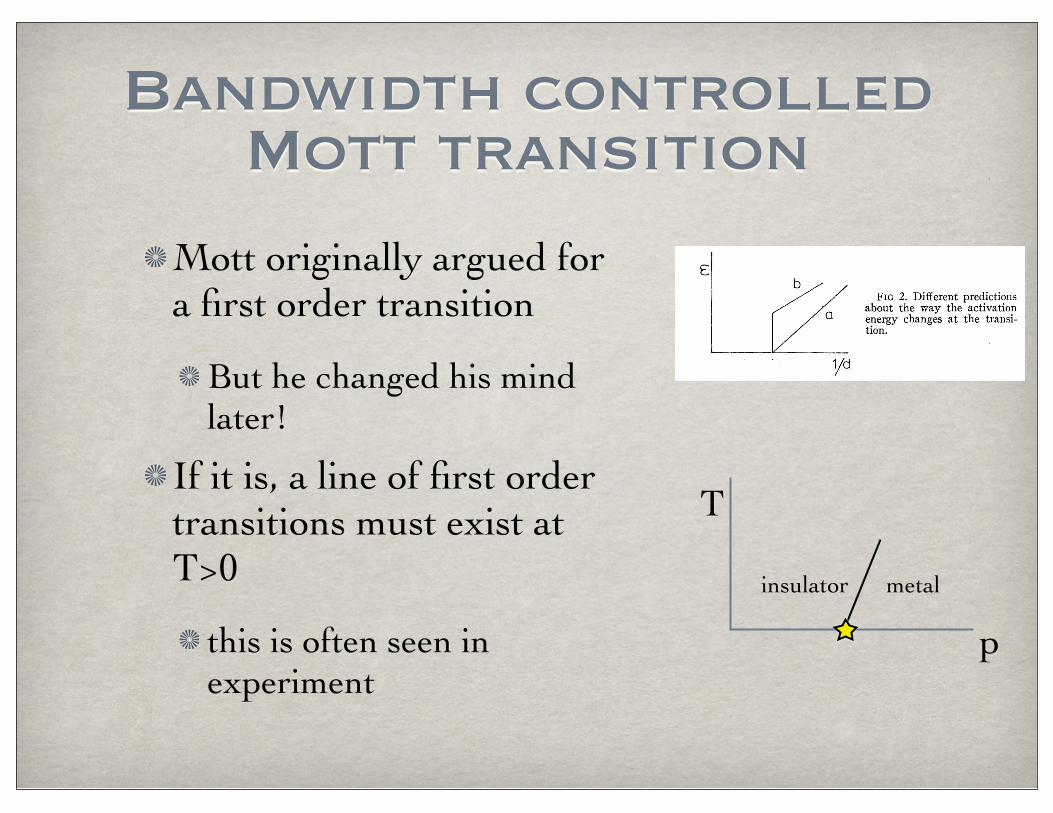
Bandwidth controlled Mott transition
Mott originally argued for a first order transition
But he changed his mind later!
If it is, a line of first order transitions must exist at T>0
this is often seen in experiment
T
p
insulator metal
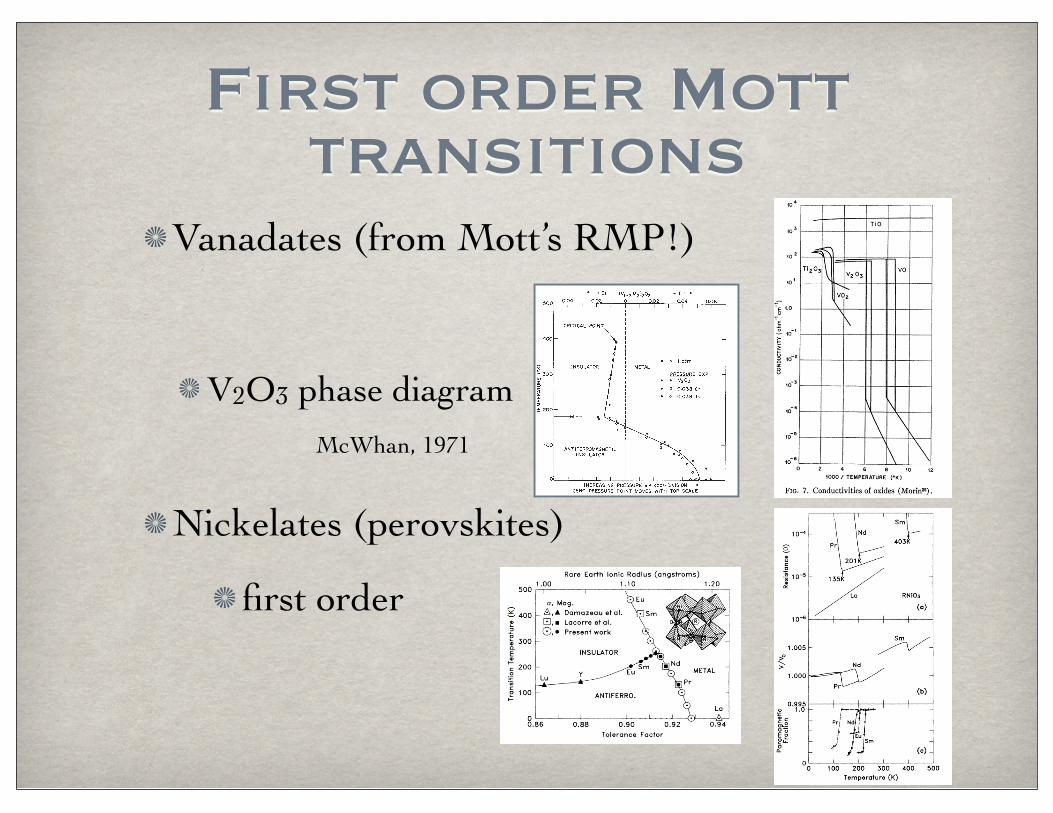
First order Mott transitions
Vanadates (from Mott’s RMP!)
V2O3 phase diagram
Nickelates (perovskites)
first order
(d1-d2L! ) hybridization (Uozumi et al., 1993). Cluster-model analysis has revealed considerable weight ofcharge-transfer configurations, d3L! ,d4L! 2,. . . , mixed intothe ionic d2 configuration, resulting in a net d-electronnumber of nd!3.1 (Bocquet et al., 1996). This value isconsiderably larger than the d-band filling or the formald-electron number n!2 and is in good agreement withthe value (nd!3.0) deduced from an analysis of core-core-valence Auger spectra (Sawatzky and Post, 1979).If the above local-cluster CI picture is relevant to experi-ment, the antibonding counterpart of the split-off bond-ing state is predicted to be observed as a satellite on thehigh-binding-energy side of the O 2p band, although itsspectral weight may be much smaller than the bondingstate [due to interference between the d2!d1"e andd3L!!d2L! "e photoemission channels; see Eq. (3.12)].Such a spectral feature was indeed observed in an ultra-violet photoemission study by Smith and Henrich (1988)and in a resonant photoemission study by Park andAllen (1997). In spite of the strong p-d hybridizationand the resulting charge-transfer satellite mechanism de-scribed above, it is not only convenient but also realisticto regard the d1-d2L! bonding band as an effective V 3dband (lower Hubbard band). The 3d wave function isthus considerably hybridized with oxygen p orbitals andhence has a relatively small effective U of 1–2 eV (Sa-watzky and Post, 1979) instead of the bare value U!4 eV. Therefore the effective d bandwidth W becomescomparable to the effective U : W!U . With these factsin mind, one can regard V2O3 as a model Mott-Hubbardsystem and the (degenerate) Hubbard model as a rel-evant model for analyzing the physical properties ofV2O3.
The time-honored phase diagram for doped V2O3 sys-tems, (V1#xCrx)2O3 and (V1#xTix)2O3 , is reproducedin Fig. 70. The phase boundary represented by the solidline is of first order, accompanied by thermal hysteresis(Kuwamoto, Honig, and Appel, 1980). In a Cr-dopedsystem (V1#xCrx)2O3 , a gradual crossover is observedfrom the high-temperature paramagnetic metal (PM) to
FIG. 69. Photoemission spectra of V2O3 in the metallic phasetaken using photon energies in the 3p-3d core excitation re-gion. From Shin et al., 1990.
FIG. 68. Corundum structure of V2O3.
FIG. 70. Phase diagram for doped V2O3 systems,(V1#xCrx)2O3 and (V1#xTix)2O3. From McWhan et al., 1971,1973.
1147Imada, Fujimori, and Tokura: Metal-insulator transitions
Rev. Mod. Phys., Vol. 70, No. 4, October 1998
McWhan, 1971
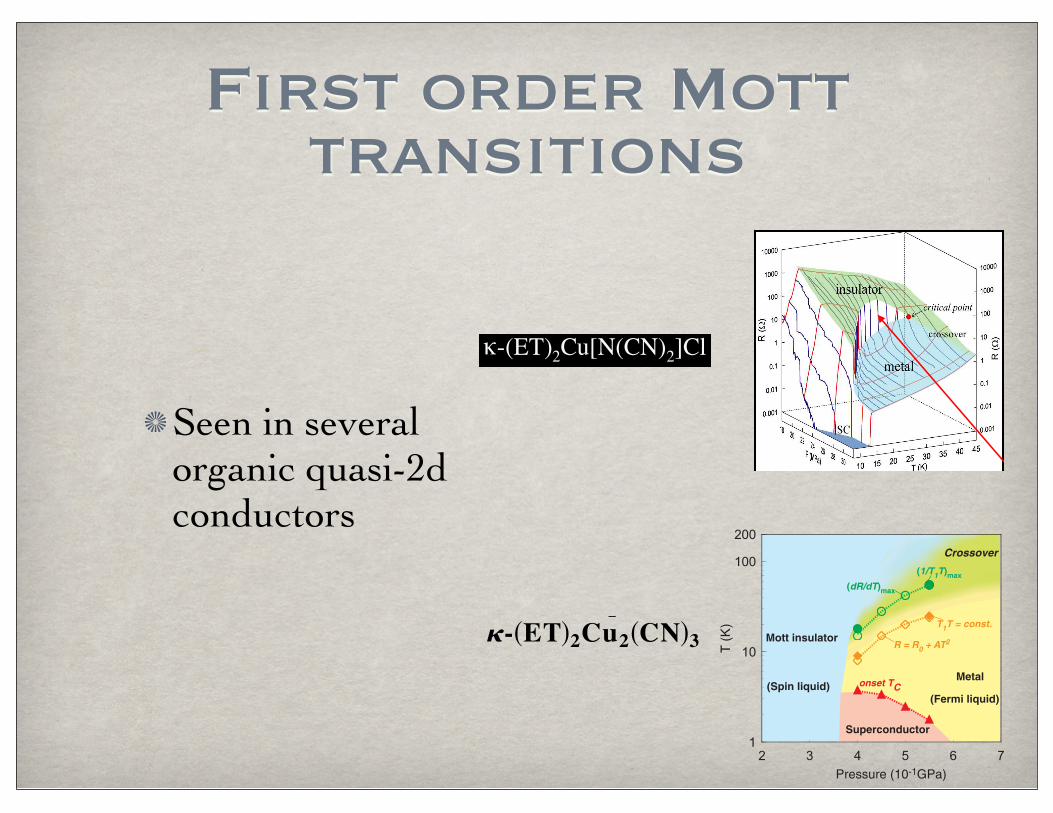
First order Mott transitions
Seen in several organic quasi-2d conductors
Mott Criticality and Spin Liquid State Revealed in Quasi-2D Organics
Dr. K. Kanoda, University of Tokyo (KITP Exotic Order Program 6/15/04) 7
NMR, ac-!
Lefebvre et al.
Ultrasonic
Fournier et al.
Resistivity
Ito et al.
Limelette et al.
T•
K•
100
10
1
Paramagnetic
insulator
Paramagnetic
metal
SCAF
insulator
"-(ET)2Cu[N(CN)2]Cl
He gas pressure
pressure
Experimental
Conductivity measurements under pressure sweep at low T.
U/Wpressure
Analogous to
Transport criticality of first-order Mott transition
in "-(ET)2Cu[N(CN)2]Cl by He pressure
Resistance jump by 2 orders of magnitude
V
T
P
gas
liquid
gas-liquid
transition
PRB 69(2004)064511
Mott Transition from a Spin Liquid to a Fermi Liquid in the Spin-Frustrated Organic Conductor!-!ET"2Cu2!CN"3
Y. Kurosaki,1 Y. Shimizu,1,2,* K. Miyagawa,1,3 K. Kanoda,1,3 and G. Saito2
1Department of Applied Physics, University of Tokyo, Bunkyo-ku, Tokyo, 113-8656, Japan2Division of Chemistry, Kyoto University, Sakyo-ku, Kyoto, 606-8502, Japan
3CREST, Japan Science and Technology Corporation, Kawaguchi 332-0012, Japan(Received 15 October 2004; revised manuscript received 6 April 2005; published 18 October 2005)
The pressure-temperature phase diagram of the organic Mott insulator !-!ET"2Cu2!CN"3, a modelsystem of the spin liquid on triangular lattice, has been investigated by 1H NMR and resistivitymeasurements. The spin-liquid phase is persistent before the Mott transition to the metal or super-conducting phase under pressure. At the Mott transition, the spin fluctuations are rapidly suppressed andthe Fermi-liquid features are observed in the temperature dependence of the spin-lattice relaxation rateand resistivity. The characteristic curvature of the Mott boundary in the phase diagram highlights a crucialeffect of the spin frustration on the Mott transition.
DOI: 10.1103/PhysRevLett.95.177001 PACS numbers: 74.25.Nf, 71.27.+a, 74.70.Kn, 76.60.2k
Magnetic interaction on the verge of the Mott transitionis one of the chief subjects in the physics of stronglycorrelated electrons, because striking phenomena such asunconventional superconductivity emerge from the motherMott insulator with antiferromagnetic (AFM) order.Examples are transition metal oxides such as V2O3 andLa2CuO4, in which localized paramagnetic spins undergothe AFM transition at low temperatures [1]. The groundstate of the Mott insulator is, however, no more trivialwhen the spin frustration works between the localizedspins. Realization of the spin liquid has attracted muchattention since a proposal of the possibility in a triangular-lattice Heisenberg antiferromagnet [2]. Owing to the ex-tensive materials research, some examples of the possiblespin liquid have been found in systems with triangular andkagome lattices, such as the solid 3He layer [3], Cs2CuCl4[4], and !-!ET"2Cu2!CN"3 [5]. Mott transitions betweenmetallic and insulating spin-liquid phases are an interestingnew area of research.
The layered organic conductor !-!ET"2Cu2!CN"3 is theonly spin-liquid system to exhibit the Mott transition, tothe authors’ knowledge [5]. The conduction layer in!-!ET"2Cu2!CN"3 consists of strongly dimerized ET[bis(ethlylenedithio)-tetrathiafulvalene] molecules withone hole per dimer site, so that the on-site Coulombrepulsion inhibits the hole transfer [6]. In fact, it is aMott insulator at ambient pressure and becomes a metalor superconductor under pressure [7]. Taking the dimer as aunit, the network of interdimer transfer integrals forms anearly isotropic triangular lattice, and therefore the systemcan be modeled to a half-filled band system with strongspin frustration on the triangular lattice. At ambient pres-sure, the magnetic susceptibility behaved as the triangular-lattice Heisenberg model with an AFM interaction energyJ# 250 K [5,8]. Moreover, the 1H NMR measurementsprovided no indication of long-range magnetic order downto 32 mK. These results suggested the spin-liquid state at
ambient pressure. Then the Mott transition in!-!ET"2Cu2!CN"3 under pressure may be the unprece-dented one without symmetry breaking, if the magneticorder does not emerge under pressure up to the Mottboundary.
In this Letter, we report on the NMR and resistancestudies of the Mott transition in !-!ET"2Cu2!CN"3 underpressure. The result is summarized by the pressure-temperature (P-T) phase diagram in Fig. 1. The Mott
Superconductor
(Fermi liquid)
Crossover
(Spin liquid) onset TC
R = R0 + AT2
T1T = const.
(dR/dT)max
(1/T1T)max
Mott insulator
Metal
Pressure (10-1GPa)
FIG. 1 (color online). The pressure-temperature phase diagramof !-!ET"2Cu2!CN"3, constructed on the basis of the resistanceand NMR measurements under hydrostatic pressures. The Motttransition or crossover lines were identified as the temperaturewhere 1=T1T and dR=dT show the maximum as described in thetext. The upper limit of the Fermi-liquid region was defined bythe temperatures where 1=T1T and R deviate from the Korringa’srelation and R0 $ AT2, respectively. The onset superconductingtransition temperature was determined from the in-plane resis-tance measurements.
PRL 95, 177001 (2005) P H Y S I C A L R E V I E W L E T T E R S week ending21 OCTOBER 2005
0031-9007=05=95(17)=177001(4)$23.00 177001-1 ! 2005 The American Physical Society
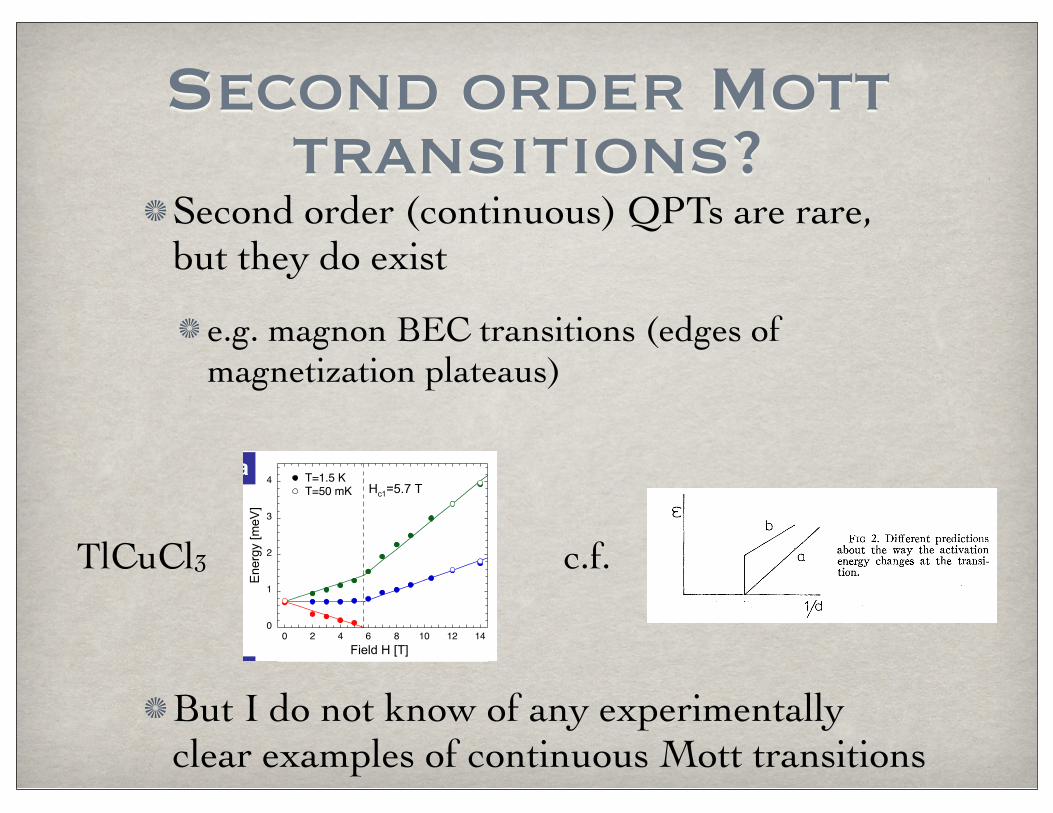
Second order Mott transitions?
Second order (continuous) QPTs are rare, but they do exist
e.g. magnon BEC transitions (edges of magnetization plateaus)
But I do not know of any experimentally clear examples of continuous Mott transitions
TlCuCl3
16
0
1
2
3
4 T=1.5 K
T=50 mK
0 2 4 6 8 10 12 14
a
dc
b
Field H [T]
Hc1=5.7 T
Energ
y [
meV
]
Momentum (0 qk 0) [r.l.u.]
Field H [T]
T [K
]
T [K]
mz(T
) [1
0-3
µB/C
u2
+]
Energ
y [
meV
]
FIG. 2: Experimental results on magnon BEC: (a) Zeeman splitting of the triplet modes in TlCuCl3 up to
H > Hc1 measured by inelastic neutron scattering [14, 27, 28]. (b) Phase diagram of BaCuSi2O6 measured by
torque magnetisation, magneto-caloric e!ect, and specific heat [32, 33]. Dimensional reduction was reported
in this material with a crossover from the 3D-BEC critical exponent ! = 2/3 to ! = 1 for 2D at temperatures
close to the QCP [33]. (c) Excitations in the BEC of triplons realized in TlCuCl3 [14, 27, 28]. Goldstone
mode with linear dispersion around k0. Spin anisotropy generally leads to a spin gap in real materials
[27, 28, 29]. (d) Temperature-dependence of the magnetisation mz(T ) in TlCuCl3 for fixed magnetic field
H , as indicated [8]. Minima at the finite-temperature phase transition (vertical arrows), as expected for a
BEC of triplons.
c.f.
Continuous Mott Transitions?
Theoretically, this is an active suggestion
Might occur in frustrated situations
Even if it doesn’t, the most interesting situation is when the transition is only “weakly” first order
In this case, the material combines features of metals and insulators, and exhibits strong fluctuations, near the transition

Some physical features
Features of the Mott Transition
On the metallic side
formation of band at the Fermi energy
mass enhancement
anomalous scattering
On the insulating side
magnetic order
quasiparticle gap
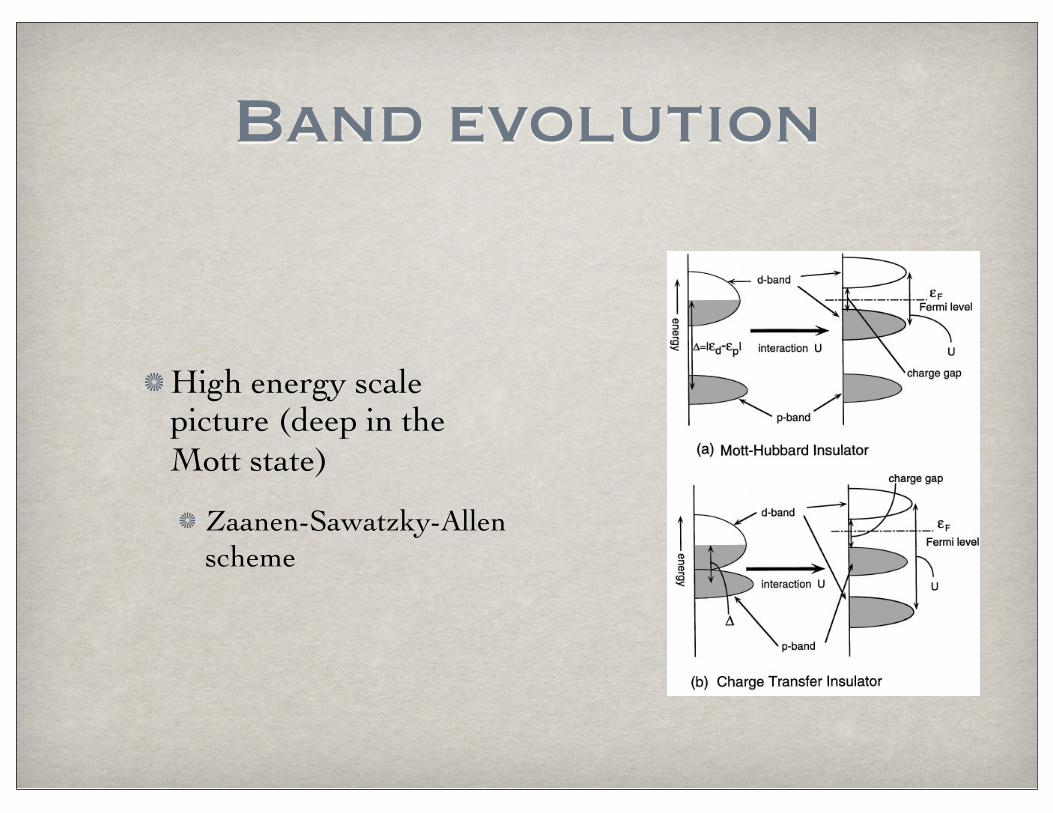
Band evolution
High energy scale picture (deep in the Mott state)
Zaanen-Sawatzky-Allen scheme
and the Fermi level lies near one of them. However, ithas been argued that some low-energy excitations dis-play differences between the Mott-Hubbard and CTtypes (Emery, 1987; Varma, Schmitt-Rink, and Abra-hams, 1987). With a decrease in !, the MIT may occureven at half-filling. This is probably the reason why Nicompounds become more metallic when one changesthe ligand atom from oxygen, sulfur to selenium.
Low-energy excitations of the Mott insulating phasein transition-metal compounds are governed by theKramers-Anderson superexchange interaction, in whichonly collective excitations of spin degrees of freedomare vital (Kramers, 1934; Anderson, 1963a, 1963b). Thesecond-order perturbation in terms of t/U in the Hub-bard model, as in Figs. 4(b) and 4(c), or the fourth-orderperturbation in terms of tpd /!"d!"p! or tpd /Udd in thed-p model yield the spin-1/2 Heisenberg model at halfband filling of d electrons:
HHeis"J#$ij%
Si•Sj , (2.12)
where Si#"Si
x#iSiy"ci!
† ci" , Si!"Si
x!iSiy"ci"
† ci! andSi
z" 12 (ni!!ni"). Here J is given in the perturbation ex-
pansion as J" 4t2/U for the Hubbard model and
J"8tpd
4
& !"d!"p!#Vpd'2& !"d!"p!#Upp'
#4tpd
4
& !"d!"p!#Vpd'2Udd
for the d-p model. The exchange between two d orbit-als, 1 and 2, in the presence of the ligand p orbital 3, isindeed derived from the direct exchange between the dorbital 1 and the neighboring p orbital 3, which is hy-bridized with the other d orbital 2 or vice versa. Thisgenerates a ‘‘superexchange’’ between 1 and 2 in theorder shown above (Anderson, 1959). Even for dopedsystems, a second-order perturbation in terms of t/U inthe Hubbard model leads to the so-called t-J model(Chao, Spalek, and Oles, 1977; Hirsch, 1985a; Anderson,1987),
Ht-J"! #$ij%(
Pd& t ijc i(† cj(#H.c.'Pd#J#
$ij%Si•Sj ,
(2.13)
where Pd is a projection operator to exclude the doubleoccupancy of particles at the same site. To derive Eq.(2.13), we neglect the so-called three-site term given by
H t!J! )#$ilj%
ci(† &Sl'((!cj(! (2.14)
from the assumption that the basic physics may be thesame. However, this is a controversial issue, since it ap-pears to make a substantial difference in spectral prop-erties (Eskes et al., 1994) and superconducting instability(Assaad, Imada, and Scalapino, 1997). It was stressedthat the t-J model (2.13) represents an effective Hamil-tonian of the d-p model (2.11a) by extracting the singletnature of a doped p hole and a localized d hole coupledwith it (Zhang and Rice, 1988). Of course, for highlydoped system far away from the Mott insulator, it isquestionable whether Eq. (2.13) with doping-independent J can be justified as the effective Hamil-tonian.
B. Variety of metal-insulator transitionsand correlated metals
In order to discuss various aspects of correlated met-als, insulators, and the MIT observed in d-electron sys-tems, it is important first to classify and distinguish sev-eral different types. To understand anomalous featuresin recent experiments, we must keep in mind the impor-tant parameter, dimensionality. We should also keep inmind that both spin and orbital degrees of freedom playcrucial roles in determining the character of the transi-tion. Metal-insulator transitions may be broadly classi-fied according to the presence or the absence of symme-try breaking in the component degrees of freedom onboth the insulating and the metallic side, because differ-ent types of broken-symmetry states cannot be adiabati-cally connected. Here we employ the term ‘‘component’’to represent both spin and orbital degrees of freedom ind-electron systems. Symmetry breaking in Mott insula-tors as well as in metals is due to the multiplicity of theparticle components. For example, for antiferromagneticorder, the symmetry of multiple spin degrees of freedomis broken.
FIG. 5. Schematic illustration of energy levels for (a) a Mott-Hubbard insulator and (b) a charge-transfer insulator gener-ated by the d-site interaction effect.
1053Imada, Fujimori, and Tokura: Metal-insulator transitions
Rev. Mod. Phys., Vol. 70, No. 4, October 1998
In perovskitesI H Inoue
F
e4+
Insulator
Metal
3 +
M
n
S
rC
aL
a
Y3 +
3 +
2 +
2 +
d d d d d d d d d10 2 3 4 5 6 7 8
U/W!
W/
Co3 +
Cu3 +
Cu3 +
N
i3 +
N
i3 +N
i4
+
N
i4 +
C
r4 +
Cr3+
T
i4 +
T
i3 +
T
i3 +
V3 +
V4 +
V3 +
V4 +
C
r4 +
Cr3+
Mn4+
Mn4+
F
e3 +
F
e3 +
F
e4+
C
o4 +
C
o4 +
Co3 +
Ti4 +
Mn3 +
B
a
n
d
i
n
s
u
l
a
t
o
r
Mott insulator Charge Transfer insulator
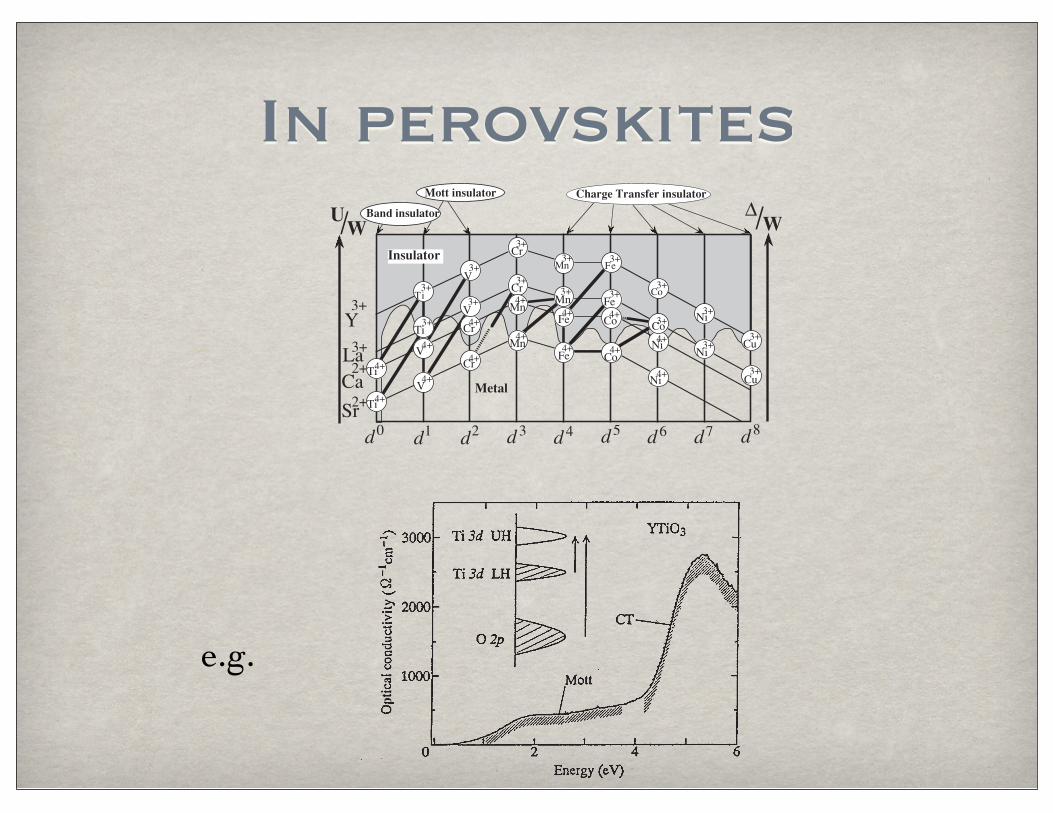
Figure 4. Schematic phase diagram of ABO3 for A = Y3+, La3+, Ca2+ and Sr2+. U is the electron–electron repulsion energy; W is theone-electron bandwidth and ! is the charge transfer energy between the TM 3d band and the oxygen 2p band3. Solid solutions which havebeen investigated so far are represented by thick solid lines [28].
(1) Filling control. Nominal number of conduction electronsper unit formula is controlled by the chemical substitutionof an A ion for that of different valence.
(2) Bandwidth control. B–O–B bond angle can be changedby changing the ionic radius of the A-site ion. The bond-angle buckling is governed by the so-called tolerancefactor f of the perovskite-type compounds ABO3 definedas
f = RA + RO!2(RB + RO)
,
where RA, RO and RB are the ionic radii of the A ion, theO ion (oxygen) and the B ion, respectively. When thevalue of f is almost 1, the system is cubic; while forf < 1, the lattice structure changes to rhombohedraland then to the orthorhombic GdFeO3 type. In theorthorhombic perovskite structure, it is known that the B–O–B bond angle decreases continuously with decreasingf almost irrespective of the set of A and B [29]. Thebuckling of the B–O–B bond angle reduces the bandwidthW , since the effective d-electron transfer interactionbetween the neighbouring B sites is governed by thesupertransfer process via the O 2p state. Thus, the ratioof the Coulomb interaction U to W (U is consideredto be kept almost constant by the substitution) can besystematically controlled.
(3) Dimension control. By changing the crystal structurefrom the simple perovskite to the layered perovskite, suchas A2BO4, we can follow how the electronic states changeby reducing the network paths of the system.
These guiding principles promote systematic researchesof the perovskite TM oxides; hence the materials have beenfavoured for investigating strong correlation effects. Partof the filling control and the bandwidth control researches
3 ‘Charge-transfer insulator’ is beyond the scope of this paper but is animportant concept for understanding the physics of TM oxides: in the charge-transfer insulator, the charge gap opens between the highest occupied one-electron state in the O 2p band and the lowest unoccupied one-electron statesin the TM 3d band, which are eliminated from the occupied one-electron statesin TM 3d band by the electron correlations.
Figure 5. Phase diagram of Nd1"xSrxMnO3. (Figure reprinted withpermission from [32]. Copyright 1999 by the American PhysicalSociety.) PM stands for paramagnetic insulator, FM forferromagnetic metal, AFM for antiferromagnetic metal and CO-I forcharge-ordered insulator. CE, A, C and CAF denote ordered statesof the spin and/or charge.
are summarized in a schematic phase diagram shown in figure 4(originally in [28]). The four thin lines, which connect theB-site TM cations, correspond to A = Y3+, La3+, Ca2+ andSr2+. ! is the charge transfer energy between the TM 3d bandand the oxygen 2p band. Simple band calculations with thelocal density approximation show all the materials in figure 4except for the 3d0 band insulator should be metallic. However,several compounds in the shaded area are insulating, i.e., thestrong electron correlations play an important role in openingthe energy gap.
Perovskite manganites, in particular, show a variety ofphase diagrams. A typical example is depicted in figure 5(after [32]), where several ordered states appear when thehole carrier number is changed. The phase competition isa characteristic of the strongly correlated electron system.A subtle modulation of the carrier density on the verge ofthe phase boundary is the fundamental idea of the correlatedelectron device.
S114
energy derivative of the self-energy [Eq. (2.73d)]. Here,we have assumed that the quasiparticle residue Zk(!)[Eq. (2.70)] does not vary significantly within the quasi-particle band (Zk(!)"mb /m!). Then the coherent-to-incoherent spectral weight ratio is given by mb /m! :(1!mb /m!). The remarkable spectral weight transferfrom the coherent part to the incoherent part in goingfrom SrVO3 to CaVO3 means that m! increases as thesystem approaches the Mott transition from the metallicside. The observed simultaneous decrease in spectral in-tensity at EF indicates that mk decreases towards theMott transition: for SrVO3, mk /mb!0.25, m! /mb!6,and m*/mb!1.5; for CaVO3, mk /mb!0.07, m! /mb!20, and m*/mb!1.4. Almost the same m* for the twocompounds is consistent with the specific heat # and theeffective electron numbers ($1/m*) deduced from anevaluation of the optical conductivity at about 1.5 eV(Dougier, Fan, and Goodenough, 1975).
B. Filling-control metal-insulator transition systems
1. R1!xAxTiO3
The perovskitelike RTiO3 (where R is a trivalentrare-earth ion) and its ‘‘hole-doped’’ analogR1!xAxTiO3 (where A is a divalent alkaline-earth ion)are among the most appropriate systems for experimen-tal investigations of the FC-MIT. The end memberRTiO3 is a typical Mott-Hubbard (MH) insulator withTi3" 3d1 configuration, and the A (Sr or Ca) content (x)represents a nominal ‘‘hole’’ concentration per Ti site,or equivalently the 3d band filing (n) is given by n#1!x .
The electronic and magnetic phase diagram forR1!xSrxTiO3 is depicted in Fig. 101. The crystalline lat-tice is an orthorhombically distorted perovskite (of theGdFeO3 type; see Fig. 61). As described in detail in Sec.III.C.1, the Ti-O-Ti bond angle distortion, which affects
the transfer energy (t) of the 3d electron or the one-electron bandwidth (W), depends critically on the ionicradii of the (R ,A) ions or the tolerance factor. For ex-ample, the Ti-O-Ti bond angle is 157° for LaTiO3 butdecreases to 144° (ab plane) and 140° (c axis) forYTiO3 (MacLean et al., 1979), which causes a reductionin W of the t2g state by as much as 20%, according to anestimate by a simple tight-binding approximation(Okimoto et al., 1995b). The W value can be finely con-trolled by use of the solid solution La1!yYyTiO3 or inRTiO3 by varying the R ions. The abscissa in Fig. 101thus represents the effective correlation strength U/W .
On the end (x#0) plane, the variation of the antifer-romagnetic (AF) and ferromagnetic (F) transition tem-peratures is plotted for La1!yYyTiO3 (Goral, Greedan,and MacLean, 1982; Okimoto et al., 1995b). Due to or-bital degeneracy and orbital ordering, the x#0 insula-tors with large U/W value or a Y-rich (y$0.2) regionshow a ferromagnetic ground state. In fact, a recentstudy using polarized neutrons showed the presence oft2g orbital ordering associated with a minimal Jahn-Teller distortion of TiO6 octahedron (Akimitsu et al.,1998).
Figure 102 shows the optical conductivity spectrum ofthe gap excitations in YTiO3 (Okimoto et al., 1995b):The onset of the Mott-Hubbard gap transition can beclearly seen around 1 eV, while the rise in optical con-ductivity around 4 eV is ascribed to the charge-transfergap between the O 2p filled state and the Ti 3d upperHubbard band. The observation of the two kinds of gaptransition and their relative positions indicate thatRTiO3 is a Mott-Hubbard insulator rather than a CTinsulator in the scheme of Zaanen, Sawatzky, and Allen.The U/W dependence of the Mott-Hubbard gap magni-tude (Eg) normalized by W , which was obtained by op-tical measurements of La1!yYyTiO3 (Okimoto et al.,1995b), is plotted in the x#0 end plane of Fig. 101. TheMott-Hubbard gap magnitude changes critically with arather gentle change (#20%) of W . A similar W de-pendence of the Mott-Hubbard gap was also observedfor a series of RTiO3 (Crandles et al., 1994; Katsufuji,
FIG. 101. Electronic and magnetic phase diagram for theR1!xSrxTiO3.
FIG. 102. Optical conductivity in YTiO3. From Okimoto et al.,1995b.
1165Imada, Fujimori, and Tokura: Metal-insulator transitions
Rev. Mod. Phys., Vol. 70, No. 4, October 1998
e.g.
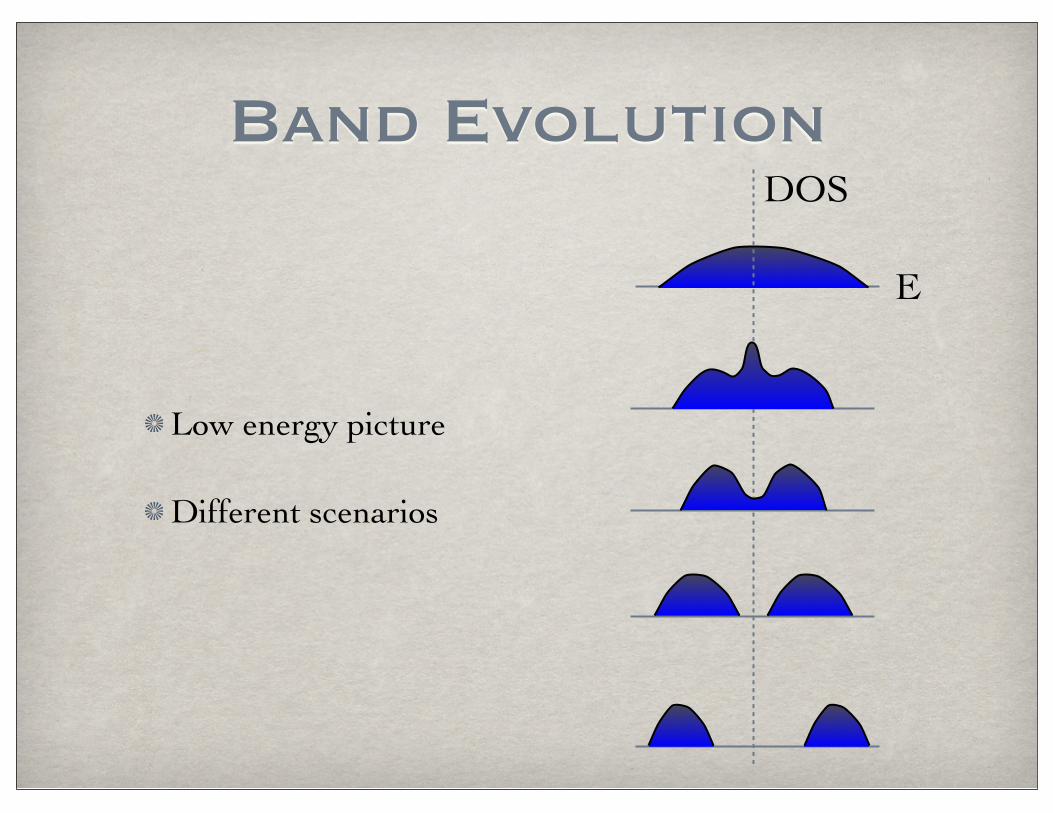
Band Evolution
Low energy picture
Different scenarios
E
DOS
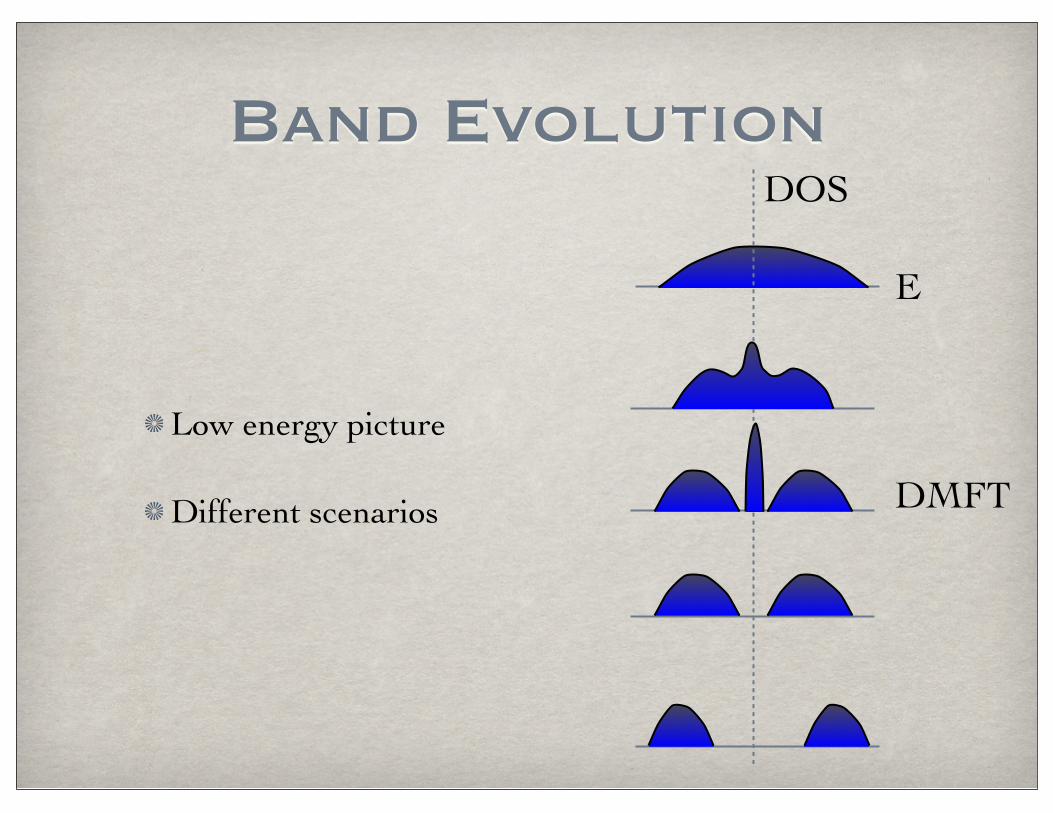
Band Evolution
Low energy picture
Different scenarios
E
DMFT
DOS

Filling Control
Spectral weight transfer
Sawatzky
1994) and using numerical simulations of Hubbard clus-ters (Dagotto et al., 1991; Li et al., 1991; Bulut et al.,1994a). Decrease of the spectral weight below EF occursin the Zhang-Rice singlet band !d9!d9L! (1A1g) spec-tral weight], which was regarded as the effective lowerHubbard band when the high-energy part of the originalp-d Hamiltonian is projected out and the Hubbardmodel or the t-J model is employed as the effective low-
energy Hamiltonian. The decrease in the spectral weightof the Zhang-Rice singlet with hole doping is not easy todetect because of the overlapping intense oxygen 2pband. Figure 131(a) shows combined photoemission andinverse-photoemission spectra of La2!xSrxCuO4 (Inoet al., 1997c). The doping-induced spectral weight is notconcentrated just above EF , as suggested by previousx-ray absorption studies, but is distributed over thewhole band-gap region with the DOS peak "1.5 eVabove EF . Thus spectral weight transfer occurs over arelatively wide energy range, within a few eV of EF , andthe Fermi level is located at a broad minimum of theDOS, as schematically shown in Fig. 131(b). The spec-tral DOS at EF is much weaker than that given by LDAband-structure calculations even for optimally dopedand overdoped samples, indicating that the quasiparticleweight is very small: Z"1. In underdoped samples,there is even a pseudogap feature at EF , which evolvesinto the insulating gap at x#0.
The EF or the electron chemical potential inLa1!xSrxCuO4 deduced from the shifts of various corelevels exhibits an interesting behavior as a function of x(Ino et al., 1997a). The chemical potential is shifteddownward with hole doping as expected, but the shift isfast in the overdoped regime (x$0.15) and slow in theunderdoped regime (x%0.15), as shown in Fig. 132. Itappears that #$/#x becomes vanishingly small within ex-perimental errors for small x , implying a divergence ofcharge compressibility/susceptibility towards x"0 aspredicted by Monte Carlo simulation studies of the 2D
FIG. 131. Density of states of La2!xSrxCuO4 . (a) Photoemis-sion and inverse-photoemission spectra near the Fermi level(Ino et al., 1997c); (b) Schematic representation of the evolu-tion of spectral weight with hole doping.
FIG. 132. Chemical potential shift as a function of hole con-centration in La2!xSrxCuO4 (Ino et al., 1997a). Shifts expectedfrom band-structure calculation and the %T term in specificheat (which is proportional to the quasiparticle DOS at EF)are also plotted in (b).
1183Imada, Fujimori, and Tokura: Metal-insulator transitions
Rev. Mod. Phys., Vol. 70, No. 4, October 1998
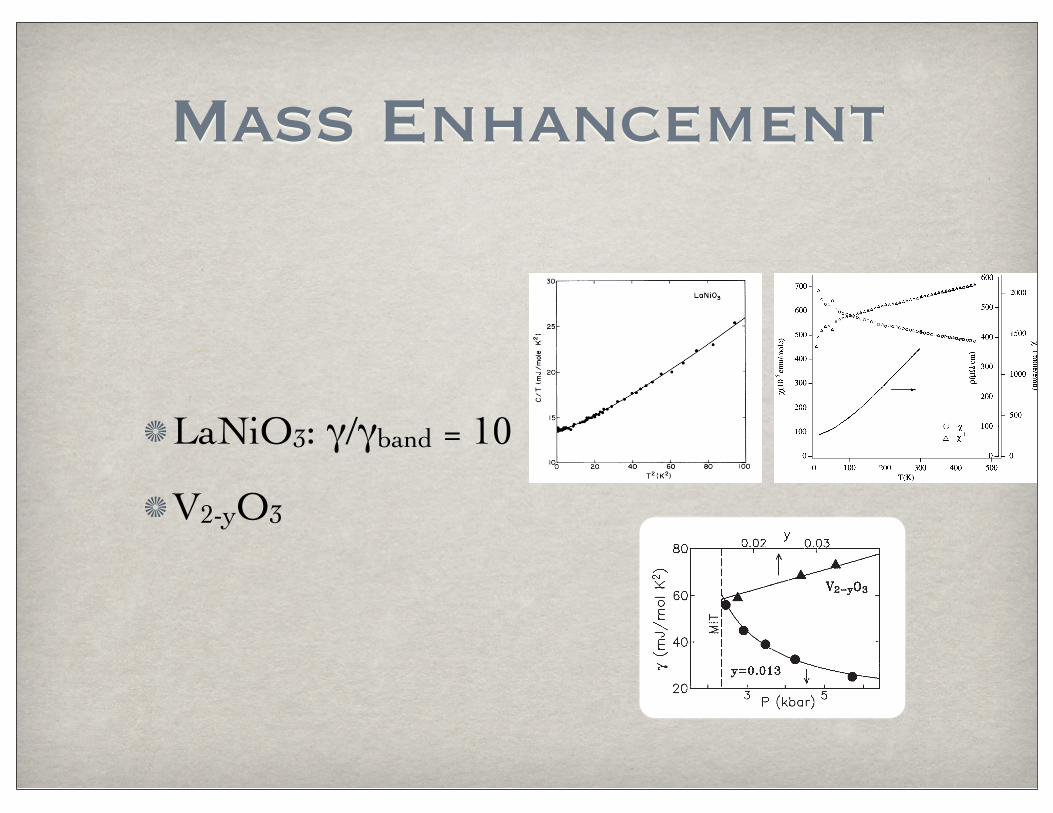
Mass Enhancement
LaNiO3: γ/γband = 10
V2-yO3
system is steeply increased as the compound approachesthe metal-insulator (AFI-AFM) phase boundary. Thiswas considered as a hallmark of Brinkman-Rice-typemass enhancement, although the Brinkman-Rice modeldoes not consider the SDW-like spin order. The criticalbehavior is given by !!!0"1"(U/Uc)#"1, where !0 isthe ! expected for the noninteracting V 3d in a bandand U is the intra-atomic Coulomb interaction with thevalue Uc at the MIT (Brinkman and Rice, 1970). Thedata presented in Fig. 74 are consistent with the assump-tion that the ratio U/Uc varies linearly with P/Pc .
In the case of an FC-MIT, on the other hand, the !decreases as the V deficiency y approaches the MI phaseboundary. Carter et al. (1993) compared the differentcases, variations of y and P , by sorting the ! into con-tributions from the spin-fluctuation term (Moriya, 1979)and the Brinkman-Rice term. Then the result could beexplained by assuming that the spin-fluctuation term in-creases in proportion to the doping y , while theBrinkman-Rice term is nearly unchanged. However, it isnot conceptionally clear whether the ! can be consid-ered as a sum of the two terms, which must have thesame physical origin, i.e., electron correlation. If furtherdoping were possible, the ! would eventually show apeak at the AFM(spin-density wave)-PM phase bound-ary and then steeply decrease, as observed in anotherdoped Mott-Hubbard system, La1"xSrxTiO3 (see Sec.IV.B.1). In a real V2"yO3 system, however, the spin or-dering in the AFM phase is robust against y and noparamagnetic metallic state at T!0 K emerges up to thechemical phase separation (y$0.06; Ueda, Kosuge, andKachi, 1980; Carter et al., 1991). When the filling is con-trolled for the AFM phase to approach the Mott insula-tor by fixing U/t , ! should rather decrease becausethe electron and hole pockets with small Fermi surfacesshrink further. This is in contrast to the mass divergenceexpected for the MIT between the PM and AFI phases.As discussed in Secs. II.C, II.G.1, and II.G.8, metal-insulator transitions between the AFI and AFM phasesare categorized as "I-1!M-1# where the carrier numbervanishes at the MIT, and ! may decrease toward theMIT in three dimensions due to a vanishing density ofstates at the band edge. When U/t is increased with fixedfilling, on the other hand, the mass and ! may be quan-
titatively and strongly enhanced simply due to correla-tion effects. However, we know of no reason for diver-gence of ! at the AFM-AFI boundary. The experimentalresults shown in Fig. 74 appear to be consistent withthese arguments.
The effect of electron correlation in V2O3 and the re-sultant temperature- and filling-dependent change in theelectronic state are also manifested by the optical con-ductivity, as reported by Thomas et al. (1994) and Ro-zenberg et al. (1995). Figure 75 shows the optical con-ductivity spectra (essentially of the T!0 limit) for theinsulating V2"yO3 phase with MIT critical temperaturesTc!154 K (y!0) and Tc!50 K (perhaps y!0.13,though not specified in the original report). Althoughthe experimental data were analyzed based on the cal-culated result for a BC-MIT of the infinite-dimensionalHubbard model, the experimental conditions imply thatthe dominant character may not be BC-MIT but FC-MIT.
The temperature-dependent MIT in pure V2O3 be-tween the low-temperature antiferromagnetic insulatingphase and the high-temperature paramagnetic metallicphase was studied using a high-resolution photoemissiontechnique as shown in Fig. 76 (Shin et al., 1995). In theinsulating phase below T!155 K, the total width of thelower Hubbard band was %3 eV, considerably largerthan that (%0.5–1 eV) deduced from the optical studyby Thomas et al. (1994). The low-intensity region nearEF in the insulating phase has a width of %0.2 eV, muchsmaller than the band gap (%0.6 eV) deduced from anoptical study of a sample with the same transition tem-perature but twice the transport activation energy (%0.1eV; McWhan and Remeika, 1970). Since the insulatingphase of V2O3 is a p-type semiconductor due to a smallnumber of V vacancies, the Fermi level should be lo-cated closer to the top of the occupied valence band
FIG. 74. T-linear electronic specific-heat coefficient ! vs theoxygen deficiency y at ambient pressure as well as vs the pres-sure P at y!0.013. From Carter et al., 1993, 1994.
FIG. 75. Optical conductivity spectra of V2"yO3 in the metallicphase (full lines) at T!170 K (upper) and T!300 K (lower).The inset contains the difference of the two spectra &'(()!'170 K(()"'300 K((). Diamonds indicate the measured dcconductivity. Dotted lines indicate '(() of insulating phasewith y!0.013 at 10 K (upper) and y!0 at 70 K (lower). FromRozemberg et al., 1995.
1150 Imada, Fujimori, and Tokura: Metal-insulator transitions
Rev. Mod. Phys., Vol. 70, No. 4, October 1998
VOLUME 84, NUMBER 3 PHY S I CA L R EV I EW LE T T ER S 17 JANUARY 2000
law was used to fit the x!T " curve for the LAlO3compounds over the entire temperature range measured.
However, the curve fitting to a Curie-Weiss law above
100 K gave C ! 3.6 for L ! Pr31 and Nd31, which is
close to the free-ion values 3.58 !Pr31" and 3.62 !Nd31".Subtraction of the polynomial for x!T " of LAlO3 gave
a very consistent result for the x!T " of the NiO3 array
of PrNiO3 and NdNiO3. In the case of Nd0.5Sm0.5NiO3,
subtraction of the polynomial did not work as well at
low temperatures. Therefore, a fit to the Curie-Weiss law
above 100 K was used. Fortunately, all the transitions we
addressed occur above 100 K.
Figures 2–5 show x!T ", x21!T ", and r!T " for the NiO3array of LaNiO3, PrNiO3, NdNiO3, and Nd0.5Sm0.5NiO3,
respectively. Both Landau diamagnetism and Van Vleck
paramagnetism are relatively small in magnitude compared
with our measured x!T ". Therefore, no correction wasmade for these two contributions to x!T ". In a homoge-neous model, the temperature dependence of x!T " for theNiO3 array may be attributed to the electronic states near
the Fermi energy.
Interpretation of the x!T " data begins with the observa-tion that the low-spin Ni (III) ions contribute a single elec-
tron each to an orbitally twofold-degenerate s! band. A
quarter-filled band should experience ferromagnetic corre-
lations which introduce a Stoner enhancement in addition
to the mass enhancement due to strong electron-electron
interactions. A distinction between these two enhance-
ments is that the electronic specific-heat parameter gincreases with mass enhancement, but not with Stoner
enhancement [9]. By measuring both x!T " and the elec-tronic specific heat at low temperatures, Sreedhar et al.
[2] determined a Stoner factor S ! 0.58, well below the
S ! 1 for a ferromagnetic instability. The curvature of thetemperature dependence of x!T " for mass enhancementis opposite to that for Stoner enhancement. Mott [10] was
FIG. 2. Temperature dependence of resistivity r, magneticsusceptibility x, and its reciprocal x21!T " for LaNiO3.
the first to point out this distinction, but he was unable to
find a suitable experimental example to test his prediction
that a flattening of the ´k vs k dispersion at the Fermi
energy of a mass-enhanced metallic system would give a
temperature dependence below a temperature Td .
Qualitatively, the x!T " data for LaNiO3 in Fig. 2 ap-
pears to fit the Mott prediction for a homogeneous elec-
tronic system. However, a weak temperature dependence
persisting above the apparent Td # 200 K in Fig. 2 doesnot conform to the Mott picture. Alternatively, the x!T "curve of Fig. 2 may be described by a two-electronic-phase
model in which x ! ax0 1 bxCW , where x0 is the sus-
ceptibility of a mass-enhanced, conductive parent phase
and xCW is a Curie-Weiss component coming from strong-
correlation fluctuations within the parent phase. We [11]
have used this formulation to interpret a similar tempera-
ture dependence of x!T " found for the La12xNdxCuO3perovskite system. Moreover, the model is supported
by the evidence from our transport measurements [3] for
strong-correlation fluctuations in the metallic phase of the
LNiO3 family. A Td # 200 K was also found in the
La12xNdxCuO3 system; why it should occur at this tem-
perature in both systems is not clear. One possibility is
that the boundary of the host phase is where the mass en-
hancement gives a Td # 200 K; further narrowing of theband introduces more and more of the strong-correlation
second phase and hence a greater temperature dependence
of x!T " above Td . Indeed, the temperature dependence of
x!T " at T . Td increases on narrowing the bandwidth in
Figs. 2–5.
In Figs. 3–5, the onset of the rise in r!T " on coolingis a measure of the transition temperature Tt . The ther-
mal hysteresis of Tt decreases as Tt increases, and the
transition becomes second order (no thermal hysteresis at
Tt) in Nd0.5Sm0.5NiO3, which has a Tt . TN (see Figs. 1
FIG. 3. r!T", x!T", and x21!T" for PrNiO3, the line is a guideto the eye.
527

There is a lot left for the next meeting!