moving toward health an overview - michigan · (skin color, hair texture, eye shape, etc.) can have...
TRANSCRIPT

Michigan Department of Community Health
Health Disparities Reduction/Minority Health Section
Division of Health Wellness & Disease Control
Moving Toward Health
Equity in Michigan :
An Overview
1

•To discuss the terms “health disparities”, “health inequities”,
“health equity” and “social determinants of health.”
•To explore how social factors contribute to the health of
racial/ethnic minority communities in Michigan.
•To understand inequities and how they impact health in
Michigan.
Objectives
2

3
Measured health differences between
two populations, regardless of the
underlying reasons for the differences.
Health Disparities
3

#
2007 - 2009 Michigan Resident Birth and Death Files, Division for Vital Records & Health Statistics, Michigan Department of Community Health 4

Vital Records and Health Statistics Section, Michigan Department of Community Health
African American
Infants Michigan;
Born in 2007-2009
White Infants
Michigan;
Born in 2007-2009
Health Disparity
15.5
5.6
9.9
Number of infant death per 1000 live births
5

6
Differences in health across population
groups that are systemic, unnecessary
and avoidable, and are therefore
considered unfair and unjust.
Health Inequities
6

2007 - 2009 Michigan Resident Birth and Death Files, Division for Vital Records & Health Statistics, Michigan Department of Community Health
• Stress
• Unemployment
• Healthcare Access
7

8
Fair, just distribution of social resources
and opportunities needed to achieve well-being.
Health Equity
8

What factors impact health?
Genetics 20%
Access to quality
healthcare 20%
Human behavior
40%
Social / Physical
Environment 20%
9
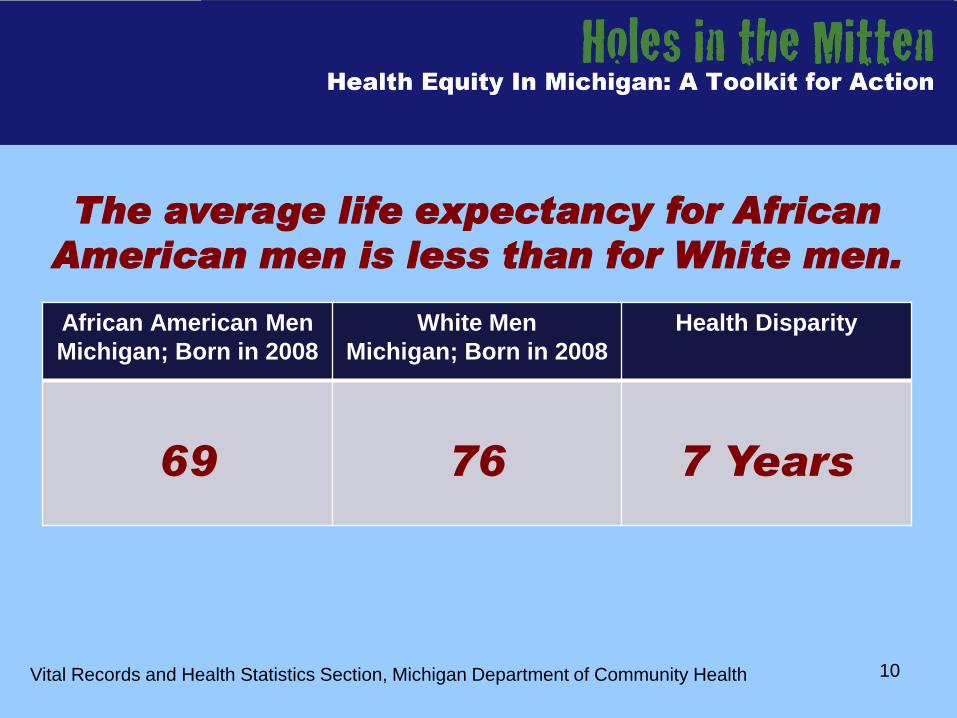
The average life expectancy for African
American men is less than for White men.
Vital Records and Health Statistics Section, Michigan Department of Community Health
African American Men
Michigan; Born in 2008
White Men
Michigan; Born in 2008
Health Disparity
69
76
7 Years
10

The same is true for women:
Vital Records and Health Statistics Section, Michigan Department of Community Health
African American
Women
Michigan; Born in 2008
White Women
Michigan; Born in 2008
Health Disparity
76
81
5 Years
11

How do these disparities arise?
12

13
Health behaviors do have an impact on
health, but there are many other factors that
also influence life expectancy outcomes.
Take a look at this… 13

Smoking rates are not very different by
race/ethnicity
Percent of population that currently smokes
Michigan BRFS, 2007-2009, Michigan Department of Community Health
Data unavailable for groups not listed
14

All groups get similar amounts of exercise
0%
35%
70%
Afr.Am
er
AI/AN
Arab
Asian
Hispa
nic/La
tino
White
Subpopulations
Population Avg.
Percent of population that does not get enough physical activity
Michigan BRFS, 2007-2009, Michigan Department of Community Health
Data unavailable for groups not listed
15

Age-adjusted prevalence estimates of inadequate fruit/vegetable
consumption by race/ethnicity (Michigan BRFS, 2007-2009)
Michigan BRFS, 2007-2009, Michigan Department of Community Health
Data unavailable for groups not listed
78.4%
72.4% 71.8% 71.2%
79.3% 78.9%
0%
10%
20%
30%
40%
50%
60%
70%
80%
90%
African American American Indian Arab American Asian American Hispanic/ Latino White
Subpopulations
Michigan Average = 78.4%
16

Yet, there are large differences in survival.
Age-adjusted all-cause mortality rates
Vital Records and Health Statistics Section, 1999-2007, MDCH
17

Some people would rationalize
that disparities are only due to
healthcare access…
18

Culture
and
Healthcare Access
19

20
11%
23%
22%
18%
17%
14%
Percent of Michiganders reporting they could not
pay to see a doctor at some point in past year
2007-2009 Michigan Behavioral Risk Factor Survey
Michigan Department of Community Health
African Americans
Asian Americans
Arab Americans
American Indian/
Alaskan Natives
Hispanic/Latinos
Whites
20

21
Asian Americans 1 of 10
Hispanic/Latinos 1.5 of 10
Whites 1.5 of 10
Arab Americans 1.5 of 10
African Americans 2 of 10
American Indian/
Alaskan Natives 2 of 10
Michiganders reporting no health care coverage
2007-2009 Michigan Behavioral Risk Factor Survey
Michigan Department of Community Health 21

Access to healthcare
does not explain all disparities.
22

0%
12%
24%
Inadequate Intermediate Adequate
Prenatal Care
% L
BW
Black
White
Low Birth Weight (LBW) Births by Race and
Prenatal Care
2008 Michigan Resident Birth File, Vital Records & Health Statistics Section, MDCH
23

0%
12%
24%
Inadequate Intermediate Adequate
Prenatal Care
% L
BW
1.0
1.8
2.6 Bla
ck:W
hite
Black
White
B:W Ratio
Low Birth Weight (LBW) Births by Race and
Prenatal Care
2008 Michigan Resident Birth File, Vital Records & Health Statistics Section, MDCH
24

•Healthcare
•Nutrition
•Behavior
HEALTH
OUTCOMES
25

26
Social Inequality
Discrimination by race,
ethnicity, gender or class
Economic Factors
Income, education, employment,
wealth
Social & Physical Environments
Social Cohesion, political influence, residential
segregation, violence, housing, built environment,
air quality, transportation
Healthcare
Healthcare access and quality,
insurance coverage, cultural/linguistic
competence in healthcare
Individual Factors
Health Behaviors
Human Biology
Adapted from Determinants of Health Diagram by Denise Carty University of Michigan School of Public Health
Determinants
of Health
26

27
Social Determinants
of Health
Social, economic and environmental
factors that contribute to overall health
of individuals and communities.
27

Social Determinants of Health “Causes of causes”: Fundamental causes
Social
Determinants:
• Discrimination
• Income
• Education
• Housing
• Employment
• Race-based
segregation
• Environment
• Violence/Crime
•Healthcare
•Nutrition
•Behavior
HEALTH
OUTCOMES
Access to:
•Care
•Information
•Resources
Exposure to:
•Stress
•Opportunity
•Choice
28

Keep people from
falling in up here
Instead of pulling
them out down here
“Moving Upstream”
29

Social Determinants
in Michigan
30

Educational Inequity:
31

32
“People with more education are likely to live longer, to
experience better health outcomes, and to practice health-
promoting behaviors such as exercising regularly, refraining
from smoking, and obtaining timely health care check-ups and screenings.”- Robert Wood Johnson Foundation.
32

33
Percentage of U.S. adults with more
than basic health literacy
2003 National Assessment of Adult Literacy
U.S. Department of Education, National Center for Education Statistics
33

34
9% of people in Michigan do not
speak English at home.
2006-2008 American Community Survey
U.S. Census Bureau 34

35
63%
26%
14%
14%
13%
0.0% 50.0% 100.0%
Hispanic/
Latino
White
Asian
American
Indian
African
American
Percent of Michigan
populations with a
College Degree
U.S Census Bureau, American Community Survey 2006-2008 35

36
High school graduation rates by race and ethnicity
Graduation Rates in Michigan Asian
American
17 in 20
American
Indian
13 in 20
Hispanic/
Latino
12 in 20
African
American
11 in 20
White
16 in 20
Center for Educational Performance and Information, 2009
36

26%
36%
40%
59%
64%
Hispanic/
Latino
White
Asian
American
Indian
African
American
36%
26%
59%
40%
Percentage of Michigan high school students
who can read at the high school level
U.S Dept. of Education, Consolidated State Performance Report, 2008-2009
64%
37

38
15.6
17.3
15.114.5
9.9
7.0
5.04.3
0
5
10
15
20
Under 12 years 12 years 13-15 years 16 years and over
Infa
nt
Mo
rta
lity
Ra
te
Mother's Education
Black White
Infant Mortality Rates by education and race, Michigan (2003-2005)
Vital Records and Health Statistics Section, MDCH
38

39
15.6
17.3
14.5
9.9
7.0
5.04.3
15.1
0
5
10
15
20
Under 12 years 12 years 13-15 years 16 years and over
Mother's Education
Infa
nt
Mo
rta
lity
Ra
te
1.0
1.5
2.0
2.5
3.0
3.5
Bla
ck
:Wh
ite
Ra
tio
Black
White
B:W Ratio
Infant Mortality Rates by education and race, Michigan (2003-2005)
Vital Records and Health Statistics Section, MDCH
39

What else?
40

Health Behaviors
Access to health care
Income or Education
Genetics
41

ROOT ANALYSIS ACTIVITY
Discuss the factors associated with a particular health
issue.
What root causes are the cause of these
factors? (Causes of the cause)
Goal: To understand the social determinants of health
and how these structural factors impact health.
42 42

Race
43

What Race Is Not
• Race is not biological: Race is a social concept and has no biological
basis.
• Race is not genetic: You cannot determine a person’s race by
examining their genes. A person’s race is determined by the society
they live in.
• Race is not an indication of similar DNA: People who look very different
(skin color, hair texture, eye shape, etc.) can have DNA that is more
similar than two people who have similar skin color, hair texture, etc.
The fact that we know what “race” we are says more about
our society than it does our biology. –N. Krieger & M. Bassett 1986
45

45
Race Is… A way of classifying of people based on outward appearance
or looks.
Racism Is… Assigning value, status, and access to people based on how
they look, where they come from, and their cultural norms.
This has resulted in some groups having different and
better opportunities than others.
45

46
Levels of Racism
• Personal
-Conscious or unconscious feelings of bias and prejudice on an individual
level.
• Interpersonal
-Actions by an individual, towards others, that are biased and prejudiced.
• Institutional
- Practice and policies within institutions of power (ie. “political,
economic, educational, social, and historical”) that allow discrimination
and inequities. (Batts, 2002.)
• Cultural
- “When the standards of appropriate action, thought, and expression of a
particular group are perceived either overtly or subtlety as negative
or less than.” (Batts, 2002.)
46

“My Oldest brother would throw his rice ball in the
gutter before he got to school. He decided that he would rather go hungry than be different”
Japanese Internment 47


49
Since 9/11……
There has been a significant increase in discrimination,
racial targeting and profiling of Arab/Chaldeans.
Go Back To Where You Came From!
49

50
In Michigan, complaints
about abuse and racial
profiling by Immigration and
Customs Enforcement (ICE)
are on the rise.
50

51
“Kill the Indian, Save the Man”
During 1880-1902, between 20,000 and 30,000 Native
American children were forced to live in reform boarding
schools. This practice continued until the 1930s and in some
cases even later. 51

52
How Do You Explain This? • The U.S. Department of Housing and Urban Development (HUD) estimates there are more
than 2 million incidents of housing discrimination each year. (Dept of Housing and Urban
Development).
• A significantly higher number of minority students are placed into special education
programs.
• Pregnant Hispanic, African American and Asian/Pacific Islander mothers are exposed to
higher mean levels of air pollution and are twice as likely to live in the most polluted counties.
• Despite being equally qualified, African American and Hispanic women receive fewer
interviews and job offers than white applicants.
• 20% of Asians, 19% of Hispanics and 14% of African Americans reported being treated with
disrespect or being looked down upon during a patient-provider encounter.
52

Stress
53

Percent of Michigan adults who rarely or never received
social/emotional support needed
7%
11%12%
10%
15%
13%
6%
0%
4%
8%
12%
16%
20%
Overall African
American
American
Indian
Arab/
Chaldean
American
Asian
American
Hispanic/
Latino
White
Pre
va
len
ce
54
Prevalence of not receiving support needed: % Adults in response to question “How often do you get the social and emotional support you need?”
Michigan BRFS, 2007-2009, Michigan Department of Community Health
Data unavailable for groups not listed
54

55
7% of Michigan adults
reported that they were
dissatisfied or very
dissatisfied with life.
African Americans were
more than twice as likely to
report life dissatisfaction as
Whites.
Michigan BRFS, 2007-2009, Michigan Department of Community Health
Picture from http://www.basicmentaldisorders.com/
55

56
In Michigan, 20% of
African Americans and
Hispanic/Latinos
reported being
emotionally upset at
least once a month due
to how they were treated
based on their race
Michigan BRFS, 2006, Michigan Department of Community Health
56

57
Michigan BRFS, 2006, Michigan Department of Community Health
In Michigan, 17% of Hispanic/Latinos and 10% of African Americans reported physical anxiety symptoms at least once a month due to how they were treated based on their race.
Note: Symptoms included headaches, upset stomachs, tensing of muscles,
or pounding hearts.
57

58
Prevalence: % Adults reporting experience at work over past 12 months
Michigan BRFS, 2006, Michigan Department of Community Health Data unavailable for groups not listed
58

59 Michigan BRFS, 2006, Michigan Department of Community Health
Data unavailable for groups not listed
Percent of Michigan adults who felt that their health
care experience was worse than that of some or all
people of other races
6%
17%
11%
8%
3%
0%
5%
10%
15%
20%
Overall African American Hispanic/Latino Other White
Pre
vale
nce
Percent adults reporting experience when seeking health care over past 12 months
59

60 Local Area Unemployment Statistics, U.S. Dept. of Labor, 2009
In 2009, 26% of African American Men in Michigan
were unemployed. This is nearly twice the rate for
White Men (15%).
26%
16%15%
13%
0%
10%
20%
30%
AfricanAmerican
Hispanic/Latino White Asian American
2009 Unemployment Rates for Men in
Michigan
60

Food Access
61

“An area in the United States with limited access
to affordable and nutritious food, particularly
such an area composed of predominantly lower income neighborhoods and communities.”
-Food, Conservation, and Energy Act of 2008
Food Desert
62

Michigan Food Deserts*, 2006
Food Desert (by census tract) 63

USDA Food
Desert
(2011)
Source: Nielsen, 2011
The United States Department of Agriculture (USDA) defines a food desert as a low-income census
tract where a substantial number or share of residents has low access to a supermarket or large
grocery store.
USDA Food Deserts
in Ann Arbor and Ypsilanti, MI
64

USDA Food
Desert
(2011)
Source: Nielsen, 2011
The United States Department of Agriculture (USDA) defines a food desert as a low-income census
tract where a substantial number or share of residents has low access to a supermarket or large
grocery store.
USDA Food Desert in
Benton Harbor, MI
65

USDA Food
Desert
(2011)
Source: Nielsen, 2011
The United States Department of Agriculture (USDA) defines a food desert as a low-income census
tract where a substantial number or share of residents has low access to a supermarket or large
grocery store.
USDA
Food Deserts
in Detroit, MI
66

USDA Food
Desert
(2011)
Source: Nielsen, 2011
The United States Department of Agriculture (USDA) defines a food desert as a low-income census
tract where a substantial number or share of residents has low access to a supermarket or large
grocery store.
USDA Food Desert
in Grand Rapids, MI
67

Source: Nielsen, 2011
USDA Food
Desert
(2011)
The United States Department of Agriculture (USDA) defines a food desert as a low-income census
tract where a substantial number or share of residents has low access to a supermarket or large
grocery store.
USDA Food Desert in Mt. Pleasant, MI
68

The United States Department of Agriculture (USDA) defines a food desert as a low-income census
tract where a substantial number or share of residents has low access to a supermarket or large
grocery store.
Source: Nielsen, 2011
USDA Food
Desert
(2011)
USDA Food Deserts
near Flint, MI
69

To Summarize
70

Richard Hofrichter,
National Association of City and
County Health Officials Health
Inequities
Root Causes
Social
Determinants
of Health
71

Richard Hofrichter,
National Association of City and
County Health Officials 72

RACISM
A Health
Equity
Framework
Education
Job Opportunity
Socioeconomic Status
Environmental Exposure
Health Behaviors
Access to Health
Services
Safe and Affordable
Housing
Reducing violence Adapted from “The Role of Racism and Health Inequity Meghan Patterson,
MPH & Nashira Baril MPH Framework created by the Boston Public Health Commission
Class,
Racism,
Gender
Discrimination
and
Exploitation
HEALTH
OUTCOMES
73

Tips for Staying Healthy: A Lifestyle
Approach
1. Don’t smoke. If you do stop
2. Eat a balanced diet, include fruit/vegetables
3. Keep physically active
4. If you drink, do so in moderation
5. Cover up in the sun and protect your children
6. Practice safe sex
7. Participate in appropriate health screening
8. Drive defensively; don’t drink and drive.
9. Manage your stress.
10. Maintain social ties 74

Tips for Staying Healthy: A Social
Determinants Perspective 1. Don’t be poor. If you can stop. If you can’t, try not to
be poor for too long. 2. Don’t have poor parents.
3. Don’t live in a poor neighborhood.
4. Own a car- but use only for weekend outings. Walk to work.
5. Practice not losing your job and don’t become unemployed.
6. Don’t be illiterate.
7. Avoid social isolation.
8. Try not to be apart of a socially marginalized group 75

Many o
Tips for Achieving Health Equity: A
Community Empowerment Approach Recommendations from the Michigan Health Equity Roadmap:
• Improve race/ethnicity data collection/data systems/data accessibility.
• Strengthen the capacity of government and communities to develop and sustain effective partnerships and programs to improve racial/ethnic health inequities.
• Improve social determinants of racial/ethnic health inequities through public education and evidence-based community interventions.
• Ensure equitable access to quality healthcare.
• Strengthen community engagement, capacity, and empowerment.
What else?
76

For More Information
Health Disparities Reduction and Minority Health Section
Division of Health, Wellness, and Disease Control
Michigan Department of Community Health
313-456-4355
www.michigan.gov/minorityhealth
www.healthequitymi.com
77