msci esg government ratings - smart-und-fair-fonds.dey-axis: % of the countries receiving credit...
TRANSCRIPT

© 2016 MSCI Inc. All rights reserved. Please refer to the disclaimer at the end of this document.
MSCI ESG GOVERNMENT RATINGSSovereign Ratings
Daniel SailerVice President, MSCI ESG Research
• Market Drivers and Use Cases
• Materiality of ESG Factors
• Product Philosophy and Framework
• Research Process and Scoring Methodology
CONTENT
2

MARKET DRIVERS
3
ESG Integration in fixed income asset class• DM/EM funds• ESG FI indexes
Understand extra-financial risks & opportunities that may become material
Understand ‘Country Risk’
Some specific triggers:
ü 2008 financial crisis
ü Arab spring
ü Corruption & political instability
ü Global commodity market crash

CLIENT USE CASES
4
Additional
Data
• Country specific ESG data to inform strategy, country allocation
• Research, reports used by Sovereign analysts as supplementary data source
Bond Funds
• DM government bond fund – EU only, applies maximum allocations based on
ESG rating
• EM government bond fund – Political governance scores establish eligibility
• Quantitative – optimization strategy using ESG scores
Fixed Income
Indexes
• ESG ratings inform Barclays MSCI ESG Fixed Income Indices
• Sustainability – ‘BBB’ rating minimum;
• ESG weighted – tilt or weighting factor based on rating applied

MATERIALITY OF ESG FACTORSComparison of ESG and Financial Ratings
5

CONVERGENCE OF ESG & SOVEREIGN RATINGS
01.08 01.09 01.10 01.11 01.12 01.13
Eurozone - ESG = 'AA' + 0 out of 5 countries downgraded
AaaAaABaaBaBCaa
Cred
it ra
ting
01.08 01.09 01.10 01.11 01.12 01.13
Eurozone - ESG = 'A' AaaAaABaaBaBCaa
Cred
it ra
ting
4 out of 5 countries downgraded; average credit downgrade 3 notches
01.08 01.09 01.10 01.11 01.12 01.13
Eurozone - ESG = 'BBB' AaaAaABaaBaBCaa
Cred
it ra
ting
6 out of 6 countries downgraded; average credit downgrade 7 notches
Credit Rating (Moody’s)
ESG Rating (MSCI)
01.08 01.09 01.10 01.11 01.12 01.13
UruguayA
B1
Baa3
01.08 01.09 01.10 01.11 01.12 01.13
Bahrain
BBB
A2
Baa2
01.08 01.09 01.10 01.11 01.12 01.13
South Africa
BBB
BB
A3 Baa1
01.08 01.09 01.10 01.11 01.12 01.13
PanamaBBB
Baa2Ba1
EM Credit Upgrades
EM Credit Downgrades
EUROZONE CREDIT DOWNGRADES
6

EVIDENCE THAT ESG FACTORS IMPACT SOVEREIGN RISK
IN THE LONG RUN
7
• In 2008, eight
countries in this zone
• Five countries Egypt,
Italy, Portugal, Spain
and Tunisia received
downgrade
• Three countries China,
Morocco and Singapore
retained their rating
X-axis: Difference between ESG score and Credit rating score at the beginning of year 2008.
Y-axis: % of the countries receiving credit rating downgrade / upgrade during 2008-2012 (i.e. in the span of five years)
*Calculated as the difference between ESG Rating and Credit Rating on a homogenized numeric scale.
Source: Credit Ratings from Fitch Sovereign Rating History (www.fitchratings.com)
High LowDiscrepancy*
n=8
n=10
n=24n=22
n=14

PRODUCT PHILOSOPHY AND FRAMEWORK
8

MSCI ESG GOVERNMENT RATINGS
Our Government Ratings help investors assess the long-term competitiveness of national and sub-national economies
• Identifies ESG risks affecting a country’s value creation process – long-term sustainability of output and growth
• Identifies countries with strong ESG fundamentals that are likely to outperform in the long run
• Differentiates countries that are otherwise similar based on financial and fiscal characteristics
• Emphasizes quantifiable benchmarking of performance over qualitative assessment of policies, using a transparent methodology
9

MSCI ESG GOVERNMENT RATINGS
10
NATURAL RESOURCES
ENVIRONMENTAL VULNERABILITY
HUMAN CAPITAL
SOCIO-ECONOMIC ENVIRONMENT
FINANCIAL GOVERNANCE
Exclusions
Indexes (EM, DM, Equity, FI)
Risk monitoring
ESG integration for sovereign and government bonds
Understand country risk
MSCI ESG SCREENING TOOLS
POLITICAL GOVERNANCE
FEATURES
• 198 Countries + 45 Local Authorities
• Ratings, scores, raw data, reports
• Annual review and monthly monitoring
• Customization tools

MSCI ESG SOVEREIGN RATINGS - FRAMEWORK
•1-10 underlying data points per sub-factor•Ratings and score with 9 years of history for 198 countries/regions (99% of traded sovereign debt)•Weight-setting tool allows clients to re-weight risk factors based on their own views•98 data points evaluated to compute 27 sub-factors
Pillar Risk Factor Exposure sub-factor Management Sub-factor
Environmental
Natural resource risk o Energy security risko Water resourceso Productive land and mineral resources
o Energy resource managemento Water resource managemento Resource conservation
Environmental externalitiesand vulnerability risk
o Vulnerability to environmental eventso Environmental externalities
o Environmental performanceo Management of environmental
externalities
Social
Human capital risk o Basic human capitalo Higher education and technology-
readinesso Knowledge capital
o Basic needso Human capital performanceo Human capital infrastructureo Knowledge capital management
Economic environment risk o Economic environment o Wellness
Governance
Financial governance risk o Financial capital o Financial management
Political governance risk o Institutionso Judicial and penal systemo Governance effectiveness
o Political rights and civil libertieso Corruption controlo Stability and peace
11

o Online profiles, scores, and ratings for 198 Countries/regions
• As part of Government Ratings, ESG assessment of 45 Local Authorities is also available
o Sovereign Screen available for 198 countries
o Data feed, bond matching for sovereign and quasi-sovereign entities
o Excel scoring file with customizable weights and peer set comparisons
o Raw data available on request
PRODUCT FEATURE
12

RESEARCH PROCESS AND SCORING METHODOLOGY
13

Reality Check:Ratings Review Committee Approval
Analysis & Rating:Country Scores & Ratings
Data Collection:Use credible data sources e.g. UN, World Bank, IMF etc.
Exposure & Management Sub-Factors:Define exposure & management sub-factors under each Risk Factor
Identify Risk Factors:Determine Country Level Risk Factors & Weights
RESEARCH PROCESS
14

SCORING METHODOLOGY
15
Case Example: Germany

• Local Authorities─ German States─ Australian States & Territories─ Major Canadian Provinces─ Select US States─ Select Swiss Cantons
• Agencies
• Supranationals─ European Community─ European Union─ European Financial Stability Fund
NON-SOVEREIGN GOVERNMENT RATINGS
16

About MSCI ESG Research Products and Services
MSCI ESG Research products and services are provided by MSCI ESG Research Inc., and are designed to provide in-depth research, ratings and analysis of environmental, social and governance-related business practices to companies worldwide. ESG ratings, data and analysis from MSCI ESG Research Inc. are also used in the construction of the MSCI ESG Indexes. MSCI ESG Research Inc. is a Registered Investment Adviser under the Investment Advisers Act of 1940 and a subsidiary of MSCI Inc.
About MSCI
For more than 40 years, MSCI’s research-based indexes and analytics have helped the world’s leading investors build and manage better portfolios. Clients rely on our offerings for deeper insights into the drivers of performance and risk in their portfolios, broad asset class coverage and innovative research.
Our line of products and services includes indexes, analytical models, data, real estate benchmarks and ESG research.
MSCI serves 98 of the top 100 largest money managers, according to the most recent P&I ranking.
For more information, visit us at www.msci.com.
ABOUT MSCI
17

This document and all of the information contained in it, including without limitation all text, data, graphs, charts (collectively, the “Information”) is the property of MSCI Inc. or its subsidiaries (collectively, “MSCI”), or MSCI’s licensors, direct or indirect suppliers or any third party involved in making or compiling any Information (collectively, with MSCI, the “Information Providers”) and is provided for informational purposes only. The Information may not be modified, reverse-engineered, reproduced or redisseminated in whole or in part without prior written permission from MSCI.
The Information may not be used to create derivative works or to verify or correct other data or information. For example (but without limitation), the Information may not be used to create indexes, databases, risk models, analytics, software, or in connection with the issuing, offering, sponsoring, managing or marketing of any securities, portfolios, financial products or other investment vehicles utilizing or based on, linked to, tracking or otherwise derived from the Information or any other MSCI data, information, products or services.
The user of the Information assumes the entire risk of any use it may make or permit to be made of the Information. NONE OF THE INFORMATION PROVIDERS MAKES ANY EXPRESS OR IMPLIED WARRANTIES OR REPRESENTATIONS WITH RESPECT TO THE INFORMATION (OR THE RESULTS TO BE OBTAINED BY THE USE THEREOF), AND TO THE MAXIMUM EXTENT PERMITTED BY APPLICABLE LAW, EACH INFORMATION PROVIDER EXPRESSLY DISCLAIMS ALL IMPLIED WARRANTIES (INCLUDING, WITHOUT LIMITATION, ANY IMPLIED WARRANTIES OF ORIGINALITY, ACCURACY, TIMELINESS, NON-INFRINGEMENT, COMPLETENESS, MERCHANTABILITY AND FITNESS FOR A PARTICULAR PURPOSE) WITH RESPECT TO ANY OF THE INFORMATION.
Without limiting any of the foregoing and to the maximum extent permitted by applicable law, in no event shall any Information Provider have any liability regarding any of the Information for any direct, indirect, special, punitive, consequential (including lost profits) or any other damages even if notified of the possibility of such damages. The foregoing shall not exclude or limit any liability that may not by applicable law be excluded or limited, including without limitation (as applicable), any liability for death or personal injury to the extent that such injury results from the negligence or willful default of itself, its servants, agents or sub-contractors.
Information containing any historical information, data or analysis should not be taken as an indication or guarantee of any future performance, analysis, forecast or prediction. Past performance does not guarantee future results.
The Information should not be relied on and is not a substitute for the skill, judgment and experience of the user, its management, employees, advisors and/or clients when making investment and other business decisions. All Information is impersonal and not tailored to the needs of any person, entity or group of persons.
None of the Information constitutes an offer to sell (or a solicitation of an offer to buy), any security, financial product or other investment vehicle or any trading strategy.
It is not possible to invest directly in an index. Exposure to an asset class or trading strategy or other category represented by an index is only available through third party investable instruments (if any) based on that index. MSCI does not issue,sponsor, endorse, market, offer, review or otherwise express any opinion regarding any fund, ETF, derivative or other security, investment, financial product or trading strategy that is based on, linked to or seeks to provide an investment return related to the performance of any MSCI index (collectively, “Index Linked Investments”). MSCI makes no assurance that any Index Linked Investments will accurately track index performance or provide positive investment returns. MSCI Inc. is not an investment adviser or fiduciary and MSCI makes no representation regarding the advisability of investing in any Index Linked Investments.
Index returns do not represent the results of actual trading of investible assets/securities. MSCI maintains and calculates indexes, but does not manage actual assets. Index returns do not reflect payment of any sales charges or fees an investor may payto purchase the securities underlying the index or Index Linked Investments. The imposition of these fees and charges would cause the performance of an Index Linked Investment to be different than the MSCI index performance.
The Information may contain back tested data. Back-tested performance is not actual performance, but is hypothetical. There are frequently material differences between back tested performance results and actual results subsequently achieved by any investment strategy.
Constituents of MSCI equity indexes are listed companies, which are included in or excluded from the indexes according to the application of the relevant index methodologies. Accordingly, constituents in MSCI equity indexes may include MSCI Inc., clients of MSCI or suppliers to MSCI. Inclusion of a security within an MSCI index is not a recommendation by MSCI to buy, sell, or hold such security, nor is it considered to be investment advice.
Data and information produced by various affiliates of MSCI Inc., including MSCI ESG Research Inc. and Barra LLC, may be used in calculating certain MSCI indexes. More information can be found in the relevant index methodologies on www.msci.com.
MSCI receives compensation in connection with licensing its indexes to third parties. MSCI Inc.’s revenue includes fees based on assets in Index Linked Investments. Information can be found in MSCI Inc.’s company filings on the Investor Relations section of www.msci.com.
MSCI ESG Research Inc. is a Registered Investment Adviser under the Investment Advisers Act of 1940 and a subsidiary of MSCI Inc. Except with respect to any applicable products or services from MSCI ESG Research, neither MSCI nor any of its products or services recommends, endorses, approves or otherwise expresses any opinion regarding any issuer, securities, financial products or instruments or trading strategies and MSCI’s products or services are not intended to constitute investment advice or a recommendation to make (or refrain from making) any kind of investment decision and may not be relied on as such. Issuers mentioned or included in any MSCI ESG Research materials may include MSCI Inc., clients of MSCI or suppliers to MSCI, and may also purchase research or other products or services from MSCI ESG Research. MSCI ESG Research materials, including materials utilized in any MSCI ESG Indexes or other products, have not been submitted to, nor received approval from, the United States Securities and Exchange Commission or any other regulatory body.
Any use of or access to products, services or information of MSCI requires a license from MSCI. MSCI, Barra, RiskMetrics, IPD, FEA, InvestorForce, and other MSCI brands and product names are the trademarks, service marks, or registered trademarks of MSCI or its subsidiaries in the United States and other jurisdictions. The Global Industry Classification Standard (GICS) was developed by and is the exclusive property of MSCI and Standard & Poor’s. “Global Industry Classification Standard (GICS)” is a service mark of MSCI and Standard & Poor’s.
NOTICE AND DISCLAIMER
18

MATERIALITY OF ESG FACTORSSome case studies
19

CONVERGENCE OF ESG & SOVEREIGN RATINGS
01.08 01.09 01.10 01.11 01.12 01.13
Eurozone - ESG = 'AA' + 0 out of 5 countries downgraded
AaaAaABaaBaBCaa
Cred
it ra
ting
01.08 01.09 01.10 01.11 01.12 01.13
Eurozone - ESG = 'A' AaaAaABaaBaBCaa
Cred
it ra
ting
4 out of 5 countries downgraded; average credit downgrade 3 notches
01.08 01.09 01.10 01.11 01.12 01.13
Eurozone - ESG = 'BBB' AaaAaABaaBaBCaa
Cred
it ra
ting
6 out of 6 countries downgraded; average credit downgrade 7 notches
Credit Rating (Moody’s)
ESG Rating (MSCI)
01.08 01.09 01.10 01.11 01.12 01.13
UruguayA
B1
Baa3
01.08 01.09 01.10 01.11 01.12 01.13
Bahrain
BBB
A2
Baa2
01.08 01.09 01.10 01.11 01.12 01.13
South Africa
BBB
BB
A3 Baa1
01.08 01.09 01.10 01.11 01.12 01.13
PanamaBBB
Baa2Ba1
EM Credit Upgrades
EM Credit Downgrades
EUROZONE CREDIT DOWNGRADES
20

POLITICAL RIGHTS AND CIVIL LIBERTIES – ECONOMIC STABILITY
§ Underlying Indicators§ Strength of institutions
§ Press freedom
§ Stability and peace
§ Judicial system, rule of law
§ Government effectiveness
§ Corruption perception
§ Control of corruption
§ Political rights
§ Civil liberties
Bahrain
Cote d'Ivoire
Egypt
Gabon
Ghana
GreeceHungary Ireland
Japan
Jordan
Kenya
Lebanon
Morocco Nigeria
Norway
Oman
Pakistan
Russia
Senegal
SpainTunisia
Venezuela
Namibia
Georgia
Indonesia
Kazakhstan
RomaniaMed
ian
valu
e (U
nem
ploy
men
t Rat
e)
Median value (Political Rights and Civil Liberties)
Weak Political Rights and Civil Liberties*
Strong Political Rights and Civil Liberties
Low
Une
mpl
oym
ent
Rate
Hig
h U
nem
ploy
men
t Ra
te
Political Rights and Civil Liberties
Une
mpl
oym
ent
Higher incidence of conflict
21
IMPROVING POLITICAL GOVERNANCE → ECONOMIC GROWTH SUSTENANCE
22
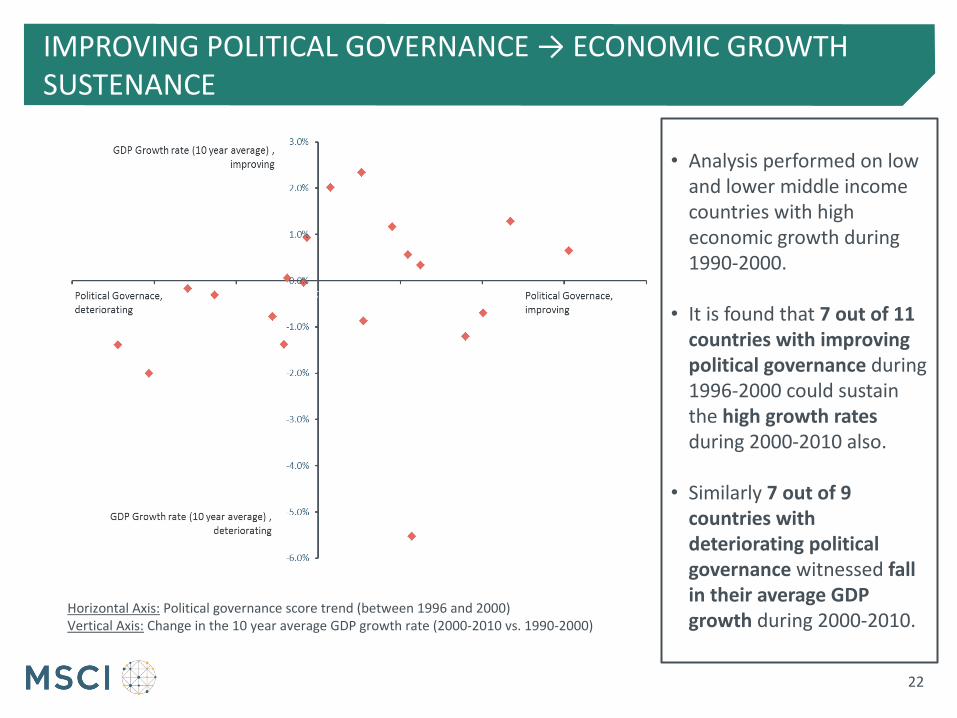
Horizontal Axis: Political governance score trend (between 1996 and 2000)Vertical Axis: Change in the 10 year average GDP growth rate (2000-2010 vs. 1990-2000)
• Analysis performed on low and lower middle income countries with high economic growth during 1990-2000.
• It is found that 7 out of 11 countries with improving political governance during 1996-2000 could sustain the high growth rates during 2000-2010 also.
• Similarly 7 out of 9 countries with deteriorating political governance witnessed fall in their average GDP growth during 2000-2010.

HIGH INCOME INEQUALITY → HIGH POLITICAL INSTABILITY AND VIOLENCE
23
Analysis done on countries in MSCI country universe shows that countries with moderate to high income inequality have a higher level of political instability and violence

HIGH ENERGY RESOURCE DEPLETION à UNSUSTAINABLE ECONOMIC GROWTH
§ Underlying Indicators§ Energy resources (TJ per capita)§ Energy efficiency ($/ kg oil equiv.)§ Renewable energy (%)§ Energy imports (%)§ Water resources (m3 per capita)§ Water withdrawal (%)§ Water stress (% territory)§ Productive land (ha per capita)§ Net agricultural products imports
(% of GDP)§ Mineral resources (USD per
capita)§ Energy resource depletion (% of
GNI)§ Mineral resource depletion (% of
GNI)
*difference between maximum annual GDP growth rate and minimum annual GDP growth rate during 2005-2013
GDP Growth Variation (%) vs. Energy Resource Depletion Rate (for all energy exporting nations)
24

HIGH NATURAL RESOURCE DEPLETION AND DEPLETING RESOURCE BASE → GROWTH SUSTENANCE?
25
Natural wealth (USD per capita) is calculated as the sum of per capita fossil fuel, mineral and agriculture/forest wealth. Natural resource depletion is the sum of net forest depletion, energy depletion, and mineral depletion.

APPENDIX
26

PHILOSOPHY
ESG risks factors facing countries• Natural resource risk
• Environmental externalities and vulnerability risk
• Human capital risk
• Economic environment risk
• Political governance risk
• Financial governance risk
27
MSCI ESG Sovereign Ratings reflects how countries’ exposure to and management of environment, social, and governance risks could impact the value creation process, and thus the long-term sustainability of their economies.
Value creation process(Resources – Enablers – Performance)

MSCI ESG GOVERNMENT RATINGS FRAMEWORK – SIX RISK FACTORS
•The risk of not having and not managing the
natural resourcesNatural Resources
Environmental
Vulnerability and
Externalities
Human Capital
Economic
Environment
•The risk of not having sufficient financial
capital to manage the resources and
aforementioned risks
Financial
Governance
•The risk of not having an effective political
governance structure to manage/support
value creation process
Political
Governance
• The risk of a country’s resources and enabling
environment being vulnerable to environmental
events (e.g. infrastructure), and exposed to
environmental externalities
• The risk of not having balanced and productive
human capital
• The risk of not having conducive economic
environment to utilize the resources effectively
•Energy security, water stress•Sustainable economic growth•Food security•Pressure on trade balances
•Security of physical assets•Health impacts of pollution•Vulnerability to extreme weather events
•Biodiversity
•Technology readiness•Labor productivity•Competitiveness of workforce•Access to basic services
•Inequality - social upheaval•Youth unemployment•Ease of doing business & Infra• Labor freedom and workers’ rights
• Trade vulnerability• Fiscal transparency and governance in resource sector
•Sustainable fiscal and external debt positions
•Costs of corruption•Accountability of government•Violence, political uncertainty
EnvironmentalPhilippines: annual cost of
typhoons 4% of GDP 1China: cost of pollution
>5% of GDP 2
SocialSouth African strikes cost ~$400 3 million in 2012,
growing in 2013
GovernanceWorld Bank estimates cost
of corruption at 2-4% of GDP, equivalent to 20% tax
on foreign investment 4
Sources: MSCI ESG Research;
1 Philippines Climate Change Commissioner, 2 World Bank Environment – Asia-Pacific, 3 South African government estimates, 4 World Bank Governance Institute of Global Governance
28

This document and all of the information contained in it, including without limitation all text, data, graphs, charts (collectively, the “Information”) is the property of MSCI Inc. or its subsidiaries (collectively, “MSCI”), or MSCI’s licensors, direct or indirect suppliers or any third party involved in making or compiling any Information (collectively, with MSCI, the “Information Providers”) and is provided for informational purposes only. The Information may not be modified, reverse-engineered, reproduced or redisseminated in whole or in part without prior written permission from MSCI.
The Information may not be used to create derivative works or to verify or correct other data or information. For example (but without limitation), the Information may not be used to create indexes, databases, risk models, analytics, software, or in connection with the issuing, offering, sponsoring, managing or marketing of any securities, portfolios, financial products or other investment vehicles utilizing or based on, linked to, tracking or otherwise derived from the Information or any other MSCI data, information, products or services.
The user of the Information assumes the entire risk of any use it may make or permit to be made of the Information. NONE OF THE INFORMATION PROVIDERS MAKES ANY EXPRESS OR IMPLIED WARRANTIES OR REPRESENTATIONS WITH RESPECT TO THE INFORMATION (OR THE RESULTS TO BE OBTAINED BY THE USE THEREOF), AND TO THE MAXIMUM EXTENT PERMITTED BY APPLICABLE LAW, EACH INFORMATION PROVIDER EXPRESSLY DISCLAIMS ALL IMPLIED WARRANTIES (INCLUDING, WITHOUT LIMITATION, ANY IMPLIED WARRANTIES OF ORIGINALITY, ACCURACY, TIMELINESS, NON-INFRINGEMENT, COMPLETENESS, MERCHANTABILITY AND FITNESS FOR A PARTICULAR PURPOSE) WITH RESPECT TO ANY OF THE INFORMATION.
Without limiting any of the foregoing and to the maximum extent permitted by applicable law, in no event shall any Information Provider have any liability regarding any of the Information for any direct, indirect, special, punitive, consequential (including lost profits) or any other damages even if notified of the possibility of such damages. The foregoing shall not exclude or limit any liability that may not by applicable law be excluded or limited, including without limitation (as applicable), any liability for death or personal injury to the extent that such injury results from the negligence or willful default of itself, its servants, agents or sub-contractors.
Information containing any historical information, data or analysis should not be taken as an indication or guarantee of any future performance, analysis, forecast or prediction. Past performance does not guarantee future results.
The Information should not be relied on and is not a substitute for the skill, judgment and experience of the user, its management, employees, advisors and/or clients when making investment and other business decisions. All Information is impersonal and not tailored to the needs of any person, entity or group of persons.
None of the Information constitutes an offer to sell (or a solicitation of an offer to buy), any security, financial product or other investment vehicle or any trading strategy.
It is not possible to invest directly in an index. Exposure to an asset class or trading strategy or other category represented by an index is only available through third party investable instruments (if any) based on that index. MSCI does not issue,sponsor, endorse, market, offer, review or otherwise express any opinion regarding any fund, ETF, derivative or other security, investment, financial product or trading strategy that is based on, linked to or seeks to provide an investment return related to the performance of any MSCI index (collectively, “Index Linked Investments”). MSCI makes no assurance that any Index Linked Investments will accurately track index performance or provide positive investment returns. MSCI Inc. is not an investment adviser or fiduciary and MSCI makes no representation regarding the advisability of investing in any Index Linked Investments.
Index returns do not represent the results of actual trading of investible assets/securities. MSCI maintains and calculates indexes, but does not manage actual assets. Index returns do not reflect payment of any sales charges or fees an investor may payto purchase the securities underlying the index or Index Linked Investments. The imposition of these fees and charges would cause the performance of an Index Linked Investment to be different than the MSCI index performance.
The Information may contain back tested data. Back-tested performance is not actual performance, but is hypothetical. There are frequently material differences between back tested performance results and actual results subsequently achieved by any investment strategy.
Constituents of MSCI equity indexes are listed companies, which are included in or excluded from the indexes according to the application of the relevant index methodologies. Accordingly, constituents in MSCI equity indexes may include MSCI Inc., clients of MSCI or suppliers to MSCI. Inclusion of a security within an MSCI index is not a recommendation by MSCI to buy, sell, or hold such security, nor is it considered to be investment advice.
Data and information produced by various affiliates of MSCI Inc., including MSCI ESG Research Inc. and Barra LLC, may be used in calculating certain MSCI indexes. More information can be found in the relevant index methodologies on www.msci.com.
MSCI receives compensation in connection with licensing its indexes to third parties. MSCI Inc.’s revenue includes fees based on assets in Index Linked Investments. Information can be found in MSCI Inc.’s company filings on the Investor Relations section of www.msci.com.
MSCI ESG Research Inc. is a Registered Investment Adviser under the Investment Advisers Act of 1940 and a subsidiary of MSCI Inc. Except with respect to any applicable products or services from MSCI ESG Research, neither MSCI nor any of its products or services recommends, endorses, approves or otherwise expresses any opinion regarding any issuer, securities, financial products or instruments or trading strategies and MSCI’s products or services are not intended to constitute investment advice or a recommendation to make (or refrain from making) any kind of investment decision and may not be relied on as such. Issuers mentioned or included in any MSCI ESG Research materials may include MSCI Inc., clients of MSCI or suppliers to MSCI, and may also purchase research or other products or services from MSCI ESG Research. MSCI ESG Research materials, including materials utilized in any MSCI ESG Indexes or other products, have not been submitted to, nor received approval from, the United States Securities and Exchange Commission or any other regulatory body.
Any use of or access to products, services or information of MSCI requires a license from MSCI. MSCI, Barra, RiskMetrics, IPD, FEA, InvestorForce, and other MSCI brands and product names are the trademarks, service marks, or registered trademarks of MSCI or its subsidiaries in the United States and other jurisdictions. The Global Industry Classification Standard (GICS) was developed by and is the exclusive property of MSCI and Standard & Poor’s. “Global Industry Classification Standard (GICS)” is a service mark of MSCI and Standard & Poor’s.
NOTICE AND DISCLAIMER
29