mse monographs monograph 25/2013 … list of tables 1 chapter 1 1.1 classification of handicraft...
TRANSCRIPT

MSE Monographs *
Taxation of Goods and Services in IndiaD.K.Srivastava and C.Bhujanga Rao
* Monograph 12/2011Coping with Pollution: Eco Taxes in a GST RegimeD.K. Srivastava, K.S. Kavi Kumar and C. Bhujanga Rao, with inputs from Brijesh C. Purohit and Bodhisattva Sengupta
* Monograph 13/2011Recent Bouts of Inflation in India: Policy Paralysis?T.N. Srinivasan
* Monograph 14/2011Impact of Fiscal Instruments in Environmental Management through a Simulation Model: Case Study of IndiaD.K. Srivastava and K.S. Kavi Kumar, with inputs from Subham Kailthya and Ishwarya Balasubramaniam
* Monograph 15/2012Environmental Subsidies in India: Role and ReformsD.K. Srivastava, Rita Pandey and C. Bhujanga Rao, with inputs from Bodhisattva Sengupta
* Monograph 16/2012Integrating Eco-Taxes in the Goods and Services Tax Regime in IndiaD.K. Srivastava and K.S.Kavi Kumar
* Monograph 17/2012Monitorable Indicators and Performance: Tamil NaduK. R. Shanmugam
* Monograph 18/2012Performance of Flagship Programmes in Tamil NaduK. R. Shanmugam, Swarna S Vepa and Savita Bhat
* Monograph 19/2012State Finances of Tamil Nadu: Review and ProjectionsA Study for the Fourth State Finance Commission of Tamil NaduD.K. Srivastava and K. R. Shanmugam
* Monograph 20/2012Globalization and India's Fiscal Federalism: Finance Commission's Adaptation To New ChallengesBaldev Raj Nayar
* Monograph 21/2012On the Relevance of the Wholesale Price Index as a Measure of Inflation in IndiaD.K.Srivastava and K.R.Shanmugam
* Monograph 22/2012A Macro-Fiscal Modeling Framework for Forecasting and Policy Simulations D.K.Srivastava, K.R.Shanmugam and C. Bhujanga Rao
* Monograph 23/2012Green Economy – Indian PerspectiveK.S. Kavikumar, Ramprasad Sengupta, Maria Saleth, K.R.Ashok and R.Balasubramanian
* Monograph 24/2013Estimation and Forecast of Wood Demand and Supply in TamilanduK.S. Kavi Kumar, Brinda Viswanathan and Zareena Begum I
Monograph 11/2011
MADRAS SCHOOL OF ECONOMICSGandhi Mandapam Road
Chennai 600 025 India
February 2013
MONOGRAPH 25/2013
Brinda Viswanathan
ENUMERATION OF CRAFTS PERSONS IN INDIA

Enumeration of Crafts Persons in India
Brinda Viswanathan Associate Professor, Madras School of Economics
MADRAS SCHOOL OF ECONOMICS Gandhi Mandapam Road
Chennai 600 025 India
February 2013

ii
MONOGRAPH 25/2013 February 2013 Rs.200/-
MADRAS SCHOOL OF ECONOMICS Gandhi Mandapam Road Chennai 600 025 India Phone: 2230 0304/ 2230 0307/2235 2157 Fax : 2235 4847 /2235 2155 Email : [email protected] Website: www.mse.ac.in

iii
Preface This study titled ‘Enumeration of Crafts Persons in India’ was undertaken to estimate the number of people involved with handicraft and handloom activities in India. The study was undertaken on behalf of the Crafts Council of India, Chennai during the period 2009/2010 to understand the nature of information available to enumerate the crafts population using large scale secondary data sources.
This study has used two such data bases, the census data for the year 2001 and the National Sample Survey data on employment and unemployment for the year 2004-05. The study has provided detailed tabulations of crafts population across sub-groups like gender, rural-urban residence, caste and religion for all India level and the states of India. The study shows that there is ample scope for arriving at estimates of population involved in craft activities on a periodic basis using large scale survey data sets from the National Sample Survey organization or the census. However, the definitions of craft activities have to be either based on the industrial classification or the occupational classification. Interface among different data collecting agencies would help improve estimations in terms of geographic disaggregation as well as social stratification. The study concludes by identifying the strengths and limitations of these data bases and provides suggestions for putting in place a systematic and periodic estimation of the crafts population.
I would like to thank the project team consisting of Mr. Raghav Rajagopalan and Ms. Sudhersena Alalasundaram for their support throughout the project. I would like to express my gratitude to the eminent members of the Crafts Council of India for their constant guidance and in particular Ms. Vidya Sastry for all the coordination efforts and useful discussions. I would like to thank Mr. S. Raju and Ms. E. Kalaivani for their assistance in completing the project. Finally, I thank the Madras School of Economics for providing the NSSO data set and other infrastructural facilities for completing the study. Brinda Viswanathan Chennai

iv
CONTENTS
Preface iii List of Tables v List of Figures vii
1.0 EMPLOYMENT IN CRAFT SECTOR: OVERVIEW 1 1.1 Introduction 1.2 Definition of Handicrafts 1.3 Classification of Handicrafts 1.4 Secondary Data Sources
1.5 Employment in Handloom and Handicrafts: A brief Review
1.5.1 Variations in estimates
1.5.2 Changes in employment over time: A Preliminary analysis
2.0 EMPLOYMENT IN CRAFT SECTOR: ESTIMATION FROM NATIONAL
SAMPLE SURVEY 19
2.1 Introduction 2.2 Craft Households: CCI Definition 2.2.1 Employment Status 2.2.2 Social Groups 2.2.3 Religious Groups 2.2.4 States 2.3 Individuals In Crafts Sector: CCI Definition 2.4 Individuals In Crafts Sector: DC-H Definition 2.5 Individuals In Crafts Sector: LR Definition
3.0 ENUMERATING CRAFTS PERSONS: SOME METHODOLOGICAL ISSUES
43
3.1 Estimations based on census, 2001 3.2 Comparisons across different approaches and databases 3.3 Production for Home Consumption
3.4 Way Forward Appendix A 53 Appendix B 67

v
LIST OF TABLES
1 Chapter 1 1.1 Classification of Handicraft Items, DCH 1.2 Broad Categories of Craft Items, DCH 1.3 Village Industries under the purview of KVIC 1.4 Trends in Employment across Subgroups of Craft based
Activities 1961, 1981 and 2001
1.5 Share of Women and Urban Population in Crafts Population, SRUTI
2 Chapter 2 2.3.1 Total Craft Population, Proportion of Women and Urban
Population, Share of Crafts Population of each State
2.4.1 Crafts Population and its share across States, Share of Urban and Women in each State: DCH definition
3 Chapter 3 3.1 Crafts Population based on different definitions, NSSO and
census (in thousands)
3.2 Craft items made by women for home consumption, 2004/05 APPENDIX TABLES A Definitions A.1 NCO codes for Craft Groups: SRUTI definition A.2 Occupational codes based for crafts using DC-H A.3 Occupational codes based for CCI definition A.4 Occupational codes based on LR definition A.5 Terminologies used in National Sample Survey B Statistical Tables B1.1a Distribution of Households by medium used and employment
status
B1.1b Number of Households by medium used and employment status B1.1c Distribution of Households by medium used and social groups B2.1d Number of Households by medium used and employment status

vi
B Statistical Tables
B2.1e Distribution of Households by medium used and religious groups
B2.1f Number of Households by medium used and religious groups B2.1g Crafts and Total Households across States and
Their distribution across states within each segment
B2.1h Self-employed Households and Crafts Households B2.2a Number of Working Population: Crafts, Non-Crafts and Total B2.2b Working Population Across Employment Status (in thousands) B2.2c Distribution of Crafts population across age groups (years) B2.2d Crafts population across education levels B2.2e Crafts population across religious groups B2.2f Crafts population across social groups B2.3a Number of Working Population: Crafts, Non-Crafts and Total B2.3b Number and Distribution of Crafts persons: Employment
Status: Rural
B2.3c Number and Distribution of Crafts persons: Employment Status: Urban
B2.3d Distribution of Crafts persons across Age-groups, in each medium, total crafts and total working population
B2.3e Distribution of Crafts persons across Religious groups in each medium
B2.3f Distribution of Crafts persons across Social groups in each medium
B2.3g Distribution of Crafts persons across Education levels in each medium, total crafts and total working population
B2.3h Number (thousand persons) of Crafts persons across states B2.3i Distribution of Population across Medium in each State B2.3j Distribution of Population across State within each Medium B2.4a Number of Working Population: Crafts, Non-Crafts and Total B2.4b Number of persons based on Work Status and Share of Urban
and Women: Crafts and Total Working Population
B2.4c Distribution across Employment Status B2.4d Distribution across age groups B2.4e Distribution across religious groups

vii
B Statistical Tables
B2.4f Distribution across Social groups B2.4g Distribution across Levels of Educational Attainment B2.4h Crafts Population across States and Share of Urban and
Women population
B2.5a Percentage of Crafts Population in Total Working Population B2.5b Crafts Population using Earth as the Medium
LIST OF FIGURES
1.1 1.1: Various Secondary Data Sources and Aspects for Identification
of Craft Persons within each of them.
1.2 1.2 Employment and Exports across Different Handloom Handicraft and Related Segments
2.2.1a Distribution of Households by Employment Status: Rural and Urban
2.2.1b Distribution of Households by Employment Status and Primary Medium Used
2.2.2a Distribution of Households by Social Groups: Rural and Urban
2.2.2b Distribution of Households by Social Groups and Mediums used
2.2.3a Distribution of Households by Religious Groups: Rural and Urban 2.2.3b Distribution of Households by Religious Groups and Mediums used
2.2.4 Distribution of Households by States: Crafts and Total
2.3.1 Distribution of persons across sectors and gender each within crafts sector and total working population, CCI definition
2.3.2 Number of persons (lakh) across Mediums and sector and gender composition within each of them, CCI definition
2.3.3 Number of persons (lakh) across work status, CCI definition
2.3.4 Distribution across employment status within each medium, CCI definition
2.3.5 Distribution across Age groups, CCI definition
2.3.6 Distribution of Crafts and Total Working Population across Educational groups, CCI definition
2.3.7 Distribution of Mediums within Education groups
2.3.8 Distribution across Religious groups
2.3.9 Distribution across Social groups
2.3.8 Distribution of crafts population and total population across states

viii
2.4.1 Distribution of crafts population, DC-H definition
2.4.2 Distribution of Crafts persons across Employment Status, DC-H definition
2.5.1 Distribution of Crafts persons by Rural/Urban Residence: LR definition
2.5.2 Distribution across Employment Status in each craft group: LR definition
2.5.3 Distribution across Employment Status in each craft group: LR definition
3.1 Distribution of Main Workers across Districts of India, Census 2001: CCI definition
3.2 Distribution of Main Workers across Districts of India, Urban and Women, Census 2001: CCI definition
3.3 Distribution of crafts person based on different medium across states of India: census 2001, CCI definition
APPENDIX FIGURES
B1 Geographic Spread of Crafts Population

1
Chapter 1 EMPLOYMENT IN CRAFT SECTOR: OVERVIEW
1.1. Introduction Handicrafts and handloom sector in India has contributed to the foreign exchange in a substantial way for about two decades. There has also been a substantial rise in domestic demand for these items. However, not all segments of those producing handicraft and handlooms items have been able to make use of the export potential or increasing domestic demand. Thus, the benefits to those involved in such activities have not been uniform across regions, as well as within sub-groups of such activities. Further, depending on the access to market a similar good may be valued differently in different regions. Due to the export potential there is some documentation on the income generated by this part of the sector while there are fewer studies that enumerate the number of people involved in such activities.
In this sector the scale of activity and investment is small due to its traditional nature of production involving heterogeneous human skill. Consequently the production process is largely within the unorganised/informal sector of the economy. A large part of the production takes place within the household premises using family labour. This self-employed nature of production process poses problems for valuation of the items produced as the cost of one the main inputs that is family labour gets under-valued. Moreover, it is not only difficult to assess the per unit cost of producing a handicraft or handloom product but how many such items are produced is also difficult to assess due to self-consumption as not all of the products are marketed. An important consequence of this is that most official statistics are neither able to satisfactorily assess the value addition from such products nor the number of people involved in such activities. Most often the people in the front end of the production process who are considered to be ‘economically active’ get counted while several of those who facilitate in the production process while they primarily pursue other activities including household chores, are left out in the enumeration.
Thus, enumeration of the population involved in producing handicraft and
handloom items poses some challenges. Consequently, only limited studies exist that have attempted to explore and estimate the numbers. These estimates naturally depend on the methodology used to collect the data that is, data source and equally importantly on what constitutes a handicraft item that is, the definition of handicrafts itself.

2
The present study is another modest attempt in this direction to estimate the number of people involved in producing various handicraft items including those who form the backward linkage to the main production process. In this paper, the results are reported primarily based on the National Sample Survey Organisation (NSSO) on employment-unemployment survey for the year 2004-05 and some additional results using the Indian census data for 2001. 1.2. Definition of Handicrafts This section compiles information primarily from various web-based sources on the definition of handicrafts.
Encyclopaedia Britannica defines it as ‘occupation of making by hand usable products graded with visual appeal. Handicrafts encompass activities that require a broad range of skills and equipment, including needle work, lace-making, weaving, printed textiles, decoration, basketry, pottery, ornamental metal working, jewelling, leather working, wood working, glassblowing, and the making of the stained glass.’ This definition has been cited in an apex court ruling in India while deciding whether agarbattis (incense sticks) could be qualified as handicrafts.1 The court’s ruling was that since both the requisites “skill of the worker and made by hand” were not simultaneously satisfied it did not qualify as a handicraft. A similar issue was brought up again to the Supreme Court in another dispute on whether readymade garments qualified as ‘handicrafts’ so that they could be exempted from excise duties. This time in consultation with the Development Commissioner Handicrafts, the court indicated that “if it had the following properties than it could classify as handicrafts.
(a) It must be predominantly made by hand. It does not matter if some machinery is
also used in the process. (b) It must be graced with visual appeal in the nature of ornamentation or in-lay
work or some similar work lending it an element of artistic improvement. Such ornamentation must be of a substantial nature and not a mere pretence.”
In this sense the court said that “some of the ready made garments which can
predominantly be made and graced with ornamentation by hand could qualify as handicrafts.”
1 http://www.cbec.gov.in/excise/cx-circulars/cx-circulars-04/790-04-cx.htm

3
From this court ruling one observes that perhaps the official position on the definition of handicrafts for Government India lies with the Development Commissioner, Handicrafts, (DC-H, henceforth) Ministry of Textiles. As per the ministry website: “Handicrafts are mostly defined as items made by hand, often with the use of simple tools, and are generally artistic and/or traditional in nature. They are also objects of utility and objects of decoration”2
Though this definition is broad enough not all types of handicrafts products
produced within this country fall under the administrative jurisdiction of the DC-H. According to a taskforce report, Government of India (1989), some products that typically qualify as handicrafts (and handloom) fall under the administration of Khadi and Village Industries Commission (KVIC).
The definition given by the United Nations Educational, Scientific and Cultural
Organization/Information Technology Community (UNESCO/ITC) International Symposium according to the “Crafts and the International Market: Trade and Customs Codification”, Manila, Philippines, October 1997 is a slightly expanded version of the DC-H definition:3
“Handicrafts can be defined as products which are produced either completely
by hand or with the help of tools. Mechanical tools may be used as long as the direct manual contribution of the artisan remains the most substantial component of the finished product. Handicrafts are made from raw materials and can be produced in unlimited numbers. Such products can be utilitarian, aesthetic, artistic, creative, culturally attached, decorative, functional, traditional, religiously and socially symbolic and significant.”
This definition is a further elaboration of the DCH definition with a little more
emphasis on the individual component. Wikipedia, the free encyclopedia also lays emphasis on this aspect defining it as follows4:
“Handicraft, also known as craftwork or simply craft, is a type of work where
useful and decorative devices are made completely by hand or using only simple tools. Usually the term is applied to traditional means of making goods. The individual
2 http://handicrafts.nic.in/ 3 http://www.india-crafts.com/business-reports/indian-handicraft-industry/handicraft-introduction.htm 4 http://en.wikipedia.org/wiki/Handicrafts

4
artisanship of the items is a paramount criterion and such items often have cultural and/or religious significance. Items made by mass production or machines are not handicrafts.”
It also tries to additionally qualify by distinguishing it from arts and crafts.
“Usually, what distinguishes the term handicraft from the frequently used category arts and crafts is a matter of intent: handicraft items are intended to be used, worn, etc, having a purpose beyond simple decoration. Handicrafts are generally considered more traditional work, created as a necessary part of daily life, while arts and crafts implies more of a hobby pursuit and a demonstration/perfection of a creative technique. In practical terms, the categories have a great deal of overlap.”
The Wikipedia definition comes from an informal source but clearly in all these
definitions, the emphasis is on the following aspects: skill or knowledge of the individual involved in producing it, traditional/cultural technique of production, and the utility and decorative value of the items produced. The last aspect makes the production of such items as a source of income generation.
As is obvious these definitions are based on how a particular commodity is
created. How does one use this definition to enumerate people involved in producing such commodities? In other words if the data set is secondary in nature and collects information about the people involved in different economic activities but not so much about the nature of goods and services that they produce. For this, one turns to the definition of a craftsperson or artisan.
A study on India’s artisans by Satyanand and Singh (1995), (henceforth, SRUTI5
Report) indicates that an individual who displays all the essential attributes given below is considered as an artisan:
“The essential characteristics of an artisan are as follows:
He/she makes goods, and/or provides services to others He/she uses his/her own skills and labour for the purpose He/she makes goods and provides services which use traditional skills, i.e., skills
that have been historically associated with a particular artisanal activity, even
5 The acronym stands for Society for Rural, Urban and Tribal Initiatives

5
though they have been adapted over time to evolving technologies, materials and products.
The incidental characteristics of an artisan are as follows: He/she is self-employed, in the sense that such a person enjoys the whole produce
of his/her own labour, or the whole value which it adds to the materials upon which it is based.
He/she functions individually, or at a household level.” (SRUTI Report, pp.8-9) This SRUTI study is one of the earliest attempts to enumerate the people
involved with handicrafts at a national level. Apart from what has been mentioned above an additional aspect noteworthy in their definition is that “an artisan uses locally available natural resources as raw materials.” This study also brings into its ambit the village industries, thereby moving the handicrafts out of the household sector. More importantly, as emphasized in this report, the industry is small scale in nature due to small fixed capital invested, limited usage of electric power and that the population of that hamlet/village does not exceed a certain small number. Despite being ‘industrial’ the emphasis is clearly on ‘traditional and artistic features deriving from the geographical region of production’. In this sense this also brings out the fact that items produced quite often takes the name of the place where it is produced as in the case of Kancheepuram/Benares saris or Kondapally/Chennapatna toys.
According to the web-based dictionary (Wikipedia) the definition of artisan is
quite similar but does not emphasize so much on the ‘geography’ though indicates the use of natural resources as raw material for the objects created by the artisans.6
“An artisan (from Italian: artigiano) is a skilled manual worker who crafts items
that may be functional or strictly decorative, including furniture, clothing, jewelry, household items, and tools. The term can also be used as an adjective to refer to the craft of hand making food products, such as bread, beverages and cheese. Manufacture by hand and with hand tools imparts unique and individual qualities to artisanal products, in contrast to mass produced goods where every one is nearly identical. Artisans traditionally work in media such as wood, ceramics, glass, common and precious metals, basketry, textiles, esparto grass, and leather.”
6 http://en.wikipedia.org/wiki/Artisan

6
As this definition indicates the natural products that the artisan works with as the basic material to produce the craft item, is one of the standard ways of classifying the artisans or the craft products that they make. This classification is very essential and useful as it highlights the regional features as well as in identifying crafts that may have grown/transformed or declined/disappeared over time. A reason for the decline could be traced to the availability of the primary raw material used; for instance it may so happen that particular wood based crafts may have declined production due to the degradation of certain species of wood in the local forest. 1.3 Classification of Handicrafts The primary medium of the items created can be classified into Earth, Fibre, Metal, Wood, Stone, Leather, and Ivory, Bones, Horns, and Shells.7 The medium of earth includes clay, ceramic and glass, fiber includes mainly textiles and wood includes cane and bamboo, papier-mache items as well. Incidentally, archaeologists use a similar approach to classify the objects that they excavate at different sites as the item’s functional/decorative value may not be known in advance and the principal medium based classification is easier.
Heather (2006) brings out an interesting classification of crafts based on the ‘technology’ used. The crafts can be extractive-reductive crafts or transformative crafts. The craft items produced by ‘chipping, grinding, carving and twisting to create objects or materials’ are extractive-reductive. The examples given are wood craft, stone craft, and items made out of shell, bone, leather, antler, fur, bark, feather, and basketry and textiles of all sorts. The technique involved includes ‘twinning, weaving, pegging, and gluing to build composite objects like clothing and furniture’. In comparison to this is the transformative crafts that use pyrotechnology that is, use of heat in the traditional sense or traditional chemical processes to ‘transform raw material into new material with human action’. Metal ware/craft, earthen ware/craft and silica-based items like faience, glass and porcelain are included in this. Further, if the actual material is transformed through a chemical process like dyeing then also it classifies into the transformative category. Being an archaeologist, the author’s emphasis on such a classification stems from the fact that it informs about how a similar product is produced by different technologies in different ancient and traditional civilizations. From the perspective of the present study this classification is highlighted so that this could form a basis on
7 This classification is commonly referred to as the ‘Vishwakarma’ classification.
7
understanding how ‘technology’ of artisanal production varies across different regions within India and also how they may have transformed over a period of time.
Though an artist may work with one primary or principal medium there are
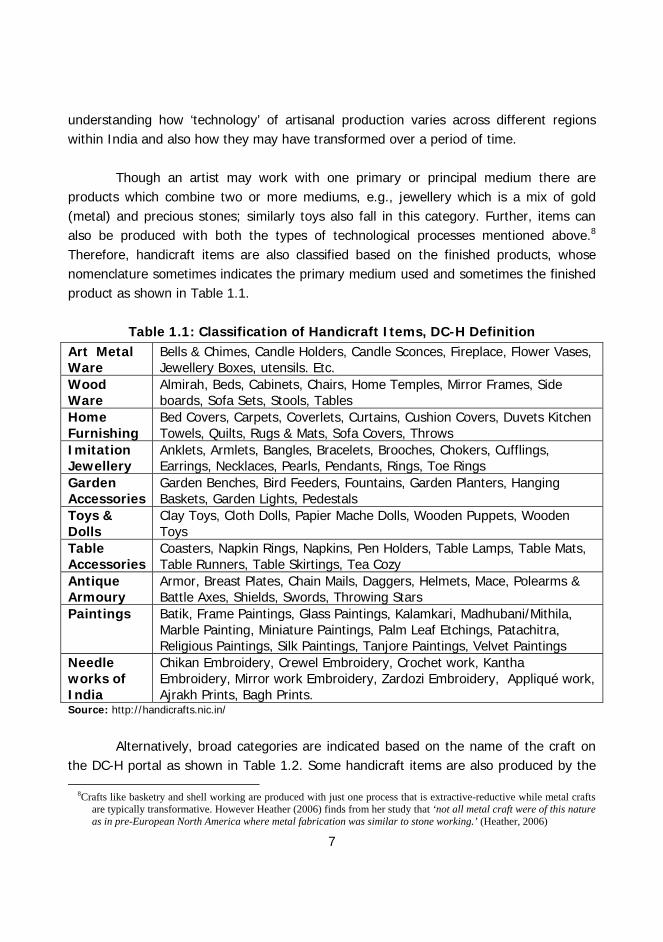
products which combine two or more mediums, e.g., jewellery which is a mix of gold (metal) and precious stones; similarly toys also fall in this category. Further, items can also be produced with both the types of technological processes mentioned above.8 Therefore, handicraft items are also classified based on the finished products, whose nomenclature sometimes indicates the primary medium used and sometimes the finished product as shown in Table 1.1.
Table 1.1: Classification of Handicraft Items, DC-H Definition Art Metal Ware
Bells & Chimes, Candle Holders, Candle Sconces, Fireplace, Flower Vases, Jewellery Boxes, utensils. Etc.
Wood Ware
Almirah, Beds, Cabinets, Chairs, Home Temples, Mirror Frames, Side boards, Sofa Sets, Stools, Tables
Home Furnishing
Bed Covers, Carpets, Coverlets, Curtains, Cushion Covers, Duvets Kitchen Towels, Quilts, Rugs & Mats, Sofa Covers, Throws
Imitation Jewellery
Anklets, Armlets, Bangles, Bracelets, Brooches, Chokers, Cufflings, Earrings, Necklaces, Pearls, Pendants, Rings, Toe Rings
Garden Accessories
Garden Benches, Bird Feeders, Fountains, Garden Planters, Hanging Baskets, Garden Lights, Pedestals
Toys & Dolls
Clay Toys, Cloth Dolls, Papier Mache Dolls, Wooden Puppets, Wooden Toys
Table Accessories
Coasters, Napkin Rings, Napkins, Pen Holders, Table Lamps, Table Mats, Table Runners, Table Skirtings, Tea Cozy
Antique Armoury
Armor, Breast Plates, Chain Mails, Daggers, Helmets, Mace, Polearms & Battle Axes, Shields, Swords, Throwing Stars
Paintings Batik, Frame Paintings, Glass Paintings, Kalamkari, Madhubani/Mithila, Marble Painting, Miniature Paintings, Palm Leaf Etchings, Patachitra, Religious Paintings, Silk Paintings, Tanjore Paintings, Velvet Paintings
Needle works of India
Chikan Embroidery, Crewel Embroidery, Crochet work, Kantha Embroidery, Mirror work Embroidery, Zardozi Embroidery, Appliqué work, Ajrakh Prints, Bagh Prints.
Source: http://handicrafts.nic.in/
Alternatively, broad categories are indicated based on the name of the craft on
the DC-H portal as shown in Table 1.2. Some handicraft items are also produced by the
8Crafts like basketry and shell working are produced with just one process that is extractive-reductive while metal crafts are typically transformative. However Heather (2006) finds from her study that ‘not all metal craft were of this nature as in pre-European North America where metal fabrication was similar to stone working.’ (Heather, 2006)

8
Khadi and Village Industries department of the Government of India as indicated by ‘#’ in some of the rows in Table 1.3.
Table 1.2: Broad Categories of Craft Items, DC-H Definition
Sl. No.
Name of the Craft Sl. No. Name of the Craft
1. Bidri 17. Musical instrument 2. Cane & Bamboo 18. Pottery and clay objects 3. Carpet 19. Rugs & durries 4. Conch-Shell 20. Stone (carving) 5. Doll & Toys 21. Stone (inlay) 6. Filigree & Silverware 22. Terracotta 7. Folk Painting 23. Theatre, Costumes & Puppet 8. Furniture 24. Textile (handloom) 9. Grass, leaf, read & fiber 25. Textile (Hand embroidery) 10. Horn & Bone 26. Textile (Hand printed) 11. Jewellery 27. Wood (carving) 12. Leather (footwear) 28. Wood (inlay) 13. Leather (other articles) 29. Wood (turning and lacquer ware) 14. Metal ware 30. Zari 15. Metal images (classical) 31. Coir twisting 16. Metal images (folk) 32. Miscellaneous crafts
and Paintings Source: http://handicrafts.nic.in/

9
Table 1.3: Village Industries Under the Purview of KVIC Mineral Based Industry 1 Pottery# 2 Lime
Agro Based & Food Processing Industry (ABFPI) 1 Pulses & Cereals Processing Industry 2 Gur & Khandsari Industry 3 Palmgur Industry 4 Fruit & Vegetable Processing Industry 5 Village Oil Industry
Polymer & Chemical Based Industry (PCBI) 1 Leather Industry# 2 Non Edible Oils & Soap Industry 3 Cottage Match Industry# 4 Plastic Industry
Forest Based Industry (FBI) 1 Medicinal Plants Industry 2 Bee Keeping Industry 3 Minor Forest Based Industries
Hand Made Paper & Fiber Industry (HMPFI) 1 Hand Made Paper Industry# 2 Fiber Industry#
Rural Engineering & Bio Technology Industry (REBTI) 1 Non Conventional Energy 2 Carpentry & Black smithy# 3 Electronics
SEP/Service Industry 1 Co-ordination
Note: # cells indicate the handicraft-oriented industries. Source:http://www.kvic.org.in/v4/village_industries.asp

10
The usage of multiple mediums pose problems in classifying a particular product into its sub-group as subjective judgment may be involved in classification. This may cause some problems while making inter-temporal (or spatial) comparisons of the value and quantity of production of the items as well as the number of people involved in such activities if the classification varies from time to time (or from place to place).
Apart from this, tailors are skilled and work largely with hand on an individual
capacity and mainly from their own house or a rented premise. The occupation may have been passed on from one generation to another making it also traditional. Broadly speaking, this makes them qualify as a craftsperson. However, since the increase in global trade in garments from India to other parts of the world, there has been a huge increase in the number of tailors recently. As these ‘new’ tailors are not skilled in the traditional sense and work in a formal manufacturing industry in an export processing zone they may have to be excluded from the counting. Similarly, with the boom in the construction sector and the increased demand for household wooden furniture due to a burgeoning middle class, not all carpenters could be classified as craftsperson. Thus, contamination within these groups would pose difficulties in identification of these activities as purely craft activities and hence in enumerating the people involved with it. The secondary data sources may not be in a position to distinguish this while the methodology in the primary surveys could. 1.4 Secondary Data Sources In India, three main secondary databases could be used for enumerating the crafts persons as indicated in Figure 1.1. In the census the main workers are either classified on the basis of the National Industrial Classification (NIC) or the National Classification of Occupations (NCO) but a cross-classification between these two groups is not possible. Within the NIC, a classification is also possible linking them to ‘household’ or ‘non-household’ industries; Jain (1986) and SRUTI, use these classifications to enumerate the crafts persons.
The Economic Census data provides information on the establishments which are
further grouped into ‘own account’ and ‘directory’ indicating the broadly household and non-household sector respectively and further classified on the basis of NIC. The NIC that are linked to the craft sector would help in identifying the workers involved within these sectors who may largely be part of the own account workers. No study so far has attempted to use this database to enumerate the crafts persons. The Central Statistical Organization (CSO) is the nodal agency at the level of central government to collect the

11
data while the state statistical departments collect the data at the district level and the surveys are conducted once in five years.
Another arm of the CSO, the National Sample Survey Organization (NSSO)
collects data on employment and unemployment across individuals all over the country, once in five years based on large samples and yearly using smaller samples. This sample information can be scaled up to get population estimates using the inflation factor and provides information across both NIC and NCO classifications for the employment along with other socio-economic characteristics. The NSSO provides information for both principal status (full time) workers and subsidiary status (part-time) workers. In recent surveys, additional data is also collected on activities like basket and mat weaving and tailoring and sewing mainly for home consumption.
The NSSO also conducts surveys focusing only on the unorganized manufacturing
sector which has been used by Liebl and Roy (2003) to estimate the persons involved with the crafts sector. Satyanand and Singh (1993) have used both the economic census and the Employment-Unemployment Surveys (EUS) of the NSSO to arrive at broad estimates. Both these studies also use the census data based on industrial classification for enumerating the crafts persons.

12
Figure 1.1: Various Secondary Data Sources in India and Aspects for Identification of Craft Persons within each of them
Note: The databases (A), (B) and (C) are three separate information bases and the enumeration cannot be
based on combining them. $ Applicable only to NIC classification
Enumeration of Population involved in craft activities
(A) Census (C) National Sample Survey
(B) Economic Census
Occupation Codes based on National Classification of Occupations (NCO)
Industrial Codes based on National Industrial Classification (NIC)
Main Workers
Household Industries$
Non-Household Industries$
Unorganised Manufacturing Sector Surveys
Principal Status
Subsidiary Status
For Home Consumption (Women)
Own Account Establishments
Employment Unemployment Surveys (Large Sample)
Directory Establishments

13
1.5 Employment in Handloom and Handicrafts: A Brief Review “As a comprehensive database for handicrafts is not available, the figures of production and employment in handicrafts are derived from the figures of handicraft exports. There is an urgent need to strengthen the database for handicraft units and prepare a reporting mechanism/estimates for the production and employment of handicrafts”∗
Much prior to this plan document a task force was set up in 1989 for the VIII Five Year Plan precisely for this reason but not much has taken off as an initiative by the government to assess the population involved in Handicraft and Handloom activities. Though these studies were very rigorous and elaborate but no periodic review has been put into place by the official agencies that will enable a regular assessment of the number of people involved in these activities and their socio-economic status. The gap still prevails and during the XI Plan (2008-2012) period efforts are being made once again to suggest ways and means of a periodic enumeration of the people involved in such activities.
In this section we take a look at the official statistics and also provide a brief
discussion on a few prominent studies used to enumerate crafts persons in India. Various plan documents indicate the employment in different segments of crafts
as distinguished by the various government departments. As one can observe from figure 1.2(a) the employment in the small scale industries has been growing more steeply while that in other three craft based activities has been growing at a far slower pace. As reported in these documents the employment remained at 12.4 million in handloom since the later 1990s to early 2000 while employment increased from 3.0 million in 1988-89 to 7.1 million in 1996-97 in the handicraft sector. After that there seems to have been a dip in employment during the ninth plan period as per this data source with employment levels at about 5.84 million in 2001-02. In the X Plan period (values not shown in the figure), the employment increased from 6.02 million persons in 2002-03 to 6.77 million persons in 2006-07 registering a compound annual growth rate of 2.3%.
Though the employment has registered an increase over the years the data
provided in the Plan documents do not seem to have been updated regularly. As can be observed from Figure 1.2a that, for handlooms the employment does not change for the
∗ Source: X Plan document: Page 720, para: 7.1.330 of the Industry section.

14
entire plan period in early 1990s. This is followed by a higher yet constant value in early 2000. More importantly the Plan documents do not indicate how these estimates are arrived at.
The information on exports though more easily available but its valuation and
accrual of benefits to the handicraft worker are open to discussion. Further as only a limited number of craft items are exported that would lead to a differential valuation of the non-exported goods vis-à-vis the exported goods thereby creating a wedge in prices not reflecting the actual ‘worth’ of the products. Compared to employment, the exports of handicrafts have a much higher share in small scale industries (Figure 1.2b). It has grown over the 1990s and the X plan document shows that there has been a large variation in the annual growth rate with some years showing negative growth rates. If jewelry, handicrafts, and other products (silk, jute, carpets, and wood products) are included then the share in total exports of India in 2006-07 is about 14% (Annexure 7.1.3, XI Plan document).
Figure 1.2: Employment and Exports across Different Handloom, Handicrafts and Related Segments
Figure 1.2a: Employment Figure 1.2b: Exports
Source: Various Plan Documents
Employment (Million Persons)
0.0
5.0
10.0
15.0
20.0
25.0
1973
-74
1988
-89
1989
-90
1990
-91
1991
-92
1992
-93
1993
-94
1994
-95
1995
-96
1996
-97
199
7-98
199
8-99
199
9-00
200
0-01
200
1-02
Million P
erso
Small Scale Industries Khadi and Village Industries
Handlooms Handicrafts
Exports (Rs. Crores)
0
2000
4000
6000
8000
10000
12000
14000
1988-89 1990-91 1992-93 1994-95 1996-97 1998-99 2000-01
Rs.
Cro
re
Handicrafts
Handlooms
15
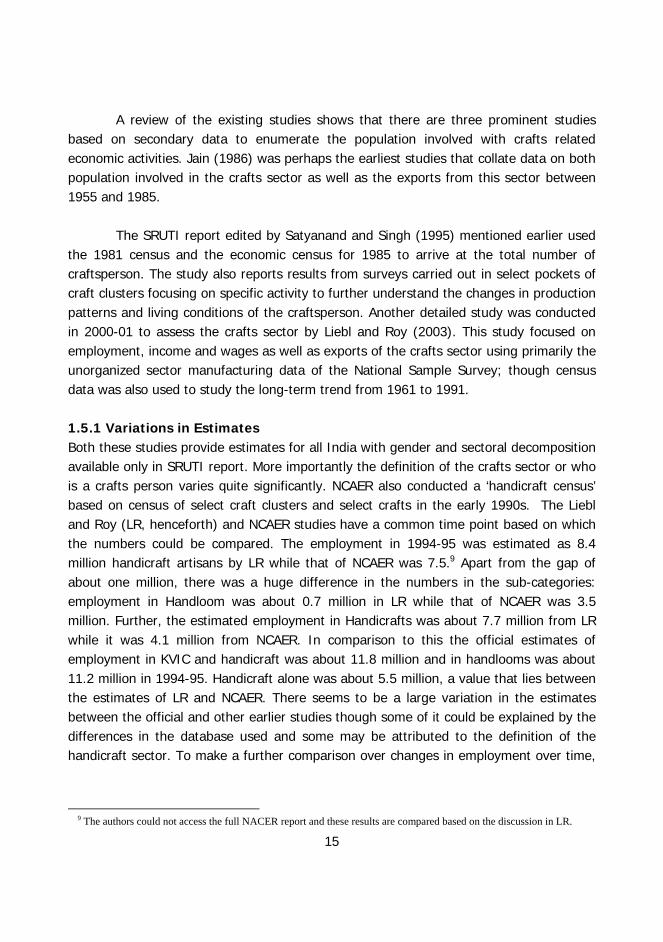
A review of the existing studies shows that there are three prominent studies based on secondary data to enumerate the population involved with crafts related economic activities. Jain (1986) was perhaps the earliest studies that collate data on both population involved in the crafts sector as well as the exports from this sector between 1955 and 1985.
The SRUTI report edited by Satyanand and Singh (1995) mentioned earlier used
the 1981 census and the economic census for 1985 to arrive at the total number of craftsperson. The study also reports results from surveys carried out in select pockets of craft clusters focusing on specific activity to further understand the changes in production patterns and living conditions of the craftsperson. Another detailed study was conducted in 2000-01 to assess the crafts sector by Liebl and Roy (2003). This study focused on employment, income and wages as well as exports of the crafts sector using primarily the unorganized sector manufacturing data of the National Sample Survey; though census data was also used to study the long-term trend from 1961 to 1991. 1.5.1 Variations in Estimates Both these studies provide estimates for all India with gender and sectoral decomposition available only in SRUTI report. More importantly the definition of the crafts sector or who is a crafts person varies quite significantly. NCAER also conducted a ‘handicraft census’ based on census of select craft clusters and select crafts in the early 1990s. The Liebl and Roy (LR, henceforth) and NCAER studies have a common time point based on which the numbers could be compared. The employment in 1994-95 was estimated as 8.4 million handicraft artisans by LR while that of NCAER was 7.5.9 Apart from the gap of about one million, there was a huge difference in the numbers in the sub-categories: employment in Handloom was about 0.7 million in LR while that of NCAER was 3.5 million. Further, the estimated employment in Handicrafts was about 7.7 million from LR while it was 4.1 million from NCAER. In comparison to this the official estimates of employment in KVIC and handicraft was about 11.8 million and in handlooms was about 11.2 million in 1994-95. Handicraft alone was about 5.5 million, a value that lies between the estimates of LR and NCAER. There seems to be a large variation in the estimates between the official and other earlier studies though some of it could be explained by the differences in the database used and some may be attributed to the definition of the handicraft sector. To make a further comparison over changes in employment over time,
9 The authors could not access the full NACER report and these results are compared based on the discussion in LR.

16
the census based methodology reported in SRUTI is extended to arrive at the estimates for 2001. 1.5.2 Changes in Employment Over Time: A Preliminary Analysis Table 1.4 shows that the overall employment has gone up and so has it in most segments with the exception of leather and metal workers. The estimates from this study show that about 48% of this employment is in urban areas in 2001. With the exception of cane and bamboo workers, potters and to some extent wood workers, all the other segments have become largely urban. Women constitute about 17% with a decline in their share among cane and bamboo workers and potters since 1961 while their share among tailors and textile workers has gone up substantially since 1981 (Table 1.5).
Table 1.4: Trends in Employment Across Subgroups of Craft Based Activities 1961, 1981 and 2001: SRUTI Definition
Type of Workers
Number of Craft Persons (in lakhs) 1961 1981 2001
Cane & Bamboo Worker 9.3 8.2 9.4 Jewelers 5.4 8.4 16.2 Leather Worker 8.0 6.3 6.2 Metal Worker 12.0 18.7 9.7 Potters 9.0 9.8 10.1 Tailors 11.9 21.4 43.0 Textile Worker 49.0 45.6 43.1 Wood Worker 11.4 14.8 26.5 Total 115.9 133.3 164.3 Source: The Estimates for 1961 and 1981 are from Table 2 (pp. 162) of SRUTI report and the estimates for
2001 are author’s estimates. The definition of a crafts person is based Table A.1 in Appendix A.

17
Table 1.5: Share of Women and Urban Population in Crafts Population: SRUTI Definition
Type of Workers Proportion of Women (%) Proportion of Urban (%) 1961 1981 2001 1961 1981 2001
Cane & Bamboo Worker 54.0 43.0 41.9 13.0 17.0 17.6 Jewelers 3.0 2.0 3.6 38.0 67.0 63.5 Leather Worker 9.0 4.0 7.6 31.0 49.0 63.7 Metal Worker 5.0 3.0 6.8 53.0 50.0 47.7 Potters 33.0 21.0 28.4 16.0 20.0 19.5 Tailors 15.0 11.0 20.2 47.0 54.0 55.0 Textile Worker 45.0 19.0 26.6 39.0 55.0 50.5 Wood Worker 1.0 1.0 1.5 33.0 41.0 42.9
Note: This is based on the SRUTI definition as given in Appendix A.1.
An assessment of the population involved in crafts based on SRUTI definition using the census data shows that the number of people involved in crafts based activities has declined in come categories while it has gone up substantially in others. The increases are clearly segments producing commercially viable products with increasing export markets. The official estimates from the Plan documents also indicate an increase in employment but it has not been uniform across different segments of craft categories.
The next chapter uses the National Sample Survey data to arrive at the estimates
of number of craftsperson engaged in economically viable craft activities. These estimates have been arrived at using different definitions and estimates.


19
Chapter 2
EMPLOYMENT IN CRAFT SECTOR ESTIMATION FROM NATIONAL SAMPLE SURVEY
2.1 Introduction The national sample survey data gives the scope for estimation from several perspectives. The first section reports the estimates from the perspective of households which report craft activities as the primary occupation.
This chapter has four sections. The first two sections uses the project (CCI,
henceforth) definition with Section 2.2 providing the number of households and some aspects related to it while Section 2.3 provides the number of individuals pursuing craft activities. Section 2.4 uses the occupations that largely cover craft activities under DC-H definition at the individual level and Section 2.5 uses the industrial categories based on LR for defining the crafts sector and once again the estimates are for the individuals. 2.2 Craft Households: CCI Definition The CCI (project) definition of the handicrafts sector has been arrived at after discussion with the members of the project team. The definition is based on the NCO classification and the codes used for this are indicated in Table A.3 in Appendix A. There are a total of about 150 million households in rural areas and 57 million households in urban areas as estimated by the NSS data for 2004/05. Of these households about 4.4 million households in rural areas and 4.1 million households in urban areas report crafts as the primary occupation of the households. The primary occupation of a household is defined on the basis of the occupation of the head of the household. This accounts for about 2.9 percent of households in rural areas and 7.2 percent of households in urban areas. As per the NCO all these households are categorized as production and related workers. As per NIC these households are classified mainly within the manufacturing sector. Among the households reporting manufacturing sector as the primary classification, about 40% in rural areas and 35% in urban areas are primarily crafts households. 2.2.1 Employment Status Figure 2.2.1a (Table B2.1a) shows the distribution by employment status of crafts and total households, separately. The distribution of craft and total households in urban areas is rather similar while in rural areas the craft households are skewed towards self-employment while all households are primarily in agriculture. In urban areas a substantial proportion is categorized as regular wage households.

20
Figure 2.2.1b (Table B2.1b) shows that wood is the primary medium of craft in rural areas whereas fiber is the primary medium in urban. Fiber (wood) is the next dominant category in rural followed by metal in rural (urban) areas.
Figure 2.2.1a: Distribution of Households by Employment Status: Rural and
Urban
Distribution of Craft and Total Households by Employment Status
0
10
20
30
40
50
60
70
80
SE OthrLab Others SE CL RW &Othr
Rural Urban
Per
centa
ge S
har
e
Craft Hholds Total Hholds
SE: Self Employed, Others in rural includes self employed in agriculture, agricultural labour and others. CL: casual labour, RW: regular wage, Othr: Others.

21
Figure 2.2.1b: Distribution of Households by Employment Status and Primary Medium Used
Number of Craft Households by Employment Status
0
500
1000
1500
2000
2500
3000
SEN
A
Agr
iLab
Oth
rLab
SEA
g
Oth
ers
S.E
RW
Cas
ual
labo
ur
othe
rs
Rural Urban
Hho
lds
in th
ousa
nd
Earth Fibre Metal Wood Stone Leather Others
SE: Self Employed, Others in rural includes self employed in agriculture, agricultural labour and others. CL: casual labour, RW: regular wage, Othr: Others.
2.2.2 Social Groups Social groups refer to the caste groups which are classified as Scheduled Castes (SC), Scheduled Tribes (ST), Other Backward Classes (OC) and Other Classes (OC). Figure 2.2.2a (Table B2.1c) shows that in rural areas the scheduled castes are a little more than their average share in total households while in urban they have a nearly similar share among the crafts and total households. OBCs constitute about 53% of the craft households in rural and 45% in urban which is higher than the share of OBCs in the total households.
Figure 2.2.2b (Table B2.1d) shows that in both rural and urban areas the share of wood and fiber as the medium is similar in OBC households while SC households are primarily with wood based activities in rural areas. In urban, metal also has an equal share along with wood and fiber for all the three prominent caste groups.

22
Figure 2.2.2a: Distribution of Households by Social Groups: Rural and Urban
Distribution of Craft and Total Households by Social Group
0
10
20
30
40
50
60
ST SC OBC Others ST SC OBC Others
Rural Urban
Per
cent
age
Shar
e
Craft Hholds Total Hholds
ST: Scheduled Tribes, SC: Scheduled caste, OBC: Other Backward Class
Figure 2.2.2b Distribution of Households by Social Groups and Mediums used
Number of Craft Households by Social Group
0
500
1000
1500
2000
2500
ST SC OBC Others ST SC OBC Others
Rural Urban
Hho
lds
in t
hous
and
Earth Fibre Metal Wood Stone Leather Others
ST: Scheduled Tribes, SC: Scheduled caste, OBC: Other Backward Class.

23
2.2.3 Religious Groups NSSO classifies households on the basis of Hinduism, Islam, Christianity, Sikhism, Jainism, Buddhism, Zoroastrianism, and others. In this study Hindus and Muslims are taken as separate groups and remaining religions are grouped into others. Figure 2.2.3a (Table B2.1e) shows that in both rural and urban areas Muslim households have a higher share among the crafts households compared to their average share in the total population. In Figure 2.3b (Table B2.1f) Muslim households are largely engaged with fiber as the medium while Hindu households are engaged in wood and metal based activities as well.
Figure 2.2.3a: Distribution of Households by Religious Groups: Rural and Urban
Distribution of Craft and Total Households by Religion
0
10
20
30
40
50
60
70
80
90
Hinduism Islam Others Hinduism Islam Others
Rural Urban
Per
cent
age
Shar
e
Craft Hholds Total Hholds
Figure 2.2.3b: Distribution of Households by Religious Groups and Mediums Used
Number of Craft Households by Religion
0
500
1000
1500
2000
2500
3000
3500
4000
4500
5000
Hinduism Islam Others Hinduism Islam Others
Rural Urban
Hho
lds
in t
hous
and
Earth Fibre Metal Wood Stone Leather Others

24
2.2.4 States Figure 2.2.4 (Table B2.1g) shows that though larger states show larger craft population, there are several states which show a proportionately higher share when only the crafts households are considered compared to when all the households are considered. Based on the differences in shares, three groups of states can be formed: Group I: Share of state is higher among crafts household but lower among all households
Jammu and Kashmir, Punjab, Haryana, Delhi, Uttar Pradesh, Orissa, Gujarat, Maharashtra, and Tamil Nadu
Group II: Share of state is lower among crafts household but higher among all households Rajasthan, Bihar, Assam, Jharkhand, Chattisgarh, Madhya Pradesh, Andhra Pradesh, Karnataka.
Group III: Share of state is similar among crafts and all households All the remaining states.
Figure 2.2.4: Distribution of Households by States: Crafts and Total
(a) Households with Crafts as (b) All Households primary occupation
Manipur, 12.0
Jammu & Kashmir, 83.2
Kerala, 298.1
Lakshadweep, 0.3
Karnataka, 352.9
Gujrat, 652.4
Maharastra, 934.3
Dadra & Nagar Haveli, 7.2
Arunachal Pradesh, 0.6
Tripura, 16.6
Assam, 91.7
Chandigarh, 8.3
Jharkhand, 112.9
Chhattisgarh, 89.3 Orissa, 339.1
West Bengal, 679.9
Haryana, 296.5
Delhi, 200.3
Uttaranchal, 18.4
Tamil Nadu, 1095.0
Madhya Pradesh, 265.1
Meghalaya, 4.3
Rajasthan, 351.9
Uttar Pradesh, 1366.0
Pondicheri, 14.0
Andaman & Nicober, 0.4 Himachal Pradesh,
38.8
Punjab, 305.4
Mizoram, 1.5
Bihar, 267.0
Daman & Diu, 0.7
Andhra Pradesh, 552.9
Goa, 3.3
Sikkim, 2.2
Nagaland, 2.0Manipur, 385.1
Jammu & Kashmir, 1238.8
Kerala, 7219.7
Lakshadweep, 10.8
Karnataka, 10874.1
Gujrat, 10139.5
Maharastra, 20489.0
Dadra & Nagar Haveli, 57.2
Arunachal Pradesh, 184.5
Tripura, 742.0
Assam, 5048.4
Chandigarh, 229.6
Jharkhand, 4774.3
Chhattisgarh, 4376.8Orissa, 7930.6
West Bengal, 17583.6
Haryana, 4391.0
Delhi, 2876.4
Uttaranchal, 1702.6Tamil Nadu, 15089.3
Madhya Pradesh, 11582.6
Meghalaya, 434.7
Rajasthan, 10450.4
Uttar Pradesh, 29694.8
Pondicheri, 224.5
Andaman & Nicober, 68.4
Himachal Pradesh, 1381.7
Punjab, 4801.4
Mizoram, 141.1
Bihar, 14086.8
Daman & Diu, 35.9
Andhra Pradesh, 18531.8
Goa, 243.5
Sikkim, 119.2
Nagaland, 154.9

25
As seen in Section 2.2.1 the all India share of self-employed among crafts households is 62% for rural and 31% for urban (Table B2.1h). In rural areas the proportion is much above the average share of self-employed households while in urban areas it is marginally below the average. However, all states are not similar in this aspect. Two contrasting features appear:
(a) Among the Group I states mentioned above, with the exception of Jammu and
Kashmir, Uttar Pradesh, and Orissa the share of self-employed is usually lower than the average share of self-employed among crafts households in both rural and urban areas. This indicates that in some of these craft intensive states the household head is employed in an enterprise and earning wages either as regular wage or as casual labour or regular wage (mostly in urban).
(b) However among the groups I states, the share of craft households within self-employed is usually higher than the average shares for both rural and urban areas. It must be noted that many of these states have a lower share of non-agriculture self-employed households among rural households (share of agriculture labour households is highest) as well as self-employed among all urban households (share of wage labour households comprising of casual labour and regular wage households is highest). Given this lower share of self-employment (in non-agriculture in rural areas) the share of crafts households within such households tends to be somewhat higher. That is the states that are more wage labour intensive the crafts household have a prominence among the self-employed.
2.3 Individuals in Crafts Sector: CCI Definition This section reports the results on number of those engaged in economic activities based on the CCI definition given in Table A.3. About 16.7 million people are in craft based activities. Employment in textiles or fiber based activities and wood based activities is about 36-37% of the total craft related population amounting to above 12 million totally (Table B2.2a). These two activities are male dominated with the wood based activity having a higher share of rural men and while for fiber urban men have a higher share. Metal is the third largest category with about 2.5 million people, constituting 15% of the total crafts population with a larger urban presence than rural. The medium of earth is rural based constituting 6.6% of the total population while leather has a share of 3.3% and has a larger urban presence. Figure 2.3.1 (and Table B2.2a) shows that within the crafts population, rural males are the dominant category followed by urban males and

26
then by rural females and urban females. In contrast to this the total working population, shows that after rural males the next prominent category is rural females followed by urban males and females.
Figure 2.3.1: Distribution of Persons Across Sectors and Gender Each Within Crafts Sector and Total Working Population, CCI Definition
0
10
20
30
40
50
60
R.M R.F U.M U.F
Per
centa
ge S
har
es
Craft Persons Total Working Persons
RM-Rural males, RF-Rural Females, UM-Urban Males, UF-Urban Females.
The gender composition within mediums reflects some interesting aspects as
well. Women constitute about 46% in rural areas among fiber based activities while their share is only about 28% in urban; wood based activities also show larger proportion in rural than urban (Figure 2.3.2 and Table B2.2a).

27
Figure 2.3.2: Number of Persons (lakh) Across Mediums and Sector and Gender Composition Within Each of Them, CCI Definition
0
10
20
30
40
50
60
70
Earth Fibre Metal Wood Stone Leather Others
Medium of craft
Lak
h p
erso
ns
Rural Males Rural Females Urban Males Urban Females
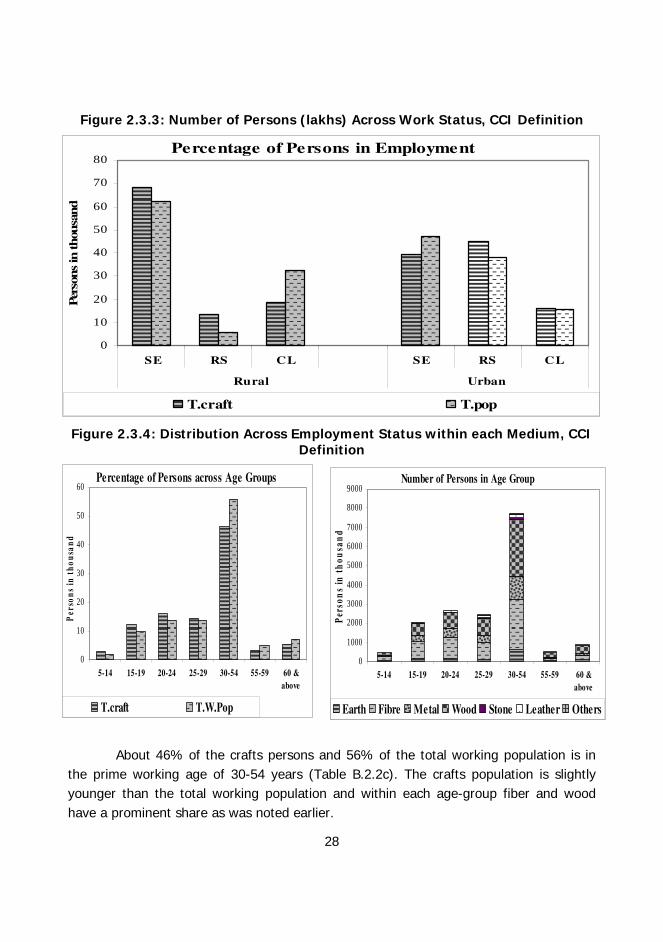
Figure 2.3.3 (Table B2.2b) shows that crafts persons are largely self-employed
compared to the total population in rural areas. In urban areas there is marginally higher share among the regular salaried compared to the self-employed. Within a given medium self-employed is the dominant group in rural areas whereas in fiber, metal and wood regular salaried have a similar share as the self-employed (Figure 2.3.4).
28
Figure 2.3.3: Number of Persons (lakhs) Across Work Status, CCI Definition
Percentage of Persons in Employment
0
10
20
30
40
50
60
70
80
SE RS CL SE RS CL
Rural Urban
Per
sons
in thou
sand
T.craft T.pop
Figure 2.3.4: Distribution Across Employment Status within each Medium, CCI Definition
About 46% of the crafts persons and 56% of the total working population is in the prime working age of 30-54 years (Table B.2.2c). The crafts population is slightly younger than the total working population and within each age-group fiber and wood have a prominent share as was noted earlier.
Number of Persons in Age Group
0
1000
2000
3000
4000
5000
6000
7000
8000
9000
5-14 15-19 20-24 25-29 30-54 55-59 60 &above
Per
son
s in
th
ousa
nd
Earth Fibre Metal Wood Stone Leather Others
Percentage of Persons across Age Groups
0
10
20
30
40
50
60
5-14 15-19 20-24 25-29 30-54 55-59 60 &above
Per
sons
in t
hous
and
T.craft T.W.Pop
29
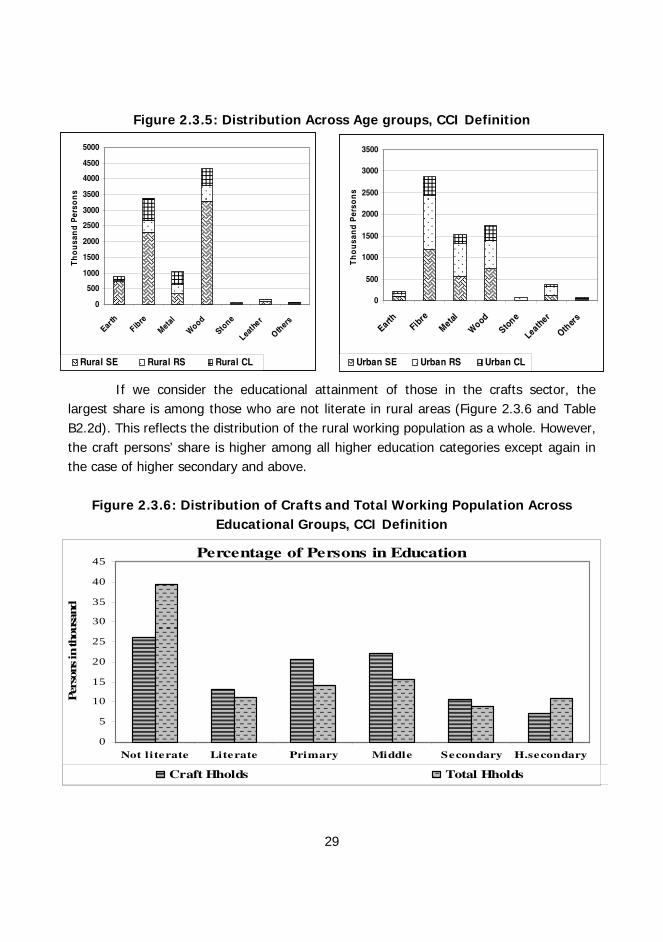
Figure 2.3.5: Distribution Across Age groups, CCI Definition
If we consider the educational attainment of those in the crafts sector, the largest share is among those who are not literate in rural areas (Figure 2.3.6 and Table B2.2d). This reflects the distribution of the rural working population as a whole. However, the craft persons’ share is higher among all higher education categories except again in the case of higher secondary and above.
Figure 2.3.6: Distribution of Crafts and Total Working Population Across
Educational Groups, CCI Definition
Percentage of Persons in Education
0
5
10
15
20
25
30
35
40
45
Not literate Literate Primary Middle Secondary H.secondary
Per
sons
in th
ousa
nd
Craft Hholds Total Hholds
0
500
1000
1500
2000
2500
3000
3500
4000
4500
5000
Earth
Fibre
Metal
Wood
Stone
Leath
er
Other
s
Th
ou
san
d P
erso
ns
Rural SE Rural RS Rural CL
0
500
1000
1500
2000
2500
3000
3500
EarthFib
reMetal
Wood
Stone
Leather
Other
s
Th
ou
san
d P
erso
ns
Urban SE Urban RS Urban CL

30
As earth related activities are primarily rural these people are mostly not literate. Fibre, Wood and metal have similar shares within each education group in both rural and urban areas as shown in Figure 2.3.7 (Table B2.2d).
Figure 2.3.7: Distribution of Mediums used within Education Groups: CCI Definition
Number of Persons in Education
0
1000
2000
3000
4000
5000
6000
Notliterate
Literate Primary Middle Secondary Higersecondary
Per
sons
in thou
sand
Earth Fibre Metal Wood Stone Leather Others
Muslims have a higher than average share among the crafts persons and so are the other backward classes (Figures 2.3.8 and 2.3.9 respectively). About 10 million Hindus and 1.9 million Muslims are involved in crafts activity in rural areas while in urban they are respectively 6.7 million and 2.1 million (Table B2.2e).
Figure 2.3.8: Number and Distribution of Crafts Persons Across Religious
Groups: CCI Definition
Number of Persons acoss Religious Groups
0
2000
4000
6000
8000
10000
12000
14000
16000
Hindus Muslims Christians Sikhs O thers
Per
sons
in t
hous
and
Earth Fibre Metal Wood Stone Leather O
Distribution across Religious Groups
0
10
20
30
40
50
60
70
80
90
Hindus Muslims Christians Sikhs O thers
Per
sons
in t
hous
and
T.craft T.W.pop

31
Figure 2.3.9: Number and Distribution of Crafts Persons Across Social Groups: CCI Definition
As mentioned earlier, a state is defined as craft intensive if its share in the crafts population is higher than its share in the total working population. Figure 2.3.10 shows that Delhi, Haryana, Punjab Kerala, Orissa, Gujarat, Tamil Nadu, West Bengal and Uttar Pradesh are among these craft intensive states.
Number of Persons across Social Group
0
1000
2000
3000
4000
5000
6000
7000
8000
9000
ST SC O BC O thers
Per
sons
in t
hous
and
Earth Fibre Metal Wood Stone Leather
Distribuition across Social Group
0
10
2 0
3 0
4 0
50
6 0
ST SC O BC O thers
Per
sons
in t
hous
and
Craft Hholds Tota

32
Figure 2.3.10: Distribution of Crafts Population and Total Population Across States: CCI Definition
0.00
0.05
0.10
0.15
0.20
0.25
0.30
0.35
Laksha
dweep
Dam
an & Diu
And
aman
& Nicob
e
Dad
ra & Nag
ar Hav
e
Sikk
im
Cha
ndigarh
Mizoram
Pond
iche
ri
Aruna
chal Prade
s
Nag
alan
d
Goa
Man
ipur
Meg
halaya
Tripura
Sha
re of p
opulation (%
)
T.Craft T.w.Pop
0123456789
10
Jammu & Kashm
i
Him
acha
l Prade
sh
Utta
ranc
hal
Delhi
Haryana
Assam
Jharkh
and
Punjab
Chh
attis
garh
Kerala
Oris
sa
Gujrat
Bihar
Sha
re of p
opulation (%
)
T.Craft T.w.Pop
02468
101214161820
Karna
taka
Rajasthan
Mad
hya Prad
esh
Tamil Na
du
Wes
t Ben
gal
And
hra Pa
rdesh
Mah
aras
tra
Utta
r Prade
sh
Sha
re of p
opulation (%
)
T.Craft T.w.Pop

33
Table 2.3.1: Total Craft Population, Proportion of Women, Urban and Share and Distribution of Crafts Population Across States: CCI Definition
States Total Craft
Population (‘000
persons)
Proportion of Urban in total Crafts (%)
Proportion of Women
in total Crafts (%)
Proportion of Crafts
Population in each State
(%)
Distribution of Crafts
Population Across
States (%)
Distribution of Working Population
Across States (%)
Jammu & Kashmir 176 28.8 29.7 8.1 1.0 0.5 Himachal Pradesh 61 13.4 24.1 1.9 0.4 0.8 Punjab 395 65.5 8.2 4.0 2.4 2.3 Chandigarh 9 72.6 0.2 2.9 0.1 0.1 Uttaranchal 31 36.5 7.4 0.9 0.2 0.8 Haryana 386 50.3 7.3 4.6 2.3 2.0 Delhi 256 98.9 6.6 6.7 1.5 0.9 Rajasthan 714 42.4 19.5 3.0 4.3 5.7 Uttar Pradesh 3110 35.7 28.1 5.5 18.5 13.7 Bihar 469 11.2 15.0 2.1 2.8 5.3 Sikkim 2 33.6 0.0 1.1 0.0 0.1 Arunachal Pradesh 2 7.9 65.6 0.4 0.0 0.1 Nagaland 22 12.8 59.7 6.4 0.1 0.1 Manipur 37 32.7 65.4 4.9 0.2 0.2 Mizoram 3 59.7 12.3 1.0 0.0 0.1 Tripura 28 8.4 14.5 2.3 0.2 0.3 Meghalaya 30 5.1 52.7 3.0 0.2 0.2 Assam 157 12.2 24.8 1.7 0.9 2.3 West Bengal 1367 34.9 29.5 4.6 8.1 7.1 Jharkhand 245 8.0 33.9 2.6 1.5 2.3 Orissa 933 5.4 45.9 5.8 5.6 3.9 Chhattisgarh 188 22.9 30.8 1.8 1.1 2.5 Madhya Pradesh 581 42.7 27.8 2.3 3.5 6.1 Gujarat 1519 56.0 13.6 7.3 9.0 5.0 Daman & Diu 1 34.2 0.0 1.6 0.0 0.0 Dadra & Nagar Haveli
10 0.2 8.0 10.8 0.1 0.0
Maharashtra 1525 67.8 13.2 3.6 9.1 10.1 Andhra Pradesh 1208 36.0 36.5 3.4 7.2 8.5 Karnataka 620 49.3 18.6 2.6 3.7 5.7 Goa 6 57.4 9.9 1.5 0.0 0.1 Lakshadweep 0 0.0 0.0 0.2 0.0 0.0 Kerala 493 25.5 43.0 3.8 2.9 3.1 Tamil Nadu 2188 44.3 37.2 8.6 13.0 6.1 Pondicherry 20 62.8 19.4 6.1 0.1 0.1 Andaman & Nicobar
1 85.0 38.9 0.8 0.0 0.0
Total 16795 40.9 26.6 4.0 100.0 100.0

34
2.4 Individuals In Crafts Sector: DC-H DEFINITION About 9.2 million people are engaged in the crafts sector as per this definition given in Table A.2. Though the development commissioner handicrafts deals largely with metalware, stone carvings, zari, woodwork and so on textile related activities like handloom embroidery, hand printed cloth and related handloom activities are also included here. Overall once again fiber as a medium dominates. A clear difference when compared to the larger definition is that now the share of urban is lower than rural. About 3.4 million people are in urban areas and 5.7 million in rural areas with about 41% of the rural crafts population consisting of women while they constitute about 25% in the urban areas as shown in Figure 2.4.1 (Table B2.3a). Women are mainly associated with fiber and wood related activities in rural areas while their presence is mainly in fiber in urban. Men are also largely engaged in fiber based activities but metal work constitutes a significant group; in rural areas men involved with earth based activities are marginally higher than metal.
Figure 2.4.1: Distribution of Crafts Population: DC-H Definition
0
10
20
30
40
50
60
70
80
90
100
Men
Wom
en
Tot
al
Men
Wom
en
Tot
al
Gra
nd
Tot
al
Rural Urban
Per
sons
(lak
hs)
Others
Leather
Stone
Wood
Metal
Fibre
Earth
Other features worth noting are (Tables B2.3a,b): • Most of them are self-employed,

35
• About 3.8 % of the craft population are children (age group of 5-14) years while they constitute only 1.9% among the total working population,
• They constitute a higher share among the younger age groups • They are largely Hindus (78%) or Muslims (20%) • About 53% belong to the other backward classes and 19% to the scheduled
castes • Nearly one-third are not literate
These features for the overall craft sector of course vary across medium. For instance, the proportion of scheduled tribe is much higher among wood based crafts persons while scheduled castes constitute the majority among leather based crafts persons. Further those with earth or wood as the medium are less educated compared to those with metal or fiber.
Figure 2.4.2: Distribution of Crafts Persons Across Employment Status (a) Rural (b) Urban
05
101520253035404550
Per
sons
(lak
hs)
Earth
Fibre
Metal
Wood
Stone
Leath
er
Other
s
Medium
S.E R.S C.L others
0
5
10
15
20
25
30
35
40
45
pers
ons
(lakh
s)
Earth
Fibre
Metal
Wood
Stone
Leath
er
Other
s
Medium
S.E R.S C.L others

36
The 9.2 million working population in the crafts sector constitutes about 2.3 % of the total working population (Table 2.4.1). Jammu and Kashmir, Delhi, Uttar Pradesh, Nagaland, Manipur, Meghalaya, West Bengal, Orissa, Gujarat, Dadra and Nagar Haveli, Andhra Pradesh, Tamil Nadu and Pondicherry show a higher than all India average share of crafts population. About 20% of the crafts population belongs to Uttar Pradesh followed by Tamil Nadu which has 13.5% of the crafts population. The other states contributing a significant share are Gujarat, West Bengal and Andhra Pradesh. Table 2.4.1: Crafts Population and its Share Across States, Share of Urban and
Women in each State: DCH Definition
States Total Craft Population (‘000 persons)
Proportion of Urban in total Crafts
(%)
Proportion of Women
in total Crafts (%)
Proportion of Crafts
Population in each
State (%)
Distribution of Crafts
Population Across
States (%)
Distribution of Working Population
Across States (%)
Jammu & Kashmir
144.23 27.1 36.1 6.1 1.57 0.56
Himachal Pradesh
15.08 3.8 62.1 0.5 0.16 0.78
Punjab 166.97 77.7 16.3 1.6 1.82 2.44 Chandigarh 0.99 24.4 0.0 0.3 0.01 0.08 Uttaranchal 11.83 5.0 18.6 0.3 0.13 0.84 Haryana 87.83 41.4 20.3 1.0 0.96 2.12 Delhi 112.50 100.0 7.4 2.8 1.22 0.97 Rajasthan 307.45 40.9 33.8 1.3 3.35 5.83 Uttar Pradesh 1899.90 35.8 40.0 3.2 20.68 14.41 Bihar 182.66 5.8 24.5 0.8 1.99 5.41 Sikkim 0.25 0.0 0.0 0.1 0.00 0.05 Arunachal Pradesh
0.48 0.0 81.0 0.1 0.01 0.09
Nagaland 16.10 9.1 82.5 4.3 0.18 0.09 Manipur 28.97 31.3 82.4 3.6 0.32 0.19 Mizoram 0.32 100.0 100.0 0.1 0.00 0.08 Tripura 8.12 8.1 31.2 0.7 0.09 0.29 Meghalaya 22.17 0.2 72.4 2.1 0.24 0.25 Assam 79.99 4.4 45.7 0.8 0.87 2.32 West Bengal 865.01 34.1 37.7 2.8 9.42 7.47 Jharkhand 176.89 2.7 42.9 1.8 1.93 2.32 Orissa 457.88 3.5 52.9 2.7 4.98 4.08 Chhattisgarh 111.79 10.9 43.5 1.1 1.22 2.54

37
(Contind … Table 2.4.1) Madhya Pradesh
350.03 31.6 39.5 1.3 3.81 6.28
Gujarat 928.74 50.1 15.9 4.1 10.11 5.37 Daman & Diu 0.47 63.0 0.0 0.9 0.01 0.01 Dadra & Nagar Haveli
2.88 0.0 1.9 2.8 0.03 0.02
Maharashtra 547.06 77.0 13.2 1.3 5.96 10.43 Andhra Pradesh
814.95 32.7 47.7 2.2 8.87 8.81
Karnataka 313.98 45.5 30.5 1.3 3.42 5.80 Goa 2.29 100.0 0.0 0.6 0.02 0.10 Lakshadweep 0.06 0.0 0.0 0.2 0.00 0.01 Kerala 236.84 30.8 57.1 1.7 2.58 3.25 Tamil Nadu 1283.32 39.0 36.1 4.7 13.97 6.61 Pondicherry 8.05 73.0 12.4 2.3 0.09 0.08 Andaman & Nicobar
0.06 0.0 0.0 0.1 0.00 0.02
Total 9186.13 41.1 35.4 2.2 100.0 100.0

38
2.5 Individuals in Crafts Sector: LR Definition As mentioned in Chapter 1 Liebl and Roy (2003) assessed the number of people working in the crafts sector using the unorganized manufacturing sector data of the NSSO. This definition is based on the industrial classification as shown in Table A.4 in the appendix which is unlike the earlier definitions based on occupational classification. In this study the same definition is used to estimate the crafts population using the employment-unemployment survey of the NSSO for the year 2004-05. Compared to the DC-H definition the total population here is about 2 million more that is, 11.5 million. Compared to the DC-H and CCI definition a lot more of the leather based products are included here. Since they used an earlier version of the industrial classification (NIC-1987) many of these activities in the current industrial classification (NIC-2004) are indicated under machine-made. As seen in Figure 2.5.1 (Table B.2.4a), cotton and silk textile dominate constituting about 35% of the total employment. Out of the total employment of 4 million in the textile (non-khadi) sector about 45% are in rural and 55% in urban. In rural wood based employment is about 1.5 million and women also form a substantial proportion. In urban, metal and leather activities involve about 0.8-0.9 million people.
Figure 2.5.1: Crafts Persons in Rural and Urban: LR Definition
0
20
40
60
80
100
120
140
Men
Wom
en
Tota
l
Men
Wom
en
Tota
l
Gra
nd
Tota
l
Rural Urban
Lakh
per
sons
Khadi Cotton&silk textil Zari
Carpets Earthware Metal
Wood Leather

39
Figure 2.5.2 (Table B2.4b) shows the share of urban population and women’s population in each work status which defines the primary time spent in an economic activity. Urban and rural populations have an equal share among those who are engaged in craft activities in the principal status alone. This is different from the total working population. Among those who are only in the subsidiary status, women have a substantial share and this is similar in both craft and total working population. Further as Table B2.4b shows that about 2 million people (17 percent of the total crafts population) are engaged in both principal and subsidiary activities within crafts sector. They could be in the primary category in one craft activity and subsidiary in another. Once again women’s share is higher among this group.
Figure 2.5.2: Distribution Across Employment Status in Each Craft
Group: LR Definition
0
10
20
30
40
50
60
70
80
90
100
Urban Share Women's Share Urban Share Women's Share
Crafts Total
Per
cent
age
Principal only Subsidiary only Both Principal and Subsidiary
40
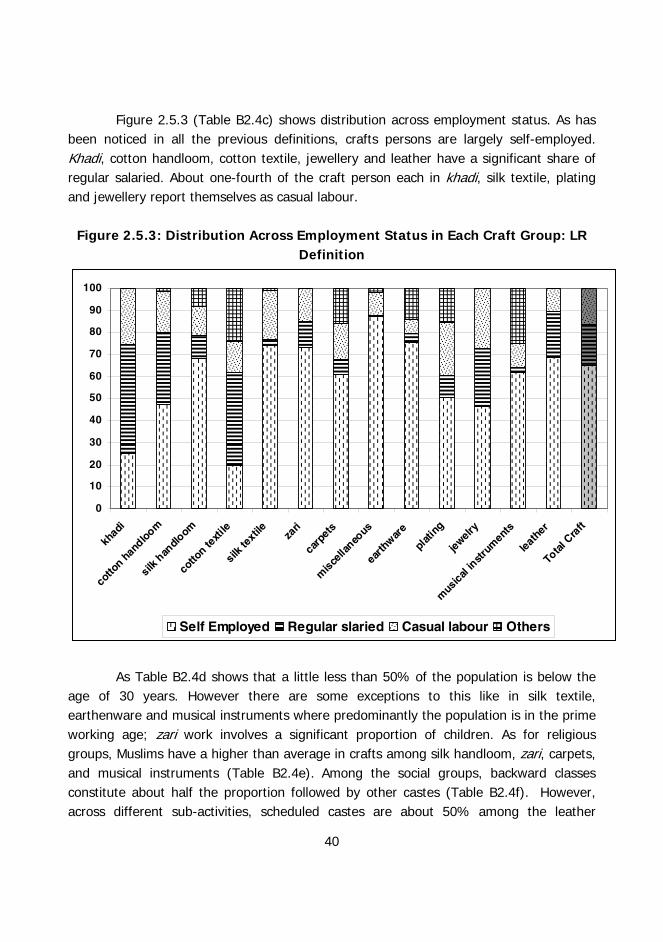
Figure 2.5.3 (Table B2.4c) shows distribution across employment status. As has been noticed in all the previous definitions, crafts persons are largely self-employed. Khadi, cotton handloom, cotton textile, jewellery and leather have a significant share of regular salaried. About one-fourth of the craft person each in khadi, silk textile, plating and jewellery report themselves as casual labour.
Figure 2.5.3: Distribution Across Employment Status in Each Craft Group: LR
Definition
0
10
20
30
40
50
60
70
80
90
100
khadi
cotto
n handloom
silk h
andlo
om
cotto
n texti
le
silk t
extile za
ri
carpe
ts
misce
llaneo
us
earth
ware
platin
g
jewelr
y
mus
ical in
strum
ents
leath
er
Total
Cra
ft
Self Employed Regular slaried Casual labour Others
As Table B2.4d shows that a little less than 50% of the population is below the
age of 30 years. However there are some exceptions to this like in silk textile, earthenware and musical instruments where predominantly the population is in the prime working age; zari work involves a significant proportion of children. As for religious groups, Muslims have a higher than average in crafts among silk handloom, zari, carpets, and musical instruments (Table B2.4e). Among the social groups, backward classes constitute about half the proportion followed by other castes (Table B2.4f). However, across different sub-activities, scheduled castes are about 50% among the leather

41
workers. They also have a higher than average share in khadi, carpets, musical instruments, and miscellaneous crafts. A little less than a third of the crafts persons are not literate and are higher among zari, carpet and earthenware (Table B2.4g). Khadi, cotton textile, silk textile, plating, jewellery and leather work involve a higher than average proportion of the higher secondary and above education.
By this definition about 3% of the population is involved in crafts activities (Table
B2.4h). Among these Jammu & Kashmir, Delhi, Uttar Pradesh, Nagaland, Manipur, West Bengal, Orissa, Gujarat, Tamil Nadu and Pondicherry have a higher than average share. In terms of the distribution of the crafts population across states, Uttar Pradesh has the highest share of about 17% followed by Tamil Nadu (16%), Gujarat (12%) and West Bengal (10%); these states make a higher contribution to the crafts population compared to the total population. In this definition women constitute about 31% their share is substantially higher in Nagaland, Manipur, Mizoram, and moderately higher in Assam, Jharkhand, Orissa, Chattisgarh and Andhra Pradesh. About 44% of the urban population is involved in these activities with Punjab, Haryana, Gujarat, Maharashtra, Karnataka and Pondicherry having a higher than average share among the urban crafts population.


43
Chapter 3
ENUMERATING CRAFTS PERSONS: SOME METHODLOGICAL ISSUES
3.1 Estimations Based on Census, 2001 The analysis in the previous chapter was based on the NSSO data using different definitions to estimate the population involved in crafts activities. Census data also provides information across 4-digit occupational codes based on NCO-2004. These estimates using the CCI definition have been obtained and illustrative maps are drawn to show the geographical variations.
Figure 3.1: Distribution of Main Workers across Districts of India, Census 2001: CCI definition
For (a) Crafts Population (b) Working Population
Though by and large regions with higher/lower working population have a
large/smaller population of crafts persons but exceptions are also there as noted from Figure 3.1a. For instance, western most districts of Gujarat have very low population but have a fairly significant number of crafts persons as seen by the shades of the colour. Several districts in central India show a low population but once again seem to be crafts intensive. Further, barring a few districts in western and southern India, most of them have a high concentration of crafts persons.

44
Figure 3.2: Distribution of Crafts Persons Across Districts of India: Urban and Women, Census 2001, CCI Definition
(a) Urban (b) Females
Though the distribution of the urban and women crafts persons appears similar, there are several exceptions with districts of Gujarat being more uniform in urban population but show more variation in the female crafts persons. On the other hand central-eastern districts are less urbanised while the concentration of women crafts persons is much higher. Similarly some districts in North-East have a higher concentration of female population and are less urbanised.
Figure 3.3 shows that distribution of crafts population based on the four
prominent mediums used. Earth has a large concentration in Uttar Pradesh and Madhya Pradesh; fiber in West Bengal, Uttar Pradesh and Tami Nadu; metal in Uttar Pradesh, Gujarat, Maharashtra and Tamil Nadu and wood in Uttar Pradesh, Maharashtra, Orissa and Tamil Nadu. The broad state level distribution of crafts from the census seems to agree with the distribution based on NSSO estimates in the previous chapter.

45
Figure 3.3: Distribution of Crafts Person Based on Different Medium Across States of India: Census 2001, CCI Definition

46
3.2 Comparisons Across Different Approaches and Databases The estimates based on different approaches are compared in this section and a few points worth noting are as follows: • In table 3.1 the numbers across four different approaches are compared. The
CCI-census definition indicates the highest estimates followed by CCI-NSSO estimates. The census figures are expected to be higher as within the medium of earth and fiber there are several non-crafts occupations. These were identified using the industrial classification in the NSSO data and were weeded out from the estimates as explained in chapter1. This has not been possible with the census data as unit level data is not provided and we have aggregates either over occupation groups (codes) or over industrial groups (codes) separately.
• Census data is however processed only for main workers while NSSO data is estimated based on both principal (main) and subsidiary (marginal) status workers and one would have expected that thus difference may have been bridged the gap. Perhaps the subsidiary workers are still smaller in number and hence the discrepancy remains.
• The census estimates based on SRUTI definition is 16.4 million (see chapter 1) people while the CCI definition gives a value of 31 million (Table 3.1).
• Estimates from the census data based on DC-H definition or LR definition could also help in further understanding the possible reasons for gaps between census and NSSO estimates.
• The NSSO estimates based on CCI definition gives the largest estimates while that based on DC-H and LR are close enough. This is expected because CCI definition is much broader particularly for fiber where tailors have also been included as was done in Satyanand and Singh (1995).
• The DC-H estimates are based on the occupational classification using the DC-H definition while LR estimates are based on the industrial classification using largely the DC-H definition. Except for khadi based textile the two are more or less similar.
• Table B2.5a in Appendix compares the share of crafts based working population with total working population. In this case CCI-census and CCI-NSSO show similar all India average shares but there are several differences across states while the DCH-NSSO and LR-NSSO are close enough at the all India level and also for many states.

47
Table 3.1: Crafts Population Based on Different Definitions, NSSO and Census (in thousands)
States CCI-census CCI-NSSO DC-H-NSSO LR-NSSO Jammu & Kashmir 244.74 175.79 144.23 146.34 Himachal Pradesh 144.38 61.10 15.08 18.26 Punjab 927.20 395.35 166.97 152.96 Chandigarh 51.35 9.07 0.99 3.95 Uttaranchal 184.90 31.19 11.83 5.67 Haryana 660.14 385.79 87.83 154.82 Delhi 888.30 255.79 112.50 171.34 Rajasthan 1729.65 714.12 307.45 637.92 Uttar Pradesh 3578.05 3109.67 1899.90 1922.41 Bihar 989.60 469.02 182.66 219.85 Sikkim 12.42 2.33 0.25 0.33 Arunachal Pradesh 14.13 1.62 0.48 1.79 Nagaland 16.57 22.43 16.10 15.74 Manipur 59.49 37.10 28.97 25.64 Mizoram 14.66 3.27 0.32 0.50 Tripura 64.75 27.52 8.12 10.97 Meghalaya 28.24 30.44 22.17 27.12 Assam 414.27 156.98 79.99 88.11 West Bengal 3159.43 1367.48 865.01 1199.69 Jharkhand 568.55 245.09 176.89 183.91 Orissa 726.50 933.37 457.88 564.95 Chhattisgarh 372.40 187.59 111.79 97.18 Madhya Pradesh 1136.06 581.08 350.03 273.53 Gujarat 2555.74 1519.41 928.74 1389.80 Daman & Diu 25.11 0.87 0.47 0.47 Dadra & Nagar Haveli 21.34 10.04 2.88 1.20 Maharashtra 3461.14 1525.44 547.06 872.86 Andhra Pradesh 2382.95 1208.27 814.95 989.19 Karnataka 1760.03 620.42 313.98 470.02 Goa 58.91 5.80 2.29 2.29 Lakshadweep 0.06 0.06 0.06 Kerala 1371.88 492.77 236.84 198.66 Tamil Nadu 3417.80 2187.78 1283.32 1657.56 Pondicherry 45.95 19.87 8.05 13.47 All India 31098.72 16794.73 9186.13 11518.58 Note: Census data is for the year 2001 and other data are for 2004/05.

48
3.3 Production for Home Consumption NSSO has a separate questionnaire that asks women regarding other activities that they perform apart from household chores that leads to production of goods that can be otherwise marketed or would have to be purchased from the market. The aim of this exercise is to understand the contribution of women to several other productive activities that are not accounted for as they are not valued in the market.
This study has estimated the number of such women for all India. The only problem with this information is that the different activities are clubbed into only two groups, (a) mat and basket weavers and (b) weavers etc.
Table 3.2: Craft Items Made by Women for Home Consumption, 2004/05 (in lakhs)
Whether involved in Weaving etc.
Mat and Basket weaving Yes No
Raw material from home
Raw material from market
Yes 11.2 13.7 326.0 No 11.8 15.0 385.0
Note: The women enumerated here are not counted in the earlier estimations as they are not engaged in economically gainful activities.
There are a total of 37.7 million10 women in total who are engaged in this activity
for home consumption, with several of them involved in both basket weaving and weaving cloth etc. This number is much higher than the estimates obtained for the crafts population as a whole. As the category denoted by “weaving etc.” is not clearly spelt out it may be that some activities included here are not actually handicraft but have some similarity. This aspect has to be probed further including discussions with the data collection agency. 3.4 Way Forward The estimates range from as low as 9.2 million to a high of 31 million with an intermediate value of 16.7 million. These varying estimates are due to the differences in database and definitions used to identify a crafts person. On the one hand 31 million may be an overestimate while 9.5 million may be a lower estimate but is 16.7 million a close
10 This is obtained by adding all the numbers in the table excluding the number from the ‘No-No’
cell.

49
enough approximation? This would be difficult to ascertain as there are no other ways and approaches to cross check the estimates.
The census data on the one hand has the strength of covering the geographic areas in a better manner but one is constrained by the manner in which the data is available for analysis. The occupational classification cannot be overlaid on the industrial classification to understand the nature of activities performed by the crafts persons. Further, it does not include marginal workers and also does not provide information for those involved in home based activities. The NSSO on the other hand is a sample based methodology but the information provided by the sampling inflation factors (multipliers) allows one to obtain population estimates which are used as weights to arrive at the overall estimates. The NSSO has the advantage of providing several other details about the socio-economic conditions of the crafts persons so is a useful database to assess aspects like these. Both occupational classification and industrial classification can be used to arrive at the estimates. Apart from this, Economic Census also provides information on enterprises and could be used to assess the number of people involved in producing crafts products. Here the individuals are enumerated based on the production activity and hence the classification is based only on the industrial activities.
In order to have a periodic assessment of the crafts population secondary databases are most suitable. The challenge for secondary databases is the identification of the occupation or the industrial category. Both these classifications envisage a very fine level of disaggregation that can identify the crafts based item/activity and whether it is by hand or by machine. However, when the data is finally collated by the census or NSSO the groups are not reported either due to administrative difficulties or due to the time and effort required to assess the exact code for an individual during the time of the census/survey. Some suggestions are put forward to enable a better assessment of the enumeration of crafts persons in India.
The first step would be to identify fine classifications of craft activities using a primary survey and the experts. This classification could be used to overlay on the official classifications used by the government agencies. This would enable to get the occupational/industrial groups that are associated with craft activities.
The census data could be used to get information in geographic detail going up to the village level but the data for NIC and NCO classification is released only up to the district level. Efforts could be made by the officials in the office of development

50
commissioners of handicrafts and handlooms to systematically work with the census officials to arrive at these estimates. The classification for marginal workers could also be obtained along with the main workers.
Similarly the quinquennial (once in five years) large sample surveys on employment and unemployment conducted by the NSSO can be used periodically to get estimates. The NSSO has a more detailed set of questionnaires that allow for a fine classification of full-time and part-time work as well as those for home consumption. The NSSO also has details on employment status, enterprise type and the income/wage earned. This will provide a comparative assessment across regions and over time more frequently. NSSO also conducts yearly surveys which are of smaller sample size but can be used to get broad estimates which will give a time profile.
The economic census is also a useful database which will provide establishment related information. The information is provided only for four-digit industrial classification and at the district levels.
Using the industrial classification for craft activities, the economic census based estimates could be compared with the NSSO estimates for a few common years and assessed for the gaps. This may also enable one to understand which gives a “closer” estimate.
The official departments could work in coordination to bring out a special report based on census data. The NSSO schedule could also be modified to reflect the craft activities more effectively so that surveys can be conducted periodically as it is done on special topics like common property, health, education etc. by NSSO.
It is difficult to conduct a census of the population based on a particular economic activity. This is because census which means enumerating all persons involved but to assess who is a crafts person, either all the households have to be enumerated or all the establishments have to interviewed. Since these are already done as part of the decadal population census or the economic census once in five years therefore the closest that one can get to a census like methodology are these databases.
NCAER conducted a ‘census’ in the early 1990s. However one understands that this was based on census of clusters of select craft activities and hence was not truly a ‘census’.
Detailed surveys of craft activities are essential to assess languishing crafts or finer variants of the crafts which cannot be captured through secondary surveys.

51
Oral histories have to be recorded from time to time and skills have to be safeguarded and developed which can happen only in a decentralized manner and district or ward/panchayat level officials could be involved in a more systematic way for data collection and profiling.
The Planning Commission indicates that the small enterprises provide the next
largest employment next only to agriculture. Among the tiny and small enterprises handicrafts and handlooms form a significant part. Handicrafts and handlooms are not seasonal activities though they are dependent on natural resources. This gives the scope for income smoothening while nurturing the heritage. As the value of exports indicates that there is a lot of value addition in the commodities produced in the international markets. More could be done to promote them in the domestic markets as well. In order to create good living conditions and to preserve/promote the crafts, assessing the numbers involved and their well-being is very essential. One hopes that this study will be in a position to make a beginning for a systematic and periodic enumeration of the crafts persons in India.

52
REFERENCES
Government of India, (1989), ‘Report of the Task Force on Handicrafts for the VIII Fiver Year Plan’, Office of the Development Commissioner of Handicrafts, Ministry of Textiles, Government of India: New Delhi.
Heather, Margaret-Louise Miller (2006), Archaeological Approaches to Technology Academic Publishers/Elsevier.
Jain, L.C. (1986), ‘A Heritage to Keep: Handicrafts Industry, 1955-1985’, Economic and Political Weekly, Vol.21 (20), May 17, pp.873-887.
Liebl, M. and T. Roy (2003), ‘Handmade in India: Preliminary Analysis of Crafts Producers and Crafts Production in India’, Economic and Political Weekly, Vol.38 (51/52), pp.5366-5376.
Satyanand and Singh (1995), ‘India’s Artisans: A Status Report’, SRUTI (Society for Rural, Urban and Tribal Initiatives): New Delhi.

53
APPENDIX A
DEFINITIONS OF CRAFTS PERSONS Table A.1: NCO Codes for Craft Groups: SRUTI Definition
Artisanal Group Census-1961
Census-1981 and NSSO-04/05
Census-2001
3-digit
Census-2001
4-digit (1) (2) (3) (4) (5) 1. CANE AND BAMBOO WORKERS A Basketry Weavers,
Brush Makers and Related Workers
850 942 742 7424
2. JEWELLERS A Jewellery and
Precision Metal Workers
741/742 800/881/885/883/889
731 7313
3. LEATHER WORKERS A Pelt Dressers,
Tanners and Fell Mongers
853 760/761/762/769 744 7441
B Shoe Makers and Related Workers
720/721/722/729
800/801/802/803/ 809
744 7442
4. METAL WORKERS A Metal Processor 730/731/73
2/734/735/739/758
720/721/722/723/724/725/726/727/72
8/729
812 Largely in the industrial activity
B Blacksmith, Tool Makers and Related Trades Workers
733 831 722 7221-29
C Welders, Sheet metal workers, tool-workers
750/751/754/756/757/759
830/732/833/835/836/839/870/872/873/874/879
721 7211-14
5. POTTERS A Potters 811 892 732 7321-29 6. TAILORS A Tailors, dress
makers 710 791 743 7433
B Upholsters 713 796 743 7437 C Embroiders,
darners 715 795 743 7436
D Miscellaneous Workers
714/719 790/794/799

54
(Contd … Table A.1)
Artisanal Group Census-1961
Census-1981 and NSSO-04/05
Census-2001
3-digit
Census-2001
4-digit 7. TEXTILE WORKERS A Fibre preparers,
spinners, winders, warpers, sizers
700/701/702/703
751/752/753 743 7431
B Weavers 704 755 743 7432 C Carpet Makers 708 756 Along with 7431 and
7432 D Bleachers 706 758 8264/7346 E Miscellaneous
Workers 705/709 750/754/759
8. WOOD WORKERS A Carpenters 770 811 712 7124 B Cabinet makers 775 812 742 7422 C Car, boat, ship
builders 774/771 814/816 712 7124
D Miscellaneous Workers
773/772/779
810/813/815/819
Source: This table is reproduced from Table 2 (pp.162) of the SRUTI report but columns (4) and (5) have been added by the author based on NCO-2004.
Table A.2: Occupational Codes for Crafts: DC-H Definition
Craft Activities
NCO-68 codes as used in NSS-04/05
NCO-2004 codes as used in 2001 Census
Handicraft/craft# Non-craft# Earth 891-899 7321-7324/7329 8131/8139/8153 Fibre 751/752/754-759/
792-797 7431-37/ 7346/7332
8261-65/ 8269/3471
Metal 881-883 7313 8290 Wood 941/942/944-947 7312/7424 Stone 821 7113 8112 Leather 761/762/769 7441 8265 Craft teachers etc.
156/170/179 3340 2452
Note: # The handicraft sub-division as indicated in by NCO-2004 codes and the additional codes which relate to the medium are classified under non-handicrafts sub-division.

55
Table A.3: Occupational Codes: CCI Definition Medium used for craft Group Family NCO name 89 &95 0 Earth 89 890 Supervisors & Foremen, Glass Forming, Pottery & Related Activities 89 891 Glass Formers, Cutters, Grinders & Finishers (excluding Makers of
Glass and Lac Bangles) 89 892 Potters & Related Clay & Abrasive Formers (except Village Potters,
Brick and Tile Moulders) 89 893 Glass & Ceramics Kilnmen 89 894 Glass Engravers & Etchers 89 895 Glass & Ceramics, Painters and Decorators 89 896 Village Potters 89 897 Brick and Tile Moulders 89 898 Makers of Glass and Lac Bangles 89 899 Glass Formers, Potters and Related Workers, n.e.c. 95 951 Bricklayers, Stone Masons & Tile Setters 95 953 Roofers 95 958 Hut Builders & Thatchers 95 959 Well Diggers and Construction Workers, n.e.c. 73,75&79 0 Fibre 73 734 Paper Makers 75 750 Supervisors & Foremen, Spinning, Weaving, Knitting, Dyeing &
Related Processes 75 751 Fibre Preparers 75 752 Spinners and Winders 75 753 Warpers and Sizers 75 754 Weaving and Knitting Machine Setters & Pattern Card Preparers 75 755 Weavers & Related Workers 75 756 Carpet Makers & Finishers 75 757 Knitters 75 758 Bleachers, Dyers & Textile Printers and Finishers 75 759 Spinners, Weavers, Knitters, Dyers & Related Workers, n.e.c. 79 790 Supervisors & Foremen, Tailoring, Dress Making, Sewing &
Upholstery Work 79 791 Tailors and Dress Makers 79 792 Fur Tailors & Related Workers 79 793 Milliners, Hat & Cap Makers 79 794 Pattern Makers & Cutters 79 795 Sewers & Embroiderers 79 796 Upholsters & Related Workers 79 799 Tailors, Dress Makers, Sewers, Upholsterers and Related Workers,
n.e.c.

56
(Contd… Table A.3) Group Family NCO name 72,83, 87&88
0 Metal
72 724 Metal Casters 72 725 Metal Moulders & Core-Makers 72 726 Metal Annealers, Temperers & Case Hardeners 72 727 Metal Drawers & Case Hardeners 72 728 Metal Platers & Coaters 72 729 Metal Processors, n.e.c. 83 833 Tool Makers & Metal Pattern Makers 83 835 Machine Tool Operators 83 836 Metal Grinders, Polishers & Tool Sharpeners (excluding Knife
Sharpeners) 83 837 Village Blacksmiths 83 838 Knife Sharpeners 83 839 Blacksmiths, Tool Makers & Machine Tool Operations, n.e.c. 87 870 Supervisors & Foremen, Plumbing, Welding, Structural & Sheet
Metal Working 87 879 Plumbers, Welders, Sheet Metal & Structural Metal Preparers &
Erectors, n.e.c. 88 880 Supervisors, Jewellery & Precious Metal Working 88 881 Jewellers, Goldsmiths & Silversmiths 88 882 Jewellery Engravers 88 883 Other Metal Engravers (except Printing) 88 889 Jewellery and Precious Metal Workers and Metal Engravers,
n.e.c. (except Printing) 73,81&94 0 Wood 73 734 Paper Makers 73 735 Wood Sawyers, Machine General 73 736 Wood Sawyers, Hand 73 739 Wood Preparation and Paper Making Workers n.e.c. 81 810 Supervisors & Foremen, Carpentry, Cabinet Making & Related
Wood Working Processes 81 811 Carpenters 81 812 Cabinet Makers 81 813 Wood Working Machine Operators 81 814 Cart Builders & Wheel Wrights 81 815 Coach & Body Builders 81 816 Ship wrights & Boat Builders 81 819 Carpenters, Cabinet Makers & Related Workers, n.e.c.

57
(Contd… Table A.3) 94 940 Supervisors & Foremen, Production & Related Activities, n.e.c. 94 941 Musical Instrument Makers and Tuners 94 942 Bamboo, Reed and Cane Furniture Makers and Makers of
Broom, Chic, etc. 94 943 Non-metallic Mineral Product Makers (excluding Salt Makers) 94 944 Basket Makers 94 945 Mat Weavers 94 946 Leaf Plate Makers 94 947 Winnowing Fan Makers 94 948 Salt Makers 94 949 Production & Related Workers, n.e.c. 82 0 Stone 82 820 Supervisors & Foremen, Stone Cutting & Carving 82 821 Stone Cutters & Carvers 82 829 Stone Cutters and Carvers, n.e.c. 76 & 80 0 Leather 76 763 Collectors of Bones and Hides 76 764 Carcass Lifters 76 765 Skinners of Dead Animals (or Flayers)
76 769 Tanners, Fellmongers and Pelt Dressers, n.e.c. (excluding Collectors of Bones and Hides and Carcass Lifters)
80 800 Supervisors & Foremen, Shoe and Leather Goods Making 80 801 Shoemakers & Shoe Repairers 80 802 Shoe Cutters, Lasters, Sewers and Related Workers 80 803 Harness and Saddle Makers 80 804 Makers of Large Raw Hide Vessels 80 805 Leather Container Makers
80 809 Leather Cutters, Lasters and Sewers and Related Workers, n.e.c.
92 & 93 0 Other 92 921 Compositors 92 927 Book Binders & Related Workers 93 933 Village Painters (on Wall and Clay Objects, etc.) 93 939 Painters, n.e.c. (except Painter on Wall and Clay Objects, etc.)

58
Table A.4: Industrial Codes: LR Definition Product
Category NIC-
1964$ NIC- 2004
Product Details
Khadi 232 1711 Cotton handlooms
233 17111 Preparation and spinning of cotton fiber including blended
Silk handlooms 244 17112 Preparation and spinning of silk fiber including blended silk.
17113 Preparation and spinning of wool, including other animal hair and blended* wool include ing other animal hair.
17114 Preparation and spinning of man-made fiber including blended man-made fiber.
17115 Weaving, manufacture of cotton and cotton mixture fabrics.
17116 Weaving, manufacture of silk and silk mixture fabrics.
17117 Weaving, manufacture of wool and wool mixture fabrics.
17118 Weaving, manufacturing of man-made fiber and man-made mixture fabrics.
17119 Preparation, spinning and weaving of jute, mesta and other natural fibers including blended natural fibers.
Cotton, silk and other textiles by hand
236 1712
246 17121 Finishing of cotton and blended cotton textiles.
17122 Finishing of silk and blended silk textiles. 17123 Finishing of wool and blended wool
textiles. 17124 Finishing of man-made and blended
man-made textiles. 17125 Finishing of jute, mesta and other
vegetable textiles fabrics. Zari 262 1729 17291 Embroidery work and making of laces
and fringes 17292 Zari work and making of other
ornamental trimmings

59
(Contd… Table A.4) 17293 Manufacture of linoleum and similar
products 17294 Manufacture of gas mantles 17295 Manufacture of made-up canvas goods
such as tents and sails etc. 17296 Manufacture of wadding of textile
materials and articles of wadding such as sanitary towels and tampons
17297 Manufacture of metallised yarn or gimped yarn; rubber thread or cord covered with textile material; Textile yarn or strip, impregnated, covered or sheathed with rubber or plastics
17298 Manufacture of waterproof textile excluding Tarpaulin.
17299 Manufacture of other textiles/textile products
Carpets 263 1722 17221 Manufacture of blankets shawls 17222 Manufacture of cotton carpets 17223 Manufacture of woollen carpets 17224 Manufacture of silk carpets 17225 Manufacture of durries, druggets and
rugs 17226 Manufacture of carpets, rugs and other
covering of jute, mesta and coir 17229 Manufacture of other floor coverings
(including felt) of textile, sannhemp and other kindred fibers
Miscellaneous products
279 2029
20291 Manufacture of wooden industrial goods 20292 Manufacture of cork and cork products 20293 Manufacture of bamboo and cane article
and fixture of bamboo, cane, reed and grass products (thatching etc.)
20294 Manufacture of broomsticks 20295 Manufacture of wooden agricultural
implements

60
(Contd… Table A.4) 20296 Manufacture from cane and bamboo of
shopping bags, ornament boxes, costume articles, trays, table lamps, fancy baskets, table mats, tumbler and vessel holders and other household utilities
20297 Manufacture of articles made of palm leaf, screw-pine leaf and khajoor leaf; articles of vegetables fiber etc,.
20298 Manufacture of products of pith and shalapith
20299 Manufacture of other wood products (including wooden tools, handles, etc. ornaments and household products)
Earthware 322 2691 26911 Manufacture of articles of porcelain or
china, earthenware, imitation porcelain or common pottery, including earthen statues
26912 Manufacture of statues and ornamental articles of stone and other stoneware, including writing slates of slatestone
26913 Manufacture of ceramic tableware and other articles of a kind commonly used for domestic purposes, including ceramic statuettes and other ornamental articles
26914 Manufacture of ceramic sanitary wares: sinks, baths, water-closet pans, flushing cistern etc.
26915 Manufacture of ceramic insulators and insulating fittings for electrical machines, appliances and equipment
26916 Manufacture of ceramic ware for laboratory chemical or other technical uses
26919 Manufacture of other non-structural ceramic ware n.e.c.
Plating/polishing 345 2892 28920 Treatment and coating of metals;
general mechanical engineering on a fee or contract basis
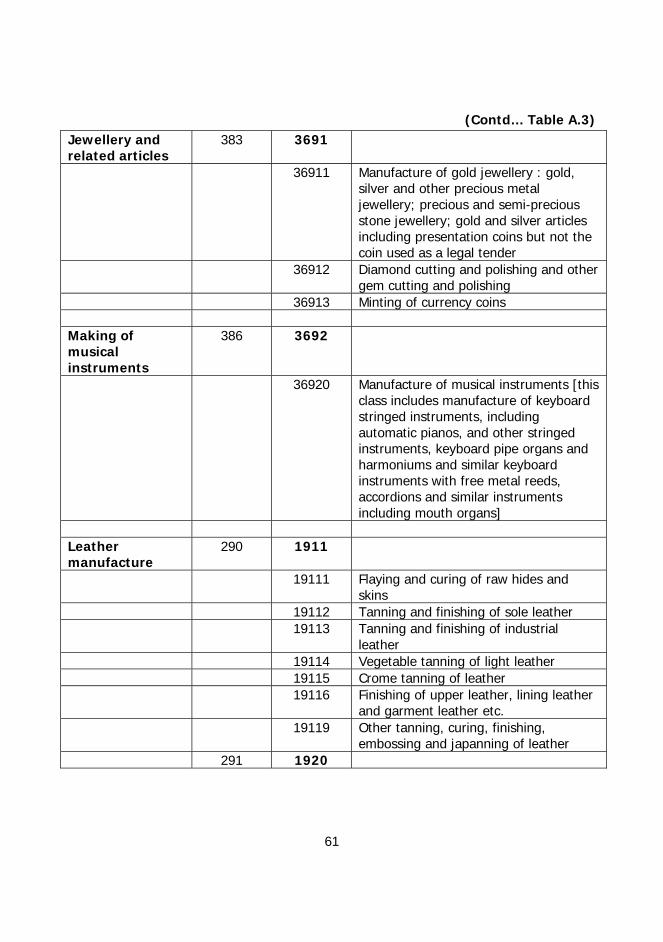
61
(Contd… Table A.3) Jewellery and related articles
383 3691
36911 Manufacture of gold jewellery : gold, silver and other precious metal jewellery; precious and semi-precious stone jewellery; gold and silver articles including presentation coins but not the coin used as a legal tender
36912 Diamond cutting and polishing and other gem cutting and polishing
36913 Minting of currency coins Making of musical instruments
386 3692
36920 Manufacture of musical instruments [this class includes manufacture of keyboard stringed instruments, including automatic pianos, and other stringed instruments, keyboard pipe organs and harmoniums and similar keyboard instruments with free metal reeds, accordions and similar instruments including mouth organs]
Leather manufacture
290 1911
19111 Flaying and curing of raw hides and skins
19112 Tanning and finishing of sole leather 19113 Tanning and finishing of industrial
leather 19114 Vegetable tanning of light leather 19115 Crome tanning of leather 19116 Finishing of upper leather, lining leather
and garment leather etc. 19119 Other tanning, curing, finishing,
embossing and japanning of leather 291 1920

62
(Contd… Table A.3) 19201 Manufacture of footwear (excluding
repair) except of vulcalized or moulded sandals and chappals, leather-cum-rubber/plastic cloth sandals and chappals made by and or by any process.
19202 Manufacture of footwear made primarily of vulcalized or moulded rubber and plastic. This class includes manufacture of rubber footwear, plastic & PVC, canvas-cum-rubber/plastic footwear etc. including sports footwear.
Leather manufacture 292 1810
18101 Manufacture of all types of textile garments and clothing accessories
18102 Manufacture of rain coats of waterproof textile fabrics or plastic sheetings
18103 Manufacture of hats and caps from waterproof
18104 Manufacture of wearing apparel of leather and substitutes of leather
18109 Manufacture of wearing apparel n.e.c. 293 1912
299 19121 Manufacture of travel goods like suitcases, bags and holdalls etc.
19122
Manufacture of purses and other ladies’handbags, artistic leather presented articles and novelties etc.
19123 Manufacture of saddlery and harness
19129
Manufacture of other consumer goods of leather and substitutes of leather, n.e.c.

63
(Contd… Table A.3) 294 1820
295 18201
Scraping, curying, tanning, bleaching and dyeing of fur and other pelts for the trade
296 18202 Manufacture of wearing apparel of fur and pelts
18203 Manufacture of fur and skin rugs and other similar articles
18204 Embroidering and embossing of leather articles
18205 Stuffing of animals’ and birds’ hides
18209 Manufacture of other leather and fur products n.e.c
Note: $ these codes are taken from LR: page 5368

64
Appendix A.5: Terminologies used in National Sample Survey Economic Activity: Any activity resulting in production of goods and services that add value to national product. This includes market activities and own consumption and own production activities. Labour Force: The population that supplies or seeks to supply labour for production. Labour Force Participation Rate: The proportion of labour force in the total population. Work Force (Employed): The population that supplies labour for production. Work Force Participation Rate (Worker Population Ratio): The proportion of economically active persons in the total population. Activity Status: It is the activity situation in which a person was found during a reference period with regard to the person’s participation in economic and non-economic activities. According a person is (a) Employed: Engaged in economic activity, (b) Unemployed: Seeking or available for work or (c) Not in labour force: not available for work which includes attending educational institutions, domestic duties etc. Different approaches are used to determine the activity status based on the reference period of the survey as given below Usual Activity Status: The activity status during the previous 365 days. This is further classified into principal status in which the person spent the major time and subsidiary status in which the person spent minor time. Status of Employment (a) Self-employed: The persons who have the autonomy and independence for
carrying out their economic activity and the remuneration received by them comprises of their share of labour and profit of the enterprise. The persons either operated their own farm or non-farm enterprise or were engaged independently in a profession or trade on own account or with one or few partners. They have been further classified into own-account workers, employers and helpers in household enterprise.

65
(b) Regular salaried/wage employee: The person works in other’s farm or non-farm enterprise (both household and non-household) and in turn receives salary or wages on a regular basis. This includes persons getting time wage, piece wage or salary and paid apprentice, both full time and part time.
(c) Casual wage labour: The person is casually engaged in other’s farm or non-farm enterprise (both household and non-household) and receives wages according to the terms of the daily or periodic work contract.


67
APPENDIX B B2.1: Household Level Tables: CCI Definition
Table B2.1a: Distribution of Households by Medium Used and Employment Status (percentage)
Medium Used
Rural Urban Self
Employed Other
Labour Others Self
Employed Casual Labour
Regular Wage
& Others Earth 72.6 18.1 9.2 30.0 27.9 42.1 Fiber 71.7 22.0 6.3 36.1 13.4 50.5 Metal 36.3 39.1 24.6 29.6 16.4 54.1 Wood 70.8 21.7 7.5 38.2 17.5 44.3 Stone 92.1 0.0 7.9 0.2 3.3 96.5 Leather 58.2 21.0 20.7 26.9 14.3 58.8 Others 19.7 44.9 35.4 14.1 13.4 72.4 Craft Households
67.3 23.4 9.3 34.5 15.1 50.3
Total Households
15.8 10.9 73.4 37.6 11.8 50.7
Table B2.1b: Number of Households by Medium Used and Employment Status
(in thousands) Medium
Used Rural Urban
Self Employed
Other Labour
Others Self Employed
Casual Labour
Regular Wage
& Others Earth 269 67 34 34 32 48 Fiber 690 423 105 402 260 48 Metal 197 212 134 303 168 836 Wood 1472 452 155 464 212 554 Stone 18 0 2 0 1 528 Leather 63 23 23 43 24 34 Others 7 17 13 7 6 97 Craft Households
2717 1194 465 1252 703 34
Total Households
23700 16300 110100 21400 6707 2131

68
Table B2.1c: Distribution of Households by Medium Used and Social Groups (percentage)
Medium Used
Rural Urban ST SC OBC Others ST SC OBC Others
Earth 0.0 20.7 71.8 7.5 1.6 5.3 62.4 30.7 Fiber 2.3 17.3 60.5 19.9 0.6 13.8 49.5 36.2 Metal 3.8 16.8 45.1 34.3 0.9 10.4 41.9 46.8 Wood 7.7 27.9 49.6 14.8 1.8 18.0 44.2 36.0 Stone 7.9 0.0 31.6 60.5 7.3 0.4 48.7 43.6 Leather 0.0 75.3 10.9 13.8 2.1 43.4 18.9 35.5 Others 0.1 13.6 54.7 31.6 8.5 14.0 53.5 24.1 Craft Households
4.8 23.9 52.9 18.4 1.3 15.0 45.2 38.5
Total Households
10.7 21.7 42.0 25.6 3.1 14.6 35.5 46.8
ST: Scheduled Tribes, SC: Scheduled Caste, OBC: Other Backward Class
Table B2.1d Number of Households by medium used and employment status
(in thousands) Medium
Used ST SC OBC Others Total
Rural Earth 0.0 76.4 265.6 27.8 369.8 Fiber 27.4 208.8 728.5 239.9 1204.6 Metal 20.7 91.2 244.9 186.4 543.3 Wood 159.7 580.2 1028.7 307.2 2075.8 Stone 1.6 0.0 6.2 11.9 19.7 Leather 0.0 82.0 11.8 15.0 108.9 Others 0.0 5.1 20.6 11.9 37.6 Craft Households 209.4 1043.7 2306.4 800.1 4359.6 Total Households 16100 32600 63000 38400 150100
Urban Earth 1.9 6.0 71.3 35.1 114.2 Fibre 9.3 206.0 741.1 541.5 1497.9 Metal 8.9 106.6 429.8 480.2 1025.5 Wood 21.4 216.9 532.7 433.2 1204.2 Stone 2.5 0.1 17.0 15.2 34.9 Leather 3.5 71.1 30.9 58.2 163.8 Others 4.0 6.6 25.2 11.3 47.1 Craft Households 51.5 613.4 1847.9 1574.8 4087.5 Total Households 1752 8325 20200 26600 56877 ST: Scheduled Tribes, SC: Scheduled Caste, OBC: Other Backward Class

69
Table B2.1e: Distribution of Households by Medium Used and Religious Groups (percentage)
Medium Used
Rural Urban Hinduism Islam Others Hinduism Islam Others
Earth 94.5 5.0 0.5 75.6 24.4 0.0 Fiber 71.5 24.6 3.9 72.6 24.9 2.5 Metal 85.3 12.6 2.1 86.3 9.3 4.4 Wood 89.3 6.8 3.9 79.5 14.9 5.6 Stone 100.0 0.0 0.0 100.0 0.0 0.0 Leather 72.2 20.4 7.4 67.8 28.4 3.7 Others 98.2 1.6 0.1 92.3 7.7 0.0 Craft Households 81.6 14.9 3.5 76.9 19.6 3.5 Total Households 84.3 10.4 5.3 80.2 13.4 6.2
Table B2.1f: Number of Households by Medium Used and Religious Groups
(in thousands) Medium Used Rural Urban
Hinduism Islam Others Hinduism Islam Others Earth 349.5 18.5 1.8 86.3 27.9 0.0 Fiber 1607.7 552.9 87.6 2110.6 724.8 71.7 Metal 463.5 68.5 11.2 885.4 95.7 45.0 Wood 1857.5 142.3 80.2 964.7 181.4 68.1 Stone 19.7 0.0 0.00 34.9 0.0 0.0 Leather 78.6 22.2 8.08 113.2 47.5 6.3 Others 36.9 0.6 0.04 43.4 3.6 0.0 Craft Households 4413.3 805.1 189.03 4238.5 1080.9 191.0 Total Households 127000.0 15600.0 7968.37 45700.0 7661.6 3631.8
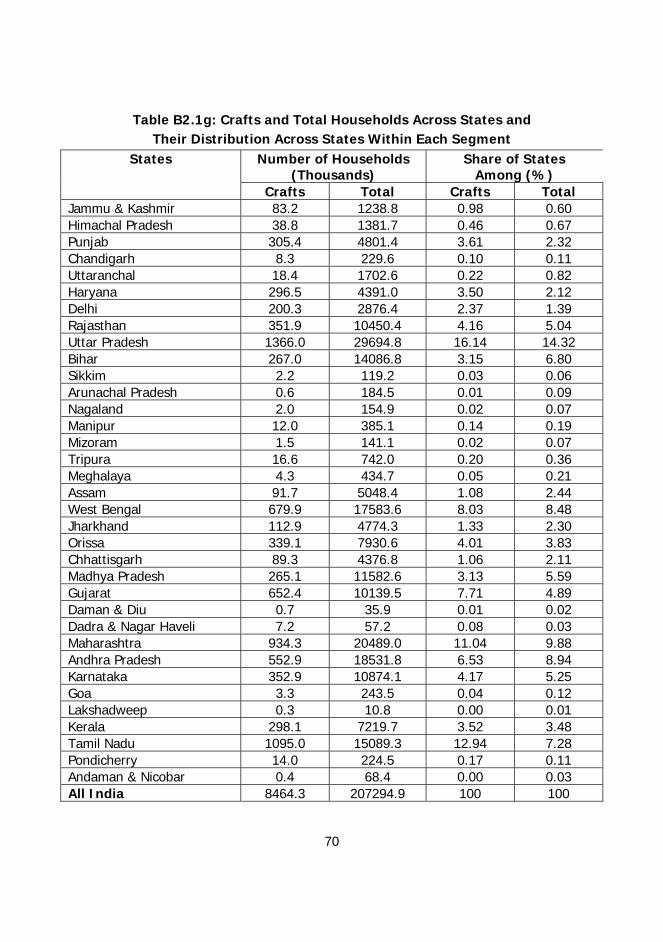
70
Table B2.1g: Crafts and Total Households Across States and Their Distribution Across States Within Each Segment
States Number of Households (Thousands)
Share of States Among (%)
Crafts Total Crafts Total Jammu & Kashmir 83.2 1238.8 0.98 0.60 Himachal Pradesh 38.8 1381.7 0.46 0.67 Punjab 305.4 4801.4 3.61 2.32 Chandigarh 8.3 229.6 0.10 0.11 Uttaranchal 18.4 1702.6 0.22 0.82 Haryana 296.5 4391.0 3.50 2.12 Delhi 200.3 2876.4 2.37 1.39 Rajasthan 351.9 10450.4 4.16 5.04 Uttar Pradesh 1366.0 29694.8 16.14 14.32 Bihar 267.0 14086.8 3.15 6.80 Sikkim 2.2 119.2 0.03 0.06 Arunachal Pradesh 0.6 184.5 0.01 0.09 Nagaland 2.0 154.9 0.02 0.07 Manipur 12.0 385.1 0.14 0.19 Mizoram 1.5 141.1 0.02 0.07 Tripura 16.6 742.0 0.20 0.36 Meghalaya 4.3 434.7 0.05 0.21 Assam 91.7 5048.4 1.08 2.44 West Bengal 679.9 17583.6 8.03 8.48 Jharkhand 112.9 4774.3 1.33 2.30 Orissa 339.1 7930.6 4.01 3.83 Chhattisgarh 89.3 4376.8 1.06 2.11 Madhya Pradesh 265.1 11582.6 3.13 5.59 Gujarat 652.4 10139.5 7.71 4.89 Daman & Diu 0.7 35.9 0.01 0.02 Dadra & Nagar Haveli 7.2 57.2 0.08 0.03 Maharashtra 934.3 20489.0 11.04 9.88 Andhra Pradesh 552.9 18531.8 6.53 8.94 Karnataka 352.9 10874.1 4.17 5.25 Goa 3.3 243.5 0.04 0.12 Lakshadweep 0.3 10.8 0.00 0.01 Kerala 298.1 7219.7 3.52 3.48 Tamil Nadu 1095.0 15089.3 12.94 7.28 Pondicherry 14.0 224.5 0.17 0.11 Andaman & Nicobar 0.4 68.4 0.00 0.03 All India 8464.3 207294.9 100 100

71
Table B2.1h: Self-Employed Households and Crafts Households States Share of Self-employed Households
within the Crafts and Total Households Share of Crafts
Households among All Self-Employed
Households Rural Urban Rural# Urban
Crafts Total Crafts Total Jammu & Kashmir 95.0 20.7 97.1 48.6 24.5 20.7 Himachal Pradesh 62.1 14.2 17.2 25.1 11.4 2.8 Punjab 36.1 15.7 14.2 42.6 7.3 4.0 Chandigarh 48.0 34.1 57.1 28.3 12.6 5.8 Uttaranchal 81.2 15.4 52.8 38.7 4.5 2.4 Haryana 37.8 18.1 19.2 40.9 8.6 6.1 Delhi 0.0 41.0 7.6 32.4 0.0 1.7 Rajasthan 75.2 16.0 51.1 42.6 11.4 7.5 Uttar Pradesh 62.4 18.6 54.0 49.3 13.0 8.0 Bihar 92.5 18.2 89.4 47.1 9.3 4.6 Sikkim 69.9 11.6 68.0 28.0 8.6 11.2 Arunachal Pradesh 42.3 11.6 0.0 31.7 1.0 0.0 Nagaland 91.2 12.6 93.6 43.9 5.0 5.5 Manipur 92.2 21.1 93.5 47.2 8.6 12.0 Mizoram 100.0 10.8 85.5 38.2 4.3 4.4 Tripura 76.6 20.7 100.0 36.0 8.6 5.0 Meghalaya 81.7 12.5 81.8 14.7 5.9 8.1 Assam 73.6 17.8 34.6 35.9 7.3 2.1 West Bengal 60.7 21.5 26.8 37.4 7.8 4.8 Jharkhand 86.0 16.2 36.3 30.5 12.7 2.7 Orissa 95.0 18.9 52.0 37.4 22.1 4.9 Chhattisgarh 55.5 6.5 17.7 30.7 13.8 2.4 Madhya Pradesh 89.0 9.4 54.8 40.7 12.4 7.2 Gujarat 41.2 11.8 20.8 37.8 11.8 6.7 Daman & Diu 53.7 31.5 0.0 33.5 2.6 0.0 Dadra & Nagar Haveli 0.0 6.7 0.0 34.8 0.0 0.0 Maharashtra 43.9 11.0 11.4 32.2 8.4 2.9 Andhra Pradesh 79.6 16.0 57.3 37.7 12.8 6.4 Karnataka 58.1 9.7 29.9 33.4 12.0 5.1 Goa 100.0 15.4 7.9 26.7 6.8 0.6 Lakshadweep 78.8 8.4 - 20.7 43.6 0.0 Kerala 31.8 18.5 26.7 33.7 6.6 3.9 Tamil Nadu 40.4 13.5 31.2 32.8 16.7 9.3 Pondicherry 23.4 10.2 7.1 27.4 8.4 2.0 Andaman & Nicobar 100.0 14.3 42.1 21.2 0.5 2.8 All India 62.1 15.8 30.6 37.5 11.5 5.9 Note: # For rural households these are self-employed in non-agriculture alone.

72
B2.2: Individual Level Tables: CCI Definition Table B2.2a: Number of Working Population: Crafts, Non-Crafts and Total
(in lakhs) Medium
Used RURAL URBAN
Men Women Total Men Women Total Grand Total Earth 5.80 3.11 8.92 1.45 0.64 2.09 11.01 Fiber 18.32 15.40 33.73 20.57 8.12 28.70 62.43 Metal 9.67 0.61 10.27 13.95 1.28 15.23 25.50 Wood 31.31 11.95 43.26 15.33 2.13 17.45 60.71 Stone 0.63 0.06 0.69 0.73 0.01 0.74 1.43 Leather 1.54 0.24 1.77 3.06 0.71 3.77 5.54 Others 0.44 0.18 0.62 0.54 0.17 0.71 1.33 Total craft 67.71 31.55 99.26 55.63 13.06 68.69 167.95 Share of craft (%)
3.3 2.7 3.1 7.6 6.2 7.3 4.0
Non Craft Sector 1980 1150 3130 678 198 876 4006 Total Working Population
2050 1180 3230 734 211 945 4175
Table B2.2b: Working Population Across Employment Status
(in thousands) Medium Used Self Employed Regular Salaried Casual Labour Rural Earth 714 40 151 Fiber 2305 377 707 Metal 336 298 395 Wood 3283 515 534 Stone 34 35 0 Leather 103 45 29 Others 27 31 5 Total craft 6801 1341 1822 Total Working Population 251544 23163 129609 Urban Earth 101 59 49 Fiber 1171 1254 450 Metal 561 761 206 Wood 736 673 341 Stone 0 71 2 Leather 118 219 40 Others 11 43 17 Total craft 2699 3080 1105 Total Working Population 44527 36016 14646

73
Table B2.2c: Distribution of Crafts Population Across Age Groups (percentage)
Medium Used
Age Group (in years) Total Population5-14 15-19 20-24 25-29 30-54 55-
59 60 & above
Earth 3.8 11.2 11.5 9.4 53.4 2.9 7.7 1101Fiber 4.1 14.6 18.1 14.4 42.4 2.3 4.1 6243Metal 1.6 12.2 18.5 13.8 47.7 2.4 3.9 2550Wood 1.9 10.1 13.9 14.8 48.6 4.0 6.7 6071Stone 0.0 2.5 22.8 16.1 58.6 0.0 0.0 143Leather 4.9 12.4 13.3 24.3 35.9 3.2 6.1 554Others 0.0 17.5 10.0 12.6 45.6 11.5 2.7 133Total craft 2.9 12.2 16.0 14.5 46.1 3.1 5.3 16795Total Working Population
2.0 9.6 13.6 13.9 55.8 5.1 7.0 390181
Table B2.2d: Crafts Population Across Education Levels
(in thousands) Medium
Used Not
literate Literate Primary Middle Secondary Higher
secondary Rural
Earth 491 102 94 147 35 23 Fiber 1175 501 807 548 244 95 Metal 192 168 189 255 143 75 Wood 1654 572 767 815 304 214 Stone 22 0 16 20 7 5 Leather 58 26 37 32 10 14 Others 13 0 8 24 14 3 Total craft 3606 1368 1918 1841 756 429 Total Working Population
145606 37968 44818 47241 23556 21929
Urban Earth 100 22 15 32 12 28 Fiber 694 437 653 602 302 178 Metal 206 154 262 383 234 273 Wood 287 224 447 439 236 110 Stone 3 11 17 7 29 6 Leather 76 42 68 114 23 55 Others 7 4 11 18 19 11 Total craft 1373 893 1474 1595 856 662 Total Working Population
16873 8069 12774 16695 12556 23362

74
Table B2.2e: Crafts Population Across Religious Groups (in thousands)
Medium Used Hindus Muslims Christians Sikhs Others Rural
Earth 846 38 0 2 5 Fiber 2427 846 69 16 15 Metal 899 112 2 13 1 Wood 3889 272 77 38 49 Stone 69 0 0 0 0 Leather 144 25 6 3 0 Others 61 1 0 0 0 Total craft 8337 1294 154 72 71 Total Working Population 276337 28694 7201 6872 4082
Urban Earth 125 84 0 0 0 Fiber 1999 839 10 14 9 Metal 1333 135 39 10 5 Wood 1330 325 39 28 23 Stone 74 0 0 0 0 Leather 273 87 17 0 0 Others 67 4 0 0 0 Total craft 5200 1474 105 52 38 Total Working Population 74600 13874 2560 1455 1982

75
Table B2.2f: Crafts Population Across Social Groups (in thousands)
Medium Used ST SC OBC Others
Rural
Earth 14.8 132.2 670.4 74.4 Fiber 109.2 550.0 1886.4 808.7 Metal 28.8 143.5 480.9 374.0 Wood 526.6 1200.9 2001.2 589.2 Stone 16.3 1.3 36.7 15.1 Leather 0.0 135.1 16.3 25.7 Others 0.0 4.9 40.3 16.8 Total craft 695.8 2167.9 5132.2 1904.0 Total Working Population 37800.0 66900.0 132000.0 75700.0
Urban
Earth 3.8 12.6 112.5 80.4 Fiber 13.5 352.5 1661.9 841.7 Metal 10.2 189.1 632.7 691.1 Wood 26.8 293.5 829.3 595.7 Stone 4.9 0.1 41.0 27.7 Leather 3.5 169.2 43.3 160.9 Others 4.0 8.3 37.6 20.6 Total craft 66.8 1025.4 3358.4 2418.0 Total Working Population 2907.0 13700.0 31700.0 39200.0

76
B2.3: INDIVIDUAL LEVEL TABLES: DC-H DEFINITION
Table B2.3a: Number of Working Population: Crafts, Non-Crafts and Total (in lakhs)
Medium Used
RURAL URBAN Men Women Total Men Women Total Grand
Total Earth 5.06 2.85 7.91 1.24 0.60 1.84 9.75 Fiber 17.63 14.84 32.47 18.10 7.41 25.51 57.98 Metal 4.55 0.43 4.98 4.43 0.41 4.84 9.82 Wood 5.65 5.47 11.12 0.50 0.52 1.02 12.14 Stone 0.40 0.01 0.40 0.66 0.00 0.66 1.07 Leather 0.24 0.00 0.24 0.75 0.00 0.76 0.99 Others 0.07 0.00 0.07 0.05 0.00 0.05 0.12 Total craft 33.61 23.59 57.19 25.72 8.95 34.67 91.86 Share of craft (%)
1.6 2.0 1.8 3.5 4.2 3.7 2.2
Non Craft Sector
2010 1160 3170 708 202 910 4080
Total Working Population
2044 1184 3227 734 211 945 4172
Table B2.3b: Number and Distribution of Crafts Persons Across Employment
Status: Rural (in lakhs)
Medium Used Self Employed
Regular Salaried
Casual Labour
Others
Numbs (lakhs)
Share(%)
Numbs(lakhs)
Share(%)
Numbs(lakhs)
Share(%)
Numbs (lakhs)
Share (%)
Earth 9.9 75.8 0.3 2.2 2.0 15.1 1 6.9 Fiber 26.5 53.5 3.5 7.1 8.2 16.5 11 22.8 Metal 3.0 40.7 0.2 2.7 3.3 44.6 1 12.0 Wood 13.2 69.6 0.1 0.5 3.3 17.3 2 12.6 Stone 0.4 63.0 0.2 29.9 0.0 6.9 0 0.2 Leather 0.0 13.5 0.2 60.3 0.0 9.7 0 16.5 Others 0.1 50.0 0.0 0.0 0.0 11.5 0 38.5 Total craft 53.2 59.0 4.5 5.0 17 18.7 16 17.3 Non Craft Sector 2037 21.9 224 3.0 1043 14.6 4319 60.5 Total Working Population
2090 22.4 228 3.0 1060 14.7 4335 59.9

77
Table B2.3c: Number and Distribution of Crafts Persons Across Employment Status: Urban
(in lakhs) Medium Used Self
Employed Regular Salaried
Casual Labour
Others
Numbs (lakhs)
Share (%)
Numbs(lakhs)
Share (%)
Numbs(lakhs)
Share(%)
Numbs (lakhs)
Share (%)
Earth 1.08 37.5 0.47 16.3 0.4 14.8 0.9 31.4 Fiber 11.67 29.0 12.61 31.4 4.6 11.4 11.3 28.1 Metal 3.15 53.7 0.74 12.6 1.1 18.6 0.9 15.1 Wood 1.02 29.7 0.01 0.3 0.0 0.8 2.4 69.2 Stone 0.00 0.2 0.66 99.6 0.0 0.0 0.0 0.2 Leather 0.02 2.8 0.49 60.0 0.3 31.2 0.0 5.9 Others 0.03 28.6 0.02 12.9 0.0 0.0 0.1 58.5 Total craft 16.99 31.5 15.00 27.8 6.4 11.8 15.6 28.9 Non Craft Sector 429 17.1 345 13.7 140 5.6 1599 63.7 Total Working Population
446 17.4 360 14.0 147 5.7 1615 62.9
Table B2.3d: Distribution of Crafts persons across Age-groups for each Medium
Used (percentage)
Medium Used Age group (years) 5-14 15-19 20-24 25-29 30-54 55-59 60 and
above Earth 4.1 11.5 10.7 9.5 52.7 3.2 8.2 Fiber 4.3 14.6 18.2 15.6 40.9 2.2 4.1 Metal 0.9 16.2 17.3 16.4 42.2 2.2 4.9 Wood 2.8 9.4 10.3 8.9 50.7 5.4 12.5 Stone 0.0 3.4 20.6 21.6 54.4 0.0 0.0 Leather 3.7 5.4 19.5 15.1 53.7 2.7 0.0 Others 0.0 0.0 0.0 36.3 50.7 13.0 0.0 Total craft 3.7 13.6 16.4 14.3 43.8 2.7 5.6 Total Working Population
1.9 8.9 12.7 13.0 52.1 4.8 6.6

78
Table B2.3e: Distribution of Crafts Persons Across Religious Groups for Each Medium Used
(percentage) Medium Used Hindus Muslims Christians Sikhs Others
Earth 88.5 11.2 0.0 0.2 0.1 Fiber 69.7 28.1 1.3 0.5 0.4 Metal 92.5 6.6 0.2 0.3 0.4 Wood 95.5 1.6 2.1 0.2 0.6 Stone 100.0 0.0 0.0 0.0 0.0 Leather 85.9 9.3 4.6 0.3 0.0 Others 100.0 0.0 0.0 0.0 0.0 Total craft 77.8 20.2 1.2 0.4 0.4 Total Working Population 84.0 10.2 2.3 2.0 1.5
Table B2.3f: Distribution of Crafts Persons Across Social groups for Each Medium Used
(percentage) Medium Used ST SC OBC Others Earth 1.2 10.9 74.6 13.3 Fiber 2.0 14.5 57.0 26.4 Metal 1.1 5.1 50.4 43.5 Wood 22.9 56.3 17.3 3.5 Stone 8.6 0.3 55.9 35.2 Leather 0.0 73.3 12.9 13.7 Others 6.4 4.7 39.7 49.2 Total craft 4.6 18.9 52.6 23.9 Total Working Population 10.0 20.1 41.3 28.6 ST: Scheduled Tribes, SC: Scheduled Caste, OBC: Other Backward Class

79
Table B2.3g: Distribution of Crafts Persons Across Education Levels for Each Medium Used
(percentage) Medium Used Education Level
Not literate
Literate Primary Middle Secondary Higher secondary
Earth 55.2 10.5 9.5 16.4 4.7 3.8 Fiber 30.1 15.6 23.6 18.5 8.6 3.6 Metal 7.5 14.2 20.4 30.9 14.5 11.7 Wood 68.6 11.9 9.1 7.7 1.3 1.4 Stone 6.4 10.7 30.2 18.1 24.5 10.2 Leather 22.3 12.4 17.3 34.3 13.0 0.7 Others 26.3 0.0 16.3 11.5 19.4 16.5 Total craft 34.9 14.4 20.0 18.3 8.1 4.2 Total Working Population
38.8 11.0 13.8 15.3 8.6 10.9

80
Table B2.3h: Number of Crafts Persons Across States For Each Medium Used
(In lakhs) State Earth Fiber Metal Wood Stone Leather Others Total
Craft Popn
Total WorkingPopn
Jammu & Kashmir 3.7 133.9 1.6 4.9 0.0 0.2 0.0 144 2355 Himachal Pradesh 1.5 9.0 0.8 3.8 0.0 0.0 0.0 15 3237 Punjab 6.2 171.3 2.5 2.9 0.0 0.3 0.0 183 10189 Chandigarh 0.0 1.9 0.2 0.0 0.0 0.0 0.0 2 318 Uttaranchal 0.0 0.8 1.5 10.0 0.0 0.0 0.0 12 3523 Haryana 5.5 72.5 8.2 1.7 0.0 0.0 0.0 88 8851 Delhi 5.5 190.4 0.0 0.0 0.0 0.0 0.0 196 4054 Rajasthan 60.4 140.9 49.7 10.7 46.6 0.0 0.0 308 24302 Uttar Pradesh 340.8 1413.5 43.9 128.3 5.5 0.5 0.0 1933 60100 Bihar 86.5 39.7 1.4 56.6 0.0 0.0 0.0 184 22566 Sikkim 0.0 0.0 0.2 0.0 0.0 0.0 0.0 0 217 Arunachal Pradesh
0.0 0.5 0.0 0.0 0.0 0.0 0.0 0 371
Nagaland 0.0 14.4 0.0 1.7 0.0 0.0 0.0 16 373 Manipur 0.0 30.4 3.8 1.1 0.0 0.0 0.0 35 799 Mizoram 0.0 0.4 0.0 0.0 0.0 0.0 0.0 0 319 Tripura 0.0 1.4 2.7 4.0 0.0 0.0 0.0 8 1217 Meghalaya 3.4 15.6 0.0 3.8 0.0 0.0 0.0 23 1040 Assam 7.9 40.1 2.1 28.7 0.0 0.0 1.2 80 9661 West Bengal 47.8 715.7 48.6 72.8 0.0 53.6 0.3 939 31134 Jharkhand 20.3 78.8 18.5 59.7 0.0 0.0 0.0 177 9697 Orissa 56.1 128.7 18.0 253.8 0.0 0.0 3.5 460 17014 Chhattisgarh 58.2 6.8 3.5 43.8 0.0 0.0 0.8 113 10591 Madhya Pradesh 107.6 104.2 14.3 131.0 0.0 2.3 0.0 359 26178 Gujarat 43.5 416.5 458.4 79.5 51.5 0.0 1.2 1051 22392 Daman & Diu 0.0 0.2 0.3 0.0 0.0 0.0 0.0 0 55 Dadra & Nagar Haveli
0.0 2.9 0.0 0.0 0.0 0.0 0.0 3 103
Maharashtra 55.9 388.5 57.1 46.1 0.1 0.7 3.1 552 43500 Andhra Pradesh 43.5 587.6 57.6 124.5 0.0 5.2 1.6 820 36730 Karnataka 4.7 208.7 48.7 51.4 2.4 0.0 0.0 316 24175 Goa 0.1 2.2 0.0 0.0 0.0 0.0 0.0 2 405 Lakshadweep 0.0 0.1 0.0 0.0 0.0 0.0 0.0 0 22 Kerala 3.3 179.2 43.2 18.0 0.0 0.0 0.0 244 13570 Tamil Nadu 11.9 1072.7 98.4 74.8 0.5 37.1 0.2 1296 27555 Pondicherry 0.3 7.9 0.5 0.0 0.0 0.0 0.0 9 348 Andaman & Nicobar
0.0 0.0 0.0 0.0 0.0 0.0 0.0 0 100
Total 974.6 6177.3 985.6 1213.6 106.8 100.0 11.8 9570 417061

81
Table B2.3i: Distribution of Population Across Medium Used in Each State (percentage)
State Earth Fiber Metal Wood Stone Leather Others Jammu & Kashmir 2.54 92.81 1.08 3.40 0.00 0.17 0.00 Himachal Pradesh 10.26 59.68 5.01 25.05 0.00 0.00 0.00 Punjab 3.40 93.45 1.38 1.61 0.00 0.16 0.00 Chandigarh 0.00 88.74 11.26 0.00 0.00 0.00 0.00 Uttaranchal 0.00 6.38 11.95 81.67 0.00 0.00 0.00 Haryana 6.27 82.55 9.28 1.89 0.00 0.00 0.00 Delhi 2.78 97.22 0.00 0.00 0.00 0.00 0.00 Rajasthan 19.60 45.70 16.11 3.46 15.13 0.00 0.00 Uttar Pradesh 17.64 73.14 2.27 6.64 0.29 0.03 0.00 Bihar 46.96 21.55 0.76 30.73 0.00 0.00 0.00 Sikkim 0.00 0.00 87.66 12.34 0.00 0.00 0.00 Arunachal Pradesh 0.00 100.00 0.00 0.00 0.00 0.00 0.00 Nagaland 0.00 89.26 0.00 10.74 0.00 0.00 0.00 Manipur 0.00 86.17 10.73 3.10 0.00 0.00 0.00 Mizoram 0.00 100.00 0.00 0.00 0.00 0.00 0.00 Tripura 0.00 17.45 33.64 48.91 0.00 0.00 0.00 Meghalaya 15.04 68.28 0.00 16.68 0.00 0.00 0.00 Assam 9.90 50.17 2.63 35.85 0.00 0.00 1.45 West Bengal 5.09 76.23 5.18 7.76 0.00 5.71 0.04 Jharkhand 11.43 44.46 10.41 33.69 0.00 0.00 0.00 Orissa 12.19 27.98 3.91 55.16 0.00 0.00 0.76 Chhattisgarh 51.49 6.02 3.07 38.75 0.00 0.00 0.67 Madhya Pradesh 29.94 28.99 3.99 36.44 0.00 0.64 0.00 Gujarat 4.14 39.65 43.64 7.56 4.91 0.00 0.11 Daman & Diu 0.00 37.03 62.97 0.00 0.00 0.00 0.00 Dadra & Nagar Haveli 0.00 100.00 0.00 0.00 0.00 0.00 0.00 Maharashtra 10.13 70.44 10.35 8.36 0.03 0.13 0.56 Andhra Pradesh 5.30 71.66 7.03 15.18 0.00 0.64 0.19 Karnataka 1.48 66.09 15.42 16.27 0.75 0.00 0.00 Goa 5.84 94.16 0.00 0.00 0.00 0.00 0.00 Lakshadweep 0.00 100.00 0.00 0.00 0.00 0.00 0.00 Kerala 1.35 73.55 17.72 7.37 0.00 0.00 0.00 Tamil Nadu 0.92 82.79 7.60 5.77 0.04 2.87 0.02 Pondicherry 3.67 90.45 5.88 0.00 0.00 0.00 0.00 Andaman & Nicobar 0.00 0.00 45.03 54.97 0.00 0.00 0.00 Total 10.18 64.55 10.30 12.68 1.12 1.05 0.12

82
Table B2.3j: Distribution of Population Across State within Each Medium Used (percentage)
State Earth Fiber Metal Wood Stone Leather Others Jammu & Kashmir 0.38 2.17 0.16 0.40 0.00 0.24 0.00 Himachal Pradesh 0.16 0.15 0.08 0.31 0.00 0.00 0.00 Punjab 0.64 2.77 0.26 0.24 0.00 0.29 0.00 Chandigarh 0.00 0.03 0.02 0.00 0.00 0.00 0.00 Uttaranchal 0.00 0.01 0.15 0.83 0.00 0.00 0.00 Haryana 0.57 1.17 0.83 0.14 0.00 0.00 0.00 Delhi 0.56 3.08 0.00 0.00 0.00 0.00 0.00 Rajasthan 6.20 2.28 5.04 0.88 43.68 0.00 0.00 Uttar Pradesh 34.97 22.88 4.45 10.57 5.19 0.55 0.00 Bihar 8.87 0.64 0.14 4.66 0.00 0.00 0.00 Sikkim 0.00 0.00 0.02 0.00 0.00 0.00 0.00 Arunachal Pradesh 0.00 0.01 0.00 0.00 0.00 0.00 0.00 Nagaland 0.00 0.23 0.00 0.14 0.00 0.00 0.00 Manipur 0.00 0.49 0.38 0.09 0.00 0.00 0.00 Mizoram 0.00 0.01 0.00 0.00 0.00 0.00 0.00 Tripura 0.00 0.02 0.28 0.33 0.00 0.00 0.00 Meghalaya 0.35 0.25 0.00 0.31 0.00 0.00 0.00 Assam 0.81 0.65 0.21 2.36 0.00 0.00 9.82 West Bengal 4.91 11.59 4.93 6.00 0.00 53.57 2.94 Jharkhand 2.08 1.28 1.87 4.92 0.00 0.00 0.00 Orissa 5.75 2.08 1.83 20.92 0.00 0.00 29.80 Chhattisgarh 5.97 0.11 0.35 3.61 0.00 0.00 6.44 Madhya Pradesh 11.04 1.69 1.45 10.79 0.00 2.29 0.00 Gujarat 4.46 6.74 46.51 6.55 48.28 0.00 9.88 Daman & Diu 0.00 0.00 0.03 0.00 0.00 0.00 0.00 Dadra & Nagar Haveli 0.00 0.05 0.00 0.00 0.00 0.00 0.00 Maharashtra 5.73 6.29 5.79 3.80 0.14 0.71 26.00 Andhra Pradesh 4.46 9.51 5.84 10.26 0.00 5.23 13.40 Karnataka 0.48 3.38 4.94 4.23 2.21 0.00 0.00 Goa 0.01 0.03 0.00 0.00 0.00 0.00 0.00 Lakshadweep 0.00 0.00 0.00 0.00 0.00 0.00 0.00 Kerala 0.34 2.90 4.38 1.48 0.00 0.00 0.00 Tamil Nadu 1.22 17.37 9.99 6.17 0.51 37.12 1.72 Pondicherry 0.03 0.13 0.05 0.00 0.00 0.00 0.00 Andaman & Nicobar 0.00 0.00 0.00 0.00 0.00 0.00 0.00

83
B2.4: Individual Level Tables: LR Definition
Table B2.4a: Number of Working Population: Crafts, Non-Crafts and Total (in lakhs)
Handicraft Item RURAL URBAN Men Women Total Men Women Total Grand
Total Khadi 2.02 1.30 3.32 1.91 0.58 2.49 5.81 Cotton handloom 6.62 4.54 11.16 8.42 2.28 10.70 21.86 Silk handloom 3.78 2.13 5.91 4.56 2.87 7.43 13.34 Cotton textile 0.54 0.20 0.74 3.46 0.51 3.98 4.71 Silk textile 0.04 0.00 0.04 0.12 0.00 0.12 0.16 Zari 2.95 4.51 7.46 2.13 1.60 3.73 11.19 Carpets 3.55 1.46 5.01 1.08 0.34 1.42 6.43 Miscellaneous 8.04 6.92 14.97 0.84 0.42 1.26 16.23 Earthware 4.76 2.59 7.35 0.45 0.30 0.75 8.10 Plating 0.15 0.00 0.15 0.79 0.00 0.79 0.93 Jewellery 5.64 0.42 6.06 8.51 0.65 9.15 15.21 Musical instruments 0.08 0.00 0.08 0.02 0.00 0.02 0.11 Leather 2.34 0.33 2.67 6.74 1.69 8.44 11.10 Total Craft 40.50 24.42 64.91 39.03 11.24 50.27 115.19 Share of craft (%) 2.0 2.1 2.0 5.8 5.8 5.8 2.9
Table B2.4bL: Number of Persons Based on Work Status and Share of Urban and Women: Crafts and Total Working Population
Work Status Crafts Total Working Population Total
Proportion of Urban
Proportion of Women
Total
Proportion of Urban
Proportion of Women
(Lakhs) (percentage) (Lakhs) (percentage) Principal only 86.7 53.2 25.6 2862.0 29.6 27.6Subsidiary only
8.2 33.2 89.0 369.9 11.2 89.6
Both Principal and Subsidiary
20.3 6.9 30.4 942.8 5.9 28.9
Total 115.2 43.6 31.0 4174.7 22.6 33.4

84
Table B2.4c: Distribution Across Employment Status (percentage)
Handicraft Item Self Employed Regular salaried Casual labour Others Khadi 24.9 49.5 25.5 0.1 Cotton handloom 47.5 32.5 18.2 1.8 Silk handloom 68.1 10.3 13.6 7.9 Cotton textile 19.9 42.2 13.9 24.0 Silk textile 74.2 2.9 21.6 1.3 Zari 73.2 11.7 15.1 0.0 Carpets 60.7 6.9 16.5 15.9 Miscellaneous 86.9 0.9 10.3 1.8 Earthware 75.1 4.2 6.6 14.1 Plating 50.6 9.9 24.3 15.2 Jewellery 46.4 26.3 27.3 0.0 Musical instruments 61.9 1.9 11.1 25.1 Leather 68.8 20.8 10.4 0.0 Total Craft 64.8 18.6 16.6 0.1
Table B2.4d: Distribution Across Age Groups (percentage)
Handicraft Item 5-14 15-19 20-24 25-29 30-54 55-59 60 and above Khadi 1.1 12.3 17.0 9.2 51.1 4.9 4.4 Cotton handloom 1.4 11.2 14.7 14.6 49.2 3.1 5.7 Silk handloom 5.2 15.1 20.6 12.1 40.4 2.3 4.3 Cotton textile 0.0 9.2 23.0 20.8 42.7 0.5 3.8 Silk textile 0.0 0.0 0.0 4.9 95.1 0.0 0.0 Zari 10.0 24.9 18.2 14.2 31.1 0.8 0.8 Carpets 3.4 8.7 19.0 18.2 43.6 2.2 5.0 Miscellaneous 3.0 10.5 11.2 9.9 49.9 6.2 9.2 Earthware 3.5 5.4 10.3 9.1 55.8 4.0 11.9 Plating 0.0 16.9 9.3 13.0 53.7 6.9 0.2 Jewellery 1.2 13.3 19.8 14.5 45.8 2.1 3.4 Musical instruments 0.0 11.3 13.0 0.0 67.3 0.0 8.4 Leather 2.6 8.9 14.8 21.7 44.7 2.1 5.3 Total Craft 3.2 12.4 16.2 14.0 45.7 3.0 5.4

85
Table B2.4e: Distribution Across Religious Groups (percentage)
Handicraft Item Hindus Muslims Christians Sikhs Others Khadi 78.9 14.3 2.8 0.2 3.7 Cotton handloom 87.3 9.7 2.4 0.3 0.3 Silk handloom 62.9 37.0 0.0 0.0 0.0 Cotton textile 88.7 11.1 0.0 0.1 0.1 Silk textile 84.4 15.6 0.0 0.0 0.0 Zari 47.7 50.7 0.5 1.2 0.0 Carpets 66.1 29.5 2.6 1.6 0.2 Miscellaneous 90.8 5.0 1.4 0.2 2.5 Earthware 95.8 4.1 0.0 0.0 0.0 Plating 83.7 10.2 3.9 2.2 0.0 Jewellery 94.8 4.2 0.2 0.0 0.9 Musical instruments 60.9 39.1 0.0 0.0 0.0 Leather 79.4 17.1 2.4 1.0 0.0 Total Craft 80.4 17.2 1.3 0.4 0.7
Table B2.4f Distribution Across Social groups (percentage)
Handicraft Item ST SC BC Others Khadi 2.5 21.1 43.1 33.3 Cotton handloom 2.9 14.3 64.1 18.7 Silk handloom 0.4 3.4 82.9 13.2 Cotton textile 0.1 8.1 57.9 34.0 Silk textile 0.0 0.0 34.5 65.5 Zari 0.8 15.8 23.2 60.2 Carpets 5.3 23.6 46.5 24.6 Miscellaneous 11.0 35.7 36.2 17.2 Earthware 2.5 8.2 78.0 11.3 Plating 0.0 4.4 63.1 32.5 Jewellery 1.9 4.7 48.8 44.5 Musical instruments 0.0 39.4 16.2 44.3 Leather 0.0 51.1 14.8 34.2 Total Craft 3.1 18.6 50.2 28.1 ST: Scheduled Tribes, SC: Scheduled Caste, BC: Backward Class

86
Table B2.4g: Distribution Across Levels of Educational Attainment (percentage)
Handicraft Item Not literate
Literate Primary Middle Secondary Higher secondary
Khadi 24.9 10.1 22.8 17.9 10.5 13.5 Cotton handloom 22.4 17.4 22.4 22.7 9.5 5.4 Silk handloom 33.0 16.4 23.1 15.9 8.7 2.6 Cotton textile 11.4 21.6 16.6 12.9 15.4 20.9 Silk textile 25.4 0.0 0.0 0.0 40.7 33.9 Zari 36.1 14.2 21.9 15.2 7.1 5.6 Carpets 45.7 15.3 16.0 14.3 3.8 4.4 Miscellaneous 48.6 14.5 16.9 12.9 3.4 3.5 Earthware 58.0 13.3 11.1 11.7 2.9 2.7 Plating 4.5 10.4 16.2 28.3 22.2 18.4 Jewellery 8.9 11.0 19.5 28.6 17.7 13.5 Musical instruments 17.0 26.7 11.3 28.8 16.2 0.0 Leather 19.7 8.9 16.6 27.1 12.2 15.3 Total Craft 30.0 14.2 19.2 19.1 9.3 7.8

87
Table B2.4h: Crafts Population Across States and Share of Urban and Women Population
States Total Craft
Population
Proportion of Urban in total Crafts
Proportion of Women
in total Crafts
Distribution of Crafts
Population Across States
Proportion of Crafts
Population in each State
Thousands Percentage Jammu & Kashmir 146 29.0 33.9 1.3 6.2 Himachal Pradesh 18 12.5 53.6 0.2 0.6 Punjab 153 61.6 21.4 1.3 1.5 Chandigarh 4 29.3 0.0 0.0 1.2 Uttaranchal 6 15.6 38.6 0.0 0.2 Haryana 155 52.2 11.7 1.3 1.7 Delhi 171 100.0 6.9 1.5 4.2 Rajasthan 638 42.2 26.1 5.5 2.6 Uttar Pradesh 1922 38.8 36.6 16.7 3.2 Bihar 220 7.5 18.1 1.9 1.0 Sikkim 0.3 33.2 0.0 0.0 0.2 Arunachal Pradesh 2 7.9 0.0 0.0 0.5 Nagaland 16 10.0 85.2 0.1 4.2 Manipur 26 32.3 84.1 0.2 3.2 Mizoram 0.5 100.0 67.3 0.0 0.2 Tripura 11 10.8 0.0 0.1 0.9 Meghalaya 27 0.2 0.0 0.2 2.6 Assam 88 3.8 47.2 0.8 0.9 West Bengal 1200 33.8 37.9 10.4 3.9 Jharkhand 184 13.5 45.1 1.6 1.9 Orissa 565 3.1 46.5 4.9 3.3 Chhattisgarh 97 23.9 46.0 0.8 0.9 Madhya Pradesh 274 49.3 28.3 2.4 1.0 Gujarat 1390 62.5 11.6 12.1 6.2 Daman & Diu 0.5 63.0 0.0 0.0 0.9 Dadra & Nagar Haveli 1 9.3 0.0 0.0 1.2 Maharashtra 873 76.8 11.4 7.6 2.0 Andhra Pradesh 989 40.3 40.4 8.6 2.7 Karnataka 470 55.1 31.5 4.1 1.9 Goa 2 100.0 0.0 0.0 0.6 Lakshadweep 0.1 0.0 0.0 0.0 0.2 Kerala 199 32.2 38.6 1.7 1.5 Tamil Nadu 1658 42.8 37.4 14.4 6.0 Pondicherry 13 57.6 25.7 0.1 3.9 All India 11519 43.6 31.0 100.0 2.8

88
Table B2.5: Comparisons Across Databases and Definitions Percentage of Crafts Population in Total Working Population
States CCI-Census CCI-NSSO DC-H-NSSO LR-NSSO Jammu & Kashmir 3.2 8.1 6.1 6.2 Himachal Pradesh 3.5 1.9 0.5 0.6 Punjab 3.9 4.0 1.8 1.5 Chandigarh 3.2 2.9 0.7 1.2 Uttaranchal 3.4 0.9 0.3 0.2 Haryana 4.1 4.6 1.0 1.7 Delhi 4.2 6.7 4.8 4.2 Rajasthan 5.2 3.0 1.3 2.6 Uttar Pradesh 5.1 5.5 3.2 3.2 Bihar 3.9 2.1 0.8 1.0 Sikkim 2.5 1.1 0.1 0.2 Arunachal Pradesh 1.7 0.4 0.1 0.5 Nagaland 1.5 6.4 4.3 4.2 Manipur 3.8 4.9 4.4 3.2 Mizoram 2.0 1.0 0.1 0.2 Tripura 2.8 2.3 0.7 0.9 Meghalaya 2.1 3.0 2.2 2.6 Assam 2.3 1.7 0.8 0.9 West Bengal 4.6 4.6 3.0 3.9 Jharkhand 4.3 2.6 1.8 1.9 Orissa 3.7 5.8 2.7 3.3 Chhattisgarh 3.8 1.8 1.1 0.9 Madhya Pradesh 3.7 2.3 1.4 1.0 Gujarat 5.6 7.3 4.7 6.2 Daman & Diu 7.9 1.6 0.9 0.9 Dadra & Nagar Haveli 7.6 10.8 2.8 1.2 Maharashtra 4.2 3.6 1.3 2.0 Andhra Pradesh 4.2 3.4 2.2 2.7 Karnataka 3.8 2.6 1.3 1.9 Goa 3.1 1.5 0.6 0.6 Lakshadweep 4.2 0.2 0.2 0.2 Kerala 5.5 3.8 1.8 1.5 Tamil Nadu 3.8 8.6 4.7 6.0 Pondicherry 2.6 6.1 2.5 3.9 All India 4.4 4.0 2.3 2.8
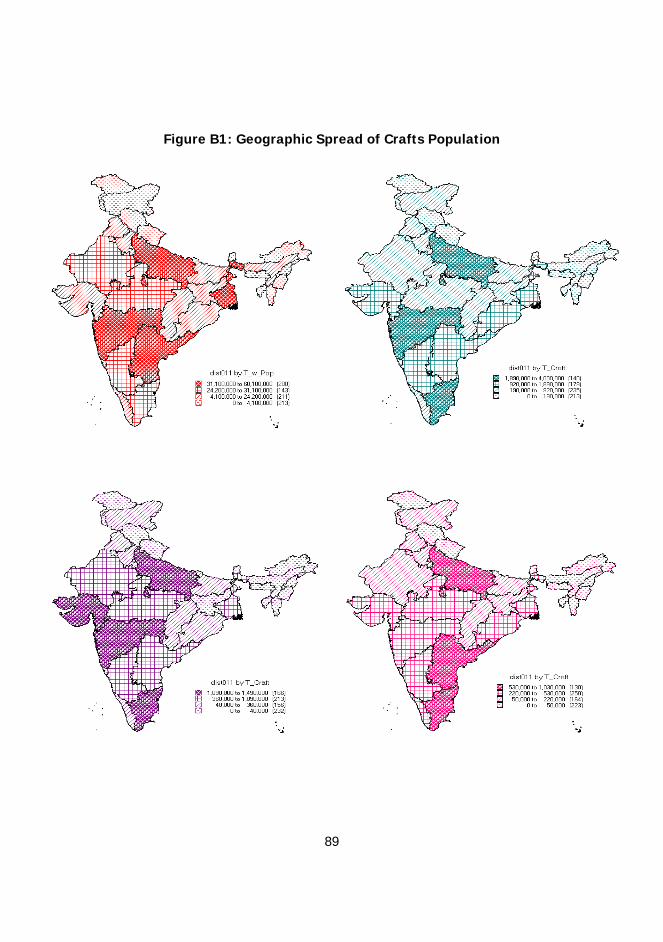
89
Figure B1: Geographic Spread of Crafts Population
(a) Total working Population (b) Crafts Population: Total
(a) Crafts Population: Urban (b) Crafts Population: Women

*Corporate Governance and Product Market CompetitionEkta Selarka
* Working Paper 68/2012Basel l and Basel ll Compliance: Issues for Banks in India Sreejata Banerjee
* Working Paper 69/2012The Distributional Impacts of Climate Change on Indian Agriculture: A Quantile Regression ApproachChandra Kiran B Krishnamurthy
* Working Paper 70/2012Efficiency of Raising Health Outcomes in the Indian StatesPrachitha J. and K. R. Shanmugam
* Working Paper 71/2012Compensating Wages for Occupational Risks of Farm Workers in IndiaP.Indira Devi, K.R. Shanmugam, M.G.Jayasree
* Working Paper 72/2012Stationarity Test for Aggregate Outputs in the Presence of Structural BreaksD.K. Srivastava and K.R. Shanmugam
* Working Paper 73/2012Assessing Farmer's Willingness to Participate in the On-farm Conservation of Minor Millet using Direct Compensation PaymentPrabhakaran T. Raghu, Sukanya Das, S. Bala Ravi and E.D.Israel Oliver King
* Working Paper 74/2012Health Policy, Inequity and Convergence in IndiaBrijesh C. Purohit
* Working Paper 75/2012Addressing Long-term Challenges to Food Security and Rural Livelihoods in South AsiaK.S. Kavi Kumar, Kamal Karunagoda, Enamul Haque, L. Venkatachelam and Girish Nath Bahal
* Working Paper 76/2012Science and Economics for Sustainable Development of IndiaU. Sankar
* Working Paper 77/2013Revisiting the Growth-Inflation Nexus: A Wavelet Analysis Saumitra N Bhaduri
Working Paper 67/2012
MSE Working Papers Recent Issues
* Working papers are downloadable from MSE website http://www.mse.ac.in $ Restricted circulation

MSE Monographs *
Taxation of Goods and Services in IndiaD.K.Srivastava and C.Bhujanga Rao
* Monograph 12/2011Coping with Pollution: Eco Taxes in a GST RegimeD.K. Srivastava, K.S. Kavi Kumar and C. Bhujanga Rao, with inputs from Brijesh C. Purohit and Bodhisattva Sengupta
* Monograph 13/2011Recent Bouts of Inflation in India: Policy Paralysis?T.N. Srinivasan
* Monograph 14/2011Impact of Fiscal Instruments in Environmental Management through a Simulation Model: Case Study of IndiaD.K. Srivastava and K.S. Kavi Kumar, with inputs from Subham Kailthya and Ishwarya Balasubramaniam
* Monograph 15/2012Environmental Subsidies in India: Role and ReformsD.K. Srivastava, Rita Pandey and C. Bhujanga Rao, with inputs from Bodhisattva Sengupta
* Monograph 16/2012Integrating Eco-Taxes in the Goods and Services Tax Regime in IndiaD.K. Srivastava and K.S.Kavi Kumar
* Monograph 17/2012Monitorable Indicators and Performance: Tamil NaduK. R. Shanmugam
* Monograph 18/2012Performance of Flagship Programmes in Tamil NaduK. R. Shanmugam, Swarna S Vepa and Savita Bhat
* Monograph 19/2012State Finances of Tamil Nadu: Review and ProjectionsA Study for the Fourth State Finance Commission of Tamil NaduD.K. Srivastava and K. R. Shanmugam
* Monograph 20/2012Globalization and India's Fiscal Federalism: Finance Commission's Adaptation To New ChallengesBaldev Raj Nayar
* Monograph 21/2012On the Relevance of the Wholesale Price Index as a Measure of Inflation in IndiaD.K.Srivastava and K.R.Shanmugam
* Monograph 22/2012A Macro-Fiscal Modeling Framework for Forecasting and Policy Simulations D.K.Srivastava, K.R.Shanmugam and C. Bhujanga Rao
* Monograph 23/2012Green Economy – Indian PerspectiveK.S. Kavikumar, Ramprasad Sengupta, Maria Saleth, K.R.Ashok and R.Balasubramanian
* Monograph 24/2013Estimation and Forecast of Wood Demand and Supply in TamilanduK.S. Kavi Kumar, Brinda Viswanathan and Zareena Begum I
Monograph 11/2011
MADRAS SCHOOL OF ECONOMICSGandhi Mandapam Road
Chennai 600 025 India
February 2013
MONOGRAPH 25/2013
Brinda Viswanathan
ENUMERATION OF CRAFTS PERSONS IN INDIA