mso spent salt clean-up/recovery process
TRANSCRIPT
Lawre
nce
Liverm
ore
National
Labora
tory
UCRL-ID-126437
MSO Spent Salt Clean-Up/Recovery Process
P.C. HsuL.J. Summers
E.H. von HoltzW.A. Brummond
F.T. WangM.G. Adamson
February 1, 1997
This is an informal report intended primarily for internal or limited external distribution. The opinions and conclusions stated are those of the author and may or may not be those of the Laboratory.Work performed under the auspices of the U.S. Department of Energy by the Lawrence Livermore National Laboratory under Contract W-7405-ENG-48.

DISCLAIMER
This document was prepared as an account of work sponsored by an agency of the United StatesGovernment. Neither the United States Government nor the University of California nor any of theiremployees, makes any warranty, express or implied, or assumes any legal liability or responsibility forthe accuracy, completeness, or usefulness of any information, apparatus, product, or process disclosed,or represents that its use would not infringe privately owned rights. Reference herein to any specificcommercial product, process, or service by trade name, trademark, manufacturer, or otherwise, doesnot necessarily constitute or imply its endorsement, recommendation, or favoring by the United StatesGovernment or the University of California. The views and opinions of authors expressed herein donot necessarily state or reflect those of the United States Government or the University of California,and shall not be used for advertising or product endorsement purposes.
This report has been reproduceddirectly from the best available copy.
Available to DOE and DOE contractors from theOffice of Scientific and Technical Information
P.O. Box 62, Oak Ridge, TN 37831Prices available from (423) 576-8401
Available to the public from theNational Technical Information Service
U.S. Department of Commerce5285 Port Royal Rd.,
Springfield, VA 22161

___________________________*This work was performed under the auspices of the U.S. Department of Energy by theLawrence Livermore National Laboratory under contract number W-7405-ENG-48.
MSO Spent Salt Clean-Up/Recovery Process *
Peter C. Hsu, Leslie Summers, Erica von Holtz,David Hipple, William Brummond,Francis Wang, and Martyn Adamson
Lawrence Livermore National LaboratoryP.O. Box 808
Livermore, CA 94551-0808
Abstract
An effective process has been developed to separate metals, mineral residues,and radionuclides from spent salt, a secondary waste generated by Molten SaltOxidation (MSO). This process includes salt dissolution, pH adjustment,chemical reduction and/or sulfiding, filtration, ion exchange, and drying.The process uses dithionite to reduce soluble chromate and/or sulfiding agentto suppress solubilities of metal compounds in water. This process is capableof reducing the secondary waste to less than 5% of its original weight. It is alow temperature, aqueous process and has been demonstrated in thelaboratory [1].
Introduction
Molten Salt Oxidation (MSO) is a thermal process that has the inherentcapability of completely destroying organic constituents of mixed wastes,hazardous wastes, and energetic materials [2,3]. MSO is ideally suited to thedestruction of organic waste in the form of gases, liquids, slurries, sludges,and solids on the order of 6 mm or less [4].
The MSO system consists of a reactor vessel, off-gas treatment, and saltseparation process. In our current design, the reactor contains a turbulent bedof molten sodium carbonate which is used as a heat transfer and reactionmedium. Oxidant air is injected into the salt bath along with the wastestream. The waste reacts, converting organic components of the waste intocarbon dioxide, nitrogen, and water. Elements like halogens and sulfur,which would otherwise be converted into acid gases, are “scrubbed” andtrapped in the salt in forms such as sodium chloride and sodium sulfate.Radionuclides, metals and other non-oxidizable inorganic constituents thatmay be in the waste form are captured and held in the salt bath for futuredisposal. Equations 1-3 provide generic examples of principal reactions [4]:
C H N O aCO H O Na b cb cexcess+ → + +2 2 2 2 2 2( )
(1)
2
C H X Na CO O aCO H O NaXa bbexcess excess+ + → + +2 3 2 2 2 2( ) ( )
(2)
C H M Na CO O aCO H O M MO Na MOa bb
x yexcess excess+ + + → + +2 3 2 2 2 2( ) ( ) / / (3)
where X represents halogens and M represents metals.
Spent Salt Clean-Up/Recovery Process
As the MSO system continues to run, inorganic products resulting from thereaction of halides, sulfides, phosphates, metals, etc., with carbonate build upin the salt bath. These must be removed to prevent complete conversion ofthe sodium carbonate, which would result in eventual losses of destructionefficiency and acid scrubbing capability. When the MSO reactor is used tooxidize combustible solids, “ash” (e.g. mineral residues such as Al2O3 andSiO2) will build up in the salt melt and increase the viscosity of the melt.High viscosity will affect destruction efficiency; at this point the salt must bewithdrawn and the ash removed.
There are two operational modes for salt removal: (1) during reactoroperation a slip-stream of salt melt is continuously withdrawn withcontinuous replacement by carbonate, or (2) the spent salt melt is dischargedcompletely and the reactor then refilled with carbonate in batch mode.Because many of the metals and/or radionuclides captured in the salt arehazardous and/or radioactive, without further treatment the removed spentsalt would create a large secondary waste stream. A spent salt clean-up/recovery system will segregate these materials and minimize the amountof secondary waste. These materials can then be encapsulated for finaldisposal.
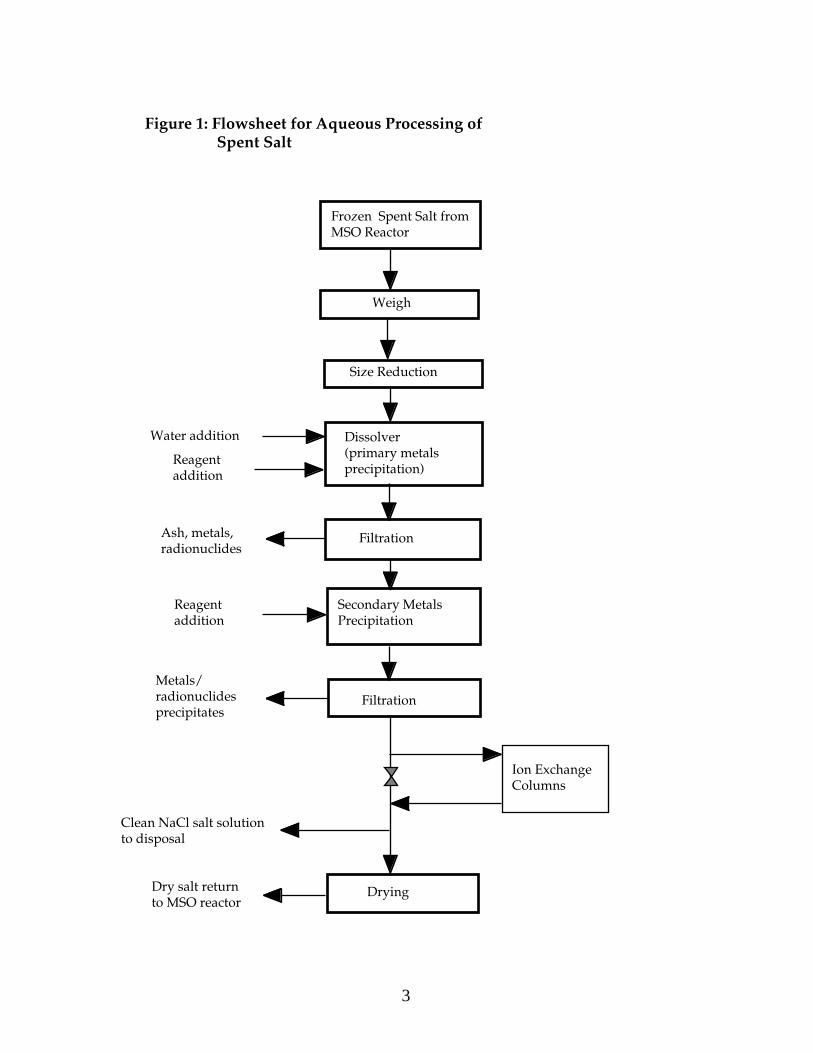
Figure 1 shows the block flow diagram of spent salt cleanup/recovery system.Salt melt withdrawn from MSO reactor is frozen and cooled to ambienttemperature. Depending the type of salt freezer used, further size reduction isgenerally required to reduce the size of spent salt particles to about 6 -12 mmbefore processing the salt in the salt clean-up step. Small spent salt particlesare preferred to reduce the dissolution time; Table 1 shows salt dissolutiontime in room temperature water as a function of particle size. Salt used inthis study contained 10 mole% sodium chloride and 90 mole% sodiumcarbonate, dissolved in 30% excess water while mixing at 400 rpm.
Figure 2 is a picture of the spent salt used with an average particle size ofabout 12 mm. From the data in Table 1, about 30 minutes would be needed todissolve this spent salt.
3
Figure 1: Flowsheet for Aqueous Processing of Spent Salt
Dissolver (primary metals precipitation)
Reagent addition
Reagent addition
Water addition
Secondary Metals Precipitation
Ion Exchange Columns
Metals/ radionuclides precipitates
Filtration
Filtration
Clean NaCl salt solution to disposal
Dry salt returnto MSO reactor
Ash, metals, radionuclides
Drying
Frozen Spent Salt from MSO Reactor
Size Reduction
Weigh


5
Table 1: Dissolution Time of High Carbonate Spent Salt in RoomTemperature Water
Particle size Dissolution time
≤ 1.2 mm < 15 minutes1.2 - 3.3 mm < 15 minutes3.3 - 5.6 mm < 15 minutes
≥ 5.6 mm < 30 minutes
Fig. 3 Concentration as a Function of pH
0.00001
0.0001
0.001
0.01
0.1
1
10
100
1000
10000
100000
4 5 6 7 8 9 10 11 12
pH
Sol
uble
Met
al S
peci
es C
once
ntra
tion
(mg/
L)
Zinc Hydroxide
Beryillium HydroxideCadmium Hydroxide
Chromium HydroxideCopper (II) Hydroxide
Lead HydroxideNickel Hydroxide
Silver HydroxideMercury (II) Hydroxide
Uranyl HydroxidePlutonium Dioxy Dihydroxide
Most of mineral residues in the spent salt have low solubilities in water,depending on solution pH values, and will precipitate as metal oxides andmetal hydroxides during the dissolution step. Figure 3 shows solubilities ofseveral metal species in water at room temperature [5]. Although solubilitiesvary greatly with solution pH values, most metal species are less soluble inalkaline solutions. Table 2 shows optimum pH value that will minimize thesolubility for each metal species in the solution. Therefore, it is desirable tomaintain the solution pH values in the dissolver above 8 to minimize theconcentrations of soluble metal species in the solution.

6
Table 2: pH Values for Minimum Solubility [5]
Metal species pH at minimum solubility Beryllium 9.2Cadmium 11.6Chromium (Cr3+) 8.0Copper 9.0Lead 10.6Mercury 14.0Nickel 10.8Plutonium 7.8Silver 14.0Uranium 6.2
Zinc 9.4
Most of metal sulfides have much lower solubilities than metal oxides andhydroxides in water. In order to further suppress the concentrations of metalspecies in the solution, sulfiding the solution with certain reagents may beneeded. An aqueous process modeling code, EQ3/6, developed by Wolery [6],was used to simulate the sulfiding process for a spent salt solution containingions of carbonate, chloride, zinc, nickel, chromate, copper, cobalt, arsenic, andsilver. Sodium hydrogen sulfide, NaSH, was used as the sulfiding agent.Table 3 shows that the concentrations of metal ions in the salt solution afterthe sulfiding process are reduced by several orders of magnitude. Duringsuch a process, however, care must be taken in equipment design to properlyvent the emission of H2S, a by-product of the sulfiding reaction.
Table 3: Effect of Sulfiding
Concentration of ions in solution*, ppm Metal Before sulfiding After sulfiding
As 12.7 4.5x10⁻⁴
Cr 177.0 6.8x10⁻⁹
Co 6.4 9.9x10⁻⁵
Cu 0.86 3.5x10⁻¹³
N i 6.6x10⁻³ 1.9x10⁻¹²
Ag 2.57 1.1x10⁻¹³
Zn 1.9x10⁻⁴
4.3x10⁻¹⁴
* at room temperature with solution pH value at 11 [7]

7
Addition of other reagents may be required in separate steps to convert thevalence state of dissolved metals into insoluble forms. For example, use ofdithionite in the secondary metals precipitation step reduces soluble Cr6+ toCr3+, with subsequent formation of the insoluble species Cr(OH)3/Cr2O3.Solubilities of chromium hydroxide and chromium oxide vary with pH, butare very low in alkaline solutions.
As the metals come out of solution in all stages, they tend to form submicronsize particles. Reagents such as Alum [Al2(SO4)3] can be very effective infacilitating the coagulation & precipitation process to avoid an excessiveholding time in the dissolver tank. The addition of coagulant aids such asactivated silica will enhance coagulation by promoting the growth of large,rapid-settling flocs. Activated silica is a short-chain polymer that serves tobind together particles of microfine aluminum hydrate. Table 4 shows thatalum and activated silica reduce the time required for the start ofprecipitation from 85 minutes to 25 minutes for a spent salt containing 20%NaCl, 78.8% Na2CO3, and 0.2% Na2CrO4 dissolved in water with 1% dithioniteadded for the chrome reduction.
Table 4: Time Required for Precipitation is Reduced With Addition of Alumand Activated Silica
Coagulant Coagulant aid Al2(SO4)3 SiO2 Time,
Run ID g/100 mL soln g/100 mL soln minutes S 0 0 85 C1 0.015 0.001 75 C2 0.15 0.01 25
Filtration of the salt solution occurs after initial dissolution, for“ash”/mineral residue removal, and after addition of reagents to furtherremove dissolved metal species. Selection of an appropriate filter element iscrucial for complete capture of suspended solid particles. The pore size of thefilter element should be one micron or less for high capture efficiency.
After the secondary metals precipitation and subsequent filtration, the saltsolution is very clean and contains mostly carbonate with low halides contentand very low metals content. The solution can then be dried and reused.
If the waste feed to MSO reactor is halogen-rich, sodium carbonate isessentially all converted to various sodium halides. When less than 10% ofthe salt melt is sodium carbonate, the melt’s acid gas scrubbing capability andoxidation efficiency drop significantly, and the melt needs to be withdrawn
8
and replaced. Because of its low carbonate content, heating the dissolver orusing warm water for salt dissolution will facilitate the process. Processing ofthe high-halide spent salt is similar to that of high-ash spent salt with theexception that the salt solution may be a weak alkaline solution or weakacidic solution. Solution pH values need to be carefully adjusted to improveremoval efficiencies of metal species; addition of NaOH or HCl may be used ifnecessary. After the secondary metals precipitation and the subsequentfiltration, the salt solution contains mostly halides with low carbonatecontent and very low metals content which can be discharged to disposalfacility.
If the MSO reactor oxidizes waste feed which contains radionuclides, theradionuclides will be captured and held in the salt. Most radioactivecompounds would co-precipitate with ash/mineral residue and will beremoved from the salt solution after the dissolution and first filtration step.Some radionuclides, such as thorium and uranium, may form complex ionsand stay in the solution. For example, predictions using EQ 3/6 indicate onthe order of 300 ppm of uranium, as UO2(CO3)3
4- , would remain in carbonatesolution [7]. However, most uranium can be removed in the secondarymetals precipitation step by adding complex ion breakers and/or reducingagents [8]. An ion exchange column is also needed to further removedradionuclides from the solution. A variety of commercial ion exchangeresins are available; selection of the best resin will be done based onradionuclide content of the waste [9].
EDU Spent Salt Clean-Up Experiment and Results
LLNL built an engineering development unit (EDU, a MSO reactor) in 1995with salt bed capacity of up to 100 kg. It has been run for several hundredhours using various feed materials, including chlorinated hydrocarbons, withgood results. The chloride content in the salt bed of EDU was brought to > 90wt% as a result of oxidizing chlorinated organic liquids. The spent salt fromEDU served as an excellent source of material for developing anddemonstrating an efficient spent salt clean-up process.
1. Salt Freezing, Grinding, and Analysis
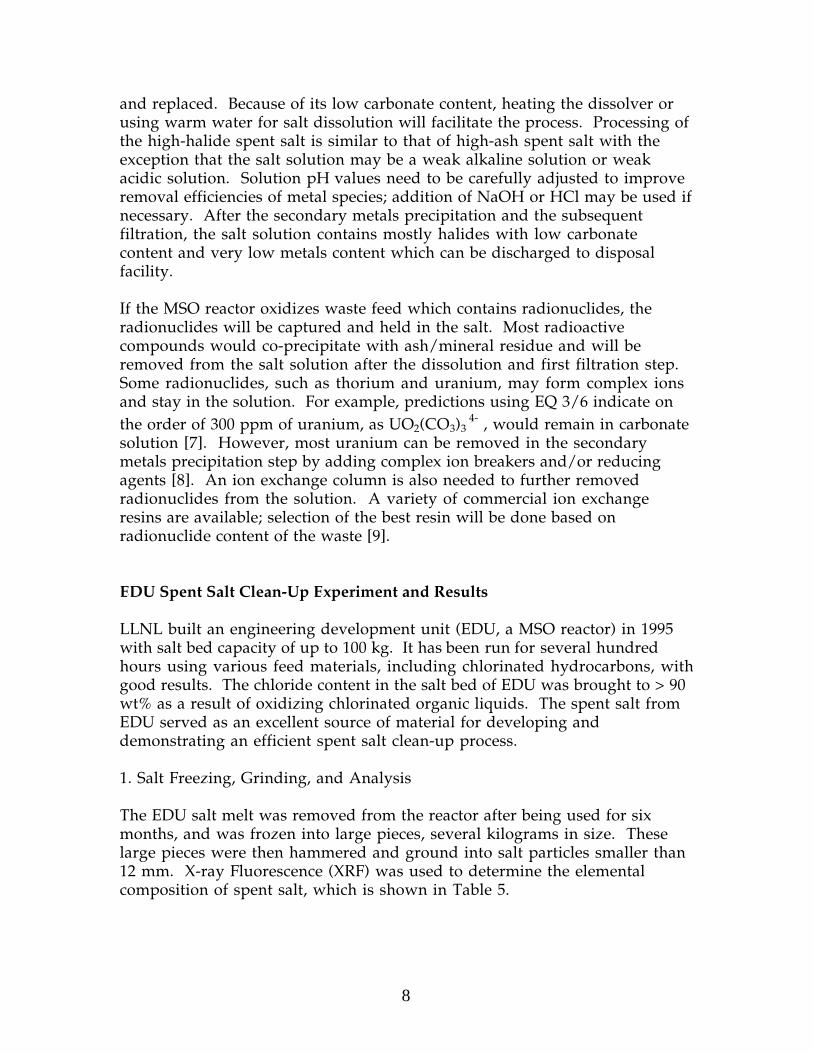
The EDU salt melt was removed from the reactor after being used for sixmonths, and was frozen into large pieces, several kilograms in size. Theselarge pieces were then hammered and ground into salt particles smaller than12 mm. X-ray Fluorescence (XRF) was used to determine the elementalcomposition of spent salt, which is shown in Table 5.

9
Table 5: Elemental Composition of EDU Spent Salt
Element Composition, wt% Element Composition, wt%
C 0.99 O 1.98Na 38.69 Si 0.04P 0.01 S 0.08Cl 57.54 K 0.01V 0.014 Cr 0.48M n 0.03 Fe 0.04N i 0.04 Cu 0.03Br 0.00 Mo 0.02Pt 0.01
Table 5 indicates that the spent salt contains about 95 wt% sodium chloridealong with minor amounts of several metals. The metallic elements in thespent salt are mostly from the corrosion of the Inconel 600 reactor andinternal components such as stainless steel baffles. Although the percentageof metals in the spent salt is only about 1 wt%, it can be further reduced byusing Inconel as the construction materials for internal components. Manyof the metals present are at levels exceeding the RCRA land-ban criteria andthis salt would be considered a hazardous waste if disposed of without furtherclean-up.
2. Dissolution of Spent Salt
Figure 4 depicts the flowsheet for the lab-scale clean-up experiment. Fourhundred grams of ground spent salt was dissolved into 1500 mL of ambientdeionized water with agitation in a 2 L glass beaker. The dissolution took lessthan 30 minutes, with no appreciable temperature rise – an indication of verylow carbonate content in the spent salt. The solution was dark in color, withsuspended particles of metal hydroxides and metal oxides (Figure 5, left). Thesolution was slightly acidic (pH value of 6.2), probably due to the presence ofmetal ions. A portable colorimeter, along with several analytical kits whichare inexpensive, fast, and fairly accurate, were used to analyze ionconcentrations in the solution. Formation, coagulation, and precipitation ofmetal hydroxides/metal oxides may be slow; consequently, soluble metal ionconcentrations may vary with time. Solution analysis should be done beforedeciding whether sulfiding is required. To establish a baseline, no initialsulfiding was done while the solution was allowed to settle for 40 hoursbefore filtration. The solution was analyzed at 1 hour, 22 hours and 40 hours;the results are shown in Table 6.

10
Figure 4: Flowsheet for EDU Spent Salt Cleaning
Water Solution 1EDU Spent Dissolution Filtration 1Salt
Wet Solid Solution 2
Solid 1 Drying 1
Reagents Chromate Removal
Wet Solid Solid 2 Drying 2 Filtration 2
Solution 3
EDU Clean Drying 3 Salt

12
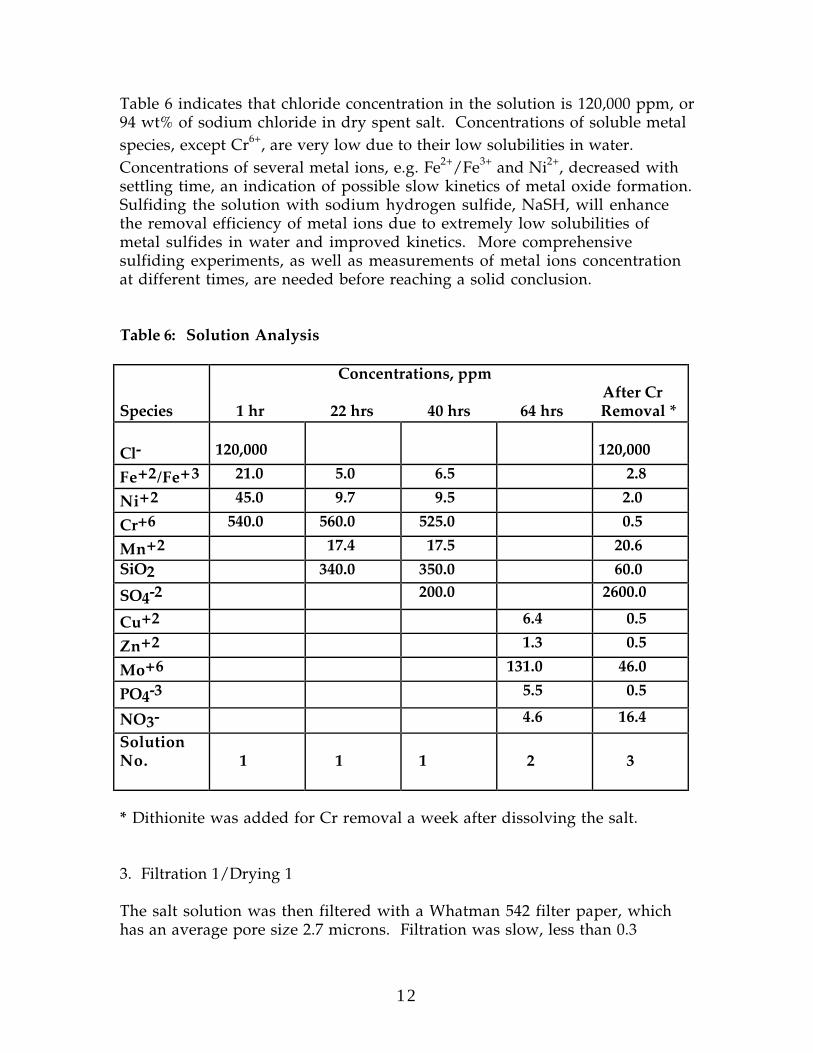
Table 6 indicates that chloride concentration in the solution is 120,000 ppm, or94 wt% of sodium chloride in dry spent salt. Concentrations of soluble metalspecies, except Cr6+, are very low due to their low solubilities in water.Concentrations of several metal ions, e.g. Fe2+/Fe3+ and Ni2+, decreased withsettling time, an indication of possible slow kinetics of metal oxide formation.Sulfiding the solution with sodium hydrogen sulfide, NaSH, will enhancethe removal efficiency of metal ions due to extremely low solubilities ofmetal sulfides in water and improved kinetics. More comprehensivesulfiding experiments, as well as measurements of metal ions concentrationat different times, are needed before reaching a solid conclusion.
Table 6: Solution Analysis
Species
Concentrations, ppm After Cr 1 hr 22 hrs 40 hrs 64 hrs Removal *
Cl- 120,000 120,000
Fe+2/Fe+3 21.0 5.0 6.5 2.8
Ni+2 45.0 9.7 9.5 2.0
Cr+6 540.0 560.0 525.0 0.5
Mn+2 17.4 17.5 20.6
SiO2 340.0 350.0 60.0
SO4-2 200.0 2600.0
Cu+2 6.4 0.5
Zn+2 1.3 0.5
Mo+6 131.0 46.0
PO4-3 5.5 0.5
NO3- 4.6 16.4
SolutionNo. 1 1 1 2 3
* Dithionite was added for Cr removal a week after dissolving the salt.
3. Filtration 1/Drying 1
The salt solution was then filtered with a Whatman 542 filter paper, whichhas an average pore size 2.7 microns. Filtration was slow, less than 0.3
13
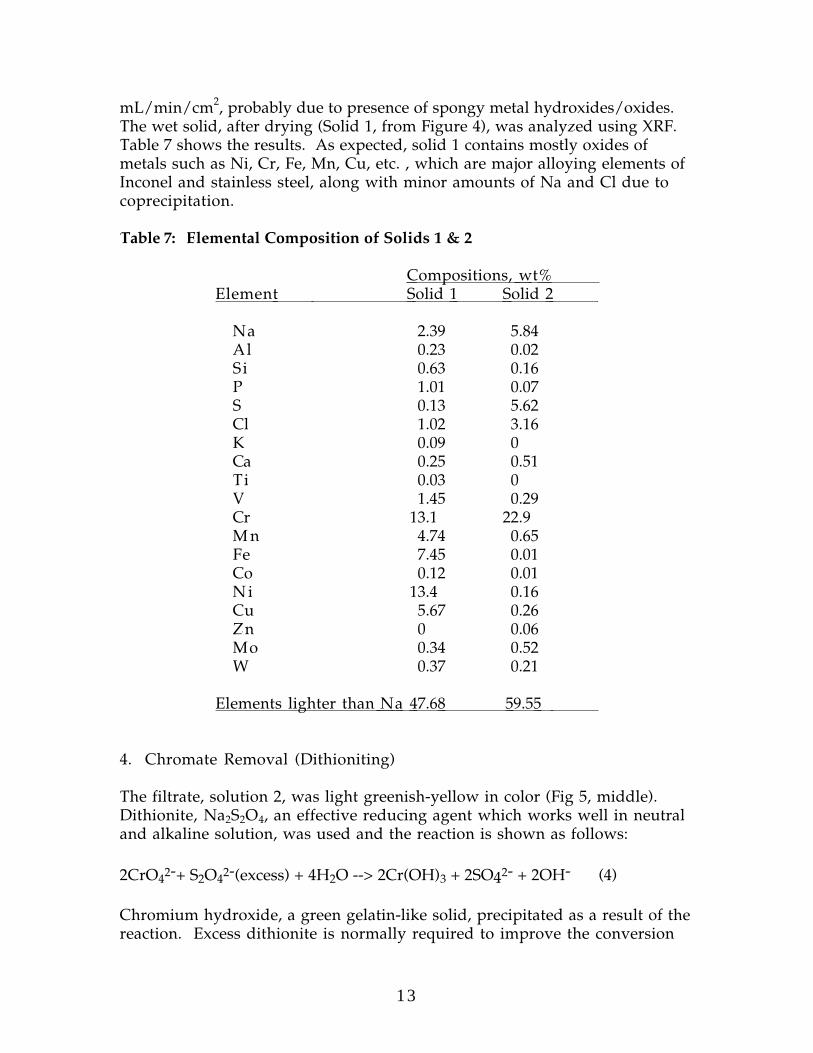
mL/min/cm2, probably due to presence of spongy metal hydroxides/oxides.The wet solid, after drying (Solid 1, from Figure 4), was analyzed using XRF.Table 7 shows the results. As expected, solid 1 contains mostly oxides ofmetals such as Ni, Cr, Fe, Mn, Cu, etc. , which are major alloying elements ofInconel and stainless steel, along with minor amounts of Na and Cl due tocoprecipitation.
Table 7: Elemental Composition of Solids 1 & 2
Compositions, wt% Element Solid 1 Solid 2
Na 2.39 5.84 Al 0.23 0.02 Si 0.63 0.16 P 1.01 0.07 S 0.13 5.62 Cl 1.02 3.16 K 0.09 0 Ca 0.25 0.51 Ti 0.03 0 V 1.45 0.29 Cr 13.1 22.9 M n 4.74 0.65 Fe 7.45 0.01 Co 0.12 0.01 N i 13.4 0.16 Cu 5.67 0.26 Zn 0 0.06 Mo 0.34 0.52 W 0.37 0.21
Elements lighter than Na 47.68 59.55
4. Chromate Removal (Dithioniting)
The filtrate, solution 2, was light greenish-yellow in color (Fig 5, middle).Dithionite, Na2S2O4, an effective reducing agent which works well in neutraland alkaline solution, was used and the reaction is shown as follows:
2CrO42-+ S2O42-(excess) + 4H2O --> 2Cr(OH)3 + 2SO42- + 2OH- (4)
Chromium hydroxide, a green gelatin-like solid, precipitated as a result of thereaction. Excess dithionite is normally required to improve the conversion

14
efficiency. For the current experiment, 8X stoichiometry was used and theresult was excellent, as shown in Table 6. Concentration of Cr6+ dropped to< 1 ppm from > 500 ppm. Table 6 also shows that sulfate ions in the solution,a benign species which should not be a concern, increased from 200 ppm to2600 ppm after the dithioniting step. The result indicates that dithioniting isan excellent means to remove chromium from the solution.
5. Filtration 2/Drying 2 &3
The solution was then filtered to remove chromium hydroxide with aWhatman 542 filter paper. Filtration speed was measured at about 1mL/min/cm2, which was faster than that of Filtration 1. The filter cake wasdried to Solid 2 at 100°C in an oven overnight and sent to AnalyticalLaboratory for XRF analysis. The composition of Solid 2 is also shown inTable 7. It indicates a high content of chromium in the solid, along withcoprecipitants such as sodium chloride and sodium sulfate. Quantities ofother metal species are small. Solid 1 and Solid 2 can be combined and sentfor disposal. In the MWMF project [2], these solids may containradionuclides, and would be encapsulated in a ceramic final form. Combinedweight of Solid 1 and Solid 2 was only about 4.3 grams, about 1.1 wt% of theweight of spent salt initially dissolved. This is a significant reduction in theamount of toxic material for disposal.
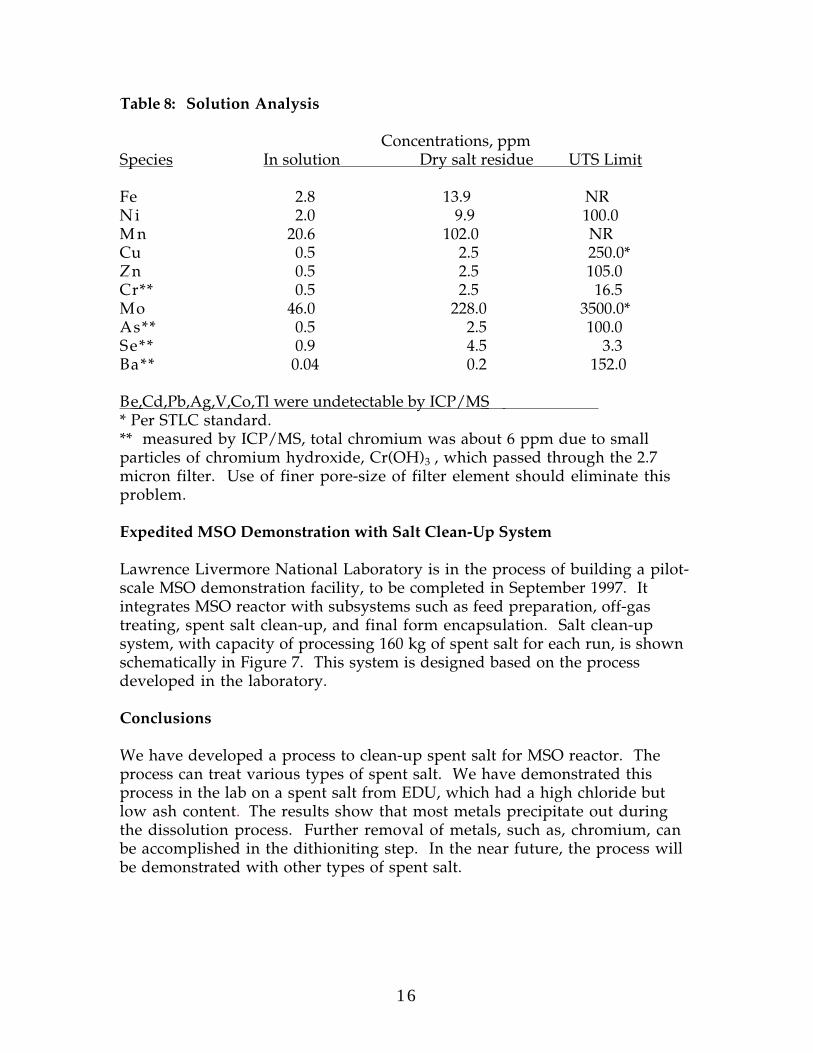
The filtrate, Solution 3 (shown in Figure 5, right), was clean and can be driedto yield clean salt. Table 8 shows concentrations of species after the clean-upprocess, along with the Universal Treatment Standards (UTS) for allowableland disposable level without polymer encapulation. It indicates thatselenium (Se) is the only component exceeding the disposable limt.Concentration of Se in the solution was 0.9 ppm (or 4.5 ppm on a dry basis)which was slightly higher than the UTS disposable limit of 3.3 ppm.
Figure 6 shows the pictures of spent salt (far left), solid 1 (black, middle left),solid 2 (green, middle right), clean salt (far right) along with solutions 1, 2,and 3.

16
Table 8: Solution Analysis
Species Concentrations, ppmIn solution Dry salt residue UTS Limit
Fe 2.8 13.9 NRN i 2.0 9.9 100.0M n 20.6 102.0 NRCu 0.5 2.5 250.0*Zn 0.5 2.5 105.0Cr** 0.5 2.5 16.5Mo 46.0 228.0 3500.0*As** 0.5 2.5 100.0Se** 0.9 4.5 3.3Ba** 0.04 0.2 152.0
Be ,Cd,Pb,Ag,V,Co,Tl were undetectable by ICP/MS * Per STLC standard.** measured by ICP/MS, total chromium was about 6 ppm due to smallparticles of chromium hydroxide, Cr(OH)3 , which passed through the 2.7micron filter. Use of finer pore-size of filter element should eliminate thisproblem.
Expedited MSO Demonstration with Salt Clean-Up System
Lawrence Livermore National Laboratory is in the process of building a pilot-scale MSO demonstration facility, to be completed in September 1997. Itintegrates MSO reactor with subsystems such as feed preparation, off-gastreating, spent salt clean-up, and final form encapsulation. Salt clean-upsystem, with capacity of processing 160 kg of spent salt for each run, is shownschematically in Figure 7. This system is designed based on the processdeveloped in the laboratory.
Conclusions
We have developed a process to clean-up spent salt for MSO reactor. Theprocess can treat various types of spent salt. We have demonstrated thisprocess in the lab on a spent salt from EDU, which had a high chloride butlow ash content. The results show that most metals precipitate out duringthe dissolution process. Further removal of metals, such as, chromium, canbe accomplished in the dithioniting step. In the near future, the process willbe demonstrated with other types of spent salt.
___________________________*This work was performed under the auspices of the U.S. Department of Energy by theLawrence Livermore National Laboratory under contract number W-7405-ENG-48.
Acknowledgments
Funding was provided by EM-30 under the Mixed Waste ManagementFacility project.
References
1. “Spent Salt Clean-up/Recovery Process Development for Molten SaltOxidation,” Peter C. Hsu, Erica H. von Holtz, David L. Hipple, Leslie J.Summers, and William A. Brummond, a patent disclosure, LLNL, May 1996
2. "Mixed Waste Management Facility," UCRL-Prop-116761, L-17293-1, April1994
3. "Design Parameters for Aqueous Processing of Melts from Molten SaltDestruction of Mixed Wastes," A. J. Darnell and R. L. Gay, MSDS-XY-0002,Energy Technology Engineering Center, Canoga Park, California, January 1991
4. "Development of Advanced Waste Treatment Technologies fordemonstration in the Mixed Waste Management Facility," M. G. Adamson,Z. Chiba, E. H. von Holtz, and R. D. Streit, pages 4.1.1-4.1.15,Proceedings of the Third Biennial Symposium, Baltimore, Maryland, August7-10, 1995
5. Private communications with John Bowers of LLNL, Nov., 1995
6. "EQ 3/6, A Software Package for Geochemical Modeling of AqueousSystems," Thomas J. Wolery, UCRL-MA-11062, Sept. 1992
7. "Process Modeling of Salt Recycle with EQ 3/6", upcoming report by P. C.Hsu, D. A. Jones, D. L. Hipple, E. H. von Holtz, and Martyn Adamson
8. "Uranium Removal in the Spent Salt Cleanup Process for Molten SaltOxidation, " P.C. Hsu, L. Summer, E.H. von Holtz, D. Hipple, and MartynAdamson, to be presented in the AIChE Spring National Meeting, Houston,March 1997
9. "Distributions of 14 Elements on 63 Absorbers from Three SimulantSolutions (Acid-Dissolved Sludge, Acidified Supernate, and AlkalineSupernate) for Hanford HLW Tank 102-SY," S. F. Marsh, Z. V. Svitra, andS. M. Bowen, LA-12654, Rev. 1, Los Alamos National laboratory, Los Alamos,NM, August 1994