mt. san antonio community college district strs/pers trust
TRANSCRIPT

Mt. San Antonio Community College District STRS/PERS Trust
1st Fiscal QTR 7/1/20 – 9/30/20
Fiscal YTD 7/1/19 – 9/30/20
Inception to Date (Inception Date 6/24/16)
Beginning Market Value$ 10,849,558.76 $ 10,849,558.76 $ 4,000,000.00
Net Cont./Dist./Fees$ (5,340.16) $ (5,340.16) $ 5,965,928.51
Investment G/L$ 543,606.81 $ 543,606.81 $ 1,421,896.90
Ending Market Value$ 11,387,825.41 $ 11,387,825.41 $ 11,387,825.41
This information is intended for informational purposes and is believed to be reliable as of the date of its preparation; however, we can make no guarantee as to its accuracy or completeness. This report is prepared as a courtesy to the client and is not intended to be a substitute for official account statements. You are encouraged to review your official account statement(s) received from the account custodians. In the event of a discrepancy between your account statement(s) and this report, the official account statement shall prevail. You are encouraged to bring any discrepancies to the attention of your Financial Advisor.
Certain values were provided by an external source and/or you, the client. This information has not been validated; please refer to your custodial account statement(s) for accurate and detailed information. As D.A. Davidson & Co. is not affiliated with these accounts, questions may be outside the expertise of your Financial Advisor. These assets are not held on the books and records of D.A. Davidson & Co. and may not be covered by SIPC.
Estimated Annual Income - $456,134.69 *Per Citizens Bank Estimated Income Statement
Ending Accrued Income Value - $72,986.52

Enclosed please find your quarterly performance review from D.A. Davidson & Co. If you have had any change in your financial situation or investment objectives, please contact your Financial Advisor at your earliest convenience. The advisoryfee is reflected on your periodic account statement. This document is available for eDelivery. If you are interested in eDelivery, please contact your Financial Advisor or visit www.dadavidson.com.
Portfolio ReviewJuly 1, 2019- September 30, 2020
Prepared for
MT SAN ANTONIO COLLEGE | MT SAN ANTONIO COLLEGESTRS/PERS Pension Section 115 Trust
Advisor
STEVEN STAHLBERGD.A. Davidson & Co.

MT SAN ANTONIO COLLEGE | MT SAN ANTONIO COLLEGE STRS/PERS Pension Section 115 Trust Data from Jul 1, 2019-Sep 30, 2020 1
Account OverviewCitizens Business Bank - Wealth Management (Investment) | 1065000048
Account Summary
Custom Start Date Jul 1, 2019
Total Value $ 11,490,421.27Accrued Income 60,759.79
Net Investment 1 $ 11,109,314.14
Performance 2 This Quarter Year-to-DateFrom Custom
Start Date
TWRR 5.47 % -1.91 % 3.23 %
Account Activity 3 This Quarter Year-to-Date Custom Period
Beginning Value $ 10,849,559.76 $ 11,665,277.76 $ 10,998,341.94
Contributions 47,304.00 531,357.45 552,194.95Withdrawals -1,742.40 -481,636.43 -502,473.93
Capital Appreciation 474,763.20 -624,567.47 -244,212.19Dividends 42,620.48 163,195.74 276,640.80Interest 83,256.39 251,992.60 431,207.34
Asset Allocation 4
Equity 27.18 %
● Large Cap Growth 6.43
● Large Cap Blend 8.19
● Large Cap Value 8.01
● Mid Cap Growth 0.23
● Mid Cap Blend 1.81
● Mid Cap Value 0.76
● Small Cap Growth 0.11
● Small Cap Value 1.65
International 4.83
● Emerging Markets 0.55
● World Equity 1.23
● Developed Foreign Stock 3.05
Fixed Income 64.34
● Long Term Govt/Corp 1.72
● Intermediate Term Govt/Corp 18.99
● Short Term Govt/Corp 24.43
● Intermediate Municipal Bonds 0.24
● High Yield Bonds 18.84
● World Bonds 0.12
Other 5.38
● Commodities 0.62
● Other 4.76
Account 2Market
ValueNet 1
InvestmentQtr
to DateYear
to DateTrailing 5
1 YrTrailing
3 YrsTrailing
5 YrsTrailing
10 YrsFrom CustStart Date
MT SAN ANTONIO COLLEGE STRS/PERS Pension Section 115 Trust |
1065000048
$ 11,490,421.27 $ 11,109,314.14 Custom Start : Jul 1, 2019
Citizens Business Bank - Wealth Management (Investment) — — 5.47 % -1.91 % 2.56 % — — — 3.23 %
MT SAN ANTONIO COLLEGE | MT SAN ANTONIO COLLEGE STRS/PERS Pension Section 115 Trust Data from Jul 1, 2019-Sep 30, 2020 2
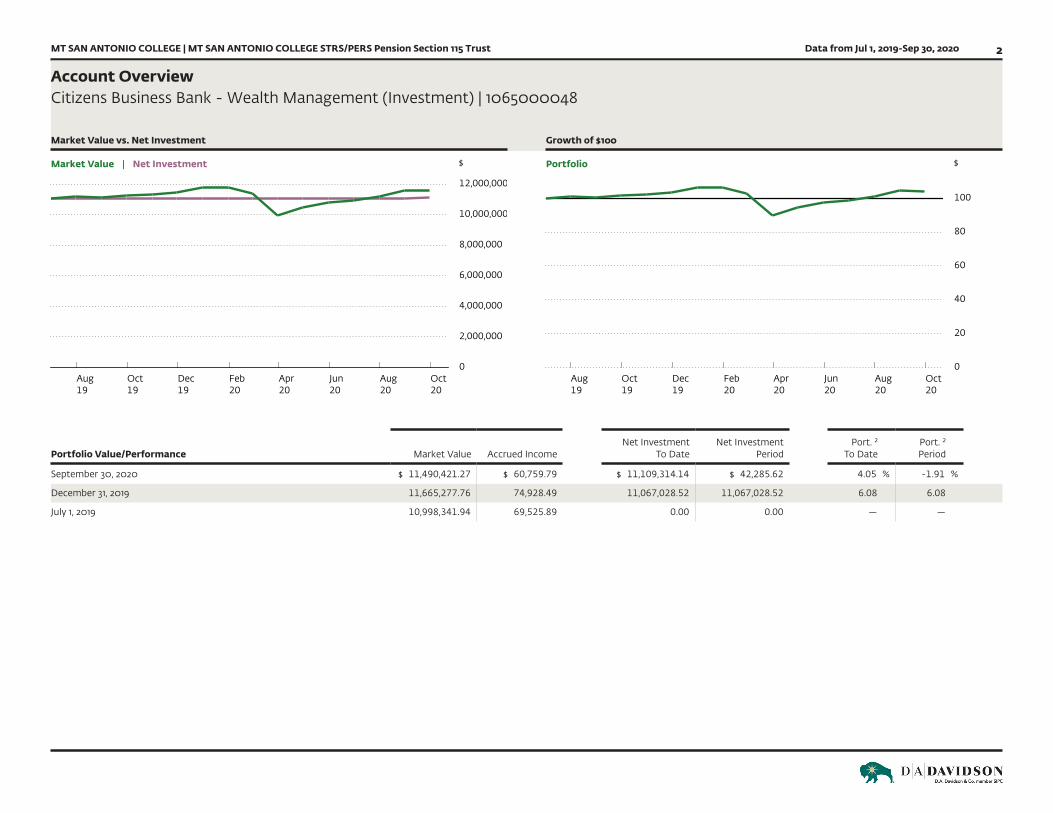
Account OverviewCitizens Business Bank - Wealth Management (Investment) | 1065000048
Market Value vs. Net Investment
Market Value | Net Investment $
Aug19
Oct19
Dec19
Feb20
Apr20
Jun20
Aug20
Oct20
0
2,000,000
4,000,000
6,000,000
8,000,000
10,000,000
12,000,000
Growth of $100
Portfolio $
Aug19
Oct19
Dec19
Feb20
Apr20
Jun20
Aug20
Oct20
0
20
40
60
80
100
Portfolio Value/Performance Market Value Accrued IncomeNet Investment
To DateNet Investment
PeriodPort. 2
To DatePort. 2
Period
September 30, 2020 $ 11,490,421.27 $ 60,759.79 $ 11,109,314.14 $ 42,285.62 4.05 % -1.91 %
December 31, 2019 11,665,277.76 74,928.49 11,067,028.52 11,067,028.52 6.08 6.08
July 1, 2019 10,998,341.94 69,525.89 0.00 0.00 — —

MT SAN ANTONIO COLLEGE | MT SAN ANTONIO COLLEGE STRS/PERS Pension Section 115 Trust Data from Jul 1, 2019-Sep 30, 2020 3
Income Schedule SummaryCitizens Business Bank - Wealth Management (Investment) | 1065000048
Summary 6 Interest Income Total
September, 2020 $ 16,794 $ 14,496 $ 31,290
October, 2020 20,724 15,677 36,401November, 2020 23,096 6,293 29,389December, 2020 23,281 16,864 40,145
January, 2021 6,575 15,677 22,252February, 2021 8,183 6,293 14,476March, 2021 16,794 16,731 33,525
April, 2021 20,724 15,677 36,401May, 2021 23,096 6,521 29,617June, 2021 23,281 16,864 40,145
July, 2021 6,575 15,677 22,252August, 2021 8,183 6,293 14,476
Total $ 197,306 $ 153,063 $ 350,369
Monthly Income 7 6
Interest | Income $
... ... ... ... ... ... ... ... ... ... ... ...0
5,000
10,000
15,000
20,000
25,000
30,000
35,000
40,000
Sep2020
Oct2020
Nov2020
Dec2020
Jan2021
Feb2021
Mar2021
Apr2021
May2021
Jun2021
Jul2021
Aug2021
MT SAN ANTONIO COLLEGE | MT SAN ANTONIO COLLEGE STRS/PERS Pension Section 115 Trust Data from Jul 1, 2019-Sep 30, 2020 4
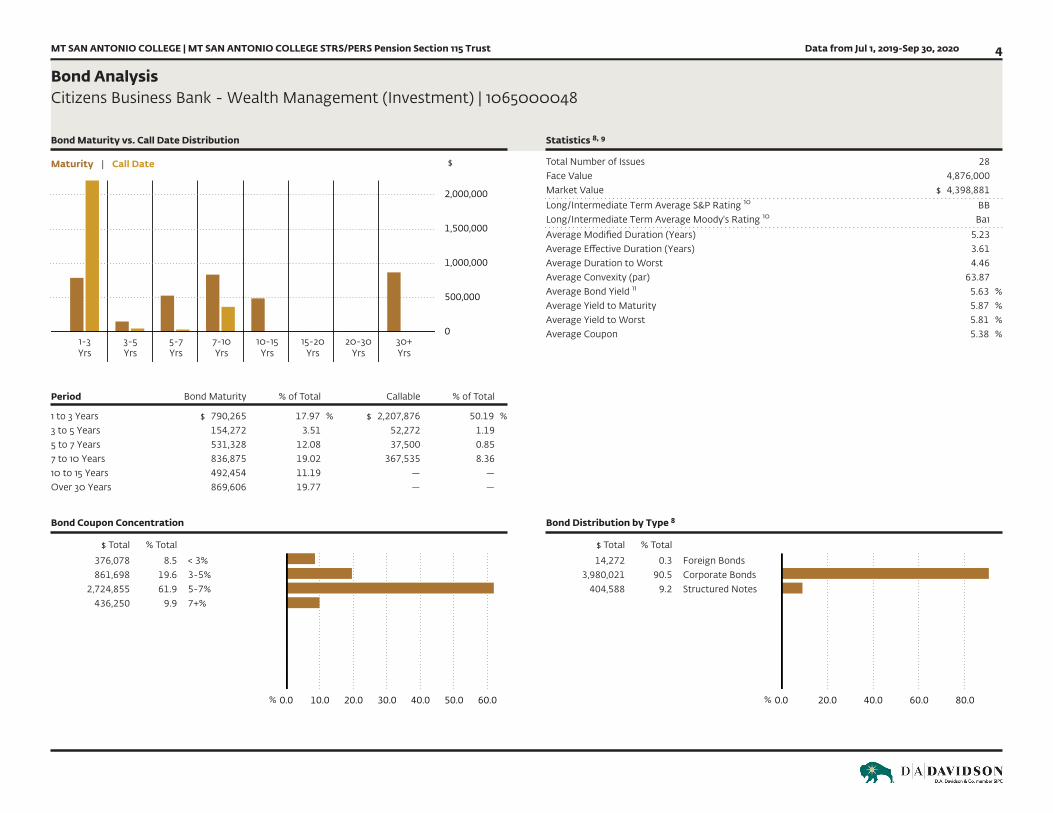
Bond AnalysisCitizens Business Bank - Wealth Management (Investment) | 1065000048
Bond Maturity vs. Call Date Distribution
Maturity | Call Date $
0
500,000
1,000,000
1,500,000
2,000,000
1-3Yrs
3-5Yrs
5-7Yrs
7-10Yrs
10-15Yrs
15-20Yrs
20-30Yrs
30+Yrs
Period Bond Maturity % of Total Callable % of Total
1 to 3 Years $ 790,265 17.97 % $ 2,207,876 50.19 %3 to 5 Years 154,272 3.51 52,272 1.195 to 7 Years 531,328 12.08 37,500 0.857 to 10 Years 836,875 19.02 367,535 8.3610 to 15 Years 492,454 11.19 — —Over 30 Years 869,606 19.77 — —
Statistics 8, 9
Total Number of Issues 28Face Value 4,876,000Market Value $ 4,398,881
Long/Intermediate Term Average S&P Rating 10 BBLong/Intermediate Term Average Moody's Rating 10 Ba1
Average Modified Duration (Years) 5.23Average Effective Duration (Years) 3.61Average Duration to Worst 4.46Average Convexity (par) 63.87Average Bond Yield 11 5.63 %Average Yield to Maturity 5.87 %Average Yield to Worst 5.81 %Average Coupon 5.38 %
Bond Coupon Concentration
$ Total % Total
376,078 8.5 < 3%861,698 19.6 3-5%
2,724,855 61.9 5-7%436,250 9.9 7+%
% 0.0 10.0 20.0 30.0 40.0 50.0 60.0
Bond Distribution by Type 8
$ Total % Total
14,272 0.3 Foreign Bonds3,980,021 90.5 Corporate Bonds
404,588 9.2 Structured Notes
% 0.0 20.0 40.0 60.0 80.0

MT SAN ANTONIO COLLEGE | MT SAN ANTONIO COLLEGE STRS/PERS Pension Section 115 Trust Data from Jul 1, 2019-Sep 30, 2020 5
Bond AnalysisCitizens Business Bank - Wealth Management (Investment) | 1065000048
Bond Distribution by S&P Rating 8
$ Total % Total
396,022 9.0 A1,416,924 32.2 BBB
992,798 22.6 BB810,875 18.4 B220,000 5.0 CCC562,262 12.8 Not Available
% 0.0 5.0 10.0 15.0 20.0 25.0 30.0
Bond Distribution by Moody Rating 8
$ Total % Total
602,032 13.7 A919,336 20.9 BBB
1,354,436 30.8 BB559,442 12.7 B
89,000 2.0 CCC75,500 1.7 C
799,135 18.2 Not Available
% 0.0 5.0 10.0 15.0 20.0 25.0 30.0
Bond Details Bond TypeS&PRating
MoodyRating
%of Total
MaturityDate Status
CallDate
CallPrice YTM 12 Dur.
Mod.Dur.
Long Term Govt/Corp
BofAML 3.000 12/13/34 '22 MTN | 06048WF54 Long Term Govt/
Corp
A- A2 4.49 % Dec 13, 2034 — Jun 13, 2022 $ 100.00 — — —
Intermediate Term Govt/Corp
Amtrust Fincl 6.125 08/15/23 | 032359AE1 Intermediate Term
Go
NR NR 4.22 Aug 15, 2023 — — — 9.70 % 2.46 2.46
Wells Fargo 3.100 11/27/34 '22 MTN | 95001D5J5 Intermediate Term
Go
BBB+ A2 4.68 Nov 27, 2034 — Nov 27, 2022 100.00 3.17 7.40 11.21
BofAML 5.875 Perp '28 FRN | 060505FL3 Intermediate Term
Go
BBB- Baa3 6.10 — — Mar 15, 2028 100.00 3.46 5.98 4.05
Short Term Govt/Corp
PSEC 5.875 03/15/23 | 74348TAJ1 Short Term Govt/
Corp
BBB- NR 7.03 Mar 15, 2023 — — — 4.35 2.21 2.21
JP Morgan 2.500 05/29/27 '21 MTN | 48128GM23 Short Term Govt/
Corp
A- A2 4.51 May 29, 2027 — Nov 29, 2021 100.00 2.52 1.07 5.98
MT SAN ANTONIO COLLEGE | MT SAN ANTONIO COLLEGE STRS/PERS Pension Section 115 Trust Data from Jul 1, 2019-Sep 30, 2020 6
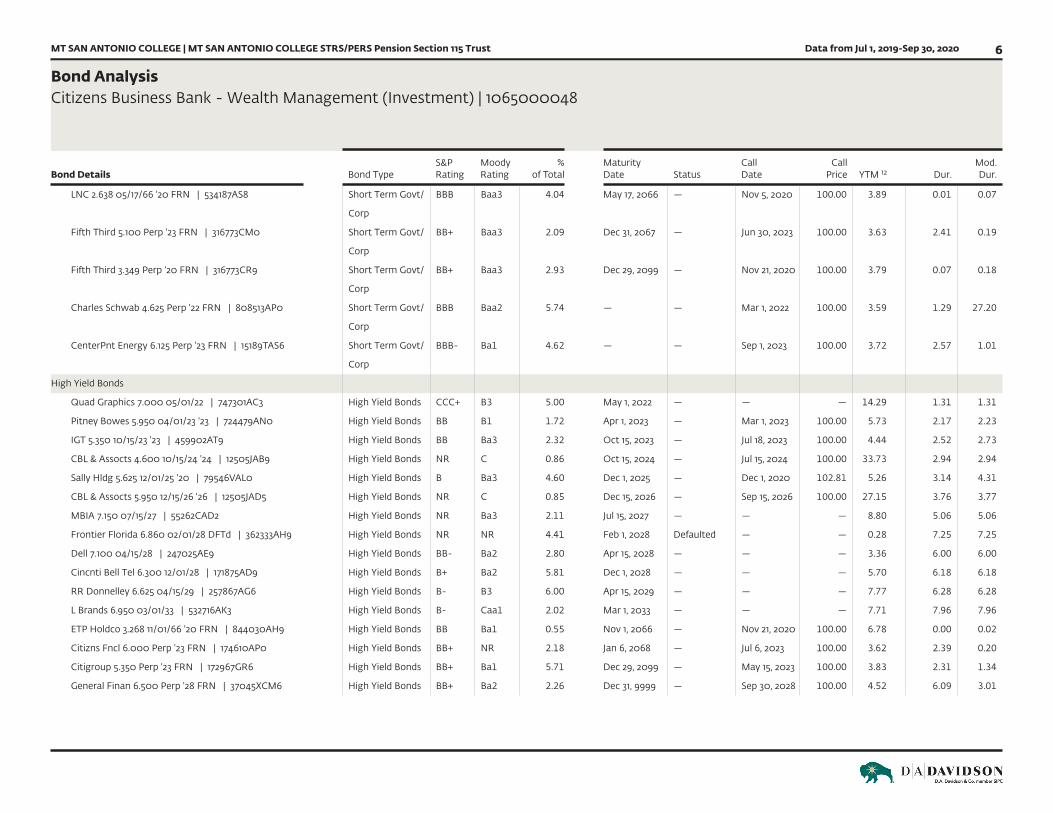
Bond AnalysisCitizens Business Bank - Wealth Management (Investment) | 1065000048
Bond Details Bond TypeS&PRating
MoodyRating
%of Total
MaturityDate Status
CallDate
CallPrice YTM 12 Dur.
Mod.Dur.
LNC 2.638 05/17/66 '20 FRN | 534187AS8 Short Term Govt/
Corp
BBB Baa3 4.04 May 17, 2066 — Nov 5, 2020 100.00 3.89 0.01 0.07
Fifth Third 5.100 Perp '23 FRN | 316773CM0 Short Term Govt/
Corp
BB+ Baa3 2.09 Dec 31, 2067 — Jun 30, 2023 100.00 3.63 2.41 0.19
Fifth Third 3.349 Perp '20 FRN | 316773CR9 Short Term Govt/
Corp
BB+ Baa3 2.93 Dec 29, 2099 — Nov 21, 2020 100.00 3.79 0.07 0.18
Charles Schwab 4.625 Perp '22 FRN | 808513AP0 Short Term Govt/
Corp
BBB Baa2 5.74 — — Mar 1, 2022 100.00 3.59 1.29 27.20
CenterPnt Energy 6.125 Perp '23 FRN | 15189TAS6 Short Term Govt/
Corp
BBB- Ba1 4.62 — — Sep 1, 2023 100.00 3.72 2.57 1.01
High Yield Bonds
Quad Graphics 7.000 05/01/22 | 747301AC3 High Yield Bonds CCC+ B3 5.00 May 1, 2022 — — — 14.29 1.31 1.31
Pitney Bowes 5.950 04/01/23 '23 | 724479AN0 High Yield Bonds BB B1 1.72 Apr 1, 2023 — Mar 1, 2023 100.00 5.73 2.17 2.23
IGT 5.350 10/15/23 '23 | 459902AT9 High Yield Bonds BB Ba3 2.32 Oct 15, 2023 — Jul 18, 2023 100.00 4.44 2.52 2.73
CBL & Assocts 4.600 10/15/24 '24 | 12505JAB9 High Yield Bonds NR C 0.86 Oct 15, 2024 — Jul 15, 2024 100.00 33.73 2.94 2.94
Sally Hldg 5.625 12/01/25 '20 | 79546VAL0 High Yield Bonds B Ba3 4.60 Dec 1, 2025 — Dec 1, 2020 102.81 5.26 3.14 4.31
CBL & Assocts 5.950 12/15/26 '26 | 12505JAD5 High Yield Bonds NR C 0.85 Dec 15, 2026 — Sep 15, 2026 100.00 27.15 3.76 3.77
MBIA 7.150 07/15/27 | 55262CAD2 High Yield Bonds NR Ba3 2.11 Jul 15, 2027 — — — 8.80 5.06 5.06
Frontier Florida 6.860 02/01/28 DFTd | 362333AH9 High Yield Bonds NR NR 4.41 Feb 1, 2028 Defaulted — — 0.28 7.25 7.25
Dell 7.100 04/15/28 | 247025AE9 High Yield Bonds BB- Ba2 2.80 Apr 15, 2028 — — — 3.36 6.00 6.00
Cincnti Bell Tel 6.300 12/01/28 | 171875AD9 High Yield Bonds B+ Ba2 5.81 Dec 1, 2028 — — — 5.70 6.18 6.18
RR Donnelley 6.625 04/15/29 | 257867AG6 High Yield Bonds B- B3 6.00 Apr 15, 2029 — — — 7.77 6.28 6.28
L Brands 6.950 03/01/33 | 532716AK3 High Yield Bonds B- Caa1 2.02 Mar 1, 2033 — — — 7.71 7.96 7.96
ETP Holdco 3.268 11/01/66 '20 FRN | 844030AH9 High Yield Bonds BB Ba1 0.55 Nov 1, 2066 — Nov 21, 2020 100.00 6.78 0.00 0.02
Citizns Fncl 6.000 Perp '23 FRN | 174610AP0 High Yield Bonds BB+ NR 2.18 Jan 6, 2068 — Jul 6, 2023 100.00 3.62 2.39 0.20
Citigroup 5.350 Perp '23 FRN | 172967GR6 High Yield Bonds BB+ Ba1 5.71 Dec 29, 2099 — May 15, 2023 100.00 3.83 2.31 1.34
General Finan 6.500 Perp '28 FRN | 37045XCM6 High Yield Bonds BB+ Ba2 2.26 Dec 31, 9999 — Sep 30, 2028 100.00 4.52 6.09 3.01
MT SAN ANTONIO COLLEGE | MT SAN ANTONIO COLLEGE STRS/PERS Pension Section 115 Trust Data from Jul 1, 2019-Sep 30, 2020 7
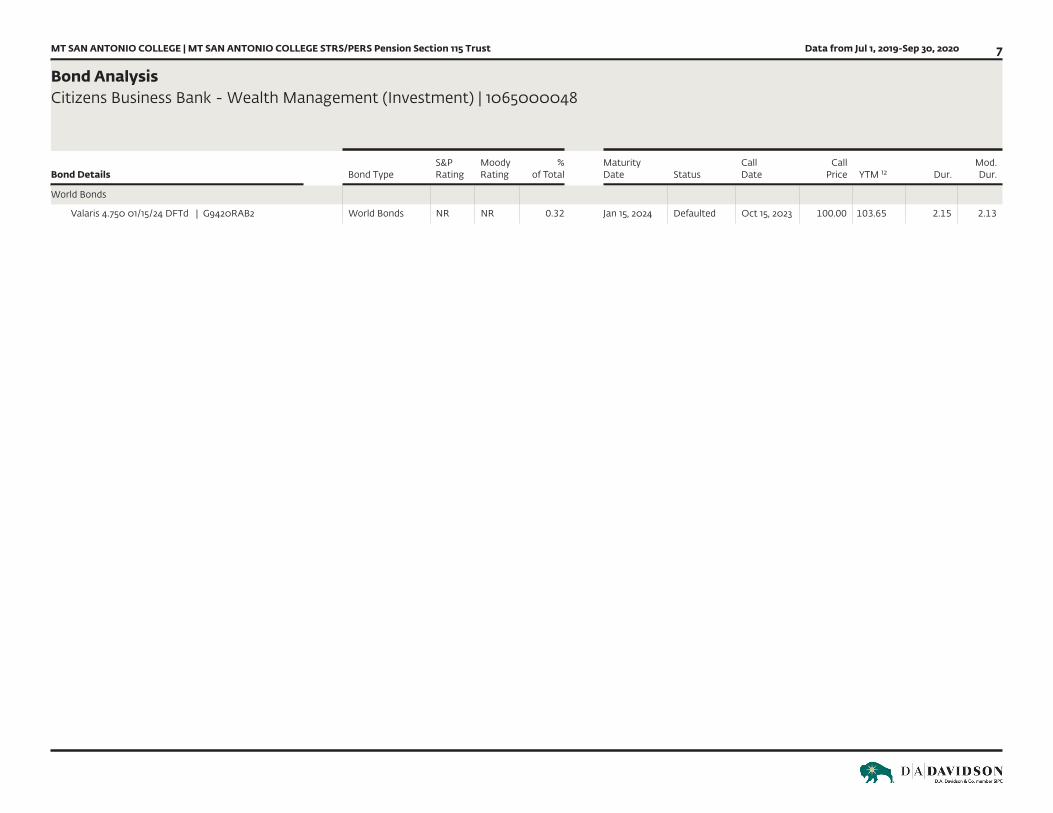
Bond AnalysisCitizens Business Bank - Wealth Management (Investment) | 1065000048
Bond Details Bond TypeS&PRating
MoodyRating
%of Total
MaturityDate Status
CallDate
CallPrice YTM 12 Dur.
Mod.Dur.
World Bonds
Valaris 4.750 01/15/24 DFTd | G9420RAB2 World Bonds NR NR 0.32 Jan 15, 2024 Defaulted Oct 15, 2023 100.00 103.65 2.15 2.13

MT SAN ANTONIO COLLEGE | MT SAN ANTONIO COLLEGE STRS/PERS Pension Section 115 Trust Data from Jul 1, 2019-Sep 30, 2020 8
Holdings AttributionCitizens Business Bank - Wealth Management (Investment) | 1065000048
Ticker Largest Holdings Net Assets
FTSM First Trust Enhanced Short Maturity E 12.22 %
Ft Unit 8418 Ft High Income Model P 5.07
GNL.PRB GLOBAL NET LEASE SRS B CUM PERP 3.51
PSEC 5.875 03/15/23 2.69
BofAML 5.875 Perp '28 FRN 2.33
RR Donnelley 6.625 04/15/29 2.30
Cincnti Bell Tel 6.300 12/01/28 2.22
Charles Schwab 4.625 Perp '22 FRN 2.20
Citigroup 5.350 Perp '23 FRN 2.19
CITIZENS BUSINESS BANK CBB-CITIZ 1.93
Ticker Best Performers This Quarter
DE Deere & Co 41.42 %
CARR Carrier Global Corp-Wi 37.37
NKE Nike Inc B 28.69
QCOM QUALCOMM Inc 28.39
BRK.B Berkshire Hathaway Inc B 19.70
SYF Synchrony Financial 19.60
CMG Chipotle Mexican Grill Inc Class 18.30
COST Costco Wholesale Corp 17.32
SYK Stryker Corp 16.37
NEE NextEra Energy Inc 16.12
Ticker Worst Performers This Quarter
AAPL Apple Inc -67.65 %
XOM Exxon Mobil Corp -21.43
SLB Schlumberger Ltd -13.86
INTC Intel Corp -12.89
CVS CVS Health Corp -9.54
CB Chubb Ltd -7.68
GD General Dynamics Corp -7.18
RTX Raytheon Technologies Ord -5.88
ADP Automatic Data Processing Inc -5.70
T AT&T Inc -4.03
Asset Distribution By Sector 13, 14
$ Total % Total
1,018,573 20.3 Fixed Inc504,374 10.1 Industrials449,430 9.0 Technology373,751 7.5 Healthcare373,404 7.5 Cash310,899 6.2 Fin. Services272,007 5.4 Cons. Cyclical212,794 4.3 Cons. Defense207,403 4.1 Comm. Svcs.158,114 3.2 Real Estate
1,124,604 22.5 Other Invest
% 0.0 5.0 10.0 15.0 20.0
Asset Distribution by Country 15, 14
$ Total % Total
4,302,317 86.0 USA178,009 3.6 Switzerland
89,458 1.8 Japan75,728 1.5 United Kingdom62,154 1.2 Canada59,380 1.2 Germany58,984 1.2 China41,309 0.8 France41,026 0.8 Australia20,640 0.4 Netherlands76,348 1.5 Other Countries
% 0.0 20.0 40.0 60.0 80.0

MT SAN ANTONIO COLLEGE | MT SAN ANTONIO COLLEGE STRS/PERS Pension Section 115 Trust Data from Jul 1, 2019-Sep 30, 2020 9
HoldingsCitizens Business Bank - Wealth Management (Investment) | 1065000048
Holdings Summary Total % Total 16
Portfolio Value — $ 11,490,421.27
Fixed Income 64.34 % 7,393,454.08Equity 27.18 3,123,356.24International 4.83 555,093.59Cash -1.74 -199,995.34Other 5.38 618,512.70
Unrealized 17 18 Gains Losses Total
Long Term — — —Short Term — — —
Asset Class 19, 14
$ Total % Total
2,806,662 24.4 Short Term Govt/2,181,881 19.0 Intermediate Ter2,165,135 18.8 High Yield Bonds
940,506 8.2 Large Cap Blend920,026 8.0 Large Cap Value739,021 6.4 Large Cap Growth350,646 3.1 Developed Foreig207,942 1.8 Mid Cap Blend197,444 1.7 Long Term Govt/C189,423 1.6 Small Cap Value791,735 6.9 Other
% 0.0 5.0 10.0 15.0 20.0
Stock Holdings PriceUnits
OwnedGrouped
Value Accrued%
of Port. SectorCost 20
BasisGain 17 /
Loss Yield
Large Cap Growth — — $ 140,538 $ 0 1.22 % — $ 95,569 $ 44,969 0.65 %
Chipotle Mexican Grill Inc Class A | CMG $ 1,243.71 44.000 54,723 0 0.48 Cons. Cyclical 38,277 16,446 0.00
Microsoft Corp | MSFT 210.33 408 85,815 0 0.75 Technology 57,292 28,523 1.06
Large Cap Blend — — $ 598,017 $ 750 5.20 % — — — 1.00 %
Activision Blizzard Inc | ATVI $ 80.95 556.000 45,008 0 0.39 Comm. Svcs. $ 36,265 $ 8,743 0.51
Apple Inc | AAPL 115.81 480 55,589 0 0.48 Technology — — 0.71
Automatic Data Processing Inc | ADP 139.49 415 57,888 378 0.50 Industrials 57,298 590 2.61
Berkshire Hathaway Inc B | BRK.B 212.94 115 24,488 0 0.21 Fin. Services 21,858 2,631 0.00
Costco Wholesale Corp | COST 355.00 201 71,355 0 0.62 Cons. Defense 58,800 12,555 0.79
Deere & Co | DE 221.63 226 50,088 172 0.44 Industrials 36,514 13,574 1.37
Fidelity National Information Services Inc | FIS 147.21 92 13,543 0 0.12 Technology 12,964 579 0.95
NextEra Energy Inc | NEE 277.56 274 76,051 0 0.66 Utilities 57,990 18,061 0.50
Nike Inc B | NKE 125.54 395 49,588 97 0.43 Cons. Cyclical 35,927 13,661 0.78
OTIS Worldwide Corp-Wi | OTIS 62.42 272 16,978 0 0.15 Industrials 18,988 -2,010 1.28
QUALCOMM Inc | QCOM 117.68 420 49,426 0 0.43 Technology 35,351 14,074 2.21

MT SAN ANTONIO COLLEGE | MT SAN ANTONIO COLLEGE STRS/PERS Pension Section 115 Trust Data from Jul 1, 2019-Sep 30, 2020 10
HoldingsCitizens Business Bank - Wealth Management (Investment) | 1065000048
Stock Holdings PriceUnits
OwnedGrouped
Value Accrued%
of Port. SectorCost 20
BasisGain 17 /
Loss Yield
Stryker Corp | SYK 208.37 181 37,715 104 0.33 Healthcare 35,045 2,670 1.10
VMware Inc | VMW 143.67 91 13,074 0 0.11 Technology 12,692 382 0.00
Walt Disney Co | DIS 124.08 300 37,224 0 0.32 Comm. Svcs. 35,267 1,957 0.00
Large Cap Value — — $ 672,337 $ 502 5.85 % — $ 626,238 $ 46,099 3.98 %
3M Co | MMM $ 160.18 403.000 64,553 0 0.56 Industrials 58,765 5,788 3.67
Amgen Inc | AMGN 254.16 166 42,191 0 0.37 Healthcare 37,564 4,627 2.52
AT&T Inc | T 28.51 1,749 49,864 0 0.43 Comm. Svcs. 58,202 -8,338 7.30
CVS Health Corp | CVS 58.40 566 33,054 0 0.29 Healthcare 36,390 -3,336 3.42
Emerson Electric Co | EMR 65.57 1,067 69,963 0 0.61 Industrials 57,967 11,997 3.05
Exxon Mobil Corp | XOM 34.33 1,206 41,402 0 0.36 Energy 57,927 -16,525 10.14
General Dynamics Corp | GD 138.43 239 33,085 0 0.29 Industrials 36,739 -3,655 3.18
Intel Corp | INTC 51.78 597 30,913 0 0.27 Technology 34,016 -3,104 2.55
International Business Machines Corp | IBM 121.67 494 60,105 0 0.52 Technology 57,694 2,411 5.36
Johnson & Johnson | JNJ 148.88 481 71,611 0 0.62 Healthcare 59,682 11,930 2.71
Kimberly-Clark Corp | KMB 147.66 469 69,253 502 0.60 Cons. Defense 58,958 10,294 2.90
PNC Financial Services Group Inc | PNC 109.91 314 34,512 0 0.30 Fin. Services 35,576 -1,064 4.19
PPG Industries Inc | PPG 122.08 332 40,531 0 0.35 Basic Materials 36,215 4,315 1.77
Raytheon Technologies Ord | RTX 57.54 544 31,302 0 0.27 Industrials 544 30,758 3.30
Mid Cap Blend — — $ 153,883 $ 0 1.34 % — $ 143,153 $ 10,730 2.56 %
A.O. Smith Corp | AOS $ 52.80 768.000 40,550 0 0.35 Industrials 36,072 4,478 1.97
Expedia Inc | EXPE 91.69 100 9,169 0 0.08 Cons. Cyclical 13,639 -4,470 0.00
Synchrony Financial | SYF 26.17 1,567 41,008 0 0.36 Fin. Services 35,991 5,018 3.36
VF Corp | VFC 70.25 899 63,155 0 0.55 Cons. Cyclical 57,451 5,704 2.79
Mid Cap Value — — $ 64,123 $ 0 0.56 % — $ 59,283 $ 4,839 1.38 %
Avery Dennison Corp | AVY $ 127.84 306.000 39,119 0 0.34 Industrials 36,266 2,853 1.81
Carrier Global Corp-Wi | CARR 30.54 544 16,614 0 0.14 Industrials 9,678 6,935 1.05
Molson Coors Brewing Co B | TAP 33.56 250 8,390 0 0.07 Cons. Defense 13,339 -4,949 0.00

MT SAN ANTONIO COLLEGE | MT SAN ANTONIO COLLEGE STRS/PERS Pension Section 115 Trust Data from Jul 1, 2019-Sep 30, 2020 11
HoldingsCitizens Business Bank - Wealth Management (Investment) | 1065000048
Stock Holdings PriceUnits
OwnedGrouped
Value Accrued%
of Port. SectorCost 20
BasisGain 17 /
Loss Yield
Small Cap Value — — $ 157,042 $ 0 1.37 % — — — 9.21 %
Chimera Investment Corp | CIM.PRC $ 18.92 2,000.000 37,840 0 0.33 Real Estate — — 10.24
Two Harbors Investment Corp | TWO.PRA 22.00 4,000 88,000 0 0.77 Real Estate — — 9.23
Umpqua Holdings Corp | UMPQ 10.62 2,938 31,202 0 0.27 Fin. Services $ 36,012 $ -4,810 7.91
Developed Foreign Stock — — $ 167,983 $ 586 1.46 % — $ 176,530 $ -8,547 2.73 %
Alcon Inc | ALC $ 56.95 405.000 23,065 0 0.20 Healthcare 22,483 582 0.00
Chubb Ltd | CB 116.12 474 55,041 370 0.48 Fin. Services 59,911 -4,871 2.69
Novartis Ag | NVS 86.96 724 62,959 0 0.55 Healthcare 58,516 4,443 3.55
Schlumberger Ltd | SLB 15.56 1,730 26,919 216 0.23 Energy 35,620 -8,701 3.21
Intermediate Term Govt/Corp — — $ 793,900 $ 1,969 6.91 % — — — 6.72 %
At&t Inc 5.35% Glb Nts 66 | TBB $ 26.60 1,000.000 26,600 0 0.23 Not Avail — — 5.03
At&t Inc 5.625% Nt 67 | TBC 27.09 2,000 54,180 0 0.47 Not Avail — — 5.19
B Riley Finl Inc Sr Nt 7.25% 27 | RILYG 24.50 2,000 49,000 0 0.43 Not Avail — — 7.40
Cowen Inc 7.35% Sr Nt 27 | COWNZ 25.28 2,000 50,560 0 0.44 Not Avail — — 7.27
Global Indemnity Ltd 04/15/2047 Pfd | GBLIL 27.27 4,000 109,080 1,969 0.95 Not Avail — — 7.22
GLOBAL NET LEASE SRS B CUM PERP
PRF | GNL.PRB
25.19 16,000 403,040 0 3.51 Not Avail $ 400,000 $ 3,040 6.82
Prospect Capital C 6.25% Nts 15/06/2028 Usd 25.20 2,000 50,400 0 0.44 Not Avail — — 6.20
Prospect Capital Corporation 6.875 Nts Due 29 | PBC 25.52 2,000 51,040 0 0.44 Not Avail — — 6.73
Intermediate Municipal Bonds — — $ 28,060 $ 406 0.24 % — — — 5.79 %
Brunswick Corp 6.5% Sr Notes 48 | BC.PRA $ 28.06 1,000.000 28,060 406 0.24 Fixed Inc — — 5.79
Fund Holdings PriceUnits
OwnedGrouped
Value Accrued%
of Port. SectorCost 20
BasisGain 17 /
Loss Yield
Large Cap Growth — — $ 175,260 $ 0 1.53 % — $ 143,556 $ 31,703 0.76 %
Vanguard Growth ETF | VUG $ 227.61 770.000 175,260 0 1.53 Multi-Sector 143,556 31,703 0.76

MT SAN ANTONIO COLLEGE | MT SAN ANTONIO COLLEGE STRS/PERS Pension Section 115 Trust Data from Jul 1, 2019-Sep 30, 2020 12
HoldingsCitizens Business Bank - Wealth Management (Investment) | 1065000048
Fund Holdings PriceUnits
OwnedGrouped
Value Accrued%
of Port. SectorCost 20
BasisGain 17 /
Loss Yield
Large Cap Blend — — $ 48,239 $ 0 0.42 % — $ 45,231 $ 3,008 1.94 %
iShares MSCI USA Quality Factor ETF | QUAL $ 103.74 465.000 48,239 0 0.42 Multi-Sector 45,231 3,008 1.94
Large Cap Value — — $ 247,689 $ 0 2.16 % — $ 257,159 $ -9,470 2.85 %
Invesco FTSE RAFI US 1000 ETF | PRF $ 113.79 642.000 73,053 0 0.64 Multi-Sector 74,779 -1,725 2.45
Vanguard Value ETF | VTV 104.51 1,671 174,636 0 1.52 Multi-Sector 182,381 -7,745 3.02
Mid Cap Growth — — $ 26,310 $ 0 0.23 % — $ 25,390 $ 920 1.18 %
iShares S&P Mid-Cap 400 Growth | IJK $ 239.18 110.000 26,310 0 0.23 Multi-Sector 25,390 920 1.18
Mid Cap Value — — $ 23,601 $ 0 0.21 % — $ 25,536 $ -1,936 2.92 %
iShares S&P Mid-Cap 400 Value ETF | IJJ $ 134.86 175.000 23,601 0 0.21 Multi-Sector 25,536 -1,936 2.92
Small Cap Growth — — $ 12,405 $ 0 0.11 % — $ 11,911 $ 494 0.83 %
iShares Russell 2000 Growth | IWO $ 221.52 56.000 12,405 0 0.11 Multi-Sector 11,911 494 0.83
Small Cap Value — — $ 32,382 $ 0 0.28 % — $ 35,533 $ -3,152 2.85 %
iShares Russell 2000 Value | IWN $ 99.33 326.000 32,382 0 0.28 Multi-Sector 35,533 -3,152 2.85
Emerging Markets — — $ 63,649 $ 0 0.55 % — $ 61,906 $ 1,743 4.00 %
Vanguard FTSE Emerging Markets ETF | VWO $ 43.24 1,472.000 63,649 0 0.55 Multi-Sector 61,906 1,743 4.00
Developed Foreign Stock — — $ 182,663 $ 0 1.59 % — $ 182,722 $ -59 2.59 %
iShares Core MSCI Total Intl Stk ETF | IXUS $ 58.34 3,131.000 182,663 0 1.59 Multi-Sector 182,722 -59 2.59
Short Term Govt/Corp — — $ 1,404,108 $ 819 12.22 % — $ 1,405,588 $ -1,480 1.56 %
First Trust Enhanced Short Maturity ETF | FTSM $ 60.02 23,394.000 1,404,108 819 12.22 Multi-Sector 1,405,588 -1,480 1.56
Commodities — — $ 13,167 $ 0 0.11 % — $ 15,971 $ -2,804 0.00 %
ELEMENTS Rogers Intl Cmdty TR ETN | RJI $ 4.32 3,048.000 13,167 0 0.11 Multi-Sector 15,971 -2,804 0.00
Bond Holdings Price ParGrouped
Value Accrued%
of Port.MaturityDate
S&PRating
MoodyRating Coupon Yield
Long Term Govt/Corp — — $ 197,444 $ 1,783 1.72 % — — — 3.00 % 3.04 %
BofAML 3.000 12/13/34 '22 MTN | 06048WF54 $ 98.72 200,000 197,444 1,783 1.72 Dec 13, 2034 A- A2 3.00 3.04

MT SAN ANTONIO COLLEGE | MT SAN ANTONIO COLLEGE STRS/PERS Pension Section 115 Trust Data from Jul 1, 2019-Sep 30, 2020 13
HoldingsCitizens Business Bank - Wealth Management (Investment) | 1065000048
Bond Holdings Price ParGrouped
Value Accrued%
of Port.MaturityDate
S&PRating
MoodyRating Coupon Yield
Intermediate Term Govt/Corp — — $ 659,625 $ 3,650 5.74 % — — — 5.08 % 5.02 %
Amtrust Fincl 6.125 08/15/23 | 032359AE1 $ 92.75 200,000 185,490 1,531 1.61 Aug 15, 2023 NR NR 6.12 6.60
BofAML 5.875 Perp '28 FRN | 060505FL3 107.25 250,000 268,125 0 2.33 n/a BBB- Baa3 5.88 5.48
Wells Fargo 3.100 11/27/34 '22 MTN | 95001D5J5 103.00 200,000 206,010 2,118 1.79 Nov 27, 2034 BBB+ A2 3.10 3.01
Short Term Govt/Corp — — $ 1,362,406 $ 4,482 11.86 % — — — 4.48 % 4.64 %
CenterPnt Energy 6.125 Perp '23 FRN | 15189TAS6 $ 101.64 200,000 203,284 0 1.77 n/a BBB- Ba1 6.12 6.03
Charles Schwab 4.625 Perp '22 FRN | 808513AP0 101.07 250,000 252,673 0 2.20 n/a BBB Baa2 4.62 4.58
Fifth Third 3.349 Perp '20 FRN | 316773CR9 86.00 150,000 129,000 0 1.12 Dec 29, 2099 BB+ Baa3 3.35 3.89
Fifth Third 5.100 Perp '23 FRN | 316773CM0 92.04 100,000 92,038 1,261 0.80 Dec 31, 2067 BB+ Baa3 5.10 5.54
JP Morgan 2.500 05/29/27 '21 MTN | 48128GM23 99.29 200,000 198,578 1,681 1.73 May 29, 2027 A- A2 2.50 2.52
LNC 2.638 05/17/66 '20 FRN | 534187AS8 71.00 250,000 177,500 806 1.54 May 17, 2066 BBB Baa3 2.64 3.71
PSEC 5.875 03/15/23 | 74348TAJ1 103.11 300,000 309,333 734 2.69 Mar 15, 2023 BBB- NR 5.88 5.70
High Yield Bonds — — $ 2,165,135 $ 45,813 18.84 % — — — 6.27 % —
CBL & Assocts 4.600 10/15/24 '24 | 12505JAB9 $ 38.00 100,000 38,000 2,108 0.33 Oct 15, 2024 NR C 4.60 12.11 %
CBL & Assocts 5.950 12/15/26 '26 | 12505JAD5 37.50 100,000 37,500 1,735 0.33 Dec 15, 2026 NR C 5.95 15.87
Cincnti Bell Tel 6.300 12/01/28 | 171875AD9 102.25 250,000 255,625 5,206 2.22 Dec 1, 2028 B+ Ba2 6.30 6.16
Citigroup 5.350 Perp '23 FRN | 172967GR6 100.53 250,000 251,318 5,016 2.19 Dec 29, 2099 BB+ Ba1 5.35 5.32
Citizns Fncl 6.000 Perp '23 FRN | 174610AP0 96.04 100,000 96,040 1,400 0.84 Jan 6, 2068 BB+ NR 6.00 6.25
Dell 7.100 04/15/28 | 247025AE9 123.25 100,000 123,250 3,254 1.07 Apr 15, 2028 BB- Ba2 7.10 5.76
ETP Holdco 3.268 11/01/66 '20 FRN | 844030AH9 48.60 50,000 24,300 272 0.21 Nov 1, 2066 BB Ba1 3.27 6.73
Frontier Florida 6.860 02/01/28 DFTd | 362333AH9 97.00 200,000 194,000 0 1.69 Feb 1, 2028 NR NR 6.86 —
General Finan 6.500 Perp '28 FRN | 37045XCM6 99.41 100,000 99,410 0 0.87 Dec 31, 9999 BB+ Ba2 6.50 6.54
IGT 5.350 10/15/23 '23 | 459902AT9 102.00 100,000 102,000 2,452 0.89 Oct 15, 2023 BB Ba3 5.35 5.25
L Brands 6.950 03/01/33 | 532716AK3 89.00 100,000 89,000 560 0.77 Mar 1, 2033 B- Caa1 6.95 7.81
MBIA 7.150 07/15/27 | 55262CAD2 93.00 100,000 93,000 1,490 0.81 Jul 15, 2027 NR Ba3 7.15 7.69
Pitney Bowes 5.950 04/01/23 '23 | 724479AN0 99.27 76,000 75,442 2,248 0.66 Apr 1, 2023 BB B1 5.95 5.99
Quad Graphics 7.000 05/01/22 | 747301AC3 88.00 250,000 220,000 7,243 1.91 May 1, 2022 CCC+ B3 7.00 7.95

MT SAN ANTONIO COLLEGE | MT SAN ANTONIO COLLEGE STRS/PERS Pension Section 115 Trust Data from Jul 1, 2019-Sep 30, 2020 14
HoldingsCitizens Business Bank - Wealth Management (Investment) | 1065000048
Bond Holdings Price ParGrouped
Value Accrued%
of Port.MaturityDate
S&PRating
MoodyRating Coupon Yield
RR Donnelley 6.625 04/15/29 | 257867AG6 88.00 300,000 264,000 9,109 2.30 Apr 15, 2029 B- B3 6.62 7.53
Sally Hldg 5.625 12/01/25 '20 | 79546VAL0 101.12 200,000 202,250 3,719 1.76 Dec 1, 2025 B Ba3 5.62 5.56
World Bonds — — $ 14,272 $ 0 0.12 % — — — 4.75 % —
Valaris 4.750 01/15/24 DFTd | G9420RAB2 $ 7.14 200,000 14,272 0 0.12 Jan 15, 2024 NR NR 4.75 —
Other Holdings PriceUnits
OwnedGrouped
Value Accrued%
of Port. SectorCost 20
BasisGain 17 /
Loss Yield
Large Cap Growth — — $ 423,223 $ 0 3.68 % — $ 374,975 $ 48,248 —
FIRST TRUST CLOUD COMPUTING 30 SA FE CA $ 10.46 14,969.000 156,576 0 1.36 Not Avail 150,000 6,576 —
FIRST TRUST CONTENT LEADERS 16 MO FE CA 10.92 5,700 62,244 0 0.54 Not Avail 49,994 12,250 —
FIRST TRUST VIRTUAL ECONOMY SA FE CA 12.82 12,026 154,173 0 1.34 Not Avail 124,990 29,183 —
FT Innovative Health Care 5 F CA 9.63 5,216 50,230 0 0.44 Not Avail 49,992 238 —
Large Cap Blend — — $ 294,250 $ 0 2.56 % — — — —
FIRST TRUST PHARMACEUTICAL SEL 41 SA FE CA $ 9.92 20,036.000 198,757 0 1.73 Not Avail $ 199,995 $ -1,238 —
Guggenheim Defined Portfolios Ut1834eqinse45cm 9.25 10,323.6 95,493 0 0.83 Not Avail — — 0.00 %
Mid Cap Blend — — $ 54,059 $ 0 0.47 % — $ 49,995 $ 4,065 —
Ft Unit 8562 Aerospace & Defense Portfolio Ser 28
Semi Annual Fee Acct Cash
$ 8.29 6,521.000 54,059 0 0.47 Not Avail 49,995 4,065 —
World Equity — — $ 140,798 $ 0 1.23 % — $ 149,997 $ -9,199 —
FIRST TRUST GLOBAL CMDTYS OPPTY 37 SA FE CA $ 9.26 15,205.000 140,798 0 1.23 Not Avail 149,997 -9,199 —
Intermediate Term Govt/Corp — — $ 728,356 $ 0 6.34 % — — — —
FIRST TRUST DW REL STRNGTH TOP 50 39 SA FE CA $ 11.52 3,550.000 40,896 0 0.36 Not Avail $ 34,996 $ 5,900 —
FIRST TRUST SMID CAP STRNGTH OPP 13 SA FE CA 11.59 3,523 40,832 0 0.36 Not Avail 34,997 5,835 —
Ft Unit 8418 Ft High Income Model Port 1q 20 Monthly
Fee Acct Cash
9.59 60,789 582,967 0 5.07 Not Avail 600,000 -17,033 —
Guggenheim Defined Portfolios Ut1834eqinse45cm 9.25 6,882.4 63,662 0 0.55 Not Avail — — 0.00 %

MT SAN ANTONIO COLLEGE | MT SAN ANTONIO COLLEGE STRS/PERS Pension Section 115 Trust Data from Jul 1, 2019-Sep 30, 2020 15
HoldingsCitizens Business Bank - Wealth Management (Investment) | 1065000048
Other Holdings PriceUnits
OwnedGrouped
Value Accrued%
of Port. SectorCost 20
BasisGain 17 /
Loss Yield
Short Term Govt/Corp — — $ 40,149 $ 0 0.35 % — $ 39,991 $ 158 —
Ft Unit 8746 Ft Short Duration Fixed Income Model
Port 3q 20 Monthly Fee Acct Cash
$ 9.96 4,031.000 40,149 0 0.35 Not Avail 39,991 158 —
Commodities — — $ 58,283 $ 0 0.51 % — $ 49,997 $ 8,287 —
Ft Unit 8526 Wtr Util & Infrastructure Select Portfolio
Ser 57 Semi Annual Fee Ur2020106yxd02072930
$ 9.68 6,021.000 58,283 0 0.51 Not Avail 49,997 8,287 —
Other — — $ 547,062 $ 0 4.76 % — $ 546,812 $ 250 —
CITIZENS BUSINESS BANK CBB-CITIZENSTRUST
SWEEP ACCOUNT
$ 1.00 221,825.940 221,826 0 1.93 Not Avail 221,826 0 —
FIRST TRUST SHORT DUR FXD INC 4Q20 MO FE CA 9.86 20,294 199,997 0 1.74 Not Avail 199,995 2 —
Ft Biotechnology 49 F Ca 9.75 12,845 125,239 0 1.09 Not Avail 124,991 248 —
Cash BalanceGrouped
Value%
of Port.
Cash $ -199,995 -1.74 %

MT SAN ANTONIO COLLEGE Data from Jul 1, 2019-Sep 30, 2020 16
Indices Overview
Indices Qtr to Date Year to Date Trailing 1 Yr 5 Trailing 3 Yrs 21 Trailing 5 Yrs 22 Trailing 10 Yrs 23From Cust 24
Start Date
S&P 500 TR 8.93 % 5.57 % 15.15 % 12.28 % 14.14 % 13.74 % 12.76 %
Dow Jones Industrial Average TR 8.22 -0.91 5.70 9.98 14.01 12.69 5.68
Nasdaq 11.02 24.46 39.61 19.79 19.30 16.77 29.37
MSCI EAFE NR USD 4.80 -7.09 0.49 0.62 5.26 4.62 -0.85
MSCI EM NR 9.56 -1.16 10.54 2.42 8.96 2.50 3.91
Bloomberg Barclays Capital U.S. Aggregate Bond TR 0.62 6.79 6.98 5.24 4.18 3.63 7.56
Russell 2000 TR 4.93 -8.69 0.39 1.77 8.00 9.85 -1.77
Copyright © 2020 by S&P Dow Jones Indices LLC, a subsidiary of McGraw Hill Financial, Inc. All rights reserved. Redistribution or reproduction in whole or in part is prohibited without written the permission of S&P Dow Jones Indices LLC. Formore information on any of S&P Dow Jones Indices LLC's indices please visit www.spdji.com. S&P® is a registered trademark of Standard & Poor's Financial Services LLC ('SPFS') and Dow Jones® is a registered trademark of Dow Jones TrademarkHoldings LLC ('Dow Jones'). Neither S&P Dow Jones Indices LLC, SPFS, Dow Jones, their affiliates, nor their third party licensors make any representation or warranty, express or implied, with respect to the Index and none shall have any liabilityfor any errors, omissions, or interruptions in the Index or the data included therein.
Copyright MSCI 2020. All Rights Reserved. Without prior written permission of MSCI, this information and any other MSCI intellectual property may only be used for your internal use, may not be reproduced or redisseminated in any form andmay not be used to create any financial instruments or products or any indices. This information is provided on an 'as is' basis, and the user of this information assumes the entire risk of any use made of this information. Neither MSCI nor anythird party involved in or related to the computing or compiling of the data makes any express or implied warranties, representations or guarantees concerning the MSCI index-related data, and in no event will MSCI or any third party have anyliability for any direct, indirect, special, punitive, consequential or any other damages (including lost profits) relating to any use of this information.
Russell Investment Group is the source and owner of the trademarks, service marks and copyrights related to the Russell Indexes. Russell® is a trademark of Russell Investment Group.
MT SAN ANTONIO COLLEGE | MT SAN ANTONIO COLLEGE STRS/PERS Pension Section 115 Trust Data from Jul 1, 2019-Sep 30, 2020 17
Disclosures
These reports are a service from your Financial Advisor and are for informational purposes only. These reports do not take the place of any brokerage statements or confirmations, any fund company statements, or the1099 tax forms. You are urged to compare this report with the statement you receive from your custodian covering the same period. If you find any discrepancies in this report, please contact your Financial Advisor.Differences in positions may occur due to reporting dates used and whether certain assets are not maintained by your custodian. There may also be differences in the investment values shown due to the use of differingvaluation sources and methods.
These reports are not to be construed as an offer or the solicitation of an offer to buy or sell securities mentioned herein. Information contained in these reports is based upon sources and data believed reliable. Theinformation used to construct these reports was received via a variety of sources.
MT SAN ANTONIO COLLEGE | MT SAN ANTONIO COLLEGE STRS/PERS Pension Section 115 Trust Data from Jul 1, 2019-Sep 30, 2020 18
Disclosure Notes
1 Net Investment is the total value of contributions and withdrawals (excluding unsupervised assets) made by the client for the period from Jul 1, 2019 to Sep 30, 2020. This includes Misc. Expenses received from the custodian.
2 Time Weighted Rate of Return ("TWRR") is calculated net of all fees. Performance information based upon TWRR includes advisory fees, transaction costs, market appreciation or depreciation, and the reinvestment of capital gains, dividends,interest and other income. Performance returns greater than one year are annualized. TWRR is used to compare your portfolio returns versus benchmark indices (such as S&P 500). This report has been generated on the Managed Accountsplatform powered by Envestnet (the "Platform Manager"). If your report contains data from periods prior to the time your account was set up on the platform, that data was supplied by third-party sources and has not been independentlyverified by Platform Manager.
3 "Beginning Value": the account's value at the beginning of each period; "Contributions": the value of deposits from the client into the account for each period; "Withdrawals": withdrawals from the account for each period; "CapitalAppreciation": all realized and unrealized changes in market value during the period; "Dividends": the amount of dividends received from stocks or mutual funds for each period; "Interest": the amount of interest received for each period.Account activity does not reflect advisory fees deducted from your account. For additional information regarding advisory fees associated with these accounts, please refer to the account statements provided by your custodian or contact yourfinancial advisor.
4 Negative values are omitted from the Asset Allocation display. As a result, the values in the Asset Allocation display may total more than 100%.
5 Trailing 1 Year is Sep 30, 2019 to Sep 30, 2020
6 Values represented on this report represent estimated projections and not actual payments.
7 Projected equity dividends in the Income Schedule are provided for informational purposes only. Data is generated from the most recent equity dividend payment for the given equity security, and replicated using the current quantity and nextexpected dividend payment date. There is no assurance that projected equity dividends will actually pay the projected amount on the projected date. The estimates generated by this tool regarding the likelihood of various cash payments arehypothetical in nature, do not reflect the actual payments and are not guarantees of future payments. When available, the coupon rate of some fixed income and/or the current interest rate or most recently declared dividends for certainsecurities are annualized to create the Estimated Annual Income ("EAI") figure. EAI is an estimate, and your actual income may be lower or higher. Additionally, estimates may include return of principal or capital gains which would renderthem overstated. EAI is based on mathematical calculations of available data, and have been obtained from information providers believed to be reliable, but no assurance can be made as to accuracy. Since the interest and dividend rates aresubject to change at any time, and may be affected by current and future economic, political and business conditions, they should not be relied on for making investment, trading or tax decisions.
8 Bond type, statistics and rating information is provided by Refinitiv.
9 Data are weighted and calculated based on the criteria of 50% of holdings in total maturing bond market value available. If less than 50%, the data are shown as 'n/a'.
10 Average credit quality gives a snapshot of the portfolio's overall credit quality. It is an average of each bond's credit rating, adjusted for its relative weighting in the portfolio. Bonds with one year to maturity at the time of issuance areconsidered cash and are not include in the Average Credit ratings.
11 An indication of the interest vs. the current market value of the holdings. The yield represents the current amount of income that is being generated from the portfolio without liquidating the principal or capital gains on the portfolio. However,the yield will fluctuate daily and current or past performance is not a guarantee of future results.
12 YTM denotes the Yield to Maturity.
13 The Group By Asset Distribution By Sector Holdings Report includes only Stocks & Funds Holdings. The Asset Distribution By Sector Summary and the Asset Distribution By Sector Graph include totals from "Multiple Sectors" funds. The AssetDistribution By Sector Summary and the Asset Distribution By Sector Graph display totals for the top Asset Distribution By Sector groupings, smaller Asset Distribution By Sector groupings are combined under the "Other Invest" heading.

MT SAN ANTONIO COLLEGE | MT SAN ANTONIO COLLEGE STRS/PERS Pension Section 115 Trust Data from Jul 1, 2019-Sep 30, 2020 19
Disclosure Notes
14 Parent style classifications are provided by Morningstar, Inc. and mapped into one of the style classifications supported on this platform. Sector information is provided by Morningstar. Bond type and rating information is provided by Refinitiv.
15 The Group By Asset Distribution by Country Holdings Report includes only Stocks & Funds Holdings. The Asset Distribution by Country Summary and the Asset Distribution by Country Graph include totals from "Multiple Countries" funds.The Asset Distribution by Country Summary and the Asset Distribution by Country Graph display totals for the top Asset Distribution by Country groupings, smaller Asset Distribution by Country groupings are combined under the "OtherCountries" heading.
16 Market value totals are displayed in reporting currency(USD).
17 Capital gain/loss data presented here is a general guide and should not be relied upon in the preparation of your tax returns.
18 Complete Gains & Losses data not available due to missing cost basis information.
19 The Asset Class Summary and the Asset Class Graph display totals for the top Asset Class groupings, smaller Asset Class groupings are combined under the "Other" heading.
20 "First-In First-Out (For Mutual Fund: Average Cost)" is the current accounting method. Cost basis values are not provided by the custodian in all cases, and should be independently verified from your original purchase records. However cashis not included in the 'Cost Basis' total figures.
21 Trailing 3 Year is Sep 30, 2017 to Sep 30, 2020 , annualized
22 Trailing 5 Year is Sep 30, 2015 to Sep 30, 2020 , annualized
23 Trailing 10 Year is Sep 30, 2010 to Sep 30, 2020 , annualized
24 Returns for the selected indices are created based on the custom start date of the report.

ACCOUNT STATEMENT ACCOUNT NUMBER: 1065000048
SEPTEMBER 01, 2020 TO SEPTEMBER 30, 2020
DOUGLAS JENSON MT. SAN ANTONIO COLLEGE1100 N. GRAND AVENUE WALNUT , CA 91789
ACCOUNT NAME: MT SAN ANTONIO COLLEGE
STRS/PERS PENSION
SECTION 115 TRUST
CITIZENS BUSINESS BANK, AS
TRUSTEE
ACCOUNT NUMBER: 1065000048
RELATIONSHIP
MANAGER: MARIMIL DE LA [email protected]
ASSET SUMMARY
MARKET VALUE PERCENT
CASH AND CASH EQUIVALENTS
EQUITIES
PREFERRED STOCK
FIXED INCOME
ALTERNATIVE INVESTMENTS
Total
221, 825. 94
5, 874, 340. 06
811, 353. 60
4, 467, 138. 45
13, 167. 36
11, 387, 825. 41
1. 9%
51. 6%
7. 1%
39. 3%
0. 1%
100. 0%
ACCOUNT VALUE CHANGE
THIS PERIOD YEAR TO DATE
BEGINNING MARKET VALUE 11,449,965.69 10,849,558.76
DIVIDEND INCOME 17,113.35 40,543.70
NET INTEREST INCOME 36,105.40 83,256.39
FEES 374.03- 5,340.16-
MISCELLANEOUS 0.00 376.74
REALIZED GAIN/LOSS 10,025.99- 28,317.08-
CHANGE IN MARKET VALUE 104,959.01- 447,747.06
ENDING MARKET VALUE 11,387,825.41 11,387,825.41
ACCOUNT STATEMENT PAGE 2
ACCOUNT NUMBER: 1065000048
SEPTEMBER 01, 2020 TO SEPTEMBER 30, 2020
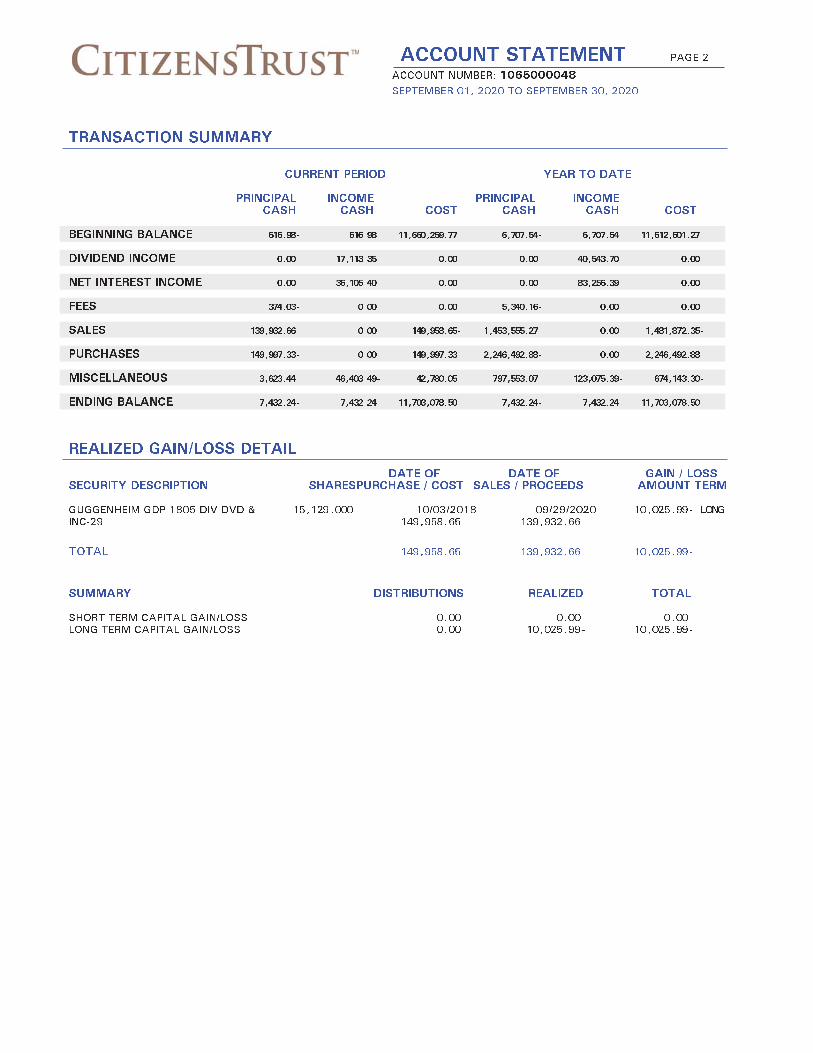
TRANSACTION SUMMARY
CURRENT PERIOD YEAR TO DATE
PRINCIPAL INCOME PRINCIPAL INCOME
CASH CASH COST CASH CASH COST
BEGINNING BALANCE 616.98- 616.98 11,660,259.77 6,707.54- 6,707.54 11,612,601.27
DIVIDEND INCOME 0.00 17,113.35 0.00 0.00 40,543.70 0.00
NET INTEREST INCOME 0.00 36,105.40 0.00 0.00 83,256.39 0.00
FEES 374.03- 0.00 0.00 5,340.16- 0.00 0.00
SALES 139,932.66 0.00 149,958.65- 1,453,555.27 0.00 1,481,872.35-
PURCHASES 149,997.33- 0.00 149,997.33 2,246,492.88- 0.00 2,246,492.88
MISCELLANEOUS 3,623.44 46,403.49- 42,780.05 797,553.07 123,075.39- 674,143.30-
ENDING BALANCE 7,432.24- 7,432.24 11,703,078.50 7,432.24- 7,432.24 11,703,078.50
REALIZED GAIN/LOSS DETAIL
DATE OF DATE OF GAIN / LOSS
SECURITY DESCRIPTION SHARESPURCHASE / COST SALES / PROCEEDS AMOUNT TERM
GUGGENHEIM GDP 1805 DIV DVD & 15,129.000 10/03/2018 09/29/2020 10,025.99- LONG
INC-29 149,958.65 139,932.66
TOTAL 149,958.65 139,932.66 10,025.99-
SUMMARY DISTRIBUTIONS REALIZED TOTAL
SHORT TERM CAPITAL GAIN/LOSS 0.00 0.00 0.00
LONG TERM CAPITAL GAIN/LOSS 0.00 10,025.99- 10,025.99-
ACCOUNT STATEMENT PAGE 3
ACCOUNT NUMBER: 1065000048
SEPTEMBER 01, 2020 TO SEPTEMBER 30, 2020
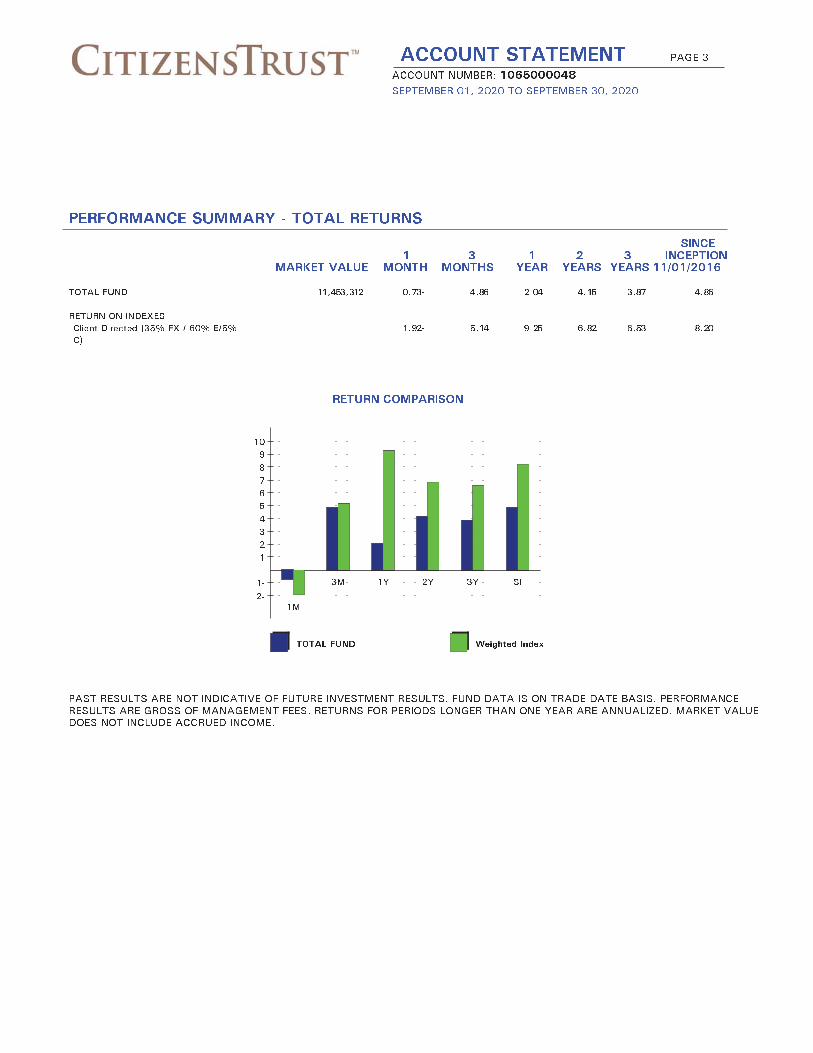
PERFORMANCE SUMMARY - TOTAL RETURNS
SINCE
1 3 1 2 3 INCEPTION
MARKET VALUE MONTH MONTHS YEAR YEARS YEARS 11/01/2016
TOTAL FUND 11,453,312 0.73- 4.86 2.04 4.15 3.87 4.86
RETURN ON INDEXES
Client Directed (35% FX / 60% E/5% 1.92- 5.14 9.25 6.82 6.53 8.20
C)
RETURN COMPARISON
1
2
3
4
5
6
7
8
9
10
1-
2-
1M
3M 1Y 2Y 3Y SI
TOTAL FUND Weighted Index
PAST RESULTS ARE NOT INDICATIVE OF FUTURE INVESTMENT RESULTS. FUND DATA IS ON TRADE DATE BASIS. PERFORMANCE
RESULTS ARE GROSS OF MANAGEMENT FEES. RETURNS FOR PERIODS LONGER THAN ONE YEAR ARE ANNUALIZED. MARKET VALUE
DOES NOT INCLUDE ACCRUED INCOME.

ACCOUNT STATEMENT PAGE 4
ACCOUNT NUMBER: 1065000048
SEPTEMBER 01, 2020 TO SEPTEMBER 30, 2020
ASSET DETAIL
MARKET TAX COST/ EST ANNUAL
VALUE/ UNREALIZED INCOME/ CURRENT
DESCRIPTION PRICE GAIN/LOSS ACCRUED INC YIELD
CASH AND CASH EQUIVALENTS
CITIZENS BUSINESS BANK 221,825.94 221,825.94 443.65 0.20
CBB-CITIZENSTRUST SWEEP ACCOUNT 1.00 0.00 36.97
CASH 0.00
0.00
TOTAL CASH AND CASH EQUIVALENTS 221,825.94 221,825.94 443.65 0.20
0.00 36.97
EQUITY DIVERSIFICATION SUMMARY
INDUSTRY SECTOR MARKET VALUE PERCENT
CONSUMER STAPLES
EQUITY DIVERSIFIED
FOREIGN
INFORMATION TECHNOLOGY
Total
8, 390. 00
5, 638, 724. 83
168, 673. 71
58, 551. 52
5, 874, 340. 06
0. 1%
96. 0%
2. 9%
1. 0%
100. 0%
MARKET TAX COST/ EST ANNUAL
VALUE/ UNREALIZED INCOME/ CURRENT
DESCRIPTION TICKER SHARES PRICE GAIN/LOSS ACCRUED INC YIELD
EQUITIES
CONSUMER STAPLES
MOLSON COORS BREWING CO B TAP 250.000 8,390.00 13,339.38 570.00 6.79
33.56 4,949.38-
TOTAL CONSUMER STAPLES SUB- 8,390.00 13,339.38 570.00 6.79
TOTAL 4,949.38- 0.00
EQUITY DIVERSIFIED
AT&T INC (FORMERLY SBC T 1,749.000 49,863.99 58,201.77 3,637.92 7.30
COMMUNICATIONS CUSIP #78387G103) 28.51 8,337.78-
AMGEN INC AMGN 166.000 42,190.56 37,563.50 1,062.40 2.52
254.16 4,627.06
APPLE INC AAPL 480.000 55,588.80 35,756.36 393.60 0.71
115.81 19,832.44
AUTOMATIC DATA PROCESSING INC ADP 415.000 57,888.35 57,298.31 1,510.60 2.61
139.49 590.04 377.65

ACCOUNT STATEMENT PAGE 5
ACCOUNT NUMBER: 1065000048
SEPTEMBER 01, 2020 TO SEPTEMBER 30, 2020
ASSET DETAIL ( CONTINUED )
MARKET TAX COST/ EST ANNUAL
VALUE/ UNREALIZED INCOME/ CURRENT
DESCRIPTION TICKER SHARES PRICE GAIN/LOSS ACCRUED INC YIELD
EQUITY DIVERSIFIED
AVERY DENNISON CORP COM AVY 306.000 39,119.04 36,265.72 709.92 1.81
(FORMERLY AVERY INTERNATIONAL 127.84 2,853.32
CORP)
BERKSHIRE HATHAWAY FIN INC-CL B BRK/B 115.000 24,488.10 21,857.55
NEW 212.94 2,630.55
CVS CVS 566.000 33,054.40 36,390.23 1,132.00 3.42
58.40 3,335.83-
CARRIER GLOBAL CORP CARR 544.000 16,613.76 98.32 174.08 1.05
30.54 16,515.44
CHIPOTLE MEXICAN GRI-CLASS B CMG 44.000 54,723.24 38,277.01
1,243.71 16,446.23
COSTCO WHOLESALE CORP (FORMERLY COST 201.000 71,355.00 58,800.33 562.80 0.79
COSTCO COMPANIES INC) 355.00 12,554.67
DEERE & CO DE 226.000 50,088.38 36,513.97 687.04 1.37
221.63 13,574.41 171.76
DISNEY (WALT) COMPANY DIS 300.000 37,224.00 35,267.29 528.00 1.42
124.08 1,956.71
EMERSON ELECTRIC CO EMR 1,067.000 69,963.19 57,966.61 2,134.00 3.05
65.57 11,996.58
EXPEDIA INC. EXPE 100.000 9,169.00 13,639.40 136.00 1.48
91.69 4,470.40-
EXXON MOBIL CORP XOM 1,206.000 41,401.98 57,926.72 4,196.88 10.14
34.33 16,524.74-
FIRST TRUST 60,789.000 582,966.51 599,999.59 19,148.54 3.28
9.59 17,033.08-
FIRST TRUST 5,700.000 62,472.00 49,993.56 313.50 0.50
10.96 12,478.44
FIRST TRUST 6,021.000 58,524.12 49,996.58 547.91 0.94
9.72 8,527.54
FIRST TRUST 6,521.000 53,537.41 49,994.55 508.64 0.95
8.21 3,542.86
FIRST TRUST SERIES 39 FEE FLESKX 3,550.000 41,286.50 34,995.90 230.75 0.56
11.63 6,290.60
FIRST TRUST CAP STRENGTH OPP FONQLX 3,523.000 41,183.87 34,996.78 232.52 0.56
SERIES 13 SA FE 11.69 6,187.09
FIRST TRUST 12,845.000 125,752.55 124,990.84 359.66 0.29
9.79 761.71
FIRST TRUST 12,026.000 155,015.14 124,989.83 697.51 0.45
12.89 30,025.31
FIRST TRUST PHARMACEUTICAL FTTAFX 20,036.000 199,157.84 199,995.34 3,245.83 1.63
SELECT PORTFOLIO SERIES 41 9.94 837.50-

ACCOUNT STATEMENT PAGE 6
ACCOUNT NUMBER: 1065000048
SEPTEMBER 01, 2020 TO SEPTEMBER 30, 2020
ASSET DETAIL ( CONTINUED )
MARKET TAX COST/ EST ANNUAL
VALUE/ UNREALIZED INCOME/ CURRENT
DESCRIPTION TICKER SHARES PRICE GAIN/LOSS ACCRUED INC YIELD
EQUITY DIVERSIFIED
FIRST TRUST UIT 5,216.000 50,647.36 49,991.71 192.99 0.38
9.71 655.65
FIRST TRUST UIT 14,969.000 157,623.57 149,999.86 479.01 0.30
10.53 7,623.71
FIRST TRUST 15,205.000 141,254.45 149,997.33 4,804.78 3.40
9.29 8,742.88-
FIRST TRUST ENH SHORT MATURITY FTSM 23,394.000 1,404,107.88 1,405,448.00 21,873.39 1.56
FUND 60.02 1,340.12- 818.79
GENERAL DYNAMICS CORP GD 239.000 33,084.77 36,739.35 1,051.60 3.18
138.43 3,654.58-
GUGGENHEIM EQUITY & INCOME 17,206.000 160,531.98 149,969.22 13,730.39 8.55
PORTFOLIO OF CEF'S SERIES 45 9.33 10,562.76
INTEL CORPORATION INTC 597.000 30,912.66 34,016.33 788.04 2.55
51.78 3,103.67-
INTERNATIONAL BUSINESS MACHINES IBM 494.000 60,104.98 57,693.75 3,220.88 5.36
CORP 121.67 2,411.23
INVESCO FTSE RAFI US 1000 ET ETF PRF 642.000 73,053.18 74,778.62 1,789.90 2.45
113.79 1,725.44-
ISHARES S&P MID-CAP 400 GROW IJK 110.000 26,309.80 25,389.86 239.36 0.91
239.18 919.94
ISHARES RUSSELL 2000 VALUE ETF IWN 326.000 32,381.58 35,533.49 736.43 2.27
99.33 3,151.91-
ISHARES RUSSELL 2000 GROWTH IWO 56.000 12,405.12 11,911.18 81.59 0.66
INDEX FUND 221.52 493.94
ISHARES S&P MIDCAP 400/VALUE ETF IJJ 175.000 23,600.50 25,536.33 559.83 2.37
134.86 1,935.83-
ISHARES EDGE MSCI USA QUALITY QUAL 465.000 48,239.10 45,231.02 766.32 1.59
FACTOR ETF 103.74 3,008.08
ISHARES ETF IXUS 3,131.000 182,662.54 182,721.66 4,467.94 2.45
58.34 59.12-
JOHNSON & JOHNSON INC JNJ 481.000 71,611.28 59,681.70 1,943.24 2.71
148.88 11,929.58
KIMBERLY-CLARK CORP KMB 469.000 69,252.54 58,958.46 2,007.32 2.90
147.66 10,294.08 501.83
MICROSOFT CORP MSFT 408.000 85,814.64 57,291.85 913.92 1.06
210.33 28,522.79
NEXTERA ENERGY INC (FORMERLY FPL NEE 274.000 76,051.44 57,990.00 1,534.40 2.02
GROUP) 277.56 18,061.44
NIKE INC CL B NKE 395.000 49,588.30 35,927.28 387.10 0.78
125.54 13,661.02 96.78

ACCOUNT STATEMENT PAGE 7
ACCOUNT NUMBER: 1065000048
SEPTEMBER 01, 2020 TO SEPTEMBER 30, 2020
ASSET DETAIL ( CONTINUED )
MARKET TAX COST/ EST ANNUAL
VALUE/ UNREALIZED INCOME/ CURRENT
DESCRIPTION TICKER SHARES PRICE GAIN/LOSS ACCRUED INC YIELD
EQUITY DIVERSIFIED
NOVARTIS AG SPONSORED ADR NVS 724.000 62,959.04 58,516.16 1,453.07 2.31
86.96 4,442.88
OTIS WORLDWIDE CORP OTIS 272.000 16,978.24 149.97 217.60 1.28
62.42 16,828.27
PNC FINANCIAL SERVICES GROUP INC PNC 314.000 34,511.74 35,575.70 1,444.40 4.19
109.91 1,063.96-
PPG INDUSTRIES INC PPG 332.000 40,530.56 36,215.34 717.12 1.77
122.08 4,315.22
QUALCOMM CORP QCOM 420.000 49,425.60 35,351.49 1,092.00 2.21
117.68 14,074.11
RAYTHEON TECHNOLOGIES RTX 544.000 31,301.76 58,810.21 1,033.60 3.30
57.54 27,508.45-
SMITH (A.O.) CORPORATION AOS 768.000 40,550.40 36,072.02 737.28 1.82
52.80 4,478.38
STRYKER CORP SYK 181.000 37,714.97 35,045.14 416.30 1.10
208.37 2,669.83 104.08
SYNCHRONY FINANCIAL SYF 1,567.000 41,008.39 35,990.56 1,378.96 3.36
26.17 5,017.83
3M COMPANY MMM 403.000 64,552.54 58,764.78 2,369.64 3.67
160.18 5,787.76
UMPQUA HOLDINDS CORP UMPQ 2,938.000 31,201.56 36,011.87 2,467.92 7.91
10.62 4,810.31-
V.F CORPORATION VFC 899.000 63,154.75 57,450.76 1,726.08 2.73
70.25 5,703.99
VANGUARD GROWTH ETF VUG 770.000 175,259.70 143,556.50 1,332.87 0.76
227.61 31,703.20
VANGUARD VALUE ETF VTV 1,671.000 174,636.21 182,380.77 5,280.36 3.02
104.51 7,744.56-
VMWARE INC-CLASS A VMW 91.000 13,073.97 12,692.25
143.67 381.72
TOTAL EQUITY DIVERSIFIED SUB- 5,638,724.83 5,379,166.58 125,385.73 2.22
TOTAL 259,558.25 2,070.89
FOREIGN
SCHLUMBERGER LTD SLB 1,730.000 26,918.80 35,619.55 865.00 3.21
15.56 8,700.75- 216.25
VANGUARD FTSE EMERGING MARKETS VWO 1,472.000 63,649.28 61,906.05 1,785.54 2.81
ETF 43.24 1,743.23
ALCON INC CHF .04 405.000 23,064.75 22,482.98
56.95 581.77

ACCOUNT STATEMENT PAGE 8
ACCOUNT NUMBER: 1065000048
SEPTEMBER 01, 2020 TO SEPTEMBER 30, 2020
ASSET DETAIL ( CONTINUED )
MARKET TAX COST/ EST ANNUAL
VALUE/ UNREALIZED INCOME/ CURRENT
DESCRIPTION TICKER SHARES PRICE GAIN/LOSS ACCRUED INC YIELD
FOREIGN
CHUBB LTD CB 474.000 55,040.88 59,911.43 1,478.88 2.69
116.12 4,870.55- 369.72
TOTAL FOREIGN SUB- 168,673.71 179,920.01 4,129.42 2.45
TOTAL 11,246.30- 585.97
INFORMATION TECHNOLOGY
ACTIVISION BLIZZARD INC ATVI 556.000 45,008.20 36,265.29 227.96 0.51
80.95 8,742.91
FIDELITY NATL INFORMATION SVCS FIS 92.000 13,543.32 12,963.93 128.80 0.95
FORMERLY NATL FINL INC 147.21 579.39
TOTAL INFORMATION TECHNOLOGY SUB- 58,551.52 49,229.22 356.76 0.61
TOTAL 9,322.30 0.00
TOTAL EQUITIES 5,874,340.06 5,621,655.19 130,441.91 2.22
252,684.87 2,656.86
EQUITY DIVERSIFICATION SUMMARY
INDUSTRY SECTOR MARKET VALUE PERCENT
CORPORATE BONDS
EQUITY DIVERSIFIED
Total
53, 960. 00
757, 393. 60
811, 353. 60
6. 7%
93. 3%
100. 0%
MARKET TAX COST/ EST ANNUAL
VALUE/ UNREALIZED INCOME/ CURRENT
DESCRIPTION TICKER SHARES PRICE GAIN/LOSS ACCRUED INC YIELD
PREFERRED STOCK
CORPORATE BONDS
AT&T INC DTD 07/25/18 2,000.000 53,960.00 50,000.00 2,812.00 5.21
26.98 3,960.00
TOTAL CORPORATE BONDS SUB- 53,960.00 50,000.00 2,812.00 5.21
TOTAL 3,960.00 0.00

ACCOUNT STATEMENT PAGE 9
ACCOUNT NUMBER: 1065000048
SEPTEMBER 01, 2020 TO SEPTEMBER 30, 2020
ASSET DETAIL ( CONTINUED )
MARKET TAX COST/ EST ANNUAL
VALUE/ UNREALIZED INCOME/ CURRENT
DESCRIPTION TICKER SHARES PRICE GAIN/LOSS ACCRUED INC YIELD
EQUITY DIVERSIFIED
B RILEY FINANCIAL INC DTD 2,000.000 48,800.00 50,000.00 3,626.00 7.43
12/13/17 CALL 24.40 1,200.00-
BRUNSWICK CORPORATION 1,000.000 27,440.00 25,000.00 1,625.00 5.92
27.44 2,440.00 406.25
CHIMERA INVESTMENT CORP SERIES C 2,000.000 37,840.00 50,000.00 3,876.00 10.24
DTD 09/20/18 PERPETUAL CALL 18.92 12,160.00-
COWEN GROUP INC DTD 12/8/17 2,000.000 51,420.00 50,000.00 3,674.00 7.15
CALLABLE PFD 25.71 1,420.00
GLOBAL NET LEASE INC PREFERRED 16,000.000 403,040.00 400,000.00 27,504.00 6.82
SERIES B CALLABLE 11/26/24 @25 25.19 3,040.00
PROSPECT CAPTIAL CORPORATION DTD 2,000.000 50,800.00 50,000.00 3,438.00 6.77
12/05/18 6.875% 06/15/2029-2021 25.40 800.00
PROSPECT CAPTIAL CORPORATION 2,000.000 50,053.60 50,000.00 3,126.00 6.25
PFDS DTD 06/07/18 MATURE ON 25.03 53.60
06/15/28 6.25%
TWO HARBORS PERPETUAL CALL 4,000.000 88,000.00 100,000.00 8,124.00 9.23
04/27/27 @25.00 DTD 03/07/17 22.00 12,000.00-
TOTAL EQUITY DIVERSIFIED SUB- 757,393.60 775,000.00 54,993.00 7.26
TOTAL 17,606.40- 406.25
TOTAL PREFERRED STOCK 811,353.60 825,000.00 57,805.00 7.12
13,646.40- 406.25
BOND QUALITY SUMMARY
S & P QUALITY RATING MARKET VALUE PERCENT
A-
BBB+
BBB
BBB-
BB+
BB
BB-
B+
B
All Others-Combined
Total
395, 724. 00
232, 292. 00
429, 127. 50
782, 542. 50
669, 851. 00
201, 980. 00
121, 722. 00
255, 625. 00
202, 674. 00
1, 175, 600. 45
4, 467, 138. 45
8. 9%
5. 2%
9. 6%
17. 5%
15. 0%
4. 5%
2. 7%
5. 7%
4. 5%
26. 4%
100. 0%

ACCOUNT STATEMENT PAGE 10
ACCOUNT NUMBER: 1065000048
SEPTEMBER 01, 2020 TO SEPTEMBER 30, 2020
ASSET DETAIL ( CONTINUED )
BOND MATURITY SUMMARY
YEARS TO MATURITY PAR VALUE PERCENT
400,000
800,000
1,200,000
1,600,000
2,000,000
LESS THAN 1 YEAR
1-2 YEARS
2-5 YEARS
5-10 YEARS
10-15 YEARS
20+ YEARS
Total
204, 031. 00
904, 000. 00
1, 827, 000. 00
1, 400, 000. 00
100, 000. 00
450, 000. 00
4, 885, 031. 00
4. 2%
18. 5%
37. 4%
28. 6%
2. 1%
9. 2%
100. 0%
AVERAGE TIME TO MATURITY: 9.2 YEARS CURRENT YIELD: 5.99%
MARKET TAX COST/ EST ANNUAL
VALUE/ UNREALIZED INCOME/ CURRENT
DESCRIPTION RATING PAR VALUE PRICE GAIN/LOSS ACCRUED INC YIELD
FIXED INCOME
CORPORATE
QUAD GRAPHICS DTD 03/09/15 7% CCC+ 250,000.000 220,000.00 248,750.00 17,500.00 7.95
05/01/2022 88.00 28,750.00- 7,291.67
PROSPECT CAPTIAL CORPORATION DTD BBB- 300,000.000 309,696.00 311,625.00 17,625.00 5.69
03/08/13 5.875% 03/15/2023 103.23 1,929.00- 783.33
PITNEY BOWES INC DTD 09/15/17 BB 76,000.000 75,240.00 72,485.00 4,332.00 5.76
CALL 5.7% 04/01/2023-2023 99.00 2,755.00 2,166.00
AMTRUST FINANCIAL SERVICES SR 200,000.000 185,440.00 202,500.00 12,250.00 6.61
UNSECURED DTD 08/15/13 6.125% 92.72 17,060.00- 1,565.28
08/15/2023
INTL GAME TECH DTD 09/12/13 BB 100,000.000 102,000.00 100,500.00 5,350.00 5.25
5.35% 10/15/2023 102.00 1,500.00 2,466.94
VALARIS PLC 2102 INT BEARING NR 200,000.000 14,272.00 171,000.00 9,500.00 66.56
CORP DEBT DTD 1/24/2020 4.75% 7.14 156,728.00- 2,005.56
01/15/2024
CBL & ASSOCIATES DTD 10/01/14 NR 100,000.000 37,500.00 96,250.00 4,600.00 12.27
4.6% 10/15/2024-2024 37.50 58,750.00- 2,121.11
SALLY HOLDINGS DTD 11/18/15 B 200,000.000 202,674.00 209,250.00 11,250.00 5.55
5.625% 12/01/2025-2020 101.34 6,576.00- 3,750.00
CBL & ASSOCIATES DTD 12/06/16 NR 100,000.000 37,500.00 97,750.00 5,950.00 15.87
5.95% 12/15/2026-2026 37.50 60,250.00- 1,751.94
JPMORGAN CHASE & CO DTD 11/26/19 A- 200,000.000 198,318.00 198,900.00 5,000.00 2.52
2.5% 05/29/2027-2021 99.16 582.00- 1,694.44
MBIA INC 07/14/97 7.15% NR 100,000.000 93,000.00 108,750.00 7,150.00 7.69
07/15/2027 93.00 15,750.00- 1,509.44
ACCOUNT STATEMENT PAGE 11
ACCOUNT NUMBER: 1065000048
SEPTEMBER 01, 2020 TO SEPTEMBER 30, 2020
ASSET DETAIL ( CONTINUED )
MARKET TAX COST/ EST ANNUAL
VALUE/ UNREALIZED INCOME/ CURRENT
DESCRIPTION RATING PAR VALUE PRICE GAIN/LOSS ACCRUED INC YIELD
CORPORATE
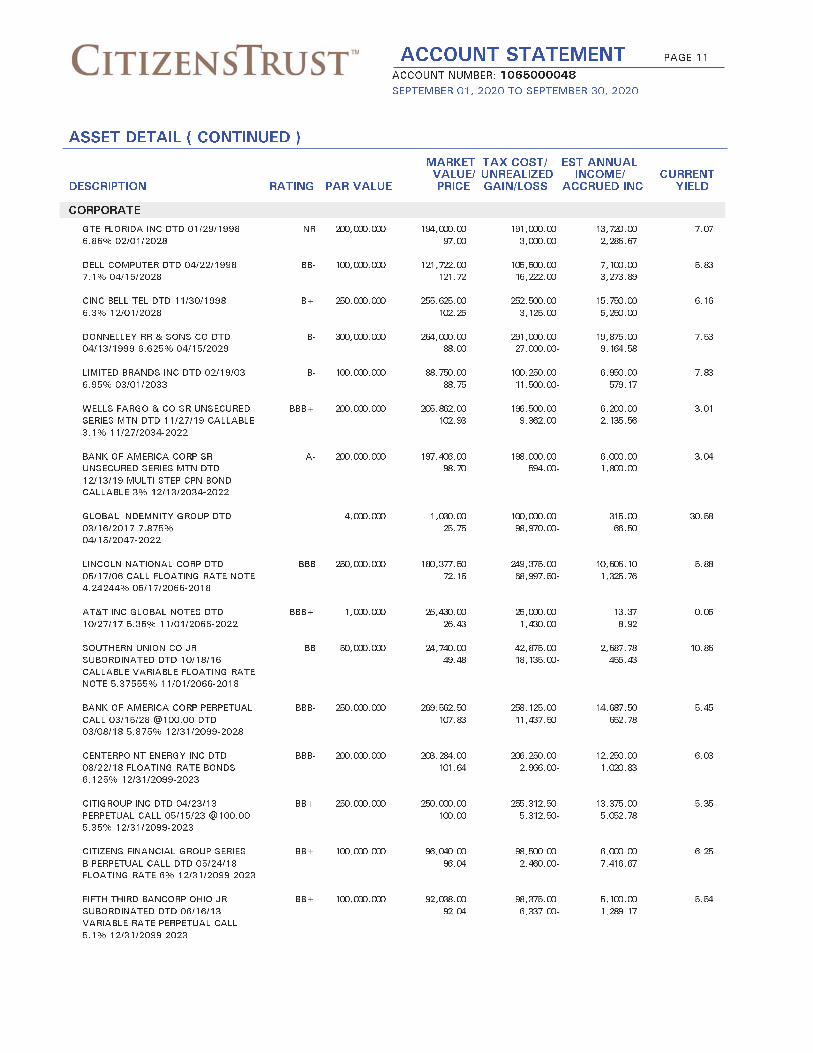
GTE FLORIDA INC DTD 01/29/1998 NR 200,000.000 194,000.00 191,000.00 13,720.00 7.07
6.86% 02/01/2028 97.00 3,000.00 2,286.67
DELL COMPUTER DTD 04/22/1998 BB- 100,000.000 121,722.00 105,500.00 7,100.00 5.83
7.1% 04/15/2028 121.72 16,222.00 3,273.89
CINC BELL TEL DTD 11/30/1998 B+ 250,000.000 255,625.00 252,500.00 15,750.00 6.16
6.3% 12/01/2028 102.25 3,125.00 5,250.00
DONNELLEY RR & SONS CO DTD B- 300,000.000 264,000.00 291,000.00 19,875.00 7.53
04/13/1999 6.625% 04/15/2029 88.00 27,000.00- 9,164.58
LIMITED BRANDS INC DTD 02/19/03 B- 100,000.000 88,750.00 100,250.00 6,950.00 7.83
6.95% 03/01/2033 88.75 11,500.00- 579.17
WELLS FARGO & CO SR UNSECURED BBB+ 200,000.000 205,862.00 196,500.00 6,200.00 3.01
SERIES MTN DTD 11/27/19 CALLABLE 102.93 9,362.00 2,135.56
3.1% 11/27/2034-2022
BANK OF AMERICA CORP SR A- 200,000.000 197,406.00 198,000.00 6,000.00 3.04
UNSECURED SERIES MTN DTD 98.70 594.00- 1,800.00
12/13/19 MULTI STEP CPN BOND
CALLABLE 3% 12/13/2034-2022
GLOBAL INDEMNITY GROUP DTD 4,000.000 1,030.00 100,000.00 315.00 30.58
03/16/2017 7.875% 25.75 98,970.00- 66.50
04/15/2047-2022
LINCOLN NATIONAL CORP DTD BBB 250,000.000 180,377.50 249,375.00 10,606.10 5.88
05/17/06 CALL FLOATING RATE NOTE 72.15 68,997.50- 1,325.76
4.24244% 05/17/2066-2018
AT&T INC GLOBAL NOTES DTD BBB+ 1,000.000 26,430.00 25,000.00 13.37 0.05
10/27/17 5.35% 11/01/2066-2022 26.43 1,430.00 8.92
SOUTHERN UNION CO JR BB 50,000.000 24,740.00 42,875.00 2,687.78 10.86
SUBORDINATED DTD 10/18/16 49.48 18,135.00- 455.43
CALLABLE VARIABLE FLOATING RATE
NOTE 5.37555% 11/01/2066-2018
BANK OF AMERICA CORP PERPETUAL BBB- 250,000.000 269,562.50 258,125.00 14,687.50 5.45
CALL 03/15/28 @100.00 DTD 107.83 11,437.50 652.78
03/08/18 5.875% 12/31/2099-2028
CENTERPOINT ENERGY INC DTD BBB- 200,000.000 203,284.00 206,250.00 12,250.00 6.03
08/22/18 FLOATING RATE BONDS 101.64 2,966.00- 1,020.83
6.125% 12/31/2099-2023
CITIGROUP INC DTD 04/23/13 BB+ 250,000.000 250,000.00 255,312.50 13,375.00 5.35
PERPETUAL CALL 05/15/23 @100.00 100.00 5,312.50- 5,052.78
5.35% 12/31/2099-2023
CITIZENS FINANCIAL GROUP SERIES BB+ 100,000.000 96,040.00 98,500.00 6,000.00 6.25
B PERPETUAL CALL DTD 05/24/18 96.04 2,460.00- 7,416.67
FLOATING RATE 6% 12/31/2099-2023
FIFTH THIRD BANCORP OHIO JR BB+ 100,000.000 92,038.00 98,375.00 5,100.00 5.54
SUBORDINATED DTD 06/16/13 92.04 6,337.00- 1,289.17
VARIABLE RATE PERPETUAL CALL
5.1% 12/31/2099-2023

ACCOUNT STATEMENT PAGE 12
ACCOUNT NUMBER: 1065000048
SEPTEMBER 01, 2020 TO SEPTEMBER 30, 2020
ASSET DETAIL ( CONTINUED )
MARKET TAX COST/ EST ANNUAL
VALUE/ UNREALIZED INCOME/ CURRENT
DESCRIPTION RATING PAR VALUE PRICE GAIN/LOSS ACCRUED INC YIELD
CORPORATE
FIFTH THIRD BANCORP OHIO BB+ 150,000.000 132,363.00 146,250.00 7,350.00 5.55
PERPETUAL CALL 09/30/19 @100.00 88.24 13,887.00- 20.42
DTD 06/02/14 FLOATING RATE 4.9%
12/31/2099
GENERAL MOTORS FINL CO SERIES B BB+ 100,000.000 99,410.00 100,750.00 6,500.00 6.54
DTD 09/24/18 PERPETUAL CALL 99.41 1,340.00- 18.06
FLOATING RATE NOTE 6.5%
12/31/2099-2028
SCHWAB CHARLES CORP NEW BBB 250,000.000 248,750.00 245,312.50 11,562.50 4.65
PERPETUAL CALL 03/01/22 @100.00 99.50 3,437.50 963.54
DTD 10/24/16 4.625%
12/31/2099-2022
TOTAL CORPORATE SUB- 4,427,030.00 4,978,635.00 266,549.25 6.02
TOTAL 551,605.00- 69,886.44
MISCELLANEOUS
FIRST TRUST SHORT DURATION FIXED 4,031.000 40,108.45 39,991.15 894.88 2.23
INCOME MODEL PORTFOLIO 9.95 117.30
TOTAL MISCELLANEOUS SUB- 40,108.45 39,991.15 894.88 2.23
TOTAL 117.30 0.00
TOTAL FIXED INCOME 4,467,138.45 5,018,626.15 267,444.13 5.99
551,487.70- 69,886.44
MARKET TAX COST/ EST ANNUAL
VALUE/ UNREALIZED INCOME/ CURRENT
DESCRIPTION TICKER SHARES PRICE GAIN/LOSS ACCRUED INC YIELD
ALTERNATIVE INVESTMENTS
ELEMENTS ROGERS TOTAL RETURN RJI 3,048.000 13,167.36 15,971.22
4.32 2,803.86-
TOTAL ALTERNATIVE INVESTMENTS 13,167.36 15,971.22 0.00 0.00
2,803.86- 0.00
TOTAL ASSETS 11,387,825.41 11,703,078.50 456,134.69 4.01
315,253.09- 72,986.5272,986.52
TOTAL ACCRUED INC 72,986.52 72,986.52
GRAND TOTAL ASSETS 11,460,811.93 11,776,065.02 456,134.69 4.01
315,253.09- 72,986.52

ACCOUNT STATEMENT PAGE 13
ACCOUNT NUMBER: 1065000048
SEPTEMBER 01, 2020 TO SEPTEMBER 30, 2020
TRANSACTION DETAIL
PRINCIPAL INCOME GAIN /
DATE DESCRIPTION CASH CASH COST LOSS
BEGINNING BALANCE 616.98- 616.98 11,660,259.77
DIVIDEND INCOME
09/01/20 DIVIDEND ON 597 SHS INTEL 197.01
CORPORATION AT 0.33 PER SHARE
PAYABLE 09/01/2020 EX DATE
08/06/2020
09/01/20 DIVIDEND ON CITIZENS BUSINESS 27.90
BANK CBB-CITIZENSTRUST SWEEP
ACCOUNT PAYABLE 09/01/2020
09/03/20 DIVIDEND ON 23,394 SHS FIRST 888.97
TRUST ENH SHORT MATURITY FUND AT
.038 PER SHARE PAYABLE
09/03/2020 EX DATE 08/31/2020
09/08/20 DIVIDEND ON 166 SHS AMGEN INC AT 265.60
1.60 PER SHARE PAYABLE
09/08/2020 EX DATE 08/14/2020
09/08/20 DIVIDEND ON 481 SHS JOHNSON & 485.81
JOHNSON INC AT 1.01 PER SHARE
PAYABLE 09/08/2020 EX DATE
08/24/2020
09/10/20 DIVIDEND ON 494 SHS 805.22
INTERNATIONAL BUSINESS MACHINES
CORP AT 1.63 PER SHARE PAYABLE
09/10/2020 EX DATE 08/07/2020
09/10/20 DIVIDEND ON 1,206 SHS EXXON 1,049.22
MOBIL CORP AT 0.87 PER SHARE
PAYABLE 09/10/2020 EX DATE
08/12/2020
09/10/20 DIVIDEND ON 1,067 SHS EMERSON 533.50
ELECTRIC CO AT 0.50 PER SHARE
PAYABLE 09/10/2020 EX DATE
08/13/2020
09/10/20 DIVIDEND ON 544 SHS RAYTHEON 258.40
TECHNOLOGIES AT .475 PER SHARE
PAYABLE 09/10/2020 EX DATE
08/13/2020
09/10/20 DIVIDEND ON 408 SHS MICROSOFT 208.08
CORP AT 0.51 PER SHARE PAYABLE
09/10/2020 EX DATE 08/19/2020
09/10/20 DIVIDEND ON 272 SHS OTIS 54.40
WORLDWIDE CORP AT 0.20 PER SHARE
PAYABLE 09/10/2020 EX DATE
08/20/2020
09/11/20 DIVIDEND ON 332 SHS PPG 179.28
INDUSTRIES INC AT 0.54 PER SHARE
PAYABLE 09/11/2020 EX DATE
08/07/2020

ACCOUNT STATEMENT PAGE 14
ACCOUNT NUMBER: 1065000048
SEPTEMBER 01, 2020 TO SEPTEMBER 30, 2020
TRANSACTION DETAIL ( CONTINUED )
PRINCIPAL INCOME GAIN /
DATE DESCRIPTION CASH CASH COST LOSS
09/14/20 DIVIDEND ON 403 SHS 3M COMPANY 592.41
AT 1.47 PER SHARE PAYABLE
09/12/2020 EX DATE 08/21/2020
EFFECTIVE 09/12/2020
09/15/20 DIVIDEND ON 274 SHS NEXTERA 383.60
ENERGY INC (FORMERLY FPL GROUP)
AT 1.40 PER SHARE PAYABLE
09/15/2020 EX DATE 08/27/2020
09/15/20 DIVIDEND ON 2,000 SHS COWEN 918.75
GROUP INC DTD 12/8/17 CALLABLE
PFD AT .459375 PER SHARE PAYABLE
09/15/2020 EX DATE 08/31/2020
09/15/20 DIVIDEND ON 2,000 SHS PROSPECT 859.38
CAPTIAL CORPORATION DTD 12/05/18
6.875% 06/15/2029-2021 AT
.4296875 PER SHARE PAYABLE
09/15/2020 EX DATE 08/31/2020
09/15/20 DIVIDEND ON 2,000 SHS PROSPECT 781.25
CAPTIAL CORPORATION PFDS DTD
06/07/18 MATURE ON 06/15/28
6.25% AT .390625 PER SHARE
PAYABLE 09/15/2020 EX DATE
08/31/2020
09/16/20 DIVIDEND ON 306 SHS AVERY 177.48
DENNISON CORP COM (FORMERLY
AVERY INTERNATIONAL CORP) AT
0.58 PER SHARE PAYABLE
09/16/2020 EX DATE 09/01/2020
09/21/20 DIVIDEND ON 899 SHS V.F 431.52
CORPORATION AT 0.48 PER SHARE
PAYABLE 09/21/2020 EX DATE
09/09/2020
09/24/20 DIVIDEND ON 420 SHS QUALCOMM 273.00
CORP AT 0.65 PER SHARE PAYABLE
09/24/2020 EX DATE 09/02/2020
09/24/20 DIVIDEND ON 1,472 SHS VANGUARD 626.48
FTSE EMERGING MARKETS ETF AT
.4256 PER SHARE PAYABLE
09/24/2020 EX DATE 09/21/2020
09/25/20 DIVIDEND ON 60,789 SHS FIRST 1,641.30
TRUST AT .027 PER SHARE PAYABLE
09/25/2020 EX DATE 09/10/2020
09/25/20 DIVIDEND ON 4,031 SHS FIRST 72.56
TRUST SHORT DURATION FIXED
INCOME MODEL PORTFOLIO AT .018
PER SHARE PAYABLE 09/25/2020 EX
DATE 09/10/2020

ACCOUNT STATEMENT PAGE 15
ACCOUNT NUMBER: 1065000048
SEPTEMBER 01, 2020 TO SEPTEMBER 30, 2020
TRANSACTION DETAIL ( CONTINUED )
PRINCIPAL INCOME GAIN /
DATE DESCRIPTION CASH CASH COST LOSS
09/25/20 DIVIDEND ON 92 SHS FIDELITY NATL 32.20
INFORMATION SVCS FORMERLY NATL
FINL INC AT 0.35 PER SHARE
PAYABLE 09/25/2020 EX DATE
09/10/2020
09/25/20 DIVIDEND ON 17,206 SHS 1,304.22
GUGGENHEIM EQUITY & INCOME
PORTFOLIO OF CEF'S SERIES 45 AT
.0758 PER SHARE PAYABLE
09/25/2020 EX DATE 09/15/2020
09/28/20 DIVIDEND ON 15,129 SHS 600.62
GUGGENHEIM GDP 1805 DIV DVD &
INC-29 AT .0397 PER SHARE
PAYABLE 09/28/2020 EX DATE
09/24/2020
09/29/20 DIVIDEND ON 110 SHS ISHARES S&P 56.29
MID-CAP 400 GROW AT .511753 PER
SHARE PAYABLE 09/29/2020 EX DATE
09/23/2020
09/29/20 DIVIDEND ON 326 SHS ISHARES 188.24
RUSSELL 2000 VALUE ETF AT .57741
PER SHARE PAYABLE 09/29/2020 EX
DATE 09/23/2020
09/29/20 DIVIDEND ON 56 SHS ISHARES 18.39
RUSSELL 2000 GROWTH INDEX FUND
AT .328341 PER SHARE PAYABLE
09/29/2020 EX DATE 09/23/2020
09/29/20 DIVIDEND ON 175 SHS ISHARES S&P 132.60
MIDCAP 400/VALUE ETF AT .757737
PER SHARE PAYABLE 09/29/2020 EX
DATE 09/23/2020
09/29/20 DIVIDEND ON 465 SHS ISHARES EDGE 205.33
MSCI USA QUALITY FACTOR ETF AT
.441564 PER SHARE PAYABLE
09/29/2020 EX DATE 09/23/2020
09/30/20 DIVIDEND ON 2,000 SHS CHIMERA 968.75
INVESTMENT CORP SERIES C DTD
09/20/18 PERPETUAL CALL AT
.484375 PER SHARE PAYABLE
09/30/2020 EX DATE 09/17/2020
09/30/20 DIVIDEND ON 642 SHS INVESCO FTSE 387.22
RAFI US 1000 ET ETF AT .60315
PER SHARE PAYABLE 09/30/2020 EX
DATE 09/21/2020
09/30/20 DIVIDEND ON 770 SHS VANGUARD 312.77
GROWTH ETF AT .4062 PER SHARE
PAYABLE 09/30/2020 EX DATE
09/25/2020

ACCOUNT STATEMENT PAGE 16
ACCOUNT NUMBER: 1065000048
SEPTEMBER 01, 2020 TO SEPTEMBER 30, 2020
TRANSACTION DETAIL ( CONTINUED )
PRINCIPAL INCOME GAIN /
DATE DESCRIPTION CASH CASH COST LOSS
09/30/20 DIVIDEND ON 1,671 SHS VANGUARD 1,195.60
VALUE ETF AT .7155 PER SHARE
PAYABLE 09/30/2020 EX DATE
09/25/2020
TOTAL DIVIDEND INCOME 0.00 17,113.35 0.00 0.00
NET INTEREST INCOME
09/01/20 INTEREST ON 100,000 UNITS 3,475.00
LIMITED BRANDS INC DTD 02/19/03
6.95% 03/01/2033 PAYABLE
09/01/2020
09/03/20 INTEREST ON 200,000 UNITS 6,125.00
CENTERPOINT ENERGY INC DTD
08/22/18 FLOATING RATE BONDS
6.125% 12/31/2099-2023 PAYABLE
09/01/2020 EFFECTIVE 09/01/2020
09/03/20 INTEREST ON 250,000 UNITS SCHWAB 5,781.25
CHARLES CORP NEW PERPETUAL CALL
03/01/22 @100.00 DTD 10/24/16
4.625% 12/31/2099-2022 PAYABLE
09/01/2020 EFFECTIVE 09/01/2020
09/15/20 INTEREST ON 250,000 UNITS BANK 7,343.75
OF AMERICA CORP PERPETUAL CALL
03/15/28 @100.00 DTD 03/08/18
5.875% 12/31/2099-2028 PAYABLE
09/15/2020
09/15/20 INTEREST ON 300,000 UNITS 8,812.50
PROSPECT CAPTIAL CORPORATION DTD
03/08/13 5.875% 03/15/2023
PAYABLE 09/15/2020
09/30/20 INTEREST ON 150,000 UNITS FIFTH 1,317.90
THIRD BANCORP OHIO PERPETUAL
CALL 09/30/19 @100.00 DTD
06/02/14 FLOATING RATE 4.9%
12/31/2099 PAYABLE 09/30/2020
09/30/20 INTEREST ON 100,000 UNITS 3,250.00
GENERAL MOTORS FINL CO SERIES B
DTD 09/24/18 PERPETUAL CALL
FLOATING RATE NOTE 6.5%
12/31/2099-2028 PAYABLE
09/30/2020
TOTAL NET INTEREST INCOME 0.00 36,105.40 0.00 0.00

ACCOUNT STATEMENT PAGE 17
ACCOUNT NUMBER: 1065000048
SEPTEMBER 01, 2020 TO SEPTEMBER 30, 2020
TRANSACTION DETAIL ( CONTINUED )
PRINCIPAL INCOME GAIN /
DATE DESCRIPTION CASH CASH COST LOSS
FEES
09/25/20 CUSTODIAL FEE CITIZENS BUSINESS 374.03-
BANK
FOR THE PERIOD ENDING 09/20/2020
TOTAL FEES 374.03- 0.00 0.00 0.00
SALES
09/02/20 RECEIVED 4-FOR-1 STK SPLIT 360
SHS APPLE INC
09/29/20 REDEEMED 09/29/2020 15,129 SHS 139,932.66 149,958.65- 10,025.99-
GUGGENHEIM GDP 1805 DIV DVD &
INC-29 FULL CALL/EARLY
REDEMPTION
TOTAL SALES 139,932.66 0.00 149,958.65- 10,025.99-
PURCHASES
09/01/20 PURCHASED 15,205 SHS FIRST TRUST 149,997.33- 149,997.33
ON 08/28/2020 AT 9.865 THRU
DAVIDSON, D.A. AND CO., INC
TOTAL PURCHASES 149,997.33- 0.00 149,997.33 0.00
MISCELLANEOUS
09/01/20 TRANSFERRED TO PRINCIPAL 616.98-
09/01/20 TRANSFERRED FROM INCOME 616.98
09/02/20 TRANSFERRED TO PRINCIPAL 3,699.91-
09/02/20 TRANSFERRED FROM INCOME 3,699.91
09/04/20 TRANSFERRED TO PRINCIPAL 12,795.22-
09/04/20 TRANSFERRED FROM INCOME 12,795.22
09/09/20 TRANSFERRED TO PRINCIPAL 751.41-
09/09/20 TRANSFERRED FROM INCOME 751.41
09/11/20 TRANSFERRED TO PRINCIPAL 2,908.82-
09/11/20 TRANSFERRED FROM INCOME 2,908.82
09/14/20 TRANSFERRED TO PRINCIPAL 179.28-
09/14/20 TRANSFERRED FROM INCOME 179.28
09/15/20 TRANSFERRED TO PRINCIPAL 592.41-
09/15/20 TRANSFERRED FROM INCOME 592.41
09/16/20 TRANSFERRED TO PRINCIPAL 19,099.23-

ACCOUNT STATEMENT PAGE 18
ACCOUNT NUMBER: 1065000048
SEPTEMBER 01, 2020 TO SEPTEMBER 30, 2020
TRANSACTION DETAIL ( CONTINUED )
PRINCIPAL INCOME GAIN /
DATE DESCRIPTION CASH CASH COST LOSS
09/16/20 TRANSFERRED FROM INCOME 19,099.23
09/17/20 TRANSFERRED TO PRINCIPAL 177.48-
09/17/20 TRANSFERRED FROM INCOME 177.48
09/22/20 TRANSFERRED TO PRINCIPAL 431.52-
09/22/20 TRANSFERRED FROM INCOME 431.52
09/25/20 TRANSFERRED TO PRINCIPAL 899.48-
09/25/20 TRANSFERRED FROM INCOME 899.48
09/28/20 TRANSFERRED TO PRINCIPAL 3,050.28-
09/28/20 TRANSFERRED FROM INCOME 3,050.28
09/29/20 TRANSFERRED TO PRINCIPAL 600.62-
09/29/20 TRANSFERRED FROM INCOME 600.62
09/30/20 TRANSFERRED TO PRINCIPAL 600.85-
09/30/20 TRANSFERRED FROM INCOME 600.85
NET CASH MANAGEMENT 42,780.05- 42,780.05
TOTAL MISCELLANEOUS 3,623.44 46,403.49- 42,780.05 0.00
ENDING BALANCE 7,432.24- 7,432.24 11,703,078.50 10,025.99-
DISCLOSURE
CitizensTrust may receive research and other benefits from Brokers/Dealers which may
be considered compensation. Upon request, we will disclose details of any compensation received.
We have added an additional benchmark to your performance insert. Call for details.
MARKET PERSPECTIVE
WE HOPE THAT YOU AND YOURS ARE SAFE/HEALTHY DURING THESE CHALLENGING TIMES. PLEASE READ OUR QUARTERLY MARKET
PERSPECTIVES AT WWW.CBBANK.COM UNDER RECENT DOCUMENTS. BE ASSURED WE ARE WATCHING THE MARKETS CLOSELY, AND
IF YOU HAVE ANY QUESTIONS OR CONCERNS WE ENCOURAGE YOU TO CONTACT YOUR RELATIONSHIP MANAGER.