m.tech project report - iit hyderabad
TRANSCRIPT

M.Tech Project Report
RSSI Based Indoor Passive Localization For IntrusionDetection And Tracking
ByRAM PRAVESH KUMAR
(EE10M14)
Adviser:Dr. P.RAJALAKSHMI
Department of Electrical Engineering
Indian Institute of Technology Hyderabad
Ordinance Factory Estate , Yeddumailaram, Medak-502205.

1

2

ACKNOWLEDGEMENTS
My deepest gratitude is to my advisor, Dr.P .Rajalakshami.I have been amaz-ingly fortunate to have an advisor who gave me the freedom to explore onmy own, and at the same time the guidance to recover when my steps fal-tered.Her patience and support helped me to finish this dissertation.
I would like to thank my family and friends and the one above all of us,the omnipresent God for the support they provided
A very special thanks to R.D.Praveen Kumar and V.Santhanakumar fortheir discussions throughout the project.
Finally I would like to thank family of IITH
3

4

DEDICATION
To the four pillars of my life: God, my family,my friends and my teachers.
5
Abstract
A real time system for intrusion detection and tracking based on wirelesssensor network technology is designed by using the IITH mote which is de-veloped and designed in IIT Hyderabad as the communication module in thenetwork.This paper describes the Device-Free Passive Localization systembased on RSSI.The main objective of this paper is to design a DFP Local-ization system that is easily redeployable, reconfigurable, easy to use, andoperates in real time.
In addition the detection of humans is to be done.The em-bedded intrusion detection algorithm is designed so that it is able to copewith the limited resources, in terms of computational power and availablememory space, of the microcontroller unit (MCU) found in the nodes. andvarious challenges and problem faced during the real test bed deployment andalso proposed solutions to overcome them.We presented an alternative algo-rithm based on the minimum Euclidean distance classifier.our result showsthat the localization accuracy of this system is increased when using theproposed algorithm .
6

Contents
1 Introduction 81.1 localization . . . . . . . . . . . . . . . . . . . . . . . . . . . . 81.2 Wireless Sensor Network . . . . . . . . . . . . . . . . . . . . . 81.3 Background and motivation . . . . . . . . . . . . . . . . . . . 81.4 Scope and objectives . . . . . . . . . . . . . . . . . . . . . . . 9
1.4.1 System requirements . . . . . . . . . . . . . . . . . . . 101.5 Contributions . . . . . . . . . . . . . . . . . . . . . . . . . . 101.6 Structure . . . . . . . . . . . . . . . . . . . . . . . . . . . . . 11
2 Wireless sensor networks 122.1 Short range wireless communication standards . . . . . . . . 12
2.1.1 Bluetooth . . . . . . . . . . . . . . . . . . . . . . . . . 132.1.2 Wireless local area network (WLAN) . . . . . . . . . . 132.1.3 Ultra-wideband (UWB) . . . . . . . . . . . . . . . . . 14
2.2 IEEE 802.15.4 protocols . . . . . . . . . . . . . . . . . . . . . 142.2.1 WirelessHART . . . . . . . . . . . . . . . . . . . . . . 142.2.2 ZigBee . . . . . . . . . . . . . . . . . . . . . . . . . . . 152.2.3 6LoWPAN . . . . . . . . . . . . . . . . . . . . . . . . . 15
2.3 Multiple access methods . . . . . . . . . . . . . . . . . . . . . 152.3.1 Time division multiple access . . . . . . . . . . . . . . 162.3.2 Frequency division multiple access . . . . . . . . . . . . 172.3.3 Carrier sense multiple access/collision avoidance . . . . 17
2.4 Network topology . . . . . . . . . . . . . . . . . . . . . . . . . 182.5 The wireless medium . . . . . . . . . . . . . . . . . . . . . . . 19
2.5.1 Phenomena effecting the wireless communication channel 192.5.2 Received signal strength indicator (RSSI) . . . . . . . . 21
3 The feasibility of localization based on RSSI 223.1 RSSI is a low cost approach for distance measurement in WSN 223.2 How to retrieve RSSI reading ? . . . . . . . . . . . . . . . . . 22
7

3.3 How is the transmit power related to the signal strength inIITH Mote? . . . . . . . . . . . . . . . . . . . . . . . . . . . . 23
3.4 How is the RSSI value related with signal strength in IITHMote? . . . . . . . . . . . . . . . . . . . . . . . . . . . . . . . 23
3.5 The implementation details: the programs in motes, Base sta-tion, and Computer . . . . . . . . . . . . . . . . . . . . . . . . 24
3.6 How to save the RSSI readings to data file? . . . . . . . . . . 253.7 Why RSSI readings from different motes or different directions
so diversified? . . . . . . . . . . . . . . . . . . . . . . . . . . . 26
4 RSSI based intrusion detection 274.1 experimental testbed . . . . . . . . . . . . . . . . . . . . . . . 284.2 Hardware description . . . . . . . . . . . . . . . . . . . . . . . 294.3 Related Work . . . . . . . . . . . . . . . . . . . . . . . . . . . 30
5 performance evaluation 36
6 Conclusion and future work 38
8

Chapter 1
Introduction
1.1 localization
Localization means to determine location of nodes in a network.With the sup-port of some infrastructure,a node can determine its location in the networkby extracting information received from the infrastructure;also by making anode to send signals periodically, the infrastructure can calculate the locationof the node.
1.2 Wireless Sensor Network
Wireless Sensor Network (WSN) is a kind of Ad-hoc network, and is ofteninfrastructure independent.Large amount of cheap motes construct the net-work by collaborating with each other, and the data sensed by each motecongregate to the base station.The transmission power for each mote is oftenlow to avoid interfacing with each other.Thus the range of communication orrange of connectivity is limited to some extent. In a quite large WSN, thereadings from each mote may have to arrive at the base station via severalsteps. In sensor network, finding and maintaining a high efficient multi-hoprouting algorithm is very important to guarantee the high reliability and lowenergy consuming. WSN is a kind of data centric network.
1.3 Background and motivation
Many location determination technologies have been proposed over the years,including: the GPS [1], infrared [2], ultrasonic [3], and radio frequency (RF)[4].All these technologies share the requirement for a tracked object to carry
9

a device to be tracked.In addition many of these technologies require thedevice being tracked to actively participate in the localization process byrunning part of the localization algorithm.This allows the system to providethe user with its location and other services related to the estimated loca-tion [5], [6]. Despite becoming the enduring technology for navigation andtracking purposes, the global positioning system (GPS) presents also somelimitations. i.e. a null or very limited functionality in indoor environments,and the need of having the users to carry an end device at all times.
Now a days, device-free localization (DFL) and tracking of peoplein indoor environments could potentially be exploited in a variety of appli-cations, such as tracking of customers in shopping malls with the aim toanalyze their reaction to products and advertisements placement, detectionof intruders in critical buildings or infrastructures, localization. Wireless sen-sor networks (WSNs) represent a suitable technology to perform these tasks.A feasible solution is to extract useful information from the variations of thereceived signal strength indicator (RSSI) caused by the presence and move-ments of individuals inside the monitored area. Since in this case additionalsensors such as cameras or infrareds are not used, the nodes forming thewireless network can be considered as radio frequency (RF) sensor
The received signal strength indicator(RSSI)has been traditionallyexploited for nodes localization,distance estimation,and link quality assess-ment Recent research has shown that variations of the RSSI in indoor envi-ronments where nodes have been deployed can be exploited to detect move-ments of people Moreover ,the time histories of the RSSI of multiple linksallow reconstructing the path followed by the person inside the monitoredarea .This approach ,though effective ,requires the transmission of multipleraw RSSI time histories to a central sink node for offline analysis. This paperaims at applying distributed processing of the RSSI measurements for indoorsurveillance purposes.
1.4 Scope and objectives
The scope of this thesis is to design and develop a realtime device-free lo-calization (DFL) system that exploits radio signals to detect the presenceof individuals.The system is used for positioning individuals and to tracktheir movements in indoor environments.In addition,the aim is to investigatethe characteristics of radio signal propagation in indoor environments and tostudy how the presence of people influences radio signal propagation.
The main objective of thisthesis is to design a DFL system that is easily redeployable, remotely recon-
10

figurable, easy to use, and operates in real time.
1.4.1 System requirements
In this thesis, an embedded algorithm that processes the RSSI measurementsand detects the intruder obstructing the line of sight (LoS) between commu-nicating nodes is developed and implemented. The algorithm is designedso that it does not depend on the characteristic of the surrounding indoorenvironment and so that it does not include hard coded thresholds. In ad-dition,the algorithm is designed so that it does not require training of thenetwork in static conditions (i.e.when movement is not present inside themonitored area). The link obstructions caused by the intruder are notifiedto a central base station and then exploited to estimate the intruders po-sition. The path of the intruder is tracked from the consecutive positionestimates and the tracking application provides a reliable estimate of theintruders position and trajectory in realtime with minimal latency.
1.5 Contributions
Contributions of the author in the thesis are listed as follows:
• A device-free, wireless, real time, intrusions detection and tracking ap-plication for indoor environments is developed and tested.The proposedsystem is based on monitoring the changes in the RSSI caused by aperson moving among or in the close proximity of communicating lowpower sensor nodes, operating in the 2.4 GHz industrial, scientific andmedical (ISM) band.
• A comprehensive study of the radio channel and signal strength char-acteristics in indoor environments is performed to gain insight of thewireless medium.The results introduce design aspects for a RF basedDFL system.
• The embedded RSSI intrusion detection algorithm and the real timetracking application were tested in the lab room of a university building,with a WSN consisting of 4 nodes and the two sink node.The test wereconducted using two different network layouts and two different nodeintervals
11

1.6 Structure
The thesis is structured as follows.Chapte2 provides an overview of wirelesssensor networks, introduces the communication stack of the sensor nodesand the main phenomena affecting the wireless medium, and lists the re-lated work.after describing the sensor networking platform used in the ex-periments,At the end of the chapter the radio channel characteristics andcauses for RSSI variabilities are introduced.in Chapter3 The feasibility oflocalization based on RSSI and How to retrieve RSSI reading ? Chapter4presents the developed intrusion detection and tracking application,i.e.theembedded algorithm executed to detect intrusions,four different methods todetect and estimate the position of the intruder, and the real time trackingapplication.The system is experimentally evaluated at the end in chapter5.In the final chapter6 conclusions and key observations of the thesis are sum-marized.
12

Chapter 2
Wireless sensor networks
A WSN consists of spatially distributed autonomous devices which commu-nicate with one another exploiting a wireless medium. Each node typicallyconsists of a RF transceiver, a MCU, an external power supply, and varioustypes of sensors used to measure the surrounding environment. Initial re-search in the area of WSNs was mainly driven by military applications (e.g.Smart Dust (Kahn et al., 2000)) (Rmer and Mattern, 2004). Nowadays,WSNs are utilized for various purposes such as environmental monitoring(Hasler et al., 2009), structural health monitoring (Ceriotti et al., 2009 andBocca et al., 2009), precision agriculture (Dong et al., 2010), etc.
The following sections cover fundamental issues related to WSNs.Thechapter starts by introducing three different short range wireless commu-nication standards and since the sensor networking platforms used in thisthesis are based on the IEEE 802.15.4 standard, protocols of the standardare examined in more detail.In section 2.3 basic multiple access methods areintroduced,and in the following section different network topologies are pre-sented.The communication stack,which defines the interconnections of thewireless devices of IPv6 based low power wireless area network (6LoWPAN)is examined and section 2.5 covers the characteristics of the wireless mediumand phenomenons affecting radio signals.Work related to detecting and track-ing movement of individuals with RF networks is discussed at the end of thechapter.
2.1 Short range wireless communication stan-
dards
There is a range of technologies enabling wireless connectivity, each designedfor distinct purposes. Some technologies emphasize bandwidth, whereas oth-
13

ers call for low power consumption or inexpensive devices.Each standard isdesigned for some specific purpose in mind and rather than being compet-ing technologies, they are complementary for one another, each best suitablefor a specific application.In the following sections three different short rangewireless communication standards are introduced.
2.1.1 Bluetooth
Bluetooth is a lowpower radio technology designed for short range and inex-pensive devices. The technology was developed by Ericsson in 1994 and it hasbecome the standard wireless solution for cordless computer accessories andmobile phone peripherals (Bluetooth, 2010). Its physical (PHY) layer andMAC layer are defined within the IEEE 802.15.1 protocol (IEEE 802.15.1,2010). Bluetooth defines two different connectivity topologies: piconet andscatternet. A piconet is a wireless personal area network (WPAN) consistingof one master device and up to 7 active slave devices. The master node isused to synchronize the global clock of the network which is then used forfrequency hopping. Communication is performed under the control of themaster node. The slave nodes are able to communicate only to the masternode in a point-to-point fashion, while the master node can transmit usingpoint-to-multipoint broadcasts .Multiple piconets form a scatternet wherethe adjacent piconets are connected via a slave node. A slave node can bea part of multiple piconets, while a master node can be a slave at anotherpiconet. However a node cannot be a master in multiple piconets. Suitabilityof Bluetooth in wireless sensor networks is studied
2.1.2 Wireless local area network (WLAN)
WLAN has been developed to replace the cables typical of local area net-works (LANs). WLAN networks exploit radio technologies defined in theIEEE 802.11 standard providing secure, reliable and fast wireless commu-nication at the expense of being complex and power hungry (IEEE 802.11,2010). WLAN networks operate in the 2.4 GHz and 5 GHz frequency bandsproviding a bandwidth of 2-540 Mb/s (Wi-Fi Alliance, 2010). IEEE 802.11offers two different network configurations: independent basic service set(IBSS) and extended service set (ESS) . The IBSS is a group of workingstations communicating directly to one another without the existence of anaccess point (AC). A set of working stations form a basic service set (BSS)which can access the distribution system (DS) via the ACs.The DS formsthe backbone of the network and it is usually an Ethernet. Multiple BSSsconnected together through the DS form the ESS network configuration.
14

2.1.3 Ultra-wideband (UWB)
UWB differs greatly from the other two radio technologies introduced above,being an impulse based radio solution. UWB utilizes a very broad portionof the radio spectrum, overlapping other radio technologies. The transmis-sions however use a very low signal energy level (-41.3 dBm/MHz) that doesnot interfere with coexisting narrowband radios, e.g. ZigBee and Bluetooth(WiMedia Alliance, 2010). UWB offers a short range high speed wirelesscommunication reaching a bandwidth of over 110 Mb/s (up to 480 Mb/s),which can fulfill the rapid transfer requirements of bandwidth intensive filessuch as audio and video. Also there has been discussion on UWB possiblyreplacing high speed serial buses such as universal serial bus (USB) 2.0 andFireWire
2.2 IEEE 802.15.4 protocols
IEEE 802.15.4 is a standard for low rate wireless personal area networks (LR-WPANs), which specifies the PHY and MAC layers of the communicationstack.The protocol is a basis for such wireless communication standards asWirelessHART, ZigBee, and 6LoWPAN, which all offer the upper layers ofthe communication stack.The standards intention is to offer devices with lowcost, low power consumption, and low complexity.
2.2.1 WirelessHART
WirelessHART is a wireless communication standard designed for measure-ment and con-trol applications in process plants.A WirelessHART networkconsists of three basic elements: wireless field device, gateway, and networkmanager. Field devices are used for process monitoring and control, whereasa gateway enables the communication between the field devices and a hostapplication that is connected to an automation system bus. A network man-ager is responsible for network configuration, scheduling, route management,and network health monitoring. All devices in the network can act as routersin the wireless network and the network manager is in most cases integratedto the network gateway. The network uses IEEE 802.15.4 compatible radiosfor communication, and it enables a mesh network design for robust andredundant communication.
15

2.2.2 ZigBee
ZigBee is a higher layer communication protocol built on top of the IEEE802.15.4 standard for LR-WPANs. ZigBee Alliance developed the ZigBeeprotocol to add the network, security and application software to the exist-ing IEEE 802.15.4 standard (ZigBee Alliance, 2010). ZigBee is optimizedfor automation sensor networks, where there is no need for high bandwidth,but low power consumption, low latency and high quality of service (QoS)are required (Eriksson et al., 2008). The technology supports mesh networksconsisting of at most 216 = 65536 devices co-operating with one another.There are three different types of ZigBee devices: coordinators, routers andend devices. A ZigBee coordinator is responsible for network formation, datastorage, and linking networks together. The router enables multi-hop com-munication across devices and also links device groups together. A ZigBeeend device consists of possible sensors and actuators that interact with thesurroundings;the end device communicates only with router or coordinatordevices
2.2.3 6LoWPAN
6LoWPAN is a low power wireless personal area network protocol that isbased on the internet protocol version 6 (IPv6). The aim of the protocol isto provide lowpower radio communication that exploits the internet protocol(IP) addresses to enable internet connectivity. For the 6LoWPAN commu-nication stack, an adaptation layer is defined to compress, fragment, andreassemble IPv6 headers and to enable mesh route forwarding.The adap-tation layer is a standard proposed by the internet engineering task force(IETF). Because of the IP based communication, 6LoWPANs can be con-nected to other networks (e.g.WLAN, Ethernet, etc.) based on IP addressesvia border routers that forward IP based packets between the different media
2.3 Multiple access methods
The nodes of a WSN share a common medium for communication, andwithout proper management of the medium, communication would be ineffi-cient.Packet collisions would occur and packet delivery could not be assuredwithin a certain time interval. Also the channel would be occupied mostof the time with unnecessary retransmissions, due to improper managementin the first place.Another point of view is that the whole capacity of themedium is not needed by one communication pair in the network, and theshared medium could also be used by other nodes.The channel division for
16

Figure 2.1: Channel allocation in respect to time and frequency by TDMAand FDMA techniques.
multiple users is called multiple access and it provides the methods to man-age the limited resources of the radio channel efficiently
The multiple access methods can be classified into two distinctcategories:conflict-free and contention protocols.Conflict-free protocols arenot interfered by other transmission, and when a transmission is made it isensured that it is successful. A conflict-free transmission can be assured byallocating the channel for the users either timely wise, frequency wise, or bya combination of the two.In TDMA, a single user is given the whole band-width for a fraction of time, where as a single user is given a fraction of thebandwidth for the entire time in frequency division multiple access (FDMA)as shown in Figure. In contention protocols a transmission is not guaranteedto be successful, and the protocols must determine a routine to solve conflictsso that in the end the transmission can be assured.The benefit of contentionbased protocols is that idle users do not consume the scarce resources of theradio channel.An example of a contention protocol is carrier sense multipleaccess (CSMA).
2.3.1 Time division multiple access
In the TDMA protocol the time axis is divided into super frames, also denotedas cycles or frames. Each super frame is divided into smaller time slots, andeach node in the network is assigned a time slot that they can use.During
17

the time slot the whole bandwidth is devoted to that one node. The cyclesare periodic and each node has the same time slot in each frame.In order toexploit TDMA, the network has to be synchronized, so that each node inthe network knows when they are allowed to transmit and when they shouldexpect packets from other nodes. Since the time instances for communicationare known, the nodes are able to turn off their radio to conserve power whenscheduled communications are not expected. Downsides of TDMA are thatit introduces communication delay and it is also inefficient since it allocatesthe whole bandwidth for the assigned slot of time
2.3.2 Frequency division multiple access
The FDMA protocol resembles TDMA, but instead of dividing the timespace, it separates the frequency band to smaller portions called sub bandsor channels. Each node in the network is assigned a distinct channel to op-erate on, and in this way every user is guaranteed a constant bandwidth atall times.This aspect is advantageous in applications where minor communi-cation delays are permitted, and the throughput has to be guaranteed.Thedisadvantage of FDMA is that the channel is occupied at all times by theuser even though no transmissions are made,decreasing the efficiency of thechannel. Another downside of the technique is caused by the limited numberof channels available which decreases the scalability of the network (Erikssonet al., 2008). Figure:2.1 presents the division of time and frequency spacecorresponding to TDMA and FDMA protocol.
2.3.3 Carrier sense multiple access/collision avoidance
Carrier sense multiple access with collision avoidance (CSMA/CA) is a con-tention based multiple access method which does not depend on a coordinatordevice to manage the channel.The underlying concept is that the transmit-ting nodes listen to the channel before communication and if the channel issensed to be idle a transmission can be successfully made. If the medium issensed to be busy, the transmission is delayed to a later time instance.TheCSMA/CA protocol is a widely adopted technique in wireless networks . Thecollision avoidance in the CSMA/CA is maintained with a handshake routinebetween the communicating nodes. Before transmission of a data packet, asource node asks permission for transmission from the receiver by sendinga short request to send (RTS) packet. If the destination receives the RTSpacket correctly, it corresponds to a situation where it is not receiving pack-ets from other nodes at the time.The receiver acknowledges the RTS with aclear to send (CTS) packet, and if received correctly at the source node the
18

Figure 2.2: Three distinct network topologies: star (a), mesh (b), and tree(c) topology.
actual data packet is sent.After transmitting the data packet the source nodewaits for an acknowledgement (ACK) message from the receiver. If CTS isnot received upon a certain time period, the source assumes that the packethas collided and a retransmission is attempted after a random backoff period.A backoff period is also launched in situations where the source senses thatthe channel is busy.
2.4 Network topology
Network topology is defined as the conjunction of various nodes in the wire-less network and it is one of the key design factors of WSNs (Eriksson et al.,2008).The network topology effects heavily on communication traffic, QoS,power consumption of the network, and complexity of the realization. Threebasic network topologies are the star, mesh and tree topology and they aredescribed below in respective order. It is also possible to combine varioustopologies in different parts of the network to utilize the desirable featuresof each topology.
In wireless networks with a star topology, each node of the net-work communicates solely to a central node in a point-to-point fashion. Thecentral node may act as a repeater or as an access point to the network.Advantage of the star network is its simplicity, but its disadvantage is its in-tolerability to failures.If the central node dies the whole network collapses.Astar topology is presented in Figure2.2 (a). In a mesh topology, depicted inFigure 2.2(b),every node in the network can act as a router and packets canbe delivered from the source to the destination via multiple routes.The meshtopology is said to be fully connected, meaning that each node is connected
19

to every other node in the network.Mesh topology provides robustness to thenetwork, since broken links can be replaced by a compensatory path, sup-posing that there is more than one node within the communication range.Adrawback of the mesh topology is the relatively heavy routing protocol.
A tree topology is a hierarchical structure consisting of a rootnode and lower level nodes (i.e. children).The root node forms the top levelof the hierarchy and it can have one or multiple children.These children con-stitute the second level of the tree, and they act as the parents for the thirdlevel nodes. Each node in the tree has exactly one parent, excluding the rootnode, and possibly multiple children.A tree topology must have at least threelevels of hierarchy, since otherwise it would form a star. The routing protocolof the topology can be made relatively light and the number of point-to-pointconnections is one less than the number of nodes (cf. m(m-1)/2 for a fullyconnected mesh topology, where m is the number of nodes).As in a star net-work, a tree topology is also vulnerable to broken links, where a link failurehigh in the hierarchy can cause whole portions of the network to collapse.
2.5 The wireless medium
Wireless sensor networks deploy radio waves as the physical means to trans-mit data. Radio signals are a type of electromagnetic radiation with a cer-tain amplitude, frequency, and wave length.In ideal circumstances (e.g. freespace, vacuum), the phenomena effecting radio signal propagation (e.g. dis-tance attenuation) are well known. However, most of the wireles networksare deployed in real world environments, where the wireless communicationchannel is exposed to multiple phenomena that have a negative impact on it.Such phenomena, to name the most common, include: multipath, distortion,power loss, fading, shadowing, noise and interference. In the next section, afew of these phenomenas are explained.
2.5.1 Phenomena effecting the wireless communicationchannel
Power loss refers to the decaying energy of the carrier signal, which is causedby damping in the medium (Stallings, 2004). The energy of the carrier signaldeviates to a sphere surface once the signal is broadcasted from the antenna.The surface of the sphere is proportional to the square of the distance fromthe antenna and this formulation sets a relation between the signal powerand the distance from the transmitting antenna as follows:
20

p∝ d−2,
where P is the power of the carrier signal and d is the distance from thetransmitter antenna.
Multipath is a phenomenon in which a transmitted signal travels via mul-tiple routes from the transmitter to the receiver (Eriksson et al., 2008). Thetraveled distance is different for every signal and because of this, the signalsare not received simultaneously and phase difference results into interference.Multipath can be caused by three different phenomenas: reflection, diffrac-tion, and scattering. Reflections are caused by the carrier signal bouncingof obstructions. Diffraction can result when the radio signal encounters anobstacle, and it can be described as the bending of radio signals around smallobjects and the spreading of radio waves past small openings. Scattering isa physical phenomenon in which the carrier signal changes the direction ofpropagation due to the non-homogenous medium it travels through
Fading in a wireless communica-tion channel is caused by the above mentioned multipath effect and it canbe divided into two categories: the Doppler spread and the delay spread(Zhang et al., 2003). The Doppler spread is caused by the movement of thereceiver or the transmitter, which causes a change in the absolute velocityof the signal. The delay spread is caused by the changes in the close prox-imity environment. For example, a person who walks in the close proximityof the transmitting node causes multipath to change dynami-cally causingvariation in the received signal power, a phenomenon referred as multipathfading. Correspondingly a person who is in between a communicating nodepair can cause strong attenuation in the signal and this is referred as shad-owing (Patwari and Wilson, 2010).
Interference is generally referred to as the unwanted additive dis-turbance to the transmitted signal and it can be divided into two classes:adjacent channel interference and co-channel interference (Siva Ram Murthyand Manoj, 2004). In the adjacent channel interference, signals in nearbyfrequencies have components outside their allocated bandwidth, and thesecomponents can interfere with the communication on neighboring frequencybands. Cochannel interference is due to other systems using the same trans-mission frequency. Possi-ble sources of co-channel interference are networksoperating on the same channel (e.g. WLAN). Most wireless sensor nodes arehighly sensitive to interference, because of the low-power radio and it canresult to packet drops and data errors, which can in the worst case, weakenthe performance of the network.
21
2.5.2 Received signal strength indicator (RSSI)
In wireless communications, RSSI is a measurement of the signal strengthin the received radio signal. The RSSI measurement provided by the RFtransceiver is unitless, where the maximum value depends on the supplierand the range of RSSI values provided by the ven-dor is relative to the ac-tual power, which is expressed in mW or dBm. However, each sup-plierprovides their own accuracy, scale, and offset level for the measurement.
The RSSI measurement is the rel-ative power in decibels (dBm) to the measured power referenced to one mil-liwatt (mW). Zero dBm corresponds to one mW, and to double the powermeans an increase of roughly 3 dBm. Respectively, to decrease the power inhalf is analog-ous to lowering the power by -3 dBm. The power in dBm canbe expressed as a function of the power in mW as follows:
PdBm = 10logPmw
where PdBm is the power in dBm and PmW is the power in mW.
In recent years,RSSI has attracted a lot of attention in the areaof wireless communication and WSN research.The reason for this is thatthe measure is a standard feature in most radios,so additional sensors arenot needed.In addition, it doesnt require additional power consumption.Theuse of RSSI is extensive as it has been utilized for radio link quality as-sessment (Srinivasan and Levis, 2006a,), nodes localization (Zanca et al.,2008), surveillance applications (Hussain et al., 2008), packets reception ratemodeling (Srinivasan et al., 2006b), and transmission power control (Lin etal., 2006).
Despite the vast usage of the RSSI, the dynamics of this measure-ment are still difficult,if not impossible, to predict or model.Many parameterscan influence the measure: in addition to multipath, fading, and shadowing,the transmitter and receiver variability, as well as the antenna orientation,can impact the measured RSSI value (Lymberopoulos et al., 2006). Moreover,the nodes spatial displacement and the surrounding environment contributeto RSSI variation.
22

Chapter 3
The feasibility of localizationbased on RSSI
3.1 RSSI is a low cost approach for distance
measurement in WSN
RSSI based ranging and localization can be a cheap alternative to the highcosts and complexity involved with other localization techniques.The require-ments for the localization accuracy are not very strict, and our clients arealso concerned about the cost of the whole system. RSSI-based ranging andlocalization is the first option that comes to our mind.
3.2 How to retrieve RSSI reading ?
In the lab,the wireless sensor modules we are using motes made by IIT Hy-derabad named IITH Mote and the software foundation is Tiny-OS, whichis an open source embedded operation system designed to support tens ofwireless sensor modules from different manufacturers.
The RSSI means Received Signal Strength Indica-tion.Once a mote receives a packet message, at the time we get the payload,wecan also read the RSSI indication.Suppose in a wireless sensor network topol-ogy, we have four motes which broadcast packet messages periodically.At thebase station, these packet messages,in which mote ID is included,can be re-trieved and the corresponding RSSI indication can be sampled.
Because the base station is connected to the serialport, these RSSI readings can be forwarded to the computer side,where wecan use a java application display these data in real time.If the data is stable,
23

Table 3.1:
we can save the data to a file.After that,we can process the data to get thefunction relationship between RSSI reading and distance.
3.3 How is the transmit power related to the
signal strength in IITH Mote?
AT86RF230 is the transceiver on the IITH mote. By setting the registerbits TXPWR, we can set up the transmission power.The actual power outputcorresponds to the register value as showed in the table.3.1:
3.4 How is the RSSI value related with signal
strength in IITH Mote?
The RSSI is a 5-bit value indicating the receive power in the selected channel,in steps of 3dB.The register value is represented in the lowest five bits [4:0]and the range is 0−28. An RSSI value of 0 indicates an RF input power lessthan -91dBm. For an RSSI value in the range of 1 to 28, the RF input powercan be calculated as follows:
24

PRF = RSSI BASE V AL + 3*(RSSI -1)
Thus, the dynamic range of PRF is 81dBm.Because the typical value ofRSSI BASE V AL is -91dBm. the value range of PRF is from -91dBm to-10dBm.
Please note that, in IITH mote,it is not recommended to read the RSSIvalue when using the Extended Operating Mode.The automatically generatedED value should be used alternatively.
ED means the receiver Energy Detectionmeasurement, and its value is calculated by averaging RSSI values over eightsymbols (128us).The PHY ED LEV EL is an 8 bit register.The ED value ofIITH mote radio transceiver has a valid range from 0 to 81 with a resolution of1dB.Value zero indicates that the measure energy is less than -91dBm.Due toenvironmental conditions (temperature,voltage, semiconductor parameters,etc.) the computed energy vale has an accuracy of 5dBm.
So, we can see that thereceive signal strength that we read out from IITH MOTE is actually ED(Energy Detection), not the RSSI (the value of the register). The range ofED is from 0 to 81, corresponding to signal strength power from -91dBm to-10dBm.
3.5 The implementation details: the programs
in motes, Base station, and Computer
Please note that the RSSI readings are closely related to the message receiv-ing.In a scenario with many motes as transmitters and one mote in the basestation to do the measurement of RSSI, we have to ensure that the packagesfrom different transmitter dont collision with each other. The best way isthat these packages arrive in different time slot.
In my implementation, the software is divided intothree parts: programme in transmitter, programme in base station, and pro-gram in a computer.
The base station is a bridge between the transmitter and com-puter. In down stream direction, the base station can forward the parametersettings from the computer to all the transmitters; in up stream direction,when the base station receives a message from the transmitter, it starts toread out the RSSI value provided by the radio signal demodulator on theboard.After that, the RSSI value is put in the payload which is received fromone transmitter, and the new formed message is forwarded to the computer
25

through the serial port.All transmitters broadcast structured messages periodically.The period ofthe transmission for all transmitters is the same, and can be set up by thecommand from the computer.However, after each transmitter receives a com-mand from the computer, it enables a timer to do the delay before the peri-odical transmit.The delay time for each mote is a random number between0 and the transmission period.
In the computer side,the oscilloscope application is modified toretrieve data from the serial port and display the data using graphs in realtime.In the GUI window of oscilloscope application,the number of nodes canbe discerned out through the contents of the raw data.Each node is repre-sented by a graph of specific color.The x-axis is the packet counter numberand the y-axis is the sensor reading.The GUI can also allow us to adapt thevisible portion of the y-axis to a plausible range.For RSSI readings from IRISmotes, 081 is appropriate.
3.6 How to save the RSSI readings to data
file?
In my implementation, two extra classes are added to the oscilloscope appli-cation.One class is related to the file processing, including openfile( ), andrecordfile( ), and closefile( ) methods. Another class is about record process-ing.
Oscilloscope is a data driven software.Whenever a new packet datais received, the data retrieved from the packet is used to update the graphin the GUI.At the same time, the data can be formed as a new record andadded to the opened file.
By modifying the function of Clear button,I add the inter-face of saving the record to the file by closing the file handle.Also added isanother interface to prompt the user to enter the file name for the next file.From the fig.4.3,we can see clearly that the RSSI readings are generally sta-ble.However, if there are scenario changes such as obstacle intrusion or mov-ing, the readings will fluctuate.
How can we design a filter to filter out the un-qualified data? In my implementation,I adopted a pattern-match approach.
As a transmitter, each mote changes their transmission poweraccording to a pattern, such as changing from the highest to the lowest powerperiodically.At the computer side, as a receiver, the RSSI readings is expectedto vary according to the pattern of the transmit power.
26

If the RSSI readings vary in the same pattern, we can say RSSIreadings are stable; if there are fluctuations in the RSSI reading pattern,wecan assume that the RSSI readings are deteriorated by the obstacle changein the scenario,and the data in this time window will be thrown away.
3.7 Why RSSI readings from different motes
or different directions so diversified?
We can conclude that the diversification of RSSI readings from motes withsame distance away is slightly related to motes because all motes as trans-mitters are calibrated.The diversification is mainly caused by the anisotropicproperties of antenna and media through which the radio propagates. Just asseen from the graph below, the radio connectivity over space is not disc-like.
27

Chapter 4
RSSI based intrusion detection
In recent years, there has been an increasing interest in utilizing RSSI forsurveillance and motion tracking purposes. This measure has been found tobe useful for these intentions since RSSI measurements are nearly constantin a static environment, but show increasing variance when the conditionschange, e.g. when a person walks through the area.
The related work introduced in sec-tion 3.3 confirms the validity of using the RSSI for de-tecting people insidethe monitored area. in this thesis focuses on processing the RSSI measure-ments locally in the nodes in real-time while the application is running. RSSImeasurements are analyzed externally and the nodes in the network are notaware of the intrusions. Also in some cases the measurements are post-processed after run time.
The aim of this thesis is to create a WSN capableof detecting the intrusion caused by a person, estimate the position from theaggregated data and to track the intruder in real-time inside the monitoredarea. The intrusion detection is performed in a distributed fashion, locallyby each node, only by means of processing the RSSI measurements. Theintrusions sensed by individual nodes are sent to the sink node. Situationawareness is obtained by aggregating the alerts of all nodes and tracking isperformed in real-time on a computer connected to the sink node. In addi-tion.
In this chapter an intrusion detection system is introduced and sincethe RSSI measure-ments vary unpredictably, no information can be retrievedfrom the magnitude of the RSSI. For example if a person would be locatedin the area where a new WSN is set up at the time of deployment, the RSSIwould not indicate the presence of the person supposing that the personwould stay still at all times.
28

4.1 experimental testbed
The entire experiment has been carried out in an indoor environment. TheRSSI measurements are prone to noise and interference, which leads to errorin localization.Hence to provide ideal environment we have taken the follow-ing precautions:
• All the deployed nodes are kept at same altitude from surface of floor.
• Each IITH mote is supplied with USB power supply, so as to ensurethat the battery power is same at all the nodes.
• All the deployed nodes are in line of sight with the base node and noobstacle is present in between.
• Since the antenna of base node is not isotropic, we have deployed thesensor nodes only in the antenna direction of base node.
• To avoid interference, we have taken measures to see that no otherdevice working in range of 2.4 GHz is present in the vicinity of experi-mental location.
We have carried out the experiment with six IITH mote .four ofthem is working as a transmitter and rest two mote is working as a receiverwith in our lab environment. The nodes are deployed at fixed distancesfrom base node and the Localization error is estimated by comparing thedistances calculated by mean RSS values.In our experiments we will showthat a subject can be successfully localized in a home environment using ourPC DfP method. The deployment takes place in the class room cabin inthe institute .The room is quite cluttered, and has rich multi-path sourcesincluding table, desk, chair. The room dimension is 9 X 9 square feet and7 feet in height. The floor and the walls are wallboard on construct. Ourexperimental setup consists of host PC serving as the system manager, andtransmitters and receivers. In our system, each transmitter broadcasts a 10-byte packet every 250 milliseconds. The receivers will receive the capturedpackets and forward them to the host PC for data collection and analysis.
29

Figure 4.1: TX,RX-IITH mote will work as transciever .
4.2 Hardware description
IITH mote is an ultra-low power wireless module for use in wireless sensornetworks, monitoring applications, and rapid application prototyping. IITHmote leverages industry standards like IEEE 802.15.4 to interoperate seam-lessly with other devices. By using industry standards, integrating humidity,temperature, and light sensors, and providing flexible interconnection withperipherals, IITH mote enables a wide range of mesh network applications.With Tiny-OS support out-of-the-box, IITH mote leverages emerging wire-less protocols and the open source software movement. IITH mote is part ofa line of modules enabling the easy compatibility of interfacing any sensorboard to it .Key Features :
• 250 kbps, 2.4 GHz IEEE 802.15.4 Atmel Transceiver.
• Interoperability with other IEEE 802.15.4 devices.
• Atmel ATmega1281 with 8k RAM and 128k programming flash and512k serial flash.
30

Figure 4.2: Photograph showing different parts of the IITH mote .
• Integrated ADC, Supply Voltage Supervisor.
• Integrated onboard antenna with 50m range indoors / 300m range out-doors.
4.3 Related Work
3.3.1.system architecture and organization :The architecture of a DFP system is shown in fig 3.1 .it consist of four trans-mitter and two receiver along with DFP server.the DFP server is PC whichperforms the computations on RSSI streams and initiate action.
Organization of this device free passive localization is a.sending andreceiving packets of RSSI. b. storing the received packets in the database, c.reading the values from the database and using algorithms on the values tolocate the person.a.Sending and Receiving packets: For sending and receiving packets,IITH motes are used as transmitters and receivers.in first step receiver will
31

record RSSI for all radio links when the deployed area is empty.in secondstep receiver will capture the RSSI changes for all the radio link with theuser present and compare with the RSSI in step1.in step-3 summarize therelationship between RSSI change for all radio link and users positionb.Storing the values: For storing the values from the sensor motes, MYSQLdatabase is used.c.Algorithm:In monitering mode algorithm will run in system server .Forfinding the cost matrix, Euclidean shortest path and to find the shortest pathDynamic Time Warping algorithm is used.3.3.2.Detection of an Intruder3.3.2.1.Moving Average Based Detection:In moving Average detection technique detection determined by comparingtwo moving averages of received signal strength indicators with possibly dif-ferent window sizes.if qi be a series of measurements over time for a particularreceiver to a transmitter the average α1,k and α2,k are define as follows fortime index k.
α1,k =1
wl
·k+wl−1∑
i=k
qi (4.1)
α2,k =1
ws
·k+wl+ws−1∑
i=k+wl
qi (4.2)
wl and ws are the window lengths for the two averages α1,k and α2,k respec-tively.when the relative difference between the averages exceeds a parameterτ ∣∣∣∣α1,k − α2,k
α1,k
∣∣∣∣ > τ (4.3)
we decclare an event detection for the time corresponding to t = k + ws.thesystem server recomputes α1,k and α1,k periodically to check for event detec-tion.
Here wl window represents history of static situation,and the wswindowrepresents an estimate of the current state,and when current state differ fromthe history we suspect the intrusion .the system server computes α1,k and α2,k
for each time index k in the time period of interest to check for detection.3.3.2.2.Moving Variance Based Detection:
In moving Variance based detection technique is similar to the moving aver-age except that it based on moving variance of the raw data and comparesit to the variance during the silence period.w be the the window size .wecompute the variance,vt as:
32
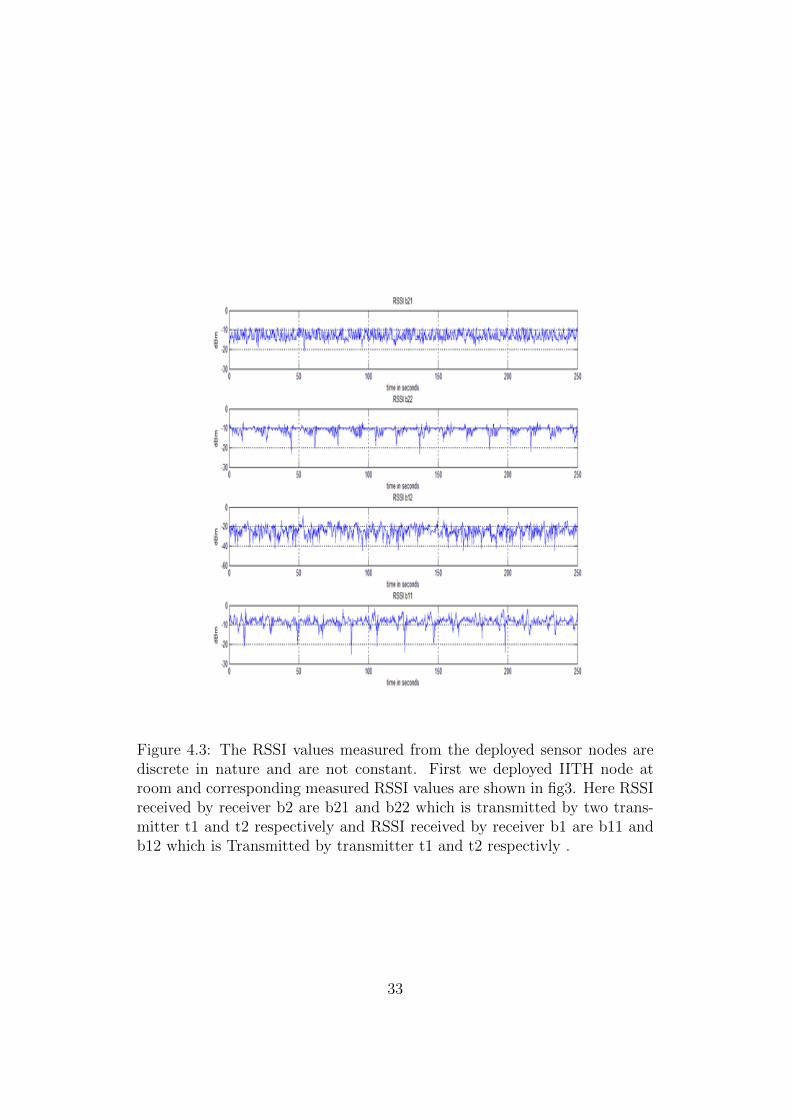
Figure 4.3: The RSSI values measured from the deployed sensor nodes arediscrete in nature and are not constant. First we deployed IITH node atroom and corresponding measured RSSI values are shown in fig3. Here RSSIreceived by receiver b2 are b21 and b22 which is transmitted by two trans-mitter t1 and t2 respectively and RSSI received by receiver b1 are b11 andb12 which is Transmitted by transmitter t1 and t2 respectivly .
33

vt =1
tend − tstart + 1·
tend∑t=tstart
vt (4.4)
σv =
√√√√ 1
w·
tend∑t=tstart
(vt − vt)2 (4.5)
3.3.2.3.Relative Variance Based Detection:Relative variance technique is baed on observation that,when person is mov-ing on the line of sight in cabin then for given stream the variance of the RSSstreamV aron is higher than the variance of RSS of stream during absenceV aroffby covering different areas of a cabin using different stream form transmitterto receiver we can detect whether an entity exist in any of the area of cabinbased on relative variance V aroni
V aroffiwhen relative variance for a given stream
V aroni
V aroffi,exceeds a certain threshold τrelwe can say that person cuts the LOS
of the stream.since each stream is noisy by itself we can use the average of relative
variance RVav] of different streams covering an area as a better metric fordetection and compare this average to the threshold τrel.RVav for a certainarea,covered by N stream is given by
RVav =1
N·
N∑i=1
varonivaroffi
(4.6)
in fig 3.4 we can see the relative variance V aroni
V aroffiof six streams when the
person moves in each of four zone.from the figure it is clear that setting thethreshold valueτrel = 1.98 is resonable to get a 100 % detection probabil-ity.although decreasing the threshold may increase the detection probabilityat the same time it will increase the faulse alarm probability
34

Figure 4.4: Relative variance V aroni
V aroffiof eight streams when person move in
each of the four zones
35

Figure 4.5: system parameter
36

Chapter 5
performance evaluation
Average error :Average error distance is defined as the average distancebetween the center of the actual cell and the center of the estimated cellLocalization Accuracy :is defined as successful estimation ratei.e
N∑I
I(Yi = Yi)
N(5.1)
The objective of a localization system is to maximize the likelihood of cor-rectly estimating an subjects location and minimize the average distancebetween the estimated location and the actual location. In our system, wehave proposed a four cell based localization and detection shown in table 4.1and find a test successful if the estimated cell number matches the actual cellnumber.here we found that as average error is increasing from zero inch to90 inch the localization error is increasing from 70 to 100 percent
37

Table 5.1:
38

Chapter 6
Conclusion and future work
In this paper we introduce a DFP system based on the RSSI measurementswas done to localize and track the intruder through the aggregated alertsreceived from the nodes of the network.Within this scope,implementation ofan easily configurable, easy to use, real time intrusion detection and trackingsystem was planned.the aim was to examine the strengths of system whileavoiding the weaknesses,to assure maximal performance for the developedsystem while considering the limited resources set by the sensor networkingplatforms
An important aspect of the work was validating interference pro-duced by coexisting systems and identifying the sources of RSSI variability.Toestablish this, interference of WLAN was investigated and the influence tothe WSNs performance was discussed.in order to maximize the performanceof the developed system.The impact of transmission power, nodes distance,and the surrounding environment on RSSI variability were studied in orderto determine a framework for the RSSI characteristics.The effect of a personto a nodes RSSI measurements was investigated and the results were usedto develop an algorithm capable of detecting LoS crossings.The algorithmsperformance was validated and proved to correctly raise the alerts when LoScrossings occur. Also false alerts were detected but they were caused by theimperfect radiation pattern of the omnidirectional antenna and the reflec-tions of radio signals from nearby obstacles.
The work we have done rise sev-eral interesting questions for future research.First we need to explore novelmethodologies to locate multiple users.Secondly,we find that we can achievebetter localization accuracy when some of the RF devices fail, which sug-gests the opportunities to develop algorithms to optimize deployment.Also,we need to explore new algorithm to achieve even better localization accu-racy.
39
Bibliography
[1] G. Kurillo, R. Vasudevan, E. Lobaton, and R. Bajcsy,A framework forcollaborative real-time 3D teleimmersion in a geographically distributedenvironment, IEEE International Symposium on Multimedia (ISM 2008),Berkeley, CA, December 15-17, 2008.
[2] Yun-Suk Kang, Yo-Sung Ho, “Geometrical compensation for multi-viewvideo in multiple camera array,” ELMAR, 2008. 50th International Sym-posium, vol. 1, pp.83-86, 10-12 Sept. 2008.
[3] H. Kim, I. Kitahara, R. Sakamoto, K. Kogure, “An Immersive Free-Viewpoint Video System Using Multiple Outer/Inner Cameras,” ThirdInternational Symposium on 3D Data Processing, Visualization, andTransmission, pp.782-789, 14-16 June 2006.
[4] R. Vasudevan, G. Kurillo, E. Lobaton, T. Bernardin, O. Kreylos, R. Ba-jcsy, K. Nahrstedt, “High-Quality Visualization for Geographically Dis-tributed 3-D Teleimmersive Applications,” IEEE Transactions on Multi-media, vol. 13, no. 3, pp.573-584, June 2011.
[5] Bennett Wilburn, Neel Joshi, Vaibhav Vaish, Eino-Ville (Eddy) Tal-vala, Emilio Antunez, Adam Barth, Andrew Adams, Marc Levoy, MarkHorowitz, “High Performance Imaging Using Large Camera Arrays,”Proc. SIGGRAPH, 2005.
[6] J. Canny, “A Computational Approach To Edge Detection,” IEEE Trans.Pattern Analysis and Machine Intelligence, 8(6):679–698, 1986.
[7] Michael Elad, Sparse and Redundant Representations. From Theory toApplications in Signal and Image Processing, 1st Edition,Springer, 2010.
[8] E. J. Candes, M. B. Wakin, “An Introduction To Compressive Sampling,”IEEE Signal Processing Magazine vol.25, no.2, pp.21-30, March 2008.
[9] S. Mallat, A Wavelet Tour of Signal Processing, 3rd. Ed., Academic Press,1998.
40