multi-hazard assessment in europe under climate change · multi-hazard assessment in europe under...
TRANSCRIPT

Multi-hazard assessment in Europe under climate change
Giovanni Forzieri1 & Luc Feyen1 & Simone Russo2 &
Michalis Vousdoukas1,3 & Lorenzo Alfieri1 &
Stephen Outten4 & Mirco Migliavacca5 &
Alessandra Bianchi1 & Rodrigo Rojas6 & Alba Cid7
Received: 7 July 2015 /Accepted: 25 March 2016 /Published online: 19 April 2016# The Author(s) 2016. This article is published with open access at Springerlink.com
Abstract While reported losses of climate-related hazards are at historically high levels,climate change is likely to enhance the risk posed by extreme weather events. Several regionsare likely to be exposed to multiple climate hazards, yet their modeling in a joint scheme is stillat the early stages. A multi-hazard framework to map exposure to multiple climate extremes inEurope along the twenty-first century is hereby presented. Using an ensemble of climateprojections, changes in the frequency of heat and cold waves, river and coastal flooding,streamflow droughts, wildfires and windstorms are evaluated. Corresponding variations inexpected annual exposure allow for a quantitative comparison of hazards described bydifferent process characteristics and metrics. Projected changes in exposure depict importantvariations in hazard scenarios, especially those linked to rising temperatures, and spatialpatterns largely modulated by local climate conditions. Results show that Europe will likely
Climatic Change (2016) 137:105–119DOI 10.1007/s10584-016-1661-x
Electronic supplementary material The online version of this article (doi:10.1007/s10584-016-1661-x)contains supplementary material, which is available to authorized users.
* Giovanni [email protected]
1 European Commission, Joint Research Centre (JRC), Institute for Environment and Sustainability(IES), Climate Risk Management Unit, Via Enrico Fermi 2749, 21027 Ispra, VA, Italy
2 European Commission, Joint Research Centre (JRC), Institute for Environment and Sustainability(IES), Econometrics and Applied Statistics Unit, Via Enrico Fermi 2749, 21027 Ispra, VA, Italy
3 Department of Marine Sciences, University of the Aegean, University hill, 41100 Mitilene, Lesbos,Greece
4 Nansen Environmental and Remote Sensing Center, Thormhlensgt, 47, 5006 Bergen, Norway5 Biogeochemical Integration Department, Max Planck Institute for Biogeochemistry, 07745 Jena,
Germany6 CSIRO, Land and Water, Private Bag Nr 5, PO Wembley, Perth, WA 6913, Australia7 Environmental Hydraulics Institute, IH Cantabria, Universidad de Cantabria, C/ Isabel Torres 15,
PCTCAN, 39011 Santander, Spain

face a progressive increase in overall climate hazard with a prominent spatial gradient towardssouth-western regions mainly driven by the rise of heat waves, droughts and wildfires. Keyhotspots emerge particularly along coastlines and in floodplains, often highly populated andeconomically pivotal, where floods and windstorms could be critical in combination with otherclimate hazards. Projected increases in exposure will be larger for very extreme events due totheir pronounced changes in frequency. Results of this appraisal provide useful input forforthcoming European disaster risk and adaptation policy.
1 Introduction
Europe is expected to face major impacts from a changing climate over the coming decades(Kreibich et al. 2014). The hazard to society and environment will be largely connected tochanges in extreme climate events due to their disproportionate rise compared to the corre-sponding change in climatological averages (Rummukainen 2012). Threats will be morepronounced in areas prone to multiple climate hazards. In this context, a multi-hazardassessment accounting for possible regional variations in intensity and frequency of climateextremes is essential to identify areas potentially more exposed to climate change.
A number of climate change impact studies at the European level have been achieved, usuallyfor a single specific climate or weather hazard, such as river floods (Rojas et al. 2012; Alfieriet al. 2015), coastal floods (Nicholls andKlein 2005; Hinkel et al. 2010), heat waves (Fischer andSchär 2010; Russo et al. 2015; Christidis et al. 2015), streamflow droughts (Lehner et al. 2006;Forzieri et al. 2014), windstorms (Nikulin et al. 2011; Outten and Esau 2013) and wildfires(Bedia et al. 2013; Migliavacca et al. 2013a). The study of multiple hazards poses two majorchallenges: (1) hazards are not directly comparable as their processes and describing metricsdiffer; and (2) hazards can interact triggering cascade effects and coupled dynamics. In theexisting literature, the first issue has been mainly addressed through standardization approaches,such as classification of hazard intensity and development of continuous indices (Dilley 2005;Kappes et al. 2012; Lung et al. 2013). While these approaches represent a starting point, theydescribe only a limited set of climate hazards and the techniques used to make different hazardscomparable are largely subjective and inconsistent. The second issue has been addressed mainlyqualitatively through descriptive matrices where coupled mechanisms are conceptualized basedon multi-hazard dynamics observed at local scale and largely influenced by landscape figures(Kappes et al. 2012; Gill and Malamud 2014). Deeper data-driven investigations are neededbefore interactions between hazards can be reliably incorporated into large-scale predictivesystems. Thus, in this study we mainly focus on the first above-mentioned challenge.
Through a unique collaborative effort of different European modeling groups, a consistent setof climate hazard modeling data has been produced for this study including heat and cold waves,river and coastal floods, droughts, wildfires and windstorms. Future climate hazards in Europehave been generated for an ensemble of regional climate simulations under a Bbusiness-as-usual^(SRES A1B) greenhouse gas (GHG) emissions trajectory (Solomon 2007) and synthesized in acoherent multi-hazard framework. The method is based on the analysis of the changes infrequency of climate-induced extreme events and the corresponding variations in expected annualexposure to these events. The latter is hereafter defined as Expected Annual Fraction Exposed(EAFE), where the fraction can relate to any variable of interest (e.g., population, cropland). For arange of hazard severities, single-hazard EAFEs and changes therein are combined into multi-hazard indices to synthesize the potential exposure to multiple climate hazards (Methods). This
106 Climatic Change (2016) 137:105–119
work provides the first comprehensive multi-hazard assessment for Europe under climate changeand focuses in particular on the comparability amongst single-hazard exposures and on the degreeof overlap between areas exposed to multiple hazards throughout this century. The overall goal isto identify geographic areas with the highest potential exposure to multiple climate hazards inorder to better steer adaptation efforts and land planning across Europe. It is worth to stress thatthis contribution should not be confused with a risk assessment study. Risk assessments imply thecombination of hazard, vulnerability and spatial distribution of settlements (e.g., population,assets). In this work we focus on the hazard component, the integration of local vulnerabilities ofsettlements to different types of hazards will be tackled in a separated research work. Results areshown in spatial maps as well as aggregated for five European regions to simplify interpretation(Figure S1, Supplementary Material): Southern, Western, Central, Eastern and Northern Europe.
2 Methods
2.1 Climate hazard indicators
The analysis focuses on seven critical climate hazards for Europe: heat and cold waves, riverand coastal floods, droughts, wildfires and windstorms, each one described by an indicator thatrelates to the physical impact (magnitude of warm/cold period, flood extents, minimumdischarge, burned area, wind speed, Text S1 Supplementary Material). Climate hazard indi-cators were derived for the baseline (1981–2010), 2020s (2011–2040), 2050s (2041–2070) and2080s (2071–2100) for an ensemble of climate projections obtained from different GlobalCirculation Model-Regional Climate Model (GCM-RCM) simulations under the A1B emis-sions scenario (Solomon 2007) (table S1, Supplementary Material). Precipitation and temper-ature fields utilized in our study as climatic drivers have been bias corrected by the quantilemethod (Dosio and Paruolo 2011).
Heatwaves were defined by the Heat Wave Magnitude Index daily (HWMId) that isbased on the daily maximum temperature anomalies (Russo et al. 2015). Cold waveswere similarly calculated by referring to minimum temperatures. Return levels of heatand cold waves were retrieved by kernel density estimator with triangular kernel.Wildfires were derived from projections of the monthly percentage of burned area(Migliavacca et al. 2013a). Beta functions were selected to fit the annual fractions ofburned area and to derive extreme events. Extreme windstorms were calculated using theGeneralized Pareto distributions that have been derived through a peak-over-thresholdanalysis for daily maximum wind speeds (Outten and Esau 2013). Relative Sea LevelRise projections were combined with current extreme value distributions of total waterlevels obtained using a peak-over-threshold method (Pardaens et al. 2011; Cid et al.2014). Following, a static inundation approach was applied to generate inundation mapsalong the coastline. For inland flooding the annual maximum discharges and floodinundation maps were derived from earlier works (Rojas et al. 2012; Rojas et al.2013). For drought the minimum discharges and return levels were obtained from aprevious study (Forzieri et al. 2014). Details in Text S1, Supplementary Material. Allclimate hazard indicators have been scaled to the common 1000-m grid. Figure S2shows the spatial modeling domain for each hazard. Note that for river and coastalfloods the baseline 500-yr. flood extension is used as reference modelling domain.Details in Text S2, Supplementary Material.
Climatic Change (2016) 137:105–119 107
2.2 Frequency of extreme events in current and future climate
Baseline return levels (RL,b) of the climate hazard indicators with return periods (TR,b) from 2to 100 years were obtained at each grid cell. Future return periods (TR,f) of RL,b were calculatedby inversion of the fitted probability functions (G).
TR; f RL;b
� � ¼ 1
1−G RL;b
� � ; ð1Þ
Climate model variability was quantified by the coefficient of variance of thefuture return periods retrieved for the different climate realizations. The significanceof the changes in climate hazard was evaluated by the Kolmogorov-Smirnov testapplied on the annual values of future time windows versus baseline, separately foreach climate model.
2.3 Expected annual fraction exposed
By analogy with risks of extreme events that are often communicated in terms ofexpected annual impact, the fraction expected to be annually exposed to a hazard – theExpected Annual Fraction Exposed (EAFE) – was calculated by integrating the expo-sure to hazard events over the probability of occurrence distribution of the hazard. Theshare of exposure from hazard events with return period ≥ TR was obtained as in thefollowing:
EAFE TRð Þ ¼Z1
TR RLð Þ
0
f dp; ð2Þ
where f is the exposure-probability function. In the case of river and coastal floods f isa dummy function with value 1 when the pixel is flooded, 0 otherwise. For theremaining climate hazard indicators f is a constant function equal to 1, under theassumption that exposure to the hazard is spread homogeneously within the pixel.Future return periods retrieved from equation [1] are used to truncate the integrationfor future EAFE. For pixels with non-significant changes we keep baseline values forfuture EAFE. EAFE ranges between 0 (no exposure to the hazard) and 1 (wholefraction expected to be annually exposed to climate hazard). The use of EAFE allowscomparing quantitatively multiple hazards characterized by different processes and timescales based on a common intensity scale derived from the probability of occurrence ofextreme events in the current climatology. For each hazard, EAFE has been computedat pixel level for the corresponding set of GCM-RCM configurations, resulting in agrid-cell ensemble of hazard-specific EAFE values that reflects the variability inclimate projections.
2.4 Combining multiple hazards
To quantify the total expected annual exposure to multiple hazards we define theOverall Exposure Index (OEI). Under the assumption that the considered hazards are
108 Climatic Change (2016) 137:105–119
mutually non-exclusive, from the inclusion-exclusion principle of combinatorics theOEI can be expressed as follows for a given TR:
OEI TRð Þ ¼ ∪n
i¼1EAFEi TRð Þ ¼
Xn
k¼1
−1ð Þk−1X
I⊂ 1; :::; nf gIj j ¼ k
EAFEI TRð Þ
0BB@
1CCA; ð3Þ
where i refers to the hazard-specific EAFE, n is the number of hazards considered,the last sum runs over all subsets I of the indices {1,…,n} containing exactly kelements, and
EAFEI TRð Þ :¼\i∈I
EAFEi TRð Þ; ð4Þ
expresses the intersection of all those EAFEi with index in I. Equation [3] quantifiesthe exposure to at least one climate hazard. To account for the overall exposure to moverlapping hazards, equation [3] can be generalized using the intersections of mEAFEs in place of single-hazard components (details in Text S3 and Fig. S3,Supplementary Material). Here, we use m values up to three to quantify differentdegree of overlap amongst hazards.
To identify areas subject to large increases in exposure to multiple hazards, we define theChange Exposure Index (CEI). CEI expresses the number of hazards - of a given baselinereturn level - with a future relative increase in EAFE over a certain threshold (20 %, 100 % and1000 %). The use of three different thresholds allows capturing moderate, strong and extremechanges in hazard exposure. The number of hazards with an increase in exposure over thegiven threshold is calculated in each grid cell and then aggregated at NUTS3 level as the 0.99percentile of this distribution over all cells. The 99th percentile of the exposure changedistribution within the NUTS3 region excludes local fitting extrapolation errors and isconsidered representative of the maximum degree of change in exposure. CEI allows identi-fying key hotspots subject to predefined levels of change in exposure (details in Text S4,Supplementary Material).
For the spatial domain common to all hazards OEI and CEI are calculated for each returnlevel and time slice using the ensemble median of all climate model combinations for eachhazard as inputs because only one single GCM-RCM configuration is common amongst thehazards (Table S1). To understand the possible effects of climate uncertainty on multi-hazardmetrics, OEI and CEI have been also calculated for the maximum and minimum hazardscenarios obtained by combining the single-hazard grid-cell ensemble maximum and mini-mum, respectively, as inputs.
3 Results and discussion
3.1 Single-hazard impacts
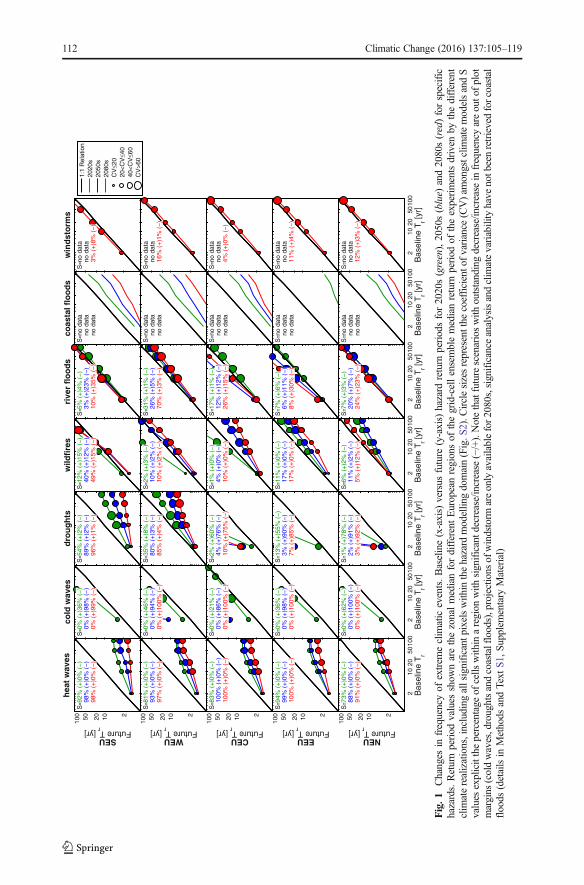
Figure 1 shows the projected changes in frequency of climatic extreme events with respect tocurrent climate, where increasing (decreasing) hazard occurrences are denoted by lines under(over) the bisector, the coefficient of variance (CV) describes the inter-model spread (climate
Climatic Change (2016) 137:105–119 109

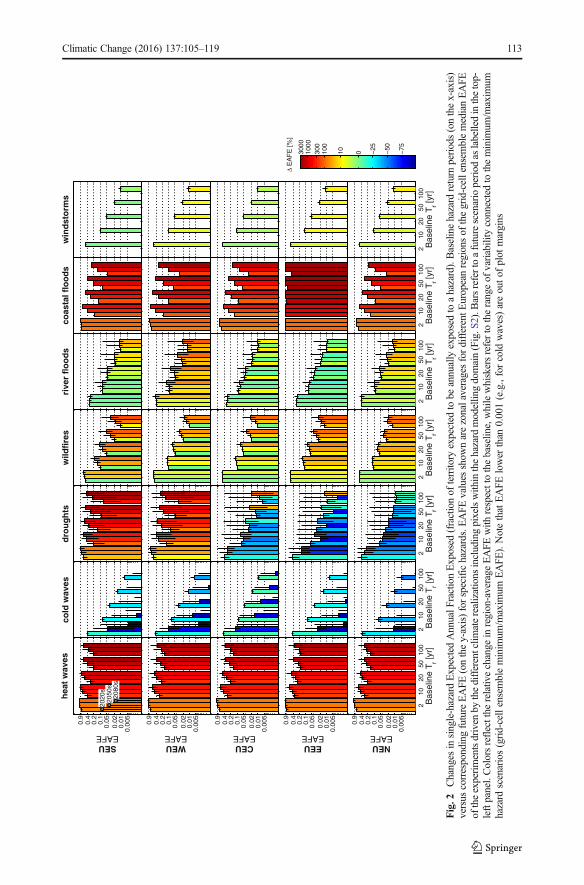
uncertainty) and S values the percentage of area subject to significant changes (5 % level). Thefrequency analysis is complemented with the corresponding variations in Expected AnnualFraction Exposed (EAFE) shown in Fig. 2 both in terms of its magnitude and relative changewith respect to the baseline; whiskers refer to the range of variability connected to theminimum/maximum hazard scenarios. Corresponding spatial patterns of EAFE are shown inFigure S4. Heat waves show a progressive and highly significant increase in frequency all overEurope (S > 73 % in near future climate, approaching 100 % in all regions by the end of thiscentury), with larger climate variability in long-term scenarios (40 ≤ CV ≤ 60) and a morepronounced intensification in Southern Europe (where current 100-yr. events could occuralmost every year in the 2080s) (Fig. 1). Consistently, EAFE values show a progressiveincrease as time proceeds, especially in Southern Europe where, by the end of the century,up to 60 % of the territory could be annually exposed to a current 100-year heat wave (Fig. 2).Cold waves show an opposite trend with current cold extremes tending to mostly disappear inEurope in more distant futures (current 2-yr. event may occur less than every 100 years by theend of the century, significant almost everywhere, Fig. 1). Accordingly, cold waves couldexperience a rapid decrease in EAFE and a change up to −100 % by the end of the century(Fig. 2). Streamflow droughts may become more severe and persistent in Southern andWestern Europe (current 100-yr. events could occur approximately every 2 to 5 years by2080, respectively, S ≥ 85) resulting from the reduced precipitation and increased evaporativedemands with higher temperatures (Fig. 1). This leads to a consistent increase in EAFE and bythe end of the century over 25 % of the territories could be affected every year by baseline 100-yr. droughts (Fig. 2). Northern, Eastern and Central Europe show an opposite tendency with astrong reduction in drought frequency (Fig. 1) caused by higher precipitation that outweigh theeffects of increased evapotranspiration (Forzieri et al. 2014). Such effects translate mostly intoconsistent decreases in EAFE up to −100 % (Fig. 2). Significance increases with time whileclimate variability shows variable tendencies depending on the return levels (S > 75 % and CVover 60 % by the end of the century). Most of Europe, especially Western, Eastern and Centralregions, could experience an increase in the frequency of extreme wildfires (current 100-yr.events will occur every 5 to 50 years) with a progressive rise in significance and modelagreement (S > 10 % and CV ≤ 60 % by the end of the century) (Fig. 1). Interestingly,Southern Europe shows a decrease in the frequency of very extreme events, which is likely dueto the expected reduction in net primary productivity of terrestrial ecosystem that may limit thefuel availability and, ultimately, the propagation of large wildfires (Migliavacca et al. 2013a).Progressive increases in EAFE are visible for wildfires over the whole domain (one to three-folds the baseline value, Fig. 2). River floods show in general more spatial variability andfluctuations with time in the frequency of extreme events as well as a larger climate-inducedspread compared to the other hazards (higher CV values, Fig. 1). This relates to the highvariability in projected geographical patterns of heavy precipitation intensity due to structuraland parametric model uncertainty and internal climate variability (Fischer et al. 2013). WesternEurope shows a consistent rise in future flood hazard (current 100-yr. events could manifestevery ~30 years in 2080s, S up to 70 %), mainly as a result of a pronounced increase inaverage and extreme rainfall (Rojas et al. 2012). Such effects result in a 50–100 % increase infuture EAFE (Fig. 2). A modest but significant decrease in river flood frequency is projected inSouthern, Central and Eastern regions, in the latter because of the strong reduction in snowmeltinduced river floods, which offsets the increase in average and extreme precipitation. Coastalfloods show a progressive and pronounced increase in recurrence along Europe’s coastlineschiefly caused by sea level rise (current 100-yr. event may manifest every 2 to 8 years, or even
110 Climatic Change (2016) 137:105–119

sub-annually in Eastern Europe, in the 2080s, Fig. 1) and leading to strong increase in EAFE(Fig. 2). Noteworthy is the pronounced increase in EAFE in Eastern Europe as a consequenceof the rapid intensification of inundations over the Danube delta. Evidence for changes inwindstorms remains largely elusive (S < 16 %) and with considerable inter-model spread forlarger return levels (up to CV > 60 % for current 100-yr. events, Fig. 1). Areas with increasesin windstorm hazard are mainly located in Western, Eastern and Northern Europe, whileSouthern regions present slight reductions in frequency as observed in previous studies(Nikulin et al. 2011; Outten and Esau 2013). EAFE of windstorms show modest changeswith respect to the baseline (up to ±10 %, Fig. 2).
Interestingly, larger increases in EAFE can be observed at higher return levels and for long-term scenarios due to the progressive intensification of very extreme events. This occurs alsoin regions prevalently experiencing a reduction (or slight change) in future frequency ofclimate hazards, such as Central and Eastern Europe for droughts, Southern Europe forwildfires and Southern, Central and Northern Europe for floods. The apparent contradictionmanifests where few localized areas experience a very large increase in frequency thatoutweighs the opposite tendency occurring in most of the region.
Projected changes in single-hazard exposure suggest that future hazard scenarios willconsiderably deviate from those observed in current climate, especially for climate hazardsstrongly linked to temperature rises (e.g., heat and cold waves, droughts and coastal floods).Despite the general good agreement in the direction of change in exposure amongst theminimum/maximum hazard scenarios (whiskers in Fig. 2) opposite variations in EAFE areapparent in some situations. This is evident for droughts in Central, Eastern and NorthernEurope where upper and lower bounds of the range are greater and lower, respectively, than thebaseline value (e.g., 0.01 for 100-yr. baseline return period). A deeper inspection of the EAFEsvalues originated from single GCM-RCM combinations reveals that changes of differenthazards may present a dependence across models, with generally more pronounced increasesin exposure in models with a larger overall warming (e.g., C4I-RCA-HadCM3, METO-HadRM3-HadCM3, Fig. S5).
3.2 Changes in overall and concurrent exposures
Figure 3a shows the overall exposure of each European region resulting from the combinationof all hazards, expressed by the Overall Exposure Index accounting for the different number ofoverlapping hazards (OEI); whiskers express the combination of model uncertainty andinternal variability connected to the minimum/maximum multi-hazard scenarios. The positivegradient in ΔEAFE for increasing return levels is more pronounced than in single-hazardscenarios. This results mainly from the combined effect of the abrupt reduction of cold wavesand droughts – the latter only for North-eastern and Central Europe – and the compensationoccurring at high return levels when the marked positive changes of remaining hazardsoutweigh such effects (EAFE(100-yr) up to 0.77 by the end of the century for OEI1, aboutten-fold the baseline value). The 100-yr. return level remains the most relevant in terms ofprojected increase of expected annual exposure, especially when overlapping of multiplehazards is accounted for (EAFE(100-yr) up to 0.25 and 0.006 for OEI2 and OEI3, respectively,about thirty-fold the baseline value). Looking at the combination of 100-yr. extreme events,results suggest that the entire Europe could face a progressive increase in overall climateexposure, with a prominent spatial gradient towards south-western regions (Fig. 3b). Heatwaves, droughts and wildfires, which are particularly effective in such regions, likely provide
Climatic Change (2016) 137:105–119 111
2102050100
hea
t w
aves
SEUFuture Tr [yr]
S=9
2% (
+)0
% (
−)
98%
(+
)0%
(−
)98
% (
+)0
% (
−)
2102050100
WEUFuture Tr [yr]
S=8
1% (
+)0
% (
−)
93%
(+
)0%
(−
)97
% (
+)0
% (
−)
2102050100
CEUFuture Tr [yr]
S=8
3% (
+)0
% (
−)
100%
(+
)0%
(−
)10
0% (
+)0
% (
−)
2102050100
EEUFuture Tr [yr]
S=9
4% (
+)0
% (
−)
99%
(+
)0%
(−
)10
0% (
+)0
% (
−)
210
2050
100
2102050100
Bas
elin
e T r
NEUFuture Tr [yr]
S=7
3% (
+)0
% (
−)
88%
(+
)0%
(−
)91
% (
+)0
% (
−)
cold
wav
esS
=0%
(+
)36%
(−
)0%
(+
)98%
(−
)0%
(+
)99%
(−
)
S=0
% (
+)4
6% (
−)
0% (
+)9
4% (
−)
0% (
+)1
00%
(−
)
S=0
% (
+)2
1% (
−)
0% (
+)8
6% (
−)
0% (
+)1
00%
(−
)
S=0
% (
+)3
6% (
−)
0% (
+)9
8% (
−)
0% (
+)1
00%
(−
)
210
2050
100
Bas
elin
e T r [y
r]
S=0
% (
+)6
2% (
−)
0% (
+)1
00%
(−
)0%
(+
)100
% (
−)
dro
ug
hts
S=5
4% (
+)2
% (
−)
89%
(+
)2%
(−
)96
% (
+)1
% (
−)
S=3
5% (
+)8
% (
−)
80%
(+
)3%
(−
)85
% (
+)4
% (
−)
S=2
% (
+)6
0% (
−)
4% (
+)7
6% (
−)
10%
(+
)75%
(−
)
S=1
3% (
+)5
5% (
−)
3% (
+)9
0% (
−)
7% (
+)8
5% (
−)
210
2050
100
Bas
elin
e T r [y
r]
S=1
% (
+)7
8% (
−)
2% (
+)9
1% (
−)
3% (
+)9
2% (
−)
wild
fire
sS
=12%
(+
)15%
(−
)40
% (
+)1
2% (
−)
49%
(+
)15%
(−
)
S=2
% (
+)3
% (
−)
10%
(+
)2%
(−
)10
% (
+)2
% (
−)
S=1
% (
+)0
% (
−)
4% (
+)0
% (
−)
10%
(+
)0%
(−
)
S=1
1% (
+)0
% (
−)
17%
(+
)0%
(−
)17
% (
+)0
% (
−)
210
2050
100
Bas
elin
e T r [y
r]
S=6
% (
+)2
% (
−)
11%
(+
)2%
(−
)5%
(+
)12%
(−
)
rive
r fl
oo
ds
S=5
% (
+)4
% (
−)
3% (
+)2
3% (
−)
10%
(+
)35%
(−
)
S=3
1% (
+)1
% (
−)
26%
(+
)5%
(−
)70
% (
+)3
% (
−)
S=1
7% (
+)1
% (
−)
12%
(+
)12%
(−
)26
% (
+)1
5% (
−)
S=7
% (
+)6
% (
−)
6% (
+)1
1% (
−)
8% (
+)3
0% (
−)
210
2050
100
Bas
elin
e T r [y
r]
S=7
% (
+)3
% (
−)
20%
(+
)7%
(−
)24
% (
+)2
3% (
−)
coas
tal f
loo
ds
S=n
o da
tano
dat
ano
dat
a
S=n
o da
tano
dat
ano
dat
a
S=n
o da
tano
dat
ano
dat
a
S=n
o da
tano
dat
ano
dat
a
210
2050
100
Bas
elin
e T r [y
r]
S=n
o da
tano
dat
ano
dat
a
win
dst
orm
sS
=no
data
no d
ata
3% (
+)8
% (
−)
S=n
o da
tano
dat
a16
% (
+)1
% (
−)
S=n
o da
tano
dat
a4%
(+
)0%
(−
)
S=n
o da
tano
dat
a11
% (
+)4
% (
−)
210
2050
100
Bas
elin
e T r [y
r]
S=n
o da
tano
dat
a12
% (
+)3
% (
−)
1:1
Rel
atio
n20
20s
2050
s20
80s
CV
≤20
20<
CV
≤40
40<
CV
≤60
CV
>60
Fig.1
Changes
infrequencyof
extrem
eclim
atic
events.Baseline(x-axis)
versus
future
(y-axis)
hazard
return
periodsfor2020s(green),2050s(blue)
and2080s(red)forspecific
hazards.Returnperiod
values
show
narethezonalmedianfordifferentEuropeanregionsof
thegrid-cellensemblemedianreturn
period
oftheexperimentsdriven
bythedifferent
clim
aterealizations,including
allsignificant
pixelswith
inthehazard
modellin
gdomain(Fig.S
2).C
irclesizesrepresentthe
coefficientofvariance
(CV)am
ongstclim
atemodelsandS
values
explicitthepercentage
ofcells
with
inaregion
with
significantd
ecrease/increase
(−/+).Notethatfuturescenarioswith
outstandingdecrease/in
crease
infrequencyareoutofplot
margins
(coldwaves,droughtsandcoastalfloods),projections
ofwindstorm
areonlyavailablefor2
080s,significanceanalysisandclim
atevariabilityhave
notbeenretrievedforcoastal
floods
(detailsin
Methods
andText
S1,S
upplem
entary
Material)
112 Climatic Change (2016) 137:105–119
0.00
50.
010.
020.
050.1
0.2
0.4
0.9
hea
t w
aves
SEUEAFE
2020
s20
50s
2080
s
0.00
50.
010.
020.
050.1
0.2
0.4
0.9
WEUEAFE 0.
005
0.01
0.02
0.050.1
0.2
0.4
0.9
CEUEAFE 0.
005
0.01
0.02
0.050.1
0.2
0.4
0.9
EEUEAFE
210
2050
100
0.00
50.
010.
020.
050.1
0.2
0.4
0.9
Bas
elin
e T r [y
r]
NEUEAFE
cold
wav
es
210
2050
100
Bas
elin
e T r [y
r]
dro
ug
hts
210
2050
100
Bas
elin
e T r [y
r]
wild
fire
s
210
2050
100
Bas
elin
e T r [y
r]
rive
r fl
oo
ds
210
2050
100
Bas
elin
e T r [y
r]
coas
tal f
loo
ds
210
2050
100
Bas
elin
e T r [y
r]
win
dst
orm
s
210
2050
100
Bas
elin
e T r [y
r]
−75
−50
−25
010100
300
1000
3000
Δ E
AF
E [%
]
Fig.2
Changes
insingle-hazardExpectedAnnualF
ractionExposed
(fractionof
territory
expected
tobe
annuallyexposedto
ahazard).Baselinehazard
return
periods(onthex-axis)
versus
correspondingfutureEAFE
(onthey-axis)forspecifichazards.EAFE
values
show
narezonalaveragesfordifferentE
uropeanregionsof
thegrid-cellensem
blemedianEAFE
oftheexperimentsdriven
bythedifferentclim
aterealizations
includingpixelswithinthehazard
modellingdomain(Fig.S
2).B
arsrefertoafuturescenarioperiod
aslabelledinthetop-
leftpanel.Colorsreflectthe
relativechange
inregion-average
EAFE
with
respecttothebaselin
e,whilewhiskersreferto
therangeof
variability
connectedto
theminim
um/m
axim
umhazard
scenarios(grid-cellensembleminim
um/m
axim
umEAFE
).NotethatEAFE
lower
than
0.001(e.g.,forcold
waves)areoutof
plot
margins
Climatic Change (2016) 137:105–119 113

the most relevant contribution in the estimation of future OEI (Fig. S4, SupplementaryMaterial).
Figure 4a shows for each European region the spatial extent experiencing pronouncedchanges in at least four hazards as expressed by the Change Exposure Index calculated fordifferent levels of increase in exposure (CEI), whiskers refer to the climate variabilityconnected to the minimum/maximum multi-hazard scenarios. Areas with potential concurrentexposures tend to increase with the return level and for the long-term scenarios, consistently tothe pronounced variations in very extreme events. The spatial pattern of CEI (Fig. 4b) revealspotential key hotspots that are potentially prone to an increase in exposure to multiple hazards.These are mainly located along coastlines and in floodplains where windstorms and floods willbe likely relevant in combination with temperature-related hazards (hazard-specific contribu-tions shown in Fig. S6, Supplementary Material). More exposed regions include the BritishIsles, the North Sea area, north-western parts of the Iberian Peninsula, as well as parts ofFrance, the Alps, Northern Italy and Balkan countries along the Danube River. These areas,even if they may present lower overall climate exposure compared to other regions in Europe(Fig. 3b), will be prone to the largest changes in multi-hazard exposures that could potentiallyresults in larger risks.
Relevant climate variability emerges for both OEI and CEI, more pronounced for long-termscenarios, larger return periods and higher degree of overlapping/change when compared totheir median values (Fig. 3a and 4a), largely consistent to the ranges of variability observed inminimum/maximum single-hazard EAFE scenarios (Fig. 2). We argue that the uncertaintycaptured by the minimum and maximum scenarios tends to overestimate the one that wouldoriginate ideally from a combination of each model individually into multi-hazard metrics.Then, sampled ranges of variability should be considered as a qualitative proxy of how modeluncertainties of single hazards propagate into multi-hazard metrics.
3.3 Sources of uncertainty
Despite the depth of this study, results should be viewed in light of the potential uncertaintysources and caveats of the proposed methodology. The multi-hazard maps are dependent onthe chosen set of climate hazard indicators: the use of diverse input hazards (e.g., hail,landslides) might lead to different findings. We argue that the set of hazards selected includesthe most relevant hazards for Europe in terms of average annual losses and deaths (Guha-Sapiret al. 2014; NatCatSERVICE 2015). Metrics used to represent the selected climate hazards arecrucial for the resulting impact scenarios: changes in return periods depend on the time scaleselected to characterize an event type, e.g. 1-day temperature extremes, weekly heatwaves orseasonal heat anomalies experience different changes in return periods (Perkins and Alexander2012; Trenberth et al. 2014). In our approach we focus on hazard-specific metrics of impactrelevance that have been documented in recent literature. Details on the sensitivity analysis andcalibration/validation exercises for each single hazard are reported in the references (Rojas etal. 2012; Migliavacca et al. 2013b; Outten and Esau 2013; Forzieri et al. 2014; Cid et al. 2014;Russo et al. 2014). We recognize that extreme value fitting and kernel density estimators mayintroduce additional uncertainty in the projections of climate hazards especially at high returnperiods. Recent studies, though, documented its secondary role with respect to the inter-modelspread (Rojas et al. 2012; Forzieri et al. 2014).
We apply a conservative approach without accounting explicitly for hazard interrelationsthat could lead to greater impacts. Regions exposed to the overlap of multiple hazards and
114 Climatic Change (2016) 137:105–119
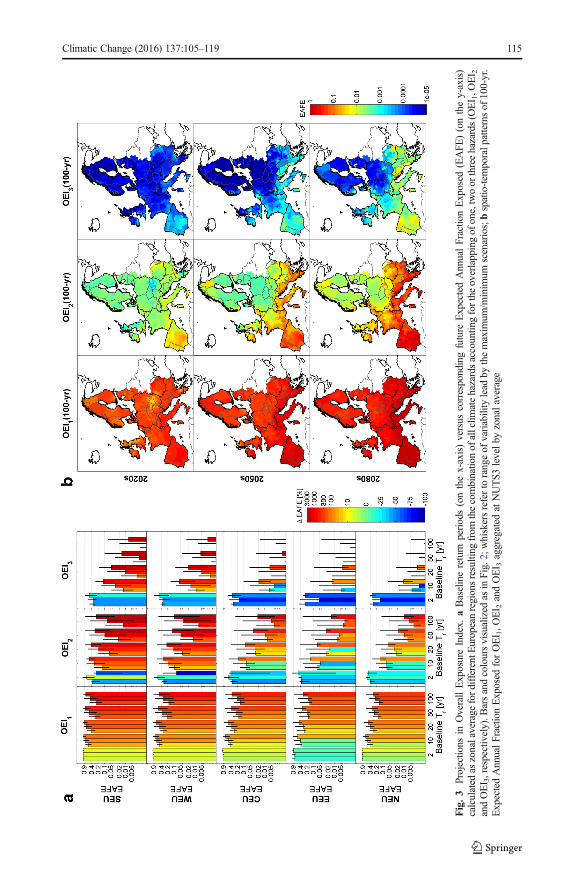
Fig.3
Projectio
nsin
OverallExposureIndex.
aBaselinereturn
periods(onthex-axis)versus
correspondingfuture
ExpectedAnnualFractionExposed
(EAFE
)(onthey-axis)
calculated
aszonalaverage
ford
ifferentEuropeanregionsresulting
from
thecombinatio
nof
allclim
atehazardsaccountin
gforthe
overlappingof
one,twoor
threehazards(O
EI 1,O
EI 2
andOEI 3,respectively).B
arsandcoloursvisualized
asinFig.2;
whiskersrefertorangeof
variability
lead
bythemaxim
um/m
inim
umscenarios;bspatio-tem
poralp
atternsof
100-yr.
ExpectedAnnualFractionExposed
forOEI 1,O
EI 2andOEI 3aggregated
atNUTS3
levelby
zonalaverage
Climatic Change (2016) 137:105–119 115

Fig.4
Projectio
nsinChangeExposureIndex.aBaselinereturn
periods(onthex-axis)and
correspondingarea
exposedtoatleastfourh
azards
with
relativ
eincreasesover20
%,100
%and1000
%with
respecttothebaselin
e(CEI 20,C
EI 100andCEI 1000,respectively)
ford
ifferentEuropeanregions;barsgroupedas
inFig.2;whiskersrefertotherangeof
variabilitylead
bythemaxim
um/m
inim
umscenarios;bspatio-tem
poralpatternsof
CEI 20,C
EI 100andCEI 1000
calculated
for100-yr.E
xpectedAnnualFractio
nExposed
116 Climatic Change (2016) 137:105–119
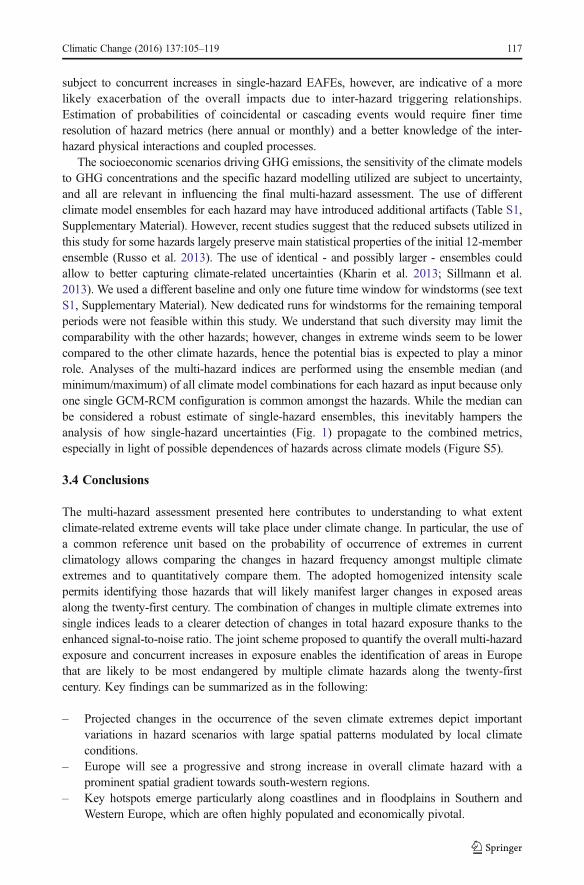
subject to concurrent increases in single-hazard EAFEs, however, are indicative of a morelikely exacerbation of the overall impacts due to inter-hazard triggering relationships.Estimation of probabilities of coincidental or cascading events would require finer timeresolution of hazard metrics (here annual or monthly) and a better knowledge of the inter-hazard physical interactions and coupled processes.
The socioeconomic scenarios driving GHG emissions, the sensitivity of the climate modelsto GHG concentrations and the specific hazard modelling utilized are subject to uncertainty,and all are relevant in influencing the final multi-hazard assessment. The use of differentclimate model ensembles for each hazard may have introduced additional artifacts (Table S1,Supplementary Material). However, recent studies suggest that the reduced subsets utilized inthis study for some hazards largely preserve main statistical properties of the initial 12-memberensemble (Russo et al. 2013). The use of identical - and possibly larger - ensembles couldallow to better capturing climate-related uncertainties (Kharin et al. 2013; Sillmann et al.2013). We used a different baseline and only one future time window for windstorms (see textS1, Supplementary Material). New dedicated runs for windstorms for the remaining temporalperiods were not feasible within this study. We understand that such diversity may limit thecomparability with the other hazards; however, changes in extreme winds seem to be lowercompared to the other climate hazards, hence the potential bias is expected to play a minorrole. Analyses of the multi-hazard indices are performed using the ensemble median (andminimum/maximum) of all climate model combinations for each hazard as input because onlyone single GCM-RCM configuration is common amongst the hazards. While the median canbe considered a robust estimate of single-hazard ensembles, this inevitably hampers theanalysis of how single-hazard uncertainties (Fig. 1) propagate to the combined metrics,especially in light of possible dependences of hazards across climate models (Figure S5).
3.4 Conclusions
The multi-hazard assessment presented here contributes to understanding to what extentclimate-related extreme events will take place under climate change. In particular, the use ofa common reference unit based on the probability of occurrence of extremes in currentclimatology allows comparing the changes in hazard frequency amongst multiple climateextremes and to quantitatively compare them. The adopted homogenized intensity scalepermits identifying those hazards that will likely manifest larger changes in exposed areasalong the twenty-first century. The combination of changes in multiple climate extremes intosingle indices leads to a clearer detection of changes in total hazard exposure thanks to theenhanced signal-to-noise ratio. The joint scheme proposed to quantify the overall multi-hazardexposure and concurrent increases in exposure enables the identification of areas in Europethat are likely to be most endangered by multiple climate hazards along the twenty-firstcentury. Key findings can be summarized as in the following:
– Projected changes in the occurrence of the seven climate extremes depict importantvariations in hazard scenarios with large spatial patterns modulated by local climateconditions.
– Europe will see a progressive and strong increase in overall climate hazard with aprominent spatial gradient towards south-western regions.
– Key hotspots emerge particularly along coastlines and in floodplains in Southern andWestern Europe, which are often highly populated and economically pivotal.
Climatic Change (2016) 137:105–119 117

Results – interpreted in light of exposed assets and their vulnerability – provide useful inputto derive future multi-hazard risk scenarios and support adaptation strategies to increasingEurope’s resilience to climate change.
Acknowledgments G.F. and L.F. conceived and designed the study, G.F. and S.O. analyzed windstorms, G.F.analyzed streamflow droughts, G.F. and M.M. analyzed wildfires, S.R. analyzed heat and cold waves, M.V. andA.C. analyzed coastal floods, R.R. and L.A. analyzed river floods, G.F. and A.B. harmonized the climate hazards,G.F. developed the multi-hazard indices. G.F. and L.F. wrote the paper with contributions from all the authors.This research was supported by the CCMFF Project, funded by the DG Climate Action (ref. 071303/2012/630715/CLIMA.C.3) and the FP7 ENHANCE project (grant agreement number 308438) funded by theEuropean Commission.
Open Access This article is distributed under the terms of the Creative Commons Attribution 4.0 InternationalLicense (http://creativecommons.org/licenses/by/4.0/), which permits unrestricted use, distribution, and repro-duction in any medium, provided you give appropriate credit to the original author(s) and the source, provide alink to the Creative Commons license, and indicate if changes were made.
References
Alfieri L, Burek P, Feyen L, Forzieri G (2015) Global warming increases the frequency of river floods in Europe.Hydrol Earth Syst Sci 19:2247–2260. doi:10.5194/hess-19-2247-2015
Bedia J, Herrera S, Camia A, et al. (2013) Forest fire danger projections in theMediterranean using ENSEMBLESregional climate change scenarios. Clim Chang 122:185–199. doi:10.1007/s10584-013-1005-z
Christidis N, Jones GS, Stott PA (2015) Dramatically increasing chance of extremely hot summers since the 2003European heatwave. Nat Clim Chang 5:46–50. doi:10.1038/nclimate2468
Cid A, Castanedo S, Abascal AJ, et al. (2014) A high resolution hindcast of the meteorological sea levelcomponent for Southern Europe: the GOS dataset. Clim Dyn 43:2167–2184. doi:10.1007/s00382-013-2041-0
Dilley M (2005) Natural disaster hotspots: A Global risk analysis. World Bank PublicationsDosio A, Paruolo P (2011) Bias correction of the ENSEMBLES high-resolution climate change projections for
use by impact models: Evaluation on the present climate. J Geophys Res Atmospheres 116:D16106. doi:10.1029/2011JD015934
Fischer EM, Schär C (2010) Consistent geographical patterns of changes in high-impact European heatwaves.Nat Geosci 3:398–403. doi:10.1038/ngeo866
Fischer EM, Beyerle U, Knutti R (2013) Robust spatially aggregated projections of climate extremes. Nat ClimChang 3:1033–1038. doi:10.1038/nclimate2051
Forzieri G, Feyen L, Rojas R, et al. (2014) Ensemble projections of future streamflow droughts in Europe. HydrolEarth Syst Sci 18:85–108. doi:10.5194/hess-18-85-2014
Gill JC, Malamud BD (2014) Reviewing and visualizing the interactions of natural hazards. Rev Geophys 52:2013RG000445. doi:10.1002/2013RG000445
Guha-Sapir, D, Hoyois, Ph, Below, R (2014) Annual disaster statistical review 2013, the numbers and trends.Centre for Research on the Epidemiology of Disasters (CRED), Brussels, Belgium
Hinkel J, Nicholls RJ, Vafeidis AT, et al. (2010) Assessing risk of and adaptation to sea-level rise in the EuropeanUnion: an application of DIVA. Mitig Adapt Strateg Glob Change 15:703–719. doi:10.1007/s11027-010-9237-y
NatCatSERVICE | Munich Re. http://www.munichre.com/natcatservice. Accessed 26 May 2015KappesMS, Keiler M, von Elverfeldt K, Glade T (2012) Challenges of analyzing multi-hazard risk: a review. Nat
Hazards 64:1925–1958. doi:10.1007/s11069-012-0294-2Kharin VV, Zwiers FW, Zhang X, Wehner M (2013) Changes in temperature and precipitation extremes in the
CMIP5 ensemble. Clim Chang 119:345–357. doi:10.1007/s10584-013-0705-8Kreibich H, van den Bergh JCJM, Bouwer LM, et al. (2014) Costing natural hazards. Nat Clim Chang 4:303–
306. doi:10.1038/nclimate2182Lehner B, Döll P, Alcamo J, et al. (2006) Estimating the impact of Global change on flood and drought risks in
Europe: A Continental, Integrated analysis. Clim Chang 75:273–299. doi:10.1007/s10584-006-6338-4
118 Climatic Change (2016) 137:105–119
Lung T, Lavalle C, Hiederer R, et al. (2013) A multi-hazard regional level impact assessment for Europecombining indicators of climatic and non-climatic change. Glob Environ Change 23:522–536. doi:10.1016/j.gloenvcha.2012.11.009
Migliavacca M, Dosio A, Camia A, et al. (2013a) Modeling biomass burning and related carbon emissionsduring the 21st century in Europe. J Geophys Res Biogeosciences 118:2013JG002444. doi:10.1002/2013JG002444
Migliavacca M, Dosio A, Kloster S, et al. (2013b) Modeling burned area in Europe with the Community landmodel. J Geophys Res Biogeosciences 118:265–279. doi:10.1002/jgrg.20026
NatCatSERVICE (2015) Annual statistics 2014, Loss events worldwide 2014, Percentage distribution. MunichRe, Munich, Germany
Nicholls RJ, Klein RJT (2005) Climate change and coastal management on Europe’s coast. In: Vermaat J,Salomons W, Bouwer L, Turner K (eds) Managing European Coasts. Springer, Berlin Heidelberg, pp. 199–226
Nikulin G, Kjellström E, Hansson U, et al. (2011) Evaluation and future projections of temperature, precipitationand wind extremes over Europe in an ensemble of regional climate simulations. Tellus A 63:41–55. doi:10.1111/j.1600-0870.2010.00466.x
Outten SD, Esau I (2013) Extreme winds over Europe in the ENSEMBLES regional climate models. AtmosChem Phys 13:5163–5172. doi:10.5194/acp-13-5163-2013
Pardaens AK, Lowe JA, Brown S, et al. (2011) Sea-level rise and impacts projections under a future scenariowith large greenhouse gas emission reductions. Geophys Res Lett 38:L12604. doi:10.1029/2011GL047678
Perkins SE, Alexander LV (2012) On the Measurement of heat waves. J Clim 26:4500–4517. doi:10.1175/JCLI-D-12-00383.1
Rojas R, Feyen L, Bianchi A, Dosio A (2012) Assessment of future flood hazard in Europe using a largeensemble of bias-corrected regional climate simulations. J Geophys Res Atmospheres 117:D17109. doi:10.1029/2012JD017461
Rojas R, Feyen L, Watkiss P (2013) Climate change and river floods in the European Union: Socio-economicconsequences and the costs and benefits of adaptation. Glob Environ Change 23:1737–1751. doi:10.1016/j.gloenvcha.2013.08.006
Rummukainen M (2012) Changes in climate and weather extremes in the 21st century. Wiley Interdiscip RevClim Chang 3:115–129. doi:10.1002/wcc.160
Russo S, Dosio A, Sterl A, et al. (2013) Projection of occurrence of extreme dry-wet years and seasons in Europewith stationary and nonstationary Standardized precipitation indices. J Geophys Res Atmospheres 118:7628–7639. doi:10.1002/jgrd.50571
Russo S, Dosio A, Graversen RG, et al. (2014) Magnitude of extreme heat waves in present climate and theirprojection in a warming world. J Geophys Res Atmospheres 119:12,500–12,512. doi:10.1002/2014JD022098
Russo S, Sillmann J, Fischer EM (2015) Top ten European heatwaves since 1950 and their occurrence in thecoming decades. Environ Res Lett 10:124003. doi:10.1088/1748-9326/10/12/124003
Sillmann J, Kharin VV, Zhang X, et al. (2013) Climate extremes indices in the CMIP5 multimodel ensemble: Part1. Model evaluation in the present climate J Geophys Res Atmospheres 118:1716–1733. doi:10.1002/jgrd.50203
Solomon S (2007) Climate change 2007 - the physical Science Basis: Working Group I contribution to the Fourthassessment Report of the IPCC. Cambridge University Press
Trenberth KE, Dai A, van der Schrier G, et al. (2014) Global warming and changes in drought. Nat Clim Chang4:17–22. doi:10.1038/nclimate2067
Climatic Change (2016) 137:105–119 119