multi-level spatial voting: vote switching in ep elections and...
TRANSCRIPT

Multi-level spatial voting: Vote switching in EP
elections and European Integration preferences
Steffen Zittlau, University of Mannheim
Paper prepared for the MEDW Conference, Paris May 2015
Abstract
Do voters choose different parties in European elections because they caremore about European issues than at national general elections, as has beensuggested by some recent studies (Hobolt et al 2009; Clark and Rohrschneider2009)? If this would be the case, it call into question the predominant the-oretical paradigm by which political scientists analyse multi-level elections -the second-order election model. Unfortunately, the research question has notyet been satisfactorily answered. In this paper I attempt to solve importanttheoretical and methodological limitations of previous studies. The analyticalframework I develop is not limited to the reasearch question at hand, butprovides a flexible framework to study individual-level voting dynamics ingeneral. Employing data from a novel voter panel study, I find that policypreferences on European Integration played a noticeable, but subordinate rolein the voting rationale of voters in the 2014 European election in Bavaria. Thefindings indicate that EU preferences can have very different consequences forelectoral outcomes, depending on the constellation of parties in the politicalspace.
1
Introduction
The question why some voters vote for different parties in European Parliamentary
(EP) elections than in national election has been at the core of a vivid debate
over the character of European multi-level democracy since the first EP election
in 1979. The traditional and dominant theoretical lense through which scholars,
media and political actors alike view and interpret EP elections is the second-order
elections (SOE) framework proposed by Reif and Schmitt (1980). SOE theory is
rather pessimistic about the democratic merits of holding second-order elections. It
stipulates that EP elections are just like less important national general elections.
The substantive content, “campaign and results are more or less heavily influenced
by the political constellation of the dominant political arena within the system, the
first order political arena (FOPA)” (Reif 1997, 117). This transfer hypothesis, that
voters “apply their evaluations of national-level phenomena to the EU level” (Clark
and Rohrschneider 2009), implying that the issues remain the same even though the
election is about something else, is the essence of the second-order interpretation
(Marsh and Mikhaylov 2010, 13).
In the last decade, opposition to this interpretation has formed. Several contribu-
tions have argued that due to the increasing powers of the European Parliament,
EP elections have become more important and more European after all (Clark and
Rohrschneider 2009; Hobolt and Wittrock 2011; Hobolt, Spoon, and Tilley 2009).
The key proposition of this alternative strand of research, which has been referred
to as the Europe matters argument (Hix et al. 2007; Hobolt, Spoon, and Tilley
2009; Marsh 2007), is that voters care more about European issues when they vote
in EP elections than in national elections. While the Europe matters argument
does not contest that second-order factors shape how voters behave in EP elections,
it argues that also factors specific to the electoral arena play a role in explaining
differential voting behavior: Voters vote for different parties in EP elections than
2
in national elections because they perceive the election to be about different issues.
Essentially, the argument is based on a multi-dimensional proximity voting model,
where the increased importance of preferences on European issues leads voters to
switch to parties that better reflect their preferences (Hobolt and Wittrock 2011;
Marsh and Mikhaylov 2010). If voters were to recalibrate the relevant issue space
if the electoral context changes (Marsh and Mikhaylov 2010, 13), this would shed a
much more positive light on the normative merits of multi-level democracy. A vote
for a different party in a different electoral arena would then be a rational act of
ensuring one’s preferences to be represented in the EP, and not an act driven by
“base motives” such as using the EP election merely as a vehicle to voice discontent
or influence domestic politics.
But do preferences on European issues indeed motivate vote switching in EP elec-
tions? I show that the empirical evidence is very shaky. Next to launching a
thorough re-investigation of the research question, the contribution of the paper
is to identify two important problems with standard research designs employed in
the study of vote switching and to propose a way to fix the problems. I find that
previous studies on the subject, and studies of vote switching in general, have relied
on an incomplete spatial model by modeling vote switching probabilities uncondi-
tional of the positions of policy alternatives. While the problem is surely known
to many authors, common practice continues to prevail. It seems like the choice of
statistical tools is driving the theoretical exposition. Common practice is to collapse
differential vote choice in different elections into a binary variable. I find that bi-
nary discrete choice models are ill-suited to study policy-motivated vote-switching
in multi-party systems. Instead, I propose to model Markov transition probabilities
in a dynamic discrete choice framework. Additionally, I bring to bear data from a
novel voter panel study that is less prone to measurement error than vote recall items
in cross-sectional studies and which allows us to test more observable implications.
3
Theory
The Europe Matters literature (Hobolt and Spoon 2012; Hobolt and Wittrock 2011;
Hobolt, Spoon, and Tilley 2009) argues from a two-dimensional spatial voting model
(Downs 1957; Enelow and Hinich 1984; Hinich and Munger 1997). Spatial voting
theory sees voters as seeking to minimize policy distance on the relevant policy
dimensions when choosing parties. The central proposition of the the Europe Mat-
ters argument is that voters use different issue spaces in General National and EP
elections, they “recalibrate” the issue space to fit the electoral arena in which a par-
ticular election takes place (Marsh and Mikhaylov 2010, 13). More precisely, it does
not propose that voters base their spatial evaluations on different dimensions, only
that voters change the emphasis they assign to the policy dimensions. The relevant
dimensions in both General National and EP elections is thought to be a general
left-right dimension, which captures considerations related to domestic issues, and
the European integration dimension, which captures considerations related to Euro-
pean issues. The spatial utility of voter i to vote for party j that follows from the
Europe Matters argument is
Uij = −βeu(pjeu − vieu)2 − βlr(pjlr− vilr
)2],
where pj is the party’s position, and v the voter’s ideal point, on the EU integra-
tion (subscript eu) and the left-right dimension (subscript lr). The β’s express the
importance, or salience, that distances on the left-right and EU dimension have in
the policy voting rationale of the voter.
The Europe Matters argument boils down to the proposition that βeu increases
relative to βlr in EP elections, compared to voting in General National elections.
Voters put higher emphasis on EU issues when voting in EP election than in national
elections.11This proposition has not been throughly tested empirically. While a test is crucially important,
it constitutes a self-sufficient research question which I shall pursue in a different part of mydisseration.
4
●
●
●
V
P1
P2
Left − Right
EU
inte
grat
ion
(+/−
)
●
●
●
Vi
P1
P2
Left − Right
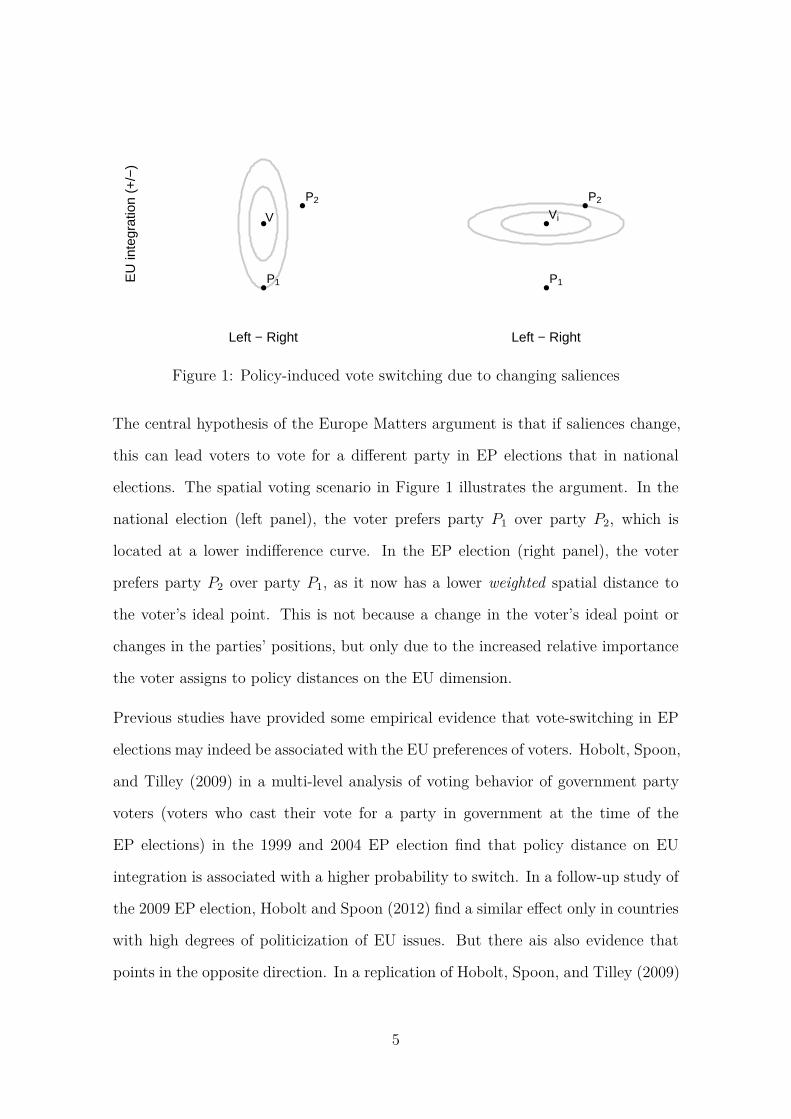
Figure 1: Policy-induced vote switching due to changing saliences
The central hypothesis of the Europe Matters argument is that if saliences change,
this can lead voters to vote for a different party in EP elections that in national
elections. The spatial voting scenario in Figure 1 illustrates the argument. In the
national election (left panel), the voter prefers party P1 over party P2, which is
located at a lower indifference curve. In the EP election (right panel), the voter
prefers party P2 over party P1, as it now has a lower weighted spatial distance to
the voter’s ideal point. This is not because a change in the voter’s ideal point or
changes in the parties’ positions, but only due to the increased relative importance
the voter assigns to policy distances on the EU dimension.
Previous studies have provided some empirical evidence that vote-switching in EP
elections may indeed be associated with the EU preferences of voters. Hobolt, Spoon,
and Tilley (2009) in a multi-level analysis of voting behavior of government party
voters (voters who cast their vote for a party in government at the time of the
EP elections) in the 1999 and 2004 EP election find that policy distance on EU
integration is associated with a higher probability to switch. In a follow-up study of
the 2009 EP election, Hobolt and Spoon (2012) find a similar effect only in countries
with high degrees of politicization of EU issues. But there ais also evidence that
points in the opposite direction. In a replication of Hobolt, Spoon, and Tilley (2009)
5

that uses rescaled voter and party positions on the left-right dimension, Lo, Proksch,
and Gschwend (2013) find no significant effect of distance on the EU dimension.
While a proportion of the variance of the findings might certainly be attributable
to data and measurement problems, I think that there are more basic theoretical
problems with the employed research designs. First and foremost, the observable
implication that has been tested by all these studies, that the likelihood of vote
switching increases with increasing ideological distance from the party of origin, does
not directly follow from spatial theory. This is certainly known to all the authors,
and was to some degree acknowledged. As Hobolt, Spoon, and Tilley (2009, 98)
point out “defection on the basis of issue voting requires that another party offers a
position closer to the voter’s ideal point”.
Figure 2 illustrate the problem. In a one-dimensional setup, voter V having voted
for P1 in the previous election will switch his vote to P2 to maximize utility (left
panel). But the opposite might also be the case, if there is no better alternative
than party P1 (right panel). In one case our prediction would have been correct, in
the second incorrect.
In a two-dimensional policy space (Figure 2), we can see that our prediction of
switching do not only hinge on the positions choice alternatives take on one dimen-
sion. In the two scenarios P2 has the same position on EU integration, but takes
different positions on left-right. While we correctly predict a switch in the left panel,
we will not in the right panel. Here, the policy alternative is too rightist to induce
a switch. The voter has to sacrifice too much in terms of closeness on the left-right
dimension to obtain a closer match on the EU integration dimension. Even more
than in the one-dimensional model, the switching prediction stands and falls with
the position of choice alternatives.
These illustration show that vote switching is inherently dependent on the character-
istics of available alternatives. Modeling policy-motivated switching without taking
6

●● ●
VP1 P2
EU integration (+/−)
Util
ity
●●●
VP1P2
EU integration (+/−)
●
●
●
V
P1
P2
Left − Right
EU
inte
grat
ion
(+/−
)
●
●
●
Vi
P1
P2
Left − Right
Figure 2: Counterexamples: Correct switching predictions (left panel), incorrectswitching predictions (right panel)
into account the choices offered in a specific choice situation amounts to an incom-
plete spatial model, which undermines the stringency of the observable implications
we seek to test. As this oversimplification certainly reduces the accuracy of our
predictions, it may also lead us to systematically under- or overestimate the effect
of policy distances on differential voting behavior.
How can we improve? I reexamine the process we call vote switching from the ground
up and propose an alternative modeling strategy. This strategy will allow for a more
accurate test of policy-induced vote switching that is based on a complete spatial
model that takes into account the characteristics of available policy alternatives.
A Markov transition model of vote choice dynamics
Given survey data which records the vote choices of respondents in two subsequent
elections, a frequency cross-table of vote choices in the first and second election
summarizes the observed voting sequences.
7
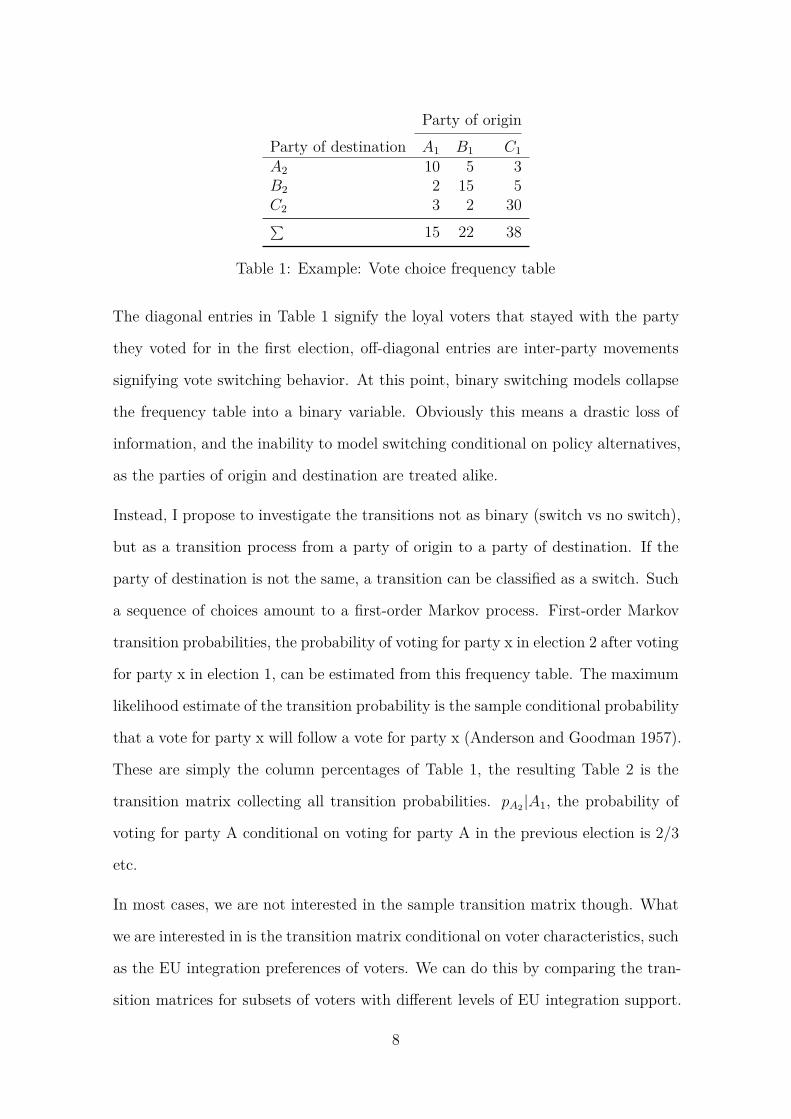
Party of originParty of destination A1 B1 C1A2 10 5 3B2 2 15 5C2 3 2 30∑ 15 22 38
Table 1: Example: Vote choice frequency table
The diagonal entries in Table 1 signify the loyal voters that stayed with the party
they voted for in the first election, off-diagonal entries are inter-party movements
signifying vote switching behavior. At this point, binary switching models collapse
the frequency table into a binary variable. Obviously this means a drastic loss of
information, and the inability to model switching conditional on policy alternatives,
as the parties of origin and destination are treated alike.
Instead, I propose to investigate the transitions not as binary (switch vs no switch),
but as a transition process from a party of origin to a party of destination. If the
party of destination is not the same, a transition can be classified as a switch. Such
a sequence of choices amount to a first-order Markov process. First-order Markov
transition probabilities, the probability of voting for party x in election 2 after voting
for party x in election 1, can be estimated from this frequency table. The maximum
likelihood estimate of the transition probability is the sample conditional probability
that a vote for party x will follow a vote for party x (Anderson and Goodman 1957).
These are simply the column percentages of Table 1, the resulting Table 2 is the
transition matrix collecting all transition probabilities. pA2 |A1, the probability of
voting for party A conditional on voting for party A in the previous election is 2/3
etc.
In most cases, we are not interested in the sample transition matrix though. What
we are interested in is the transition matrix conditional on voter characteristics, such
as the EU integration preferences of voters. We can do this by comparing the tran-
sition matrices for subsets of voters with different levels of EU integration support.
8

Party of originParty of destination A1 B1 C1A2 0.67 0.23 0.08B2 0.13 0.68 0.13C2 0.20 0.09 0.79
Table 2: Example: Sample transition matrix
In effect, we calculate the transition matrices for subsets of the sample, each subset
containing only voters with a specific EU self-placement. Such a bivariate inves-
tigation would yield unbiased estimates of the association between EU preferences
and transition probabilities only if EU preferences were unrelated to other factors
influencing transition probabilities. This is certainly not the case given the spatial
voting model, which posits that vote choice is a function of the policy preferences
not only on EU issues, but on left-right issues as well. Further subsetting based on
left-right preferences is not a viable strategy due to data constraints. Very quickly
there are simply not enough data points left in most cells of the transition frequency
tables to be able to make statistically reliable inferences.
A solution I shall pursue in this paper is to employ a parametric model that allows
for the expression of transition probabilities as a function of voter characteristics.
Such models have been developed in the 1980s in biometrics (Muenz and Rubinstein
1985) and econometrics (Keane 2013 for an overview), but are less known in the
political science profession, with a few exceptions such as (Epstein et al. 2006).
Referred to as Markov transition or panel discrete choice models, these models can
be readily employed for the analysis of voting dynamics. The first part of such a
model is a random-utility model, that captures the effect of choice- or individual-
specific attributes on party choice. Dynamics are introduced by allowing for state-
dependence, i.e. that the probability of choosing a particular party is dependent on
the choice made on the previous occasion. The typical structure of a panel data
discrete choice model can be described as follows. The utility of i to vote for party
j at time t is specified is
9

Uij,t = αj + Xiβj + Zijγ + ωjyij,t−1 + ϵij,
where αj is a party-specific constant, Xi is a matrix of individual-specific covariates
with choice-specific parameter vector βj, Zij is a matrix of choice-specific covariates,
with effect parameter vector γ. yij,t−1 is a variable that takes the value of 1 if voter i
voted for party j in the previous election, and 0 otherwise. Note that the parameter
ω varies over j, which allows for different state dependence given different previous
vote choices. This captures the notion that it matters which particular party is the
party of origin. If state dependence has a positive effect, voters receive additional
utility for voting for the same party again, if the effect of state dependence is negative,
voting for the same party yields lower utility and voter i is more inclined to vote-
switching, as other parties gain utility relative to the party voted for in previous
election. However, it is well established that such a “lagged dependent variable”
specification will not only capture “true” state dependence, e.g. due to voter loyalty,
but also unobserved factors, that affect both the vote choice in the European election
and vote choice in the past national election. This has been referred to a ‘spurious’
state dependence (Heckman 1981). While a multitude of sophisticated statistical
models have been developed to disentangle true from spurious state dependence
(see e.g. Erdem 1996), this paper shall remain agnostic to this question.2 That
the lagged dependent variable will ultimately captures spurious state dependence
is of no primary concern for my analysis. Where state dependence comes from is
unimportant insofar as only its presence is relevant to explain why voters switch or
not. Moreover, controlling for unobserved factors that co-determine vote choice in
both elections is a positive property of this specification.
Assuming the i.i.d. error-term ϵ to be distributed Type-1 extreme value, the model
amounts to a hybrid multinomial-conditional logit model (McFadden 1973). Col-
lecting the terms of the utility functions in Vij, the choice probability of voter i for2In order to control for unobserved factors and heterogeneity, random effect specifications are
commonly employed, which seem futile in the present case, which includes only two panel waves.
10

party j is given by Pr(Yij = 1) = eVij∑J
j=1 eVij. Parameter estimates are obtained by
maximizing log-Likelihood w.r.t. the parameters βj, γ and ωj.3
How is the proposed model related to transition probabilities, and therefore vote
switching? Imagine a very basic model that includes only party-intercepts αj and
state-dependence terms ωyij,t−1. We can obtain each cell entry of the transition
matrix by inserting the estimated coefficients into the multinomial logit function.
pA2 |A1, a vote for party A given a vote for party A in the previous election is
eα1+ωj∗1/∑J
j=1 eαj+ωj∗yj,t−1 , etc. If we make vote choice utility also dependent on
other variables, we can calculate the transition matrix for each combination of vari-
able values. The effect of independent variables on vote switching can then be
gauged by comparing the diagonals (loyal voters) and off-diagonals (switchers) of
these transition matrices.
In line with canonical multi-party spatial voting models, I specify Zijγ as the sum of
squared euclidean policy distance on the EU integration and left-right dimensions:
γEU(pjeu − vieu)2 + γLR(pjlr− vilr
)2]. Note that, in line with spatial theory, γEU and
γLR are modeled as parameters that are homogeneous in the population, meaning
that every voter uses the same parameter to evaluate every party on EU integration
issues, and the same parameter to evaluate them on left-right issues. Additionally, I
control for the partisan identity of the voters, as partisan voters should be suspected
to exhibit a much higher state dependence than, and are more likely to vote for their
preferred party per se. I include partisanship as a choice-specific covariate that takes
the value of 1 if voter i identifies with partyj, and 0 otherwise.
Empirical analysis
I employ a novel voter panel study that is extremely well suited to study the research
question at hand. The study was conducted in the German state of Bavaria as a part3Using the mlogit R package (Croissant n.d.; Henningsen and Toomet 2010)
11
of the Making Electoral Democracy Work project (MEDW) (Blais 2010). The panel
covered the 2013 State and Federal election, as well as the 2014 European election
and thereby constitutes a unique opportunity to study voting behavior of the same
individuals in successive elections at different levels of government. The MEDW
Bavaria Panel was administered by the polling firm Harris Decima in cooperation
with Infratest Dimap, and conducted as an online survey for which respondents
were recruited offline. Respondents were surveyed in the week before and after each
election, all in all five times.4 The sample to be used for the analysis includes the 2984
respondents that participated in the last three panel waves, the post-election wave
for the Federal election and the pre- and post waves for the European elections. Past
voting behavior is inferred from recalled list tier vote choice in the Federal election
recorded in the third panel wave, EP voting behavior from recalled vote choice in the
fifth wave. For the purpose of studying vote-switching, I further restrict the sample
of respondents. Excluded are respondents that did not report to have participated
in both of the elections, or reported not to have voted for one of eight following
parties: CSU, SPD, Greens, Free Voters, FDP, Left, Pirate Party and AfD.5
Table 1 shows the vote choices reported by respondents in the sample to be analyzed.
Of the 1380 respondents who report to have voted in both elections, about one third
(472) report to have voted for a different party in the EP election than in the Federal
election. This is a considerable amount, given the short time span between the two
elections. The biggest gain in votes compared to the Federal election can be observed
for the AfD, as it nearly doubled its vote share. The largest net gain for the AfD
came from former CSU voters, but net gains were obtained also from all other parties.
The strong result of the AfD is also due to its very low desertion rate. Only around
11 percent switched away from the AfD, which is well below the desertion rate of4Since the Federal election took place only one week after the State election, the second panel
wave combined a post-election survey for the State election, and a pre-election survey for theFederal election.
5Respondents received the same set of parties, in the same order, in each survey wave. Otheritems in the survey questions measuring voting behavior were “Other party”, “Wasted vote” and“Don’t”.
12

all other parties (e.g. CSU: 26%, SPD: 32%).
13

Federal\EP CSU SPD Greens FW AfD FDP Left Pirates Total
CSU 440 49 21 21 48 13 3 1 596
SPD 21 182 33 6 14 0 9 2 267
Greens 12 44 96 6 2 2 2 2 166
FW 21 9 6 41 6 3 4 1 91
AfD 7 0 0 2 79 0 0 1 89
FDP 35 8 2 2 11 27 0 1 86
Left 4 9 3 1 13 0 35 0 65
Pirates 3 2 2 0 3 1 1 8 20
Total 543 303 163 79 176 46 54 16 1380
Table 3: Vote choices in the 2013 Federal election and 2014 European election.
In turn, the strong increase for the AfD means that most other parties lost votes,
only the SPD was also able to slightly improve its result among the respondents
by net gains from former CSU and Green voters. The switching behavior of former
FDP voters requires specific attention. With a desertion rate of 68 percent, and
receiving only little in return, it lost nearly half of its vote share since the Federal
election. On the one hand, the strong net loss towards the CSU may be, at least
partially, explained by the return of CSU supporters that had cast a strategic vote
for the FDP in the Federal election. On the other hand, realignment processes after
the FDP had failed to gain parliamentary representation in the federal election may
also explain why the FDP was deserted by many of its voters.
To investigate the influence of preferences on respondent vote choice I rely on es-
tablished measures of preferences towards European integration and an ideological
14
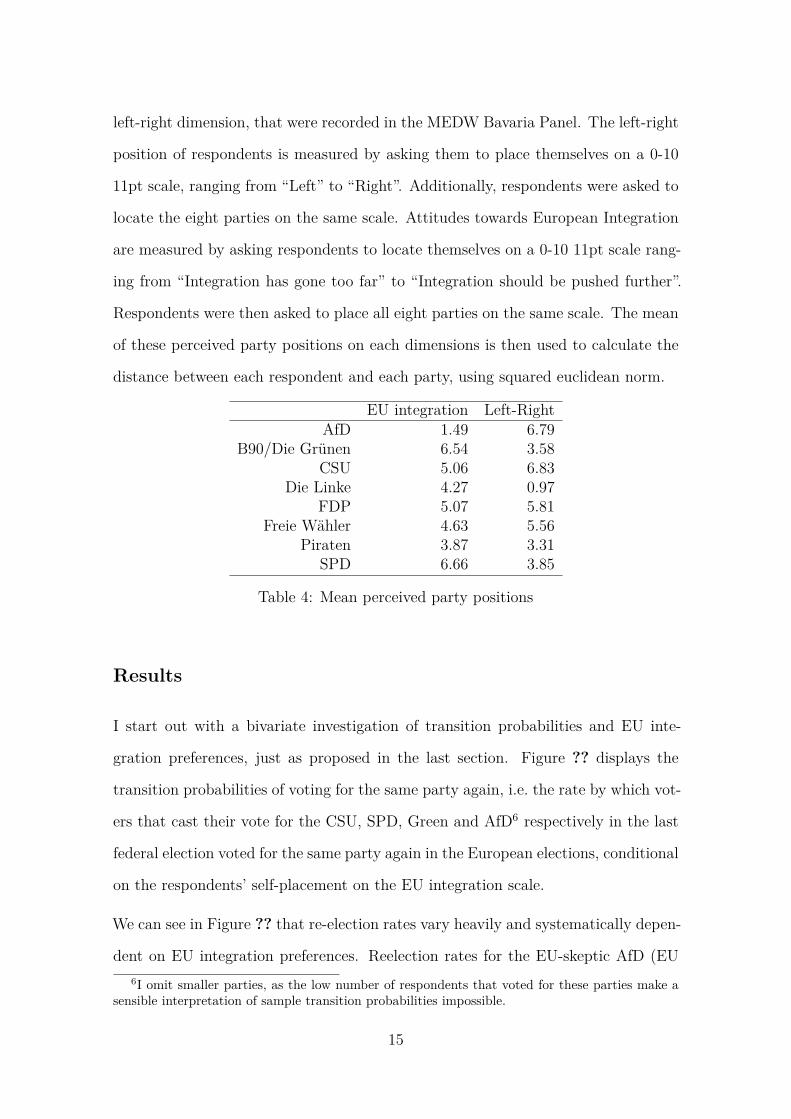
left-right dimension, that were recorded in the MEDW Bavaria Panel. The left-right
position of respondents is measured by asking them to place themselves on a 0-10
11pt scale, ranging from “Left” to “Right”. Additionally, respondents were asked to
locate the eight parties on the same scale. Attitudes towards European Integration
are measured by asking respondents to locate themselves on a 0-10 11pt scale rang-
ing from “Integration has gone too far” to “Integration should be pushed further”.
Respondents were then asked to place all eight parties on the same scale. The mean
of these perceived party positions on each dimensions is then used to calculate the
distance between each respondent and each party, using squared euclidean norm.
EU integration Left-RightAfD 1.49 6.79
B90/Die Grünen 6.54 3.58CSU 5.06 6.83
Die Linke 4.27 0.97FDP 5.07 5.81
Freie Wähler 4.63 5.56Piraten 3.87 3.31
SPD 6.66 3.85
Table 4: Mean perceived party positions
Results
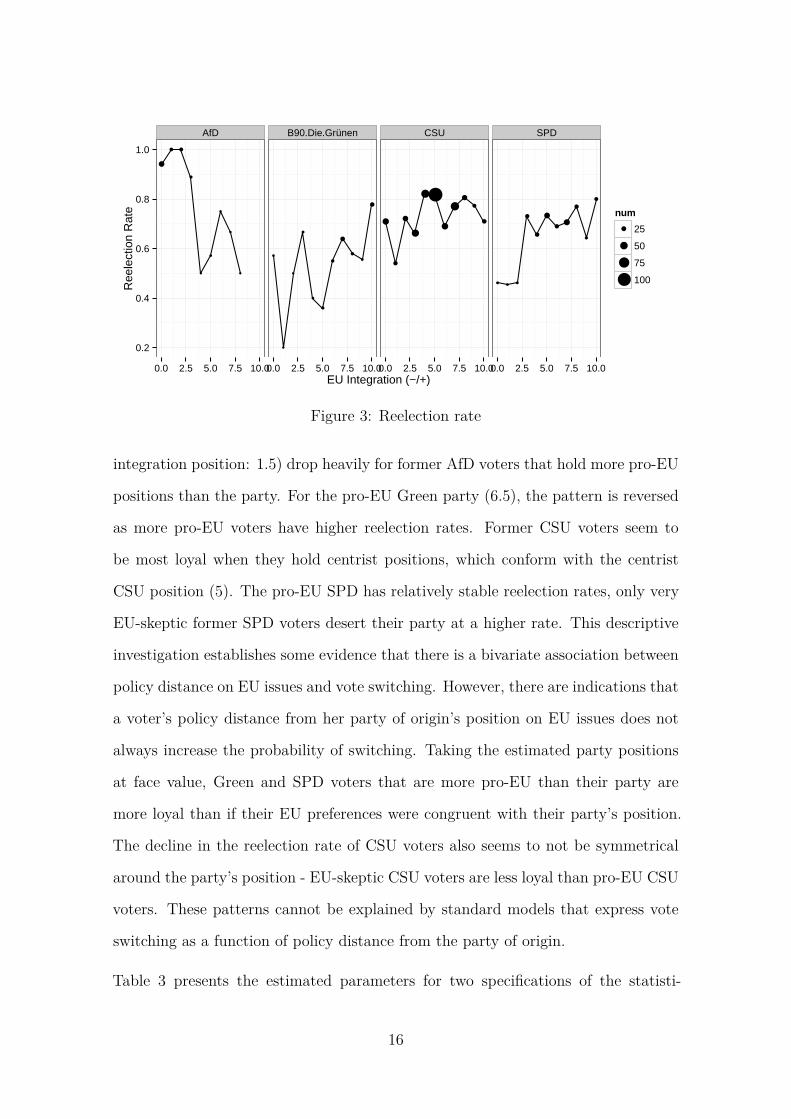
I start out with a bivariate investigation of transition probabilities and EU inte-
gration preferences, just as proposed in the last section. Figure ?? displays the
transition probabilities of voting for the same party again, i.e. the rate by which vot-
ers that cast their vote for the CSU, SPD, Green and AfD6 respectively in the last
federal election voted for the same party again in the European elections, conditional
on the respondents’ self-placement on the EU integration scale.
We can see in Figure ?? that re-election rates vary heavily and systematically depen-
dent on EU integration preferences. Reelection rates for the EU-skeptic AfD (EU6I omit smaller parties, as the low number of respondents that voted for these parties make a
sensible interpretation of sample transition probabilities impossible.
15
AfD B90.Die.Grünen CSU SPD
●
● ●
●
●
●
●
●
●
●
●
●
●
●
●
●
●
●
●
●
●
●
●
●
●●
●
●●
●
●
●●
●
●
●
●
●●
●
●
●
0.2
0.4
0.6
0.8
1.0
0.0 2.5 5.0 7.5 10.00.0 2.5 5.0 7.5 10.00.0 2.5 5.0 7.5 10.00.0 2.5 5.0 7.5 10.0EU Integration (−/+)
Ree
lect
ion
Rat
e num
●
●
●
●
25
50
75
100
Figure 3: Reelection rate
integration position: 1.5) drop heavily for former AfD voters that hold more pro-EU
positions than the party. For the pro-EU Green party (6.5), the pattern is reversed
as more pro-EU voters have higher reelection rates. Former CSU voters seem to
be most loyal when they hold centrist positions, which conform with the centrist
CSU position (5). The pro-EU SPD has relatively stable reelection rates, only very
EU-skeptic former SPD voters desert their party at a higher rate. This descriptive
investigation establishes some evidence that there is a bivariate association between
policy distance on EU issues and vote switching. However, there are indications that
a voter’s policy distance from her party of origin’s position on EU issues does not
always increase the probability of switching. Taking the estimated party positions
at face value, Green and SPD voters that are more pro-EU than their party are
more loyal than if their EU preferences were congruent with their party’s position.
The decline in the reelection rate of CSU voters also seems to not be symmetrical
around the party’s position - EU-skeptic CSU voters are less loyal than pro-EU CSU
voters. These patterns cannot be explained by standard models that express vote
switching as a function of policy distance from the party of origin.
Table 3 presents the estimated parameters for two specifications of the statisti-
16

Table 5
Dependent variable:Vote choice (Yt)
(1) (2)(DistanceLR)2 −0.066 −0.070
(0.008) (0.008)(DistanceEU)2 −0.051 −0.053
(0.005) (0.005)PIDt−1 1.083 1.050
(0.103) (0.105)Yt−1 = 1 1.245 1.294
(0.164) (0.166)Yt−1 (AfD) 1.795 1.765
(0.437) (0.440)Yt−1 (B90/Die Grünen) 0.218 0.120
(0.284) (0.290)Yt−1 (Die Linke) 1.547 1.598
(0.405) (0.427)Yt−1 (FDP) 1.013 0.945
(0.392) (0.401)Yt−1 (Freie Wähler) 1.094 0.987
(0.336) (0.339)Yt−1 (Piraten) 2.328 2.247
(0.632) (0.658)Yt−1 (SPD) −0.114 −0.100
(0.264) (0.270)j Intercepts Yes Yesj Education No Yesj Age No Yesj Female No YesObservations 1,380 1,380Log Likelihood −1,426.283 −1,392.944
Note: ∗p<0.1; ∗∗p<0.05; ∗∗∗p<0.01
17

cal model of vote choice in the EP election. The first model consists of the two-
dimensional squared distance between voter and party, the party identification in-
dicator, and the lagged choice variable that capture state dependence, which is 1 if
the respondent has cast her vote for that party in the Federal election. To allow for
party-specific effects of state dependence for all parties, the lagged choice variable
appears in both the choice-specific, multinomial part as well as in the conditional
part of the equation. This is because choice-specific effects for one choice, the ref-
erence party (in both models the CSU), has to be set to zero in order to identify
the model. As it would be a failure to assume the state-dependence for former CSU
voters to be zero, Yt−1 is introduced in the conditional part of the model to cap-
ture the state dependence effect for the CSU. Accordingly, the choice-specific state
dependence effects for the remaining parties have to be interpreted relative to the
coefficient for Yt−1. While both models include choice-specific intercepts, only the
second model includes socio-demographic control variables such as the education,
age and gender of the respondent.
As expected, party identification is a good predictor of vote choice in EP election.
Having identified with a party at the Federal elections is associated with a much
higher probability to vote for the same party again in the European election.
The estimated coefficients for the squared distance on the left-right and the squared
distance on the EU integration dimensions indicate that increases in the distance
between a voter and a particular party on both dimensions decrease the probability
that the voter casts her vote for that party. Distances on the left-right dimension
have a slightly larger effect than distances on the EU integration dimension, which
indicates that voters assign a higher importance to where parties are located on the
left-right dimension than to party positions in the European Integration dimension.
Nevertheless, where a party positions itself on the EU integration dimension plays
a substantive role in explaining vote choice in the 2014 Bavarian EP election.
18

Although the estimation results have established that attitudes towards European
Integration matters when Bavarian voters choose parties in EP election, the mere
estimated parameters tells us little about the impact of these on vote switching be-
havior. A voter should only be expected to switch to another party if the additional
utility received by voting for that party is larger than the state dependence term.
As effects of state dependence are party-specific, an interpretation can help to get
a first impression on their effect on vote switching probabilities. Yt−1 captures the
effect of state dependence for former CSU voters, and state dependence effects of
other parties have to be interpreted relative to it. Yt−1 is strongly positive. This
was expected since the lagged choice specification also captures spurious state de-
pendence due to time-constant unobserved factors, that determine vote choice for
a particular party in both elections. The effect of state dependence for CSU voters
is very much similar to that of SPD and Green voters, as their coefficients are not
significantly different from zero. In contrast, voters of other, smaller parties (AfD,
Left, FDP, Free Voters, Pirates) exhibit a stronger loyalty to their parties as their
state dependence estimates are larger than zero. This is largely in line with the ex-
pected second-order effects. Voters that voted for government parties (CSU, SPD)
are more likely to desert their parties, and smaller parties have it easier to hold their
voters.
In order to analyzing the marginal effect of distances on the EU integration dimen-
sion on voting switching, we need to take into account the specific constellation of
parties in the choice situation. Voters are faced with a choice situation where there
is only a finite number of electable parties available. Each party occupies a unique,
fixed policy positions on the left-right and EU integration dimension. Dependent of
the party constellations, voters should be thought to often have to engage in a utility
trade-off between distances on the two dimensions. A party that is closer on the
EU integration dimension will most likely be more distant on the left-right dimen-
19

sion than the party of origin.7 Therefore the probability to vote-switch ultimately
depends on a voter’s specific two-dimensional ideal point, relative to the positions
of available parties. In order to vote-switch, an alternative has to be available that
is closer on the EU integration dimension, but is at the same time not too distant
on the left-right dimension. Apart from the specific constellation of voter and par-
ties, the probability to vote for a particular party is also determined by the state
dependence of the party of origin. State dependence varies over parties, as voters of
different parties are estimated to exhibit different degrees of loyalty to their parties
of origin. The proclivity of a voter to switch depends therefore on which party is
the party of origin.
That vote-switching intimately depends on a voter’s party of origin, its position and
the availability of viable parties of destination means that vote switching has to
be studied in specific situations. Only given a specific situation, or scenario, can
we hope to get a realistic picture of how attitudes of European Integration shape
vote switching behavior in EP elections. One suitable way to study the predictions
the estimated model makes are simulation techniques proposed by King, Tomz, and
Wittenberg (2000). Given a scenario and parameter estimates, the probability of
voting for each available party is calculated. Estimation uncertainty is incorporated
by doing this repeatedly for a large number of random draws from the joint sampling
distribution of the parameter estimates.
The first set of scenarios to be analyzed using this simulation approach represents
a former CSU voter, who holds the same position as the CSU on the left-right di-
mension (6.8).8 To study the impact of distances on the EU integration dimensions
on voting probabilities, the voter’s position is varied over the range of the EU in-
tegration scale. Given the voter positions, for each scenario the distances to all7Or else the question arises why the voter hasn’t voted for that particular party already in past
elections.8The hypothetical voter is further assumed to have no party identification. Other covariates
are set a their population mean.
20

0.0
0.2
0.4
0.6
0.0 2.5 5.0 7.5 10.0Voter position on EU integration (neg −> pos)
Pr(
EP
Vot
e)
party
AfD
B90/Die Grünen
CSU
SPD
Predicted voting probabilities of former CSU voter
Figure 4: Transition probabilites for former CSU voters
available parties is re-calculated. Figure 2 presents the mean predicted transition
probabilities and 95% confidence intervals for former CSU voters.
The CSU-CSU transition probability, i.e. the probability of such a voter to vote
again for the CSU, is highest if the hypothetical voter’s position on the EU inte-
gration dimension is congruent with the position the CSU holds on that dimension
(5.05). The switching probability (1-CSU-CSU transition probability) increases for
Euroskeptic CSU voters from around 30 to around 50 percent as the AfD becomes
more attractive to these voters due to its Euroskeptic position (1.5). At the extreme,
a CSU voter is estimated to switch to the AfD with a probability of around 40 per-
cent. That the AfD becomes a viable destination for Euroskeptic CSU voters is also
due to the fact that both parties hold similar positions on the left-right dimension:
CSU voters do not have to “sacrifice” proximity on the left-right dimension to vote
for Euroskeptic positions. Distances on the European Integration dimension that
point in the other direction however do not strongly influence the vote-switching
21

0.0
0.2
0.4
0.6
0.8
0.0 2.5 5.0 7.5 10.0Voter position on EU integration (neg −> pos)
Pr(
EP
Vot
e)
party
AfD
CSU
Die Linke
SPD
Predicted voting probabilities of former SPD voter
Figure 5: Transition probabilites for former SPD voters
behavior of former CSU voters. A former CSU voter that is more pro-European in-
tegration than her party is estimated to remain rather loyal to her party. Although
the most pro-European parties SPD and Greens become more attractive as destina-
tions, the probability of voting for the CSU is largely unaffected for pro-European
voters. Pro-European CSU voter remain loyal, because closer proximity on the EU
dimension does not compensate sufficiently for the fact that these parties hold more
leftist positions.
Positions of EU integration have a different effect on the vote switching proclivity
of former SPD voters, as depicted in Figure 3.9 The SPD is perceived to hold the
most pro-European position (6.6), which in turn means that pro-European SPD
voters are especially likely to remain loyal. The probability of vote switching of a
very pro-European former SPD voter is estimated at only around 25 percent. The
vote switching probability quickly rises for more Eurosceptic voter positions. A9The voter’s left-right position is set at 3.8, the mean placement of the SPD.
22
0.00
0.25
0.50
0.75
1.00
0.0 2.5 5.0 7.5 10.0Voter position on EU integration (neg −> pos)
Pr(
EP
Vot
e)
party
AfD
CSU
FDP
SPD
Predicted voting probabilities of former AfD voter
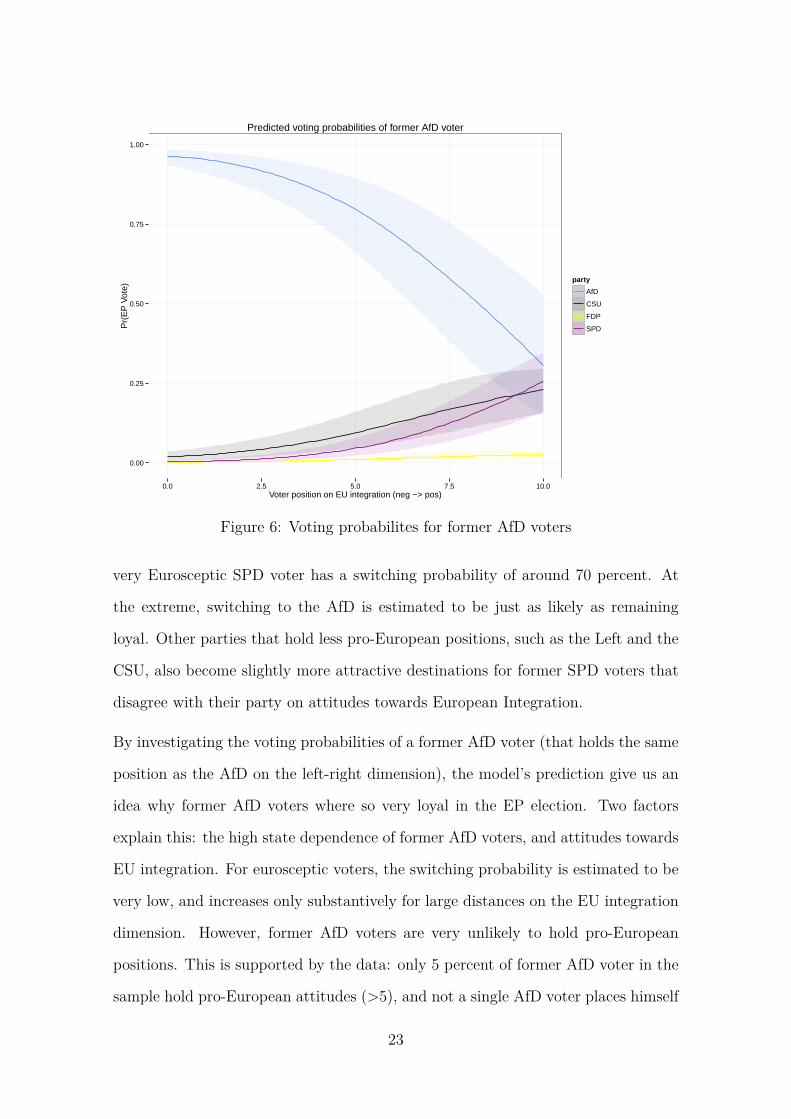
Figure 6: Voting probabilites for former AfD voters
very Eurosceptic SPD voter has a switching probability of around 70 percent. At
the extreme, switching to the AfD is estimated to be just as likely as remaining
loyal. Other parties that hold less pro-European positions, such as the Left and the
CSU, also become slightly more attractive destinations for former SPD voters that
disagree with their party on attitudes towards European Integration.
By investigating the voting probabilities of a former AfD voter (that holds the same
position as the AfD on the left-right dimension), the model’s prediction give us an
idea why former AfD voters where so very loyal in the EP election. Two factors
explain this: the high state dependence of former AfD voters, and attitudes towards
EU integration. For eurosceptic voters, the switching probability is estimated to be
very low, and increases only substantively for large distances on the EU integration
dimension. However, former AfD voters are very unlikely to hold pro-European
positions. This is supported by the data: only 5 percent of former AfD voter in the
sample hold pro-European attitudes (>5), and not a single AfD voter places himself
23

at the far end of the scale (>7). The predictions the model makes for extremely
pro-European former AfD voters are therefore only hypothetical. That most former
AfD voters hold Eurosceptic positions contributes to the high degree of loyalty of
AfD voters in the EP election.
Conclusion
This paper has studied the impact of policy preferences on European integration on
vote switching across the Federal and EP elections in the German state of Bavaria.
The main finding is that contrary the second-order interpretation, preferences spe-
cific to the context of the second-order election, namely preferences about European
Integration, play a significant role in explaining for which party Bavarian voters
cast their vote. However, the paper also suggests that EU integration preferences
increase the likelihood of vote switching only if viable alternatives are available.
Alternatives are only viable if they hold positions on the first-order dimension of
political conflict, the left-right dimension, that differ not too much from the voter’s
preferences on that dimension. For example, while eurosceptic and rightist former
CSU voters have a larger probability to switch to the eurosceptic rightist AfD, pro-
European rightist CSU are less likely to switch since the pro-European parties SPD
and Greens are leftist parties. In consequence, this means that vote-switching due
to EU preferences might play out very differently not only in different party systems,
but also for voters within the same electorate. The likelihood of switching intimately
depends on the constellation of parties in the political space, relative to voter ideal
points.
This finding calls into question the way in which vote-switching has been studied so
far. Research designs that rely on broad categorizations of voting behavior and do
not account for the characteristics of the parties that stand for election run the risk
of missing crucial parts of the story. The research design and model presented in
24
this paper can help to surmount many of the difficulties of studying voting behavior
in consecutive elections in different electoral arenas. The simple model used in
this paper can be easily extended to include other aspect of dynamic voting, and
to rule out alternative explanations of why some voters vote for different parties
in different elections. For example, realignment processes can be controlled for by
including lagged policy preferences in the model. While this model has accounted
for second-order factors by party-specific intercepts and state dependence, these
factors may also be modeled explicitly. Most promising seems extending the model
to include non-voting, which has so far been studied separately from switching. This
could for example be accomplished by introducing a nested structure in the model.
25
References
Anderson, T. W., and Leo A. Goodman. 1957. “Statistical Inference about Markov
Chains.” The annals of mathematical statistics 28: 89–110.
Blais, André. 2010. “Making Electoral Democracy Work.” Electoral Studies 29(1):
169–170.
Clark, Nick, and Robert Rohrschneider. 2009. “Second‐Order Elections versus
First‐Order Thinking: How Voters Perceive the Representation Process in a
Multi‐Layered System of Governance.” Journal of European Integration 31(5):
645–664.
Croissant, Yves. “Estimation of multinomial logit models in R: The mlogit Package.”
Downs, Anthony. 1957. “An Economic Theory of Political Action in a Democracy.”
Journal of Political Economy 65(2): 135–150.
Enelow, James M., and Melvin J. Hinich. 1984. The Spatial Theory of Voting: An
Introduction. New York: Cambridge University Press.
Epstein, David L. et al. 2006. “Democratic Transitions.” American Journal of
Political Science 50(3): 551–569.
Erdem, Tülin. 1996. “A Dynamic Analysis of Market Structure Based on Panel
Data.” Marketing Science 15(4): 359–378.
Heckman, James J. 1981. “Statistical models for discrete panel data.” In Structural
analysis of discrete data with econometric applications, eds. Charles F. Manski and
Daniel McFadden. MIT Press.
Henningsen, Arne, and Ott Toomet. 2010. “maxLik: A package for maximum
likelihood estimation in R.” Computational Statistics 26(3): 443–458.
Hinich, Melvin J., and Michael C. Munger. 1997. Analytical Politics. Cambridge,
New York, Melbourne: Cambridge Univ. Press.
26

Hix, Simon et al. 2007. “Punishment or Protest? Understanding European Parlia-
ment Elections.” The Journal of Politics 69(2): 495–510.
Hobolt, Sara B., and Jae-Jae Spoon. 2012. “Motivating the European voter: Par-
ties, issues and campaigns in European Parliament elections.” European Journal of
Political Research 51(6): 701–727.
Hobolt, Sara B., Jae-Jae Spoon, and James Tilley. 2009. “A Vote Against Europe?
Explaining Defection at the 1999 and 2004 European Parliament Elections.” British
Journal of Political Science 39(01): 93–115.
Hobolt, Sara Binzer, and Jill Wittrock. 2011. “The second-order election model
revisited: An experimental test of vote choices in European Parliament elections.”
Electoral Studies 30(1): 29–40.
Keane, Michael P. 2013. “Panel Data Discrete Choice Models of Consumer Demand.”
Working Papers.
King, Gary, Michael Tomz, and Jason Wittenberg. 2000. “Making the Most of
Statistical Analyses: Improving Interpretation and Presentation.” American Journal
of Political Science 44(2): 347.
Lo, James, Sven-Oliver Proksch, and Thomas Gschwend. 2013. “A Common Left-
Right Scale for Voters and Parties in Europe.” Political Analysis 22(2): 205–223.
Marsh, Michael. 2007. “European Parliament elections and losses by governing
parties.” In European elections & domestic politics: Lessons from the past and
scenarios for the future, eds. Wouter van der Brug, Cees van der Eijk, and Mark
Franklin. Notre Dame: University of Notre Dame Press, p. 51–73.
Marsh, Michael, and Slava Mikhaylov. 2010. “European Parliament elections and
EU governance.” Living Reviews in European Governance 5(4): 1–30.
McFadden, Daniel. 1973. “Conditional logit analysis of qualitative choice behavior.”
Muenz, L R, and L V Rubinstein. 1985. “Markov models for covariate dependence
27

of binary sequences.” Biometrics 41(1): 91–101.
Reif, Karlheinz. 1997. “European elections as member state second-order elections
revisited.” European Journal of Political Research 31: 115–124.
Reif, Karlheinz, and Hermann Schmitt. 1980. “Nine national second-order elections:
A systematic frame-work for the analysis of European elections results.” European
Journal of Political Research 8(1): 3–44.
28