multi-platform remote sensing for the development of roadway feature and characteristic databases...
TRANSCRIPT

Multi-Platform Remote Sensing for the Development of Roadway Feature and Characteristic Databases
Presented toPresented to
FDOT Workshop on FDOT Workshop on Applications of Remote Sensing Technologies for Applications of Remote Sensing Technologies for
Transportation Data Collection Transportation Data Collection
Jacksonville, FloridaJacksonville, FloridaDecember 1-2, 2004December 1-2, 2004
Demin XiongDemin XiongNational Transportation Research CenterNational Transportation Research Center
Oak Ridge National LaboratoryOak Ridge National LaboratoryOak Ridge, Tennessee 37831Oak Ridge, Tennessee 37831
[email protected]@ornl.gov

Presentation OutlinePresentation Outline
1. Introduction2. Project decisions and technical approaches3. Land use classification with satellite
imagery4. Feature extraction with aerial photography5. Signage inventory with mobile mapping6. Data verification and validation7. Conclusions and recommendations
1. Introduction1. Introduction
Project objectives
– Implement integrated remote sensing solutions to develop accurate and comprehensive Roadway Characteristics Inventory
– Assess the practical applicability of the proposed technologies with respect to their effectiveness, accuracy, fitness, and ease of implementation.
– Document implementation procedures, and technical approaches used in the project
– Provide recommendations on the implementation of the technology and feedback to the research and industry communities for future technological enhancement.

1. Introduction1. Introduction
Relevance and Expected Benefits– Roadway Characteristics Inventory (RCI) is critical to
FDOT’s infrastructure management process and represents a major investment of the department
– Although Individual technologies have been evaluated and demonstrated, an comprehensive approach has not been fully investigated previously
– Potential benefits of using an integrated approach include improved time lines, increased data quality, such as accuracy, consistency, and reliability, and enriched data contents.
– Reduce the needs for field data activities, which has been a major concerns for many of the transportation projects that involves field works.
2. Project Decisions and Approaches2. Project Decisions and Approaches
State of Practice Review– General technology trends– Remote sensing applications in FDOT and elsewhere
Project Site Selection– Different types of roads: interstates, arterials, and local
streets. – Different geographic environments: open sky, tree
coverage, and heavily built-up areas, urban versus rural
Data Requirements Review– Roadway Characteristics Inventory – Planning, traffic operations, maintenance, and
environment management
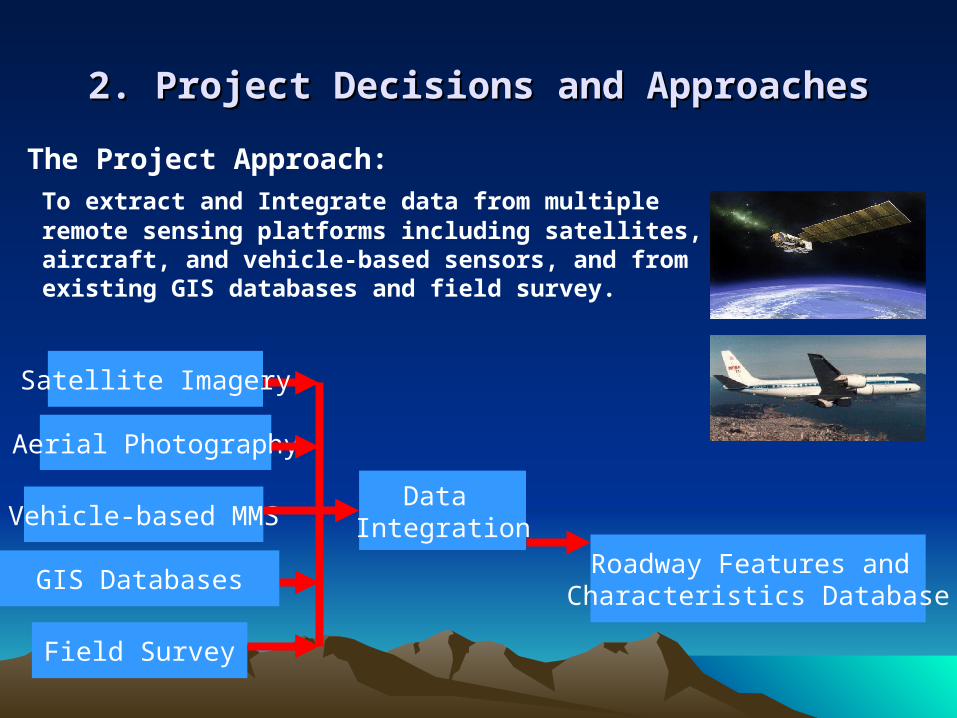
The Project Approach:
To extract and Integrate data from multiple remote sensing platforms including satellites, aircraft, and vehicle-based sensors, and from existing GIS databases and field survey.
2. Project Decisions and Approaches2. Project Decisions and Approaches
Vehicle-based MMSData
Integration
Field Survey
GIS DatabasesRoadway Features and
Characteristics Database
Satellite Imagery
Aerial Photography

3. Land Use Classification with Satellite Imagery3. Land Use Classification with Satellite Imagery
Advantages: • Covers large geographic areas• Can be updated more frequently• Less expensive
Useful:
• Network extraction • Environment management• Land use studies

• IKONOS images were utilized
• One meter res. for panchromatic and 4 meter res. for multispectral
3. Land Use Classification with Satellite Imagery3. Land Use Classification with Satellite Imagery

• USGS Land Use Map were utilized to facilitate the refinement of urban land classification
• GAP Land Cover Map were utilized to facilitate the refinement of vegetation classes
• Land use/land cover classification was first performed using USGS LULC classification system, then reclassified for RCI purpose.
3. Land Use Classification with Satellite Imagery3. Land Use Classification with Satellite Imagery

3. Land Use Classification with Satellite Imagery3. Land Use Classification with Satellite Imagery
• Supervised Classification with imagery• Six different scenes processed separately, them
merged• Post-processed with USGS and GAP LULC maps

3. Land Use Classification with Satellite Imagery3. Land Use Classification with Satellite Imagery
The initial LULC map was reclassified into RCI Land Use Types:– Central Business District (CBD)– High Density Business/Commercial Center– Low Density Commercial – High Density Residential – Low Density Residential– Other

4. Feature Extraction with Aerial Photography4. Feature Extraction with Aerial Photography
Advantages: • High positional accuracy• Refined detail• Flexible on time, resolution, selection of sensors, and more.
Useful:
• Planimetric features • Location-referencing• 2D and 3D feature extraction
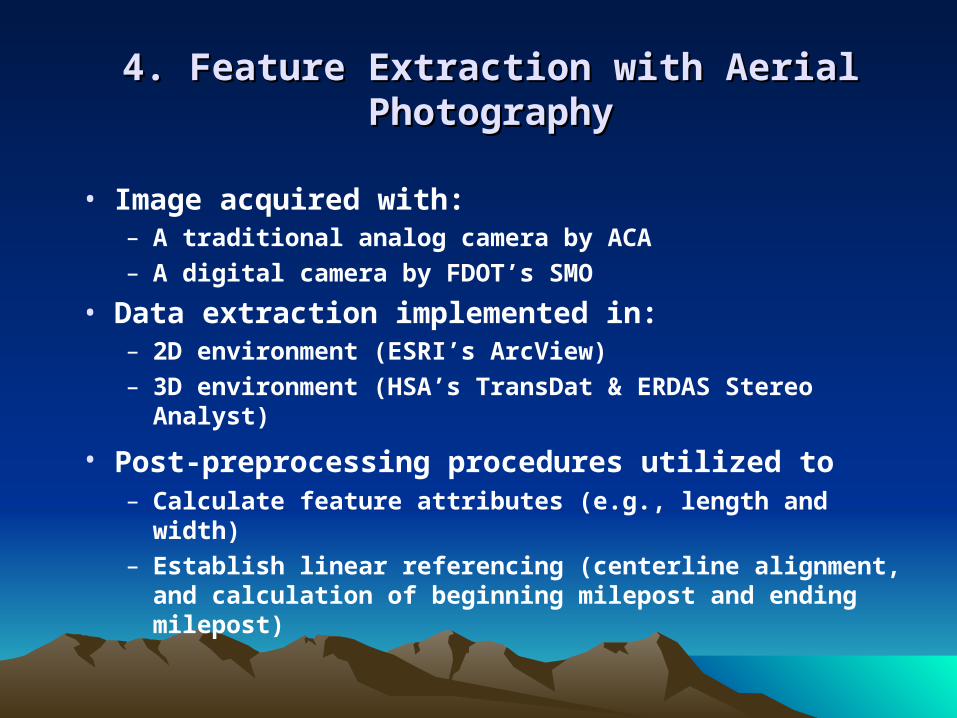
• Image acquired with:– A traditional analog camera by ACA– A digital camera by FDOT’s SMO
• Data extraction implemented in:– 2D environment (ESRI’s ArcView)– 3D environment (HSA’s TransDat & ERDAS Stereo Analyst)
• Post-preprocessing procedures utilized to – Calculate feature attributes (e.g., length and width)– Establish linear referencing (centerline alignment, and
calculation of beginning milepost and ending milepost)
4. Feature Extraction with Aerial Photography4. Feature Extraction with Aerial Photography

Ortho-rectified or geo-rectified imagery was utilized for 2D extraction in ArcView through an interactive process.
4. Feature Extraction with Aerial Photography4. Feature Extraction with Aerial Photography

Feature Extraction in 3D– Image pairs and sensor model information including
ground control points were collected to facilitate the recovery of stereoscopic image models
– 3D extraction was implemented with TransDat with the help from HSA Consulting Group, and RCI sample features extracted for all the project sites.
– 3D Experiments were also carried out with ERDAS Stereo Analyst
4. Feature Extraction with Aerial Photography4. Feature Extraction with Aerial Photography

Post processing procedures utilized to– Compute length and width of planimetric features such as
centerlines and guardrails – Interpolate width for features such as outside shoulders,
inside shoulders, and medians– Establish linear referencing for extracted features
(assignment of the extracted centerlines and the base map, and calculation of the milepost for point features, and the beginning and ending mileposts for linear features)
4. Feature Extraction with Aerial Photography4. Feature Extraction with Aerial Photography
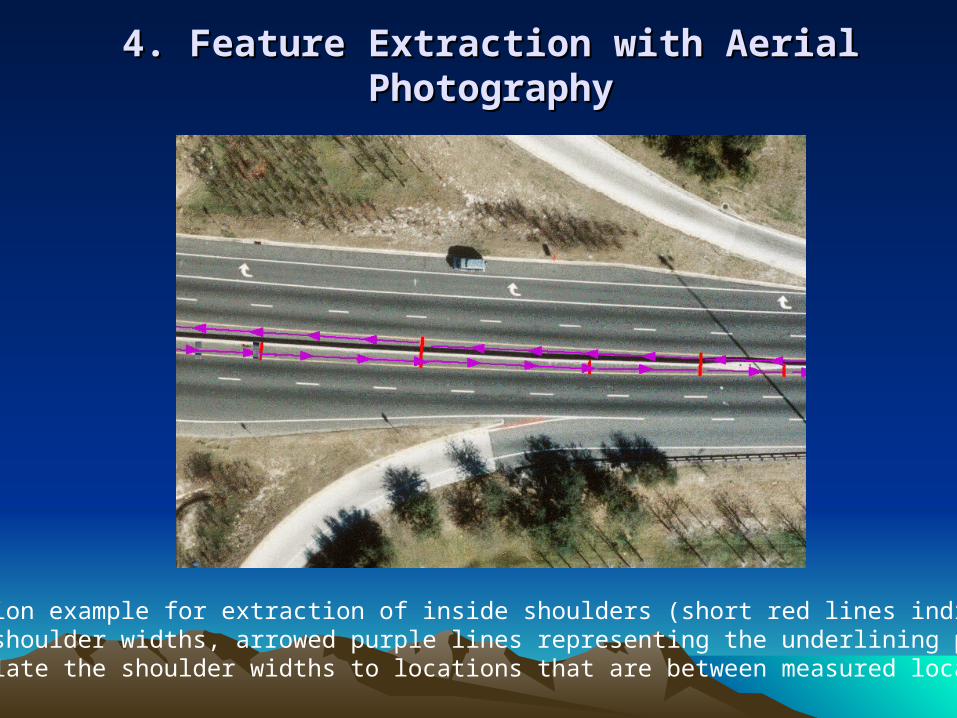
4. Feature Extraction with Aerial Photography4. Feature Extraction with Aerial Photography
Interpolation example for extraction of inside shoulders (short red lines indicating extracted shoulder widths, arrowed purple lines representing the underlining procedures to interpolate the shoulder widths to locations that are between measured locations)

5. Signage Inventory with Mobile Mapping5. Signage Inventory with Mobile Mapping
Advantages: • Terrestrial view• Close range• Real-time positioning (GPS/INS)• Multiple sensors
Useful:
• Almost all detailed roadway features and characteristics• In particular, point features that are difficult to capture through overhead imagery

5. Signage Inventory with Mobile Mapping5. Signage Inventory with Mobile Mapping
Mobile mapping imagery was collected by GeoSpan using its GEOVAN:
– Eight cameras to collect images from eight different directions (360 degrees of viewing angles from the van)
– A high grade INS and a dual frequency GPS receiver allowing both real-time positioning and post-processing for image geo-referencing
– Images collected for all the project sites along with camera positions and orientations for all imaging locations and camera calibration and interior orientation information for each of the eight cameras

5. Signage Inventory with Mobile Mapping5. Signage Inventory with Mobile Mapping
Feature extraction was also provided by GeoSpan using its desk top software:
– Road signs, traffic signs, traffic signals, turning markers on the pavement, etc.
– 3D positions and other attributes (e.g., signage type) – Extracted features were mapped to the corresponding
images for validation and verification
5. Signage Inventory with Mobile Mapping5. Signage Inventory with Mobile Mapping
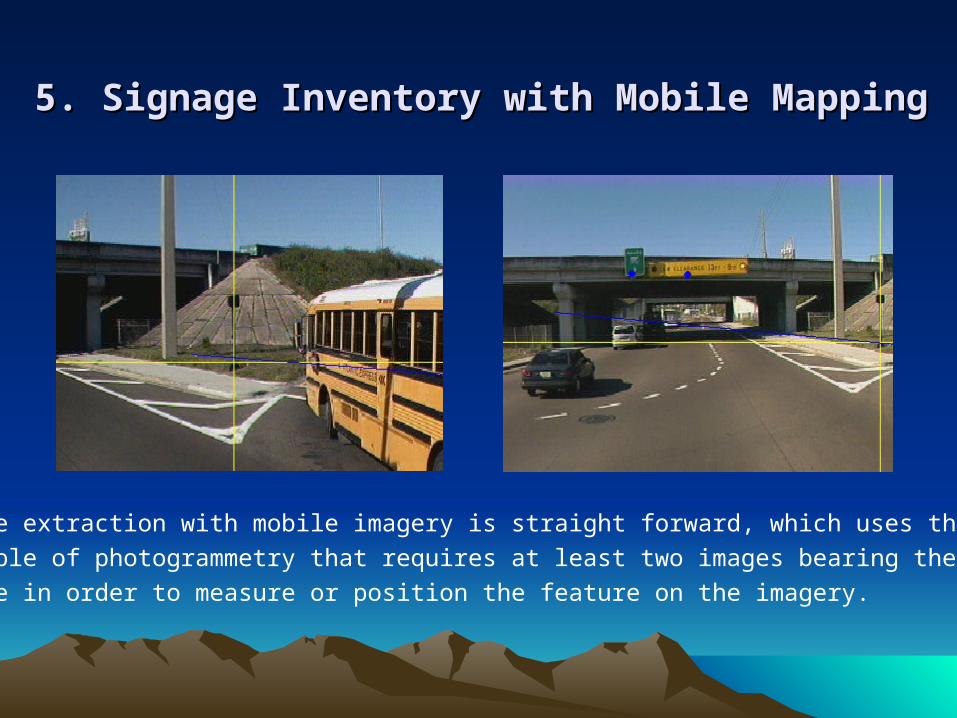
Feature extraction with mobile imagery is straight forward, which uses the same
principle of photogrammetry that requires at least two images bearing the same
feature in order to measure or position the feature on the imagery.

5. Signage Inventory with Mobile Mapping5. Signage Inventory with Mobile Mapping
Features extracted from mobile imagery can also be mapped to overhead ortho-images for checking and viewing purposes. Post-procedures were used to align the extracted features to extracted centerlines and to linearly reference these features to the base map.

6. Data Validation and Verification6. Data Validation and Verification
Cross-Referencing with images from mobile mapping, videolog, and aerial photography– feature extraction– position checking – attribute checking
Ground Control Points– Aerial triangulation – Position accuracy check
Field GPS Survey– position accuracy– attribute accuracy

6. Data Validation and Verification6. Data Validation and Verification
Position Accuracy for Aerial Photography: – For control points only (based on AT report)– Along Arlington expressway, the root mean square
error (RMSE)• 0.167 ft in the x direction• 0.140 ft in the y-direction• 0.047 ft in the z-direction
– For I-10, the RMSE:• 0.106 ft in the x direction• 0.097 ft in the y-direction• 0.095 ft in the z-direction.

6. Data Validation and Verification6. Data Validation and Verification
DX
-140
-120
-100
-80
-60
-40
-20
0
20
40
-40 -20 0 20 40
DY
Comparison of feature coordinates extracted from mobile mapping and field GPS

6. Data Validation and Verification6. Data Validation and Verification
Comparison of the exacted feature attributes and attributes observed with field surveys
7. Conclusions and Discussions7. Conclusions and Discussions
The combined use of commercial remote sensing technologies offers an appealing strategy:
• Satellite images can be utilized to derive land use information for RCI and can be potentially used for extraction of road centerlines and other roadway features.
• Aerial photographs prove to be important data sources for both data extraction and for location referencing, especially for planimetric features.
• The vehicle-based Mobile Mapping System (MMS) proves to be an effective technology for sign inventory and are suitable for the extraction of many other types of roadway features and characteristics.
• Field GPS survey is a useful alternative for RCI. Nevertheless, when remote sensing imagery is available, efforts required for field GPS survey can be reduced
• Existing GIS data are important information resources for RCI. The use of these data can improve efficiency, confirm and refine information from remotely sensed sources, and speed up the data collection process.

7. Conclusions and Discussions7. Conclusions and Discussions
The use of multiple data sources also overcomes some of the shortcomings of single source solutions:
• Data collected from different sources can be cross-referenced that can improve data quality and reduce the need for field validation and verification. The significance of safety benefits can not be underestimated because field data collection along roadways are hazardous to both the field personnel and to the driving public.
• Different vantage points of views of using multi-platform remote sensing, particularly the combination of overhead views and horizontal views, can address limitations of images from a single view point.
• Although a combined approach puts emphasis on the integrated use of multiple technologies, images can be still acquired independently with individual technologies. It is important however these images are combined and integrated when data are extracted in order to achieve synergistic advantages.

7. Conclusions and Discussions7. Conclusions and Discussions
Challenges and Recommendations:
• Remote sensing continues to be an under-utilized technology in transportation. In future, transportation agencies will need to not only coordinate internally among different functional entities, but also to work across institutional boundaries so as to share data, share costs, and share experiences.
• Data processing, analysis, management, and feature extraction for multiple image sources are still technically challenging. Effectively storing, managing, processing, and utilizing those data are practical issues that transportation agency must address.
• Data and software interoperability is yet another major concern. Transportation agencies, industry and academia must work jointly to promote the use of open data formats and the interoperability of GIS and remote sensing software.
• Lack of information on costs and benefits on the implementation of remote sensing technology and the difficulty to collect such information are major barriers in order for transportation agencies to justify investment decisions. Future research needs not only to demonstrate the use of the technology, but also to assess the benefits and costs of remote sensing products.
• There is also a continued need for reviewing data requirements for transportation applications and matching these requirements with potential remote sensing technologies.