multi-residue pesticide analysis of food matrices using … · 2007-11-21 · • common sample...
TRANSCRIPT

Multi-Residue Pesticide Analysis of Food Matrices using GC/MS/MS and LC/MS/MS

©2005 Waters Corporation
Overview
• Introduction to pesticide residue analysis
• GC/MS/MS based methods– Quattro micro GC for complex matrices– 100 pesticide residues in a single analysis
• LC/MS/MS based methods– 100 pesticide residues using the Quattro Premier API– Enhancing the method
ACQUITY UPLC™
• TargetLynx Data Management Software

GC/MS/MSAnalysis of Pesticides inComplex Food Matrices

©2005 Waters Corporation
Introduction• Hundreds of Pesticide Compounds in Use
– Requirement for Surveillance Monitoring of Foodstuffs– Permitted Concentrations Regulated by Legislation
• Reporting Levels– Limits of Detection below the regulation are Required
target LOD of 0.01mg / kg (10 ppb)
• Need for the Targeting of Multiple Analytes per Analysis– Wide Range of Analyte Chemistries
polarity, thermal stability, volatility– Wide Range of Sample Matrices
• Common Sample Matrix Extraction and Minimal Sample Prep– Selectivity obtained from Chromatographic and Determinative Step– Analyte Specific Multiple Reaction Monitoring (MRM)
Triple Quadrupole Mass Spectrometry– Combined GC, chromatographic selectivity, and MS/MS is recommended

©2005 Waters Corporation
Method Objective
• Develop a rapid multi-residue pesticide screening method – 100 Residue Analytes in a Single Analysis– Reduce overall method cycle time, injection to injection– To increase efficiency and sample throughput
• Able to quantify and confirm the analyte at MRL tolerance levels – Include an additional MRM transition for the most commonly observed
residues Confirmatory method– Potentially reducing overall analysis time for a batch
TargetLynx

©2005 Waters Corporation
GC/MS BasedMulti-residue Methods
• Increasing selectivity and/or sensitivity– Sample Preparation (unlikely for multi-residue methods)– Chemical Ionization (narrows target range)– High Resolution MS
Magnetic Sector (expensive)– Dioxin/Furans, Bromonated Flame Retardants, PCB– EPA approved methods
Time of Flight (limited dynamic range)– Tandem MS/MS
Ion Trap (limited dynamic range, complex matrices)Tandem Quadrupole MS/MS

©2005 Waters Corporation
System Solution
Quattro micro GC/MS/MS

©2005 Waters Corporation
Method Strategy• 100 residue compounds in a single analysis
• Multiple compound classes– OPs, OCs, Pyrethroids
• Run time approximately <45 minutes
• Chromatographic and mass selectivity to compensate for non-selective sample preparation
• Less than 10 ppb sensitivity to minimize injection volumes of “dirty” matrix

©2005 Waters Corporation
• Column– DB5 MS, 30m x 0.25mm i.d., 0.25µm
• Injector– Cryo cooled PTV in solvent vent mode, 2 µL injected
• Constant flow rate of 1.0 mL/min Helium
• Temperature program
GC Conditions
280°C @ 5°C/min32 min150°C @ 25 °C/min6 min
280°C37 min
50°C (2min)0 min
©2005 Waters Corporation
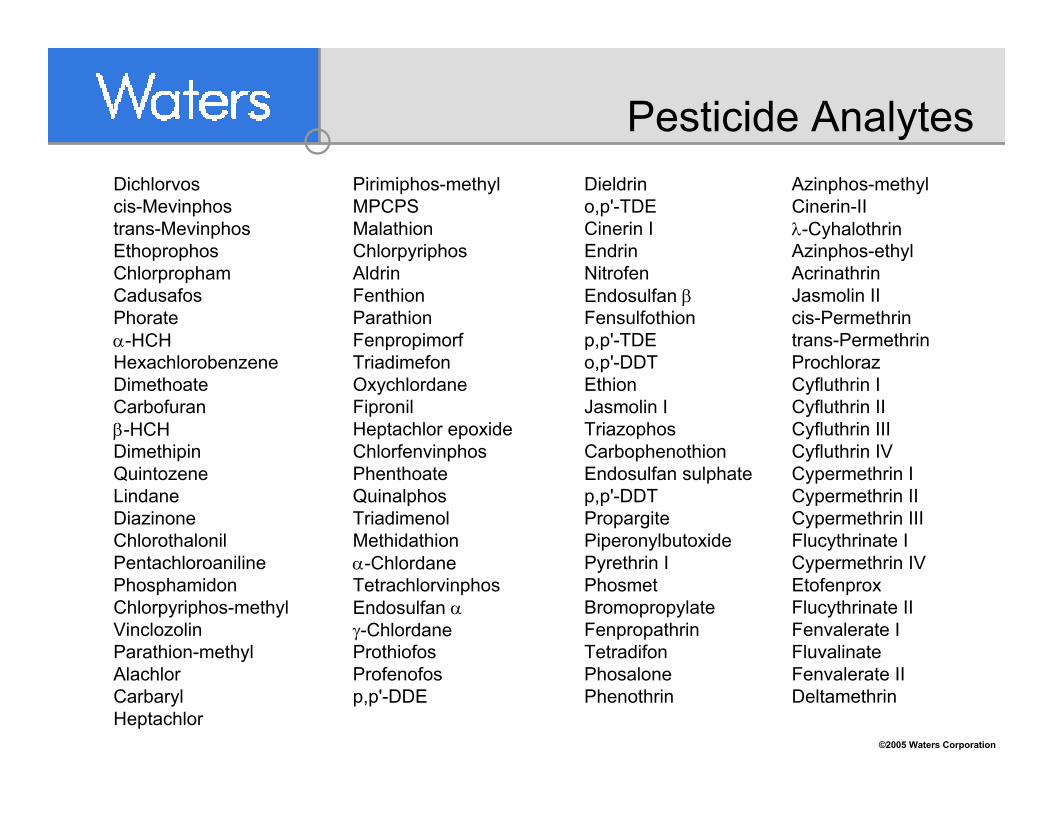
Pesticide AnalytesDichlorvoscis-Mevinphostrans-MevinphosEthoprophosChlorprophamCadusafosPhorateα-HCHHexachlorobenzeneDimethoateCarbofuranβ-HCHDimethipinQuintozeneLindaneDiazinoneChlorothalonilPentachloroanilinePhosphamidonChlorpyriphos-methylVinclozolinParathion-methyl AlachlorCarbarylHeptachlor
Pirimiphos-methylMPCPSMalathionChlorpyriphosAldrinFenthionParathionFenpropimorfTriadimefonOxychlordaneFipronilHeptachlor epoxideChlorfenvinphosPhenthoateQuinalphosTriadimenolMethidathionα-ChlordaneTetrachlorvinphosEndosulfan αγ-ChlordaneProthiofosProfenofosp,p'-DDE
Dieldrino,p'-TDE Cinerin IEndrinNitrofenEndosulfan βFensulfothionp,p'-TDE o,p'-DDT EthionJasmolin ITriazophosCarbophenothionEndosulfan sulphatep,p'-DDTPropargitePiperonylbutoxidePyrethrin IPhosmetBromopropylateFenpropathrinTetradifonPhosalonePhenothrin
Azinphos-methylCinerin-IIλ-CyhalothrinAzinphos-ethylAcrinathrinJasmolin IIcis-Permethrintrans-PermethrinProchlorazCyfluthrin ICyfluthrin IICyfluthrin IIICyfluthrin IVCypermethrin ICypermethrin IICypermethrin IIIFlucythrinate ICypermethrin IVEtofenproxFlucythrinate IIFenvalerate IFluvalinateFenvalerate IIDeltamethrin

©2005 Waters Corporation
MS/MS Method
• MRM functions arranged into 14 time windows– More flexible use of dwell times– Improved signal to noise (S/N) ratios for some analytes– Overlapping allows for small changes in retention time

©2005 Waters Corporation
Total Ion Chromatogram (TIC)
Dic
hlor
v os
Del
tam
e thr
i n
100 pesticide residues84 MRM transitions10 mS dwell time

©2005 Waters Corporation
MRM Chromatograms10 ppb Sensitivity
2µl injected = 20 pg on column

©2005 Waters Corporation
Deltamethrinr2 = 0.998
Pirimiphos-methylr2 = 0.999
Linearity (10-1000pg)
Compound name: DeltamethrinCorrelation coefficient: r = 0.998918, r^2 = 0.997838Calibration curve: 14.0112 * x + 125.819Response type: External Std, AreaCurve type: Linear, Origin: Exclude, Weighting: 1/x, Axis trans: None
pg/µl0 25 50 75 100 125 150 175 200 225 250 275 300 325 350 375 400 425 450 475 500
Res
pons
e
0
1000
2000
3000
4000
5000
6000
7000
Tetradifonr2 = 0.999
Compound name: Pirimiphos-methylCorrelation coefficient: r = 0.999511, r^2 = 0.999022Calibration curve: 20.2691 * x + -27.0132Response type: External Std, AreaCurve type: Linear, Origin: Exclude, Weighting: 1/x, Axis trans: None
pg/µl0 25 50 75 100 125 150 175 200 225 250 275 300 325 350 375 400 425 450 475 500
Res
pons
e
0
1000
2000
3000
4000
5000
6000
7000
8000
9000
10000
Dichlorvosr2 = 0.998
Compound name: TetradifonCorrelation coefficient: r = 0.999367, r^2 = 0.998735Calibration curve: 6.93326 * x + 21.1316Response type: External Std, AreaCurve type: Linear, Origin: Exclude, Weighting: 1/x, Axis trans: None
pg/µl0 25 50 75 100 125 150 175 200 225 250 275 300 325 350 375 400 425 450 475 500
Res
pons
e
0
500
1000
1500
2000
2500
3000
3500
Compound name: DichlorvosCorrelation coefficient: r = 0.998799, r^2 = 0.997600Calibration curve: 12.7295 * x + -2.86235Response type: External Std, AreaCurve type: Linear, Origin: Exclude, Weighting: 1/x, Axis trans: None
pg/µl0 25 50 75 100 125 150 175 200 225 250 275 300 325 350 375 400 425 450 475 500
Res
pons
e
0
500
1000
1500
2000
2500
3000
3500
4000
4500
5000
5500
6000

©2005 Waters Corporation
Detection Limit Sensitivity
Limit of Detection = S/N ratio ≥ 3:1
05
101520253035
0.5-1 1-2.5 2.5-5 5-10 10-25 25-50 >50
LOD / pg
%
75%ExcellentSensitivity
InadequateSensitivity

©2005 Waters Corporation
Matrix Extraction Method
• Sample matrix– Strawberry, Baby Food, Dried Tea, Tobacco, Spices,
Ginko, Cannabis
• Homogenize using high speed blending• Extraction with ethyl acetate (Turrax)• Cleanup with dispersive SPE
– Primary Secondary Amine followed by Graphitised Carbon Black
• Final extract– Fresh produce, baby food = 0.5 g/mL– Dried herbs, spices, tobacco = 0.1 g/mL

©2005 Waters Corporation
6.00 8.00 10.00 12.00 14.00 16.00 18.00 20.00 22.00 24.00 26.00 28.00 30.00 32.00
GC Chromatographic SelectivityExamples Food Matrix
Strawberry in full scan TIC EI+ 20 µL of 0.5 g/mL
10 mg matrix on Column
6.00 8.00 10.00 12.00 14.00 16.00 18.00 20.00 22.00 24.00 26.00 28.00 30.00 32.00
Complex MatrixBaby Food
1 mg matrix on Column
Simple Matrix

©2005 Waters Corporation
MS/MS Selectivity in Baby Food
Pesticides Spikedin Baby Food
Quattro micro GC0.01 mg / kg
10 ppb

©2005 Waters Corporation
6.00 8.00 10.00 12.00 14.00 16.00 18.00 20.00 22.00 24.00 26.00 28.00 30.00 32.00
GC Chromatographic Selectivity in Herbal Tea
Herbal Tea = 0.2 mg matrix

©2005 Waters Corporation
Pesticides Spikedin Herbal Tea
Quattro micro GC0.3 ppm dry
0.03 ppm fresh
MS/MS Selectivityin Herbal Tea

©2005 Waters Corporation
TIC Scan EI+
GC Chromatographic Selectivity Curry Spice Mix
Curry Spice Mix = 0.2 mg matrix on column
6.00 8.00 10.00 12.00 14.00 16.00 18.00 20.00 22.00 24.00 26.00 28.00 30.00 32.00Minutes

©2005 Waters Corporation
Spiked Pesticides in Curry Spice Mix
Quattro micro GC0.15 ppm
MS/MS Selectivity in Curry Spice Mix

©2005 Waters Corporation
• High % of pesticides correctly identified & quantified• Highly complex matrices• Generic, limited sample preparation
GC/MS/MS Pesticide Screening Summary
9487930.03 mg/kgHerbal Mix9790930.15 mg/kgCurry9487930.15 mg/kgMassala
9588930.03 mg/kgHerbal Tea
9487930.15 mg/kgTobacco
5252
9393
# Pesticides Spiked
% Detection
# Pesticides Identified
Pesticide Fortification
FoodMatrix
79410.02-4.0 mg/kgCannabis85440.02-4.0 mg/kgGinko
99920.05 mg/kgBaby Food87810.01 mg/kgBaby Food

A Rapid Multi-ResidueLC-MS/MS Method for the Analysis of Pesticides

©2005 Waters Corporation
Previous Work
• Validated a multi-residue screening method in 2003, suitable for surveillance monitoring of fruits and vegetables using a Waters Alliance 2795 with Quattro Micro API MS– 81 Residue Compounds in a Single Analysis
Benzimidazoles, Carbamates, Organophosphorous etc.All LODs below those required for monitoring purposes
– Overall cycle time of the method was 40 min– Analyses performed from a variety of food matrices (avocado,
tomato, raisin, lemon, flour)
• Method transferred to Waters Alliance 2795 with Waters micromass Quattro Premier API MS– Confirmatory method for the 20 most commonly observed residues– Overall cycle time of the method was 25 min

©2005 Waters Corporation
Aims of Project
• Develop a rapid multi-residue pesticide screening method – 100 Residue Compounds in a Single Analysis– Reduce overall cycle time of the method
To increase efficiency and sample throughput
• Able to quantify and confirm at MRL tolerance levels – Include an additional transition for a selection of the most
commonly observed residues Confirmatory method– Potentially reducing overall analysis time for a batch

©2005 Waters Corporation
System SolutionACQUITY UPLC/MS/MS
Quattro Premier

©2005 Waters Corporation
UPLC Chromatographicand Mass Spec Method
• Column: BEH C18, 2.1x100 mm, 1.7 µm• Gradient: 20% to 90% MeOH containing 5 mM NH4OAc
Linear for 8.5 mins, hold for 2 min, re-equilibrate • Flow: 450 µL/min• Col Temp: 40º C• Inj Volume: 20 µL
• Waters Micromass Quattro PremierIonization mode: ES+ / ES-Capillary voltage: 0.8 kV (ES+ and ES-)Gas Flow: 800 L/hrSource Temp: 120º CDesolv’n Temp: 80º CCone Voltage: Analyte specificMS/MS: operated in MRM modeCollision Voltage: Analyte specific

©2005 Waters Corporation
100 Pesticides Analytes
5-Hydroxy-clethodim-sulfon Clethodim-sulfon Imazalil Propoxur6-chloro-4-hydroxy-3-phenyl-pyridazin Clethodim-sulfoxid Imidacloprid ProsulfuronAcephate Cyprodinil Indoxacarb PymetrozinAldicarb Daminozid Ioxynil PyridateAldicarb-sulfoxid Demeton-S-methyl-sulfon Iprovalicarb PyrimethanilAldoxycarb Desmedipham Isoproturon QuinmeracAmidosulfuron Difenzoquat methylsulfate Isoxaflutole Quizalofop-ethylAtrazin Diflubenzuron Linuron RimsulfuronAzoxystrobin Dimethoat Metalaxyl SpiroxamineBendiocarb Diuron Metamitron TebuconazolBensulfuron-methyl Ethiofencarb Methamidophos TebufenozideBromoxynil Ethiofencarbsulfon Methiocarb TeflubenzuronButocarboxim Ethiofencarbsulfoxid Methomyl ThiabendazolButoxycarboxim Fenhexamid Metolachlor ThiaclopridButoxycarboxim-sulfoxid Fenoxycarb Metsulfuron-methyl Thifensulfuron-methylCarbaryl Fenpropimorph Monocrotophos ThiodicarbCarbendazim Flazasulfuron Nicosulfuron Thiofanoxcarbofuran Florasulam Omethoat Thiofanox-sulfonCarbofuran-3-hydroxy Fluazifop-P-butyl Oxamyl Thiofanox-sulfoxidChlorsulfuron Fludioxonil Oxydemeton-methyl TriasulfuronCinosulfuron Flufenoxuron Phenmedipham TriflumuronClethodim Formetanate Pirimicarb Triflusulfuron-methylClethodim-imin-sulfon Furathiocarb Primisulfuron methyl Vamidothion
Haloxyfop-ethoxyethyl Promecarb

©2005 Waters Corporation
Pesticide Spike in Raisins10 ppb matrix matched standard
Time0.00 1.00 2.00 3.00 4.00 5.00 6.00 7.00 8.00 9.00 10.00
%
0
100acquityraisin201204_021 14: MRM of 10 Channels ES+
TIC5.38e6
5.32
5.24
5.07
5.40
5.56
10 ppb matrix matched standard
Time0.00 1.00 2.00 3.00 4.00 5.00 6.00 7.00 8.00 9.00 10.00
%
0
100acquityraisin201204_021 22: MRM of 2 Channels ES+
TIC5.38e6
9.34
TIC Chromatogramin less than10 Minutes
100 Analytesat 10 ppb

©2005 Waters Corporation
Quattro micro API, Alliance 269581 residues
40 min cycle time
Quattro Premier, Alliance 2695100 residues
25 min cycle time
Quattro Premier, ACQUITY UPLC100 residues
14.5 min cycle time
Increasing the ThroughputHPLC vs. ACQUITY UPLC
10 ppb matrix matched standard
Time0.00 2.00 4.00 6.00 8.00 10.00 12.00 14.00 16.00 18.00 20.00 22.00 24.00
%
0
100acquityraisin201204_010 16: MRM of 2 Channels ES-
TIC5.38e6
Time5.00 10.00 15.00 20.00 25.00
%
0
100
Time5.00 10.00 15.00 20.00 25.00
%
0
100
Time5.00 10.00 15.00 20.00 25.00
%
0
100
10 ppb matrix matched standard
Time0.00 2.00 4.00 6.00 8.00 10.00 12.00 14.00 16.00 18.00 20.00 22.00 24.00
%
0
100acquityraisin201204_010 22: MRM of 2 Channels ES+
TIC5.38e6

©2005 Waters Corporation
Comparison of HPLC and UPLC
HPLC to UPLCDecrease in Peak Width Results in an Increase
in Signal Intensity
HPLC
Minutes4.50 5.00 5.50 6.00 6.50 7.00 7.50 8.00 8.50 9.00 9.50
UPLC Carbaryl
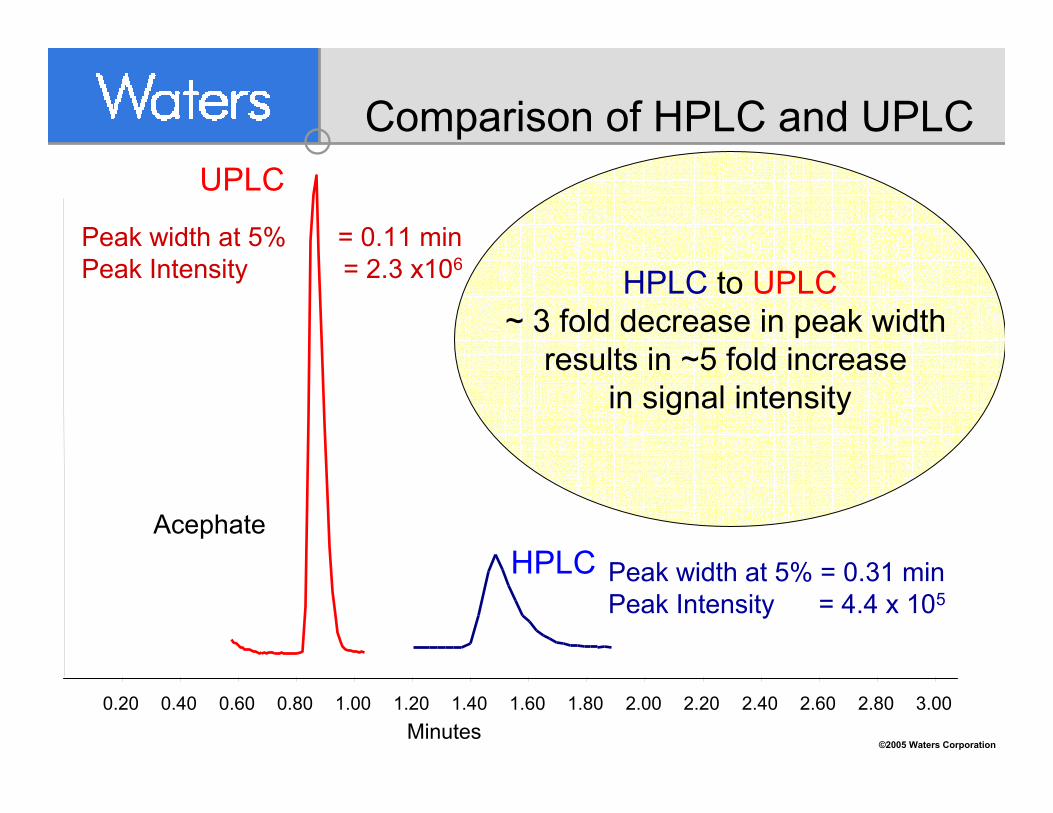
©2005 Waters Corporation
Comparison of HPLC and UPLC
Peak width at 5% = 0.31 minPeak Intensity = 4.4 x 10⁵
Peak width at 5% = 0.11 minPeak Intensity = 2.3 x10⁶
HPLC
UPLC
HPLC to UPLC~ 3 fold decrease in peak width
results in ~5 fold increase in signal intensity
Minutes0.20 0.40 0.60 0.80 1.00 1.20 1.40 1.60 1.80 2.00 2.20 2.40 2.60 2.80 3.00
Acephate

©2005 Waters Corporation
Butoxycarboxim Sulfoxideand Aldicarb Sulfoxide
have the same MRM transition m/z 207.1 > 89
AndSimilar retention time: ∆ =12 seconds
Resolution ComparisonHPLC and UPLC
10 ppb (QC)
Time1.45 1.50 1.55 1.60 1.65 1.70 1.75 1.80 1.85 1.90 1.95 2.00 2.05 2.10 2.15 2.20 2.25 2.30 2.35 2.40 2.45
%
0
100pesticidemix_solvent_119 Sm (Mn, 1x2) 3: MRM of 9 Channels ES+
207.1 > 1321.52e5
10 pg/ul solvent standard
Time0.85 0.90 0.95 1.00 1.05 1.10 1.15 1.20 1.25 1.30 1.35 1.40 1.45 1.50 1.55 1.60 1.65 1.70 1.75 1.80 1.85
%
0
100acquitysolventstandard141204_011 Sm (Mn, 1x2) 3: MRM of 9 Channels ES+
207.1 > 1324.64e5
3 µm
1.7 µm
Requires EnhancedChromatographic Resolution
for Correct AnalyteIdentification and Quantification

©2005 Waters Corporation
Demands on the mass spectrometer
For accurate quantitation a minimum of 10 data points are needed across each peak.
Due to the
• Narrow peak widths
• Number and type of compounds to be analysed– Multi-analyte method– Inclusion of confirmatory transitions for some analytes– Some analytes ionise preferentially in negative ion
mode
Significant demands are placed on the mass spectrometer

©2005 Waters Corporation
Quattro Premier and T-Wave Technology
• The T-Wave is used to rapidly clear the cell between transitions, even when using a very short inter-channel delay (5ms) – minimising crosstalk.
• The T-Wave also ensures that the cell is completely refilled before acquisition commences allowing very short dwell times without loss of intensity.
• This enables quantification of narrower chromatographic peaks or quantification of more MRM transitions in the same time window.
“Travelling Wave Ion Propulsion in Collision Cells” K. Giles, S.Pringle, K. Worthington and R. Bateman—Presented at the 51st ASMSConference, Montreal, Canada 2003. The travelling wave devicedescribed here is similar to that described by Kirchner in US Patent5,206,506 (1993).

©2005 Waters Corporation
MRM Time Windows to Maximize Sensitivity
• MRM functions arranged into 26 retention time windows– More flexible use of dwell times– Positive and negative switching– Improved signal to noise (S/N) ratios

©2005 Waters Corporation
•Dimethoate and vamidothion determined under positive ion•Bromoxynil determined under negative ion
ESP+/ESP- Mode Switching
Time
2.40 2.50 2.60
2.40 2.50 2.60
2.40 2.50 2.60
ESP+: 230.1 > 199
ESP+: 288.1 > 146.1
ESP-: TIC
Dimethoate
Vamidothion
Bromoxynil
©2005 Waters Corporation
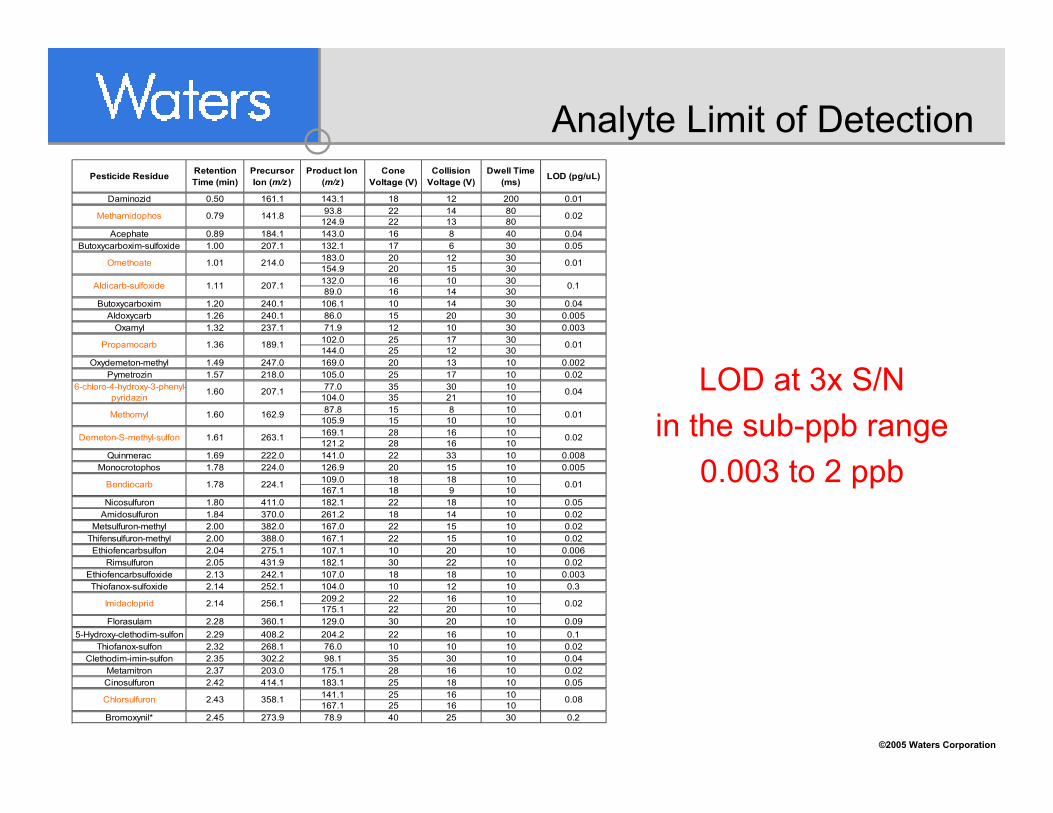
LOD at 3x S/Nin the sub-ppb range
0.003 to 2 ppb
Analyte Limit of DetectionPesticide Residue Retention
Time (min)Precursor Ion (m/z )
Product Ion (m/z )
Cone Voltage (V)
Collision Voltage (V)
Dwell Time (ms) LOD (pg/uL)
Daminozid 0.50 161.1 143.1 18 12 200 0.0193.8 22 14 80
124.9 22 13 80Acephate 0.89 184.1 143.0 16 8 40 0.04
Butoxycarboxim-sulfoxide 1.00 207.1 132.1 17 6 30 0.05183.0 20 12 30154.9 20 15 30132.0 16 10 3089.0 16 14 30
Butoxycarboxim 1.20 240.1 106.1 10 14 30 0.04Aldoxycarb 1.26 240.1 86.0 15 20 30 0.005
Oxamyl 1.32 237.1 71.9 12 10 30 0.003102.0 25 17 30144.0 25 12 30
Oxydemeton-methyl 1.49 247.0 169.0 20 13 10 0.002Pymetrozin 1.57 218.0 105.0 25 17 10 0.02
77.0 35 30 10104.0 35 21 1087.8 15 8 10
105.9 15 10 10169.1 28 16 10121.2 28 16 10
Quinmerac 1.69 222.0 141.0 22 33 10 0.008Monocrotophos 1.78 224.0 126.9 20 15 10 0.005
109.0 18 18 10167.1 18 9 10
Nicosulfuron 1.80 411.0 182.1 22 18 10 0.05Amidosulfuron 1.84 370.0 261.2 18 14 10 0.02
Metsulfuron-methyl 2.00 382.0 167.0 22 15 10 0.02Thifensulfuron-methyl 2.00 388.0 167.1 22 15 10 0.02Ethiofencarbsulfon 2.04 275.1 107.1 10 20 10 0.006
Rimsulfuron 2.05 431.9 182.1 30 22 10 0.02Ethiofencarbsulfoxide 2.13 242.1 107.0 18 18 10 0.003Thiofanox-sulfoxide 2.14 252.1 104.0 10 12 10 0.3
209.2 22 16 10175.1 22 20 10
Florasulam 2.28 360.1 129.0 30 20 10 0.095-Hydroxy-clethodim-sulfon 2.29 408.2 204.2 22 16 10 0.1
Thiofanox-sulfon 2.32 268.1 76.0 10 10 10 0.02Clethodim-imin-sulfon 2.35 302.2 98.1 35 30 10 0.04
Metamitron 2.37 203.0 175.1 28 16 10 0.02Cinosulfuron 2.42 414.1 183.1 25 18 10 0.05
141.1 25 16 10167.1 25 16 10
Bromoxynil* 2.45 273.9 78.9 40 25 30 0.2
0.08
0.01
0.02
0.04
0.02
0.01
0.02
0.1
0.01
0.01
Methamidophos 0.79 141.8
Omethoate 1.01 214.0
Aldicarb-sulfoxide 1.11 207.1
Propamocarb 1.36 189.1
6-chloro-4-hydroxy-3-phenyl-pyridazin
1.60 207.1
Methomyl 1.60 162.9
Demeton-S-methyl-sulfon 1.61 263.1
Bendiocarb 1.78 224.1
Imidacloprid 2.14 256.1
Chlorsulfuron 2.43 358.1

©2005 Waters Corporation
Sample Preparation– Sample: Californian Sun-dried Seedless Raisins (Thompson
variety)– Chopped– 5g Aliquot homogenised– 9 mL water added– After 10 min, 20 mL of methanol added– 6mL of extract was mixed with 2mL of sodium chloride
solution– 5mL aliquot of the mixture was transferred to a ChemElut
column containing 5 mL of diatomaceous earth– After 5min the column was eluted with 16 mL DCM– Elute evaporated– Reconstituted in methanol (250 µL)– Addition of 1 mL water and filtering into glass vial

©2005 Waters Corporation
Preparation ofMatrix Matched Standards
– Blank matrix: organically grown Sun-dried Seedless Raisins (Thompson variety)
– Same sample preparation, extraction and clean-up procedure as for sample
– All analytes spiked into the matrix at a range of concentrations equivalent to 1, 2, 5, 10, 20 ppb

©2005 Waters Corporation
Spiked Raisin Matrix
Time0.00 1.00 2.00 3.00 4.00 5.00 6.00 7.00 8.00 9.00 10.00
%
0
100
Time0.00 1.00 2.00 3.00 4.00 5.00 6.00 7.00 8.00 9.00 10.00
%
0
100
10 ppb analyte spike

©2005 Waters Corporation
Compound name: CarbendazimCorrelation coefficient: r = 0.998134, r 2̂ = 0.996272Calibration curve: 5128.64 * x + 66.1767Response type: External Std, AreaCurve type: Linear, Origin: Exclude, Weighting: 1/x, Axis trans: None
ppb0.0 2.5 5.0 7.5 10.0 12.5 15.0 17.5 20.0
Res
pons
e
0
20000
40000
60000
80000
100000
Carbendazim in Raisin (ESP+)
1 ppb Chromatogram
1 to 20 ppb
min2.40 2.60 2.80 3.00 3.20 3.40
%
0
100
F9:MRM of 12 channels,ES+192.1>132.11.784e+004
acquityraisin201204_013 1 ppb matrix matched standard Carbendazim
2.97
2.48 2.86
3.113.19 3.35 3.51
min
%
0
100
F9:MRM of 12 channels,ES+192.1 > 160.1
1.092e+005
acquityraisin201204_013 1 ppb matrix matched standard Carbendazim
2.97
2.853.06
r2= 0.996
192.2 > 160.1primary
quantificationion
192.2 > 132.1secondary
confirmationion

©2005 Waters Corporation
Compound name: CyprodinilCorrelation coefficient: r = 0.997715, r 2̂ = 0.995435Calibration curve: 807.68 * x + 136.057Response type: External Std, AreaCurve type: Linear, Origin: Exclude, Weighting: 1/x, Axis trans: None
ppb0.0 2.5 5.0 7.5 10.0 12.5 15.0 17.5 20.0
Res
pons
e
0
2000
4000
6000
8000
10000
12000
14000
Cyprodinil in Raisin (ESP+)
1 ppb Chromatogram
1 to 20ppb
min6.800 7.000 7.200 7.400 7.600
%
0
100
F18:MRM of 11 channels,ES+226.2>108.11.532e+004
acquityraisin201204_013 1 ppb matrix matched standard Cyprodinil
7.17
7.016.88 7.29 7.377.40 7.49 7.57
min
%
0
100
F18:MRM of 11 channels,ES+226.2 > 93.11.952e+004
acquityraisin201204_013 1 ppb matrix matched standard Cyprodinil
7.17
6.82 7.067.27
7.507.42 7.59
r2= 0.995
226.2 > 93.1primary
quantificationion
226.2 > 108.1secondary
confirmationion

©2005 Waters Corporation
Compound name: TeflubenzuronCorrelation coefficient: r = 0.992141, r 2̂ = 0.984344Calibration curve: 19.9838 * x + 12.801Response type: External Std, AreaCurve type: Linear, Origin: Exclude, Weighting: 1/x, Axis trans: None
ppb0.0 2.0 4.0 6.0 8.0 10.0 12.0 14.0 16.0 18.0 20.0
Res
pons
e
0
100
200
300
400
500
Teflubenzuron in Raisin (ESP-)
1 ppb chromatogram
1 to 20ppb
min8.200 8.250 8.300 8.350 8.400 8.450
%
0
100
F21:MRM of 2 channels,ES-379>196
2.412e+002
acquityraisin201204_002 1 ppb matrix matched standard Teflubenzuron
8.33
8.20
8.25
Teflubenzuron8.33
8.44
min
%
0
100
F21:MRM of 2 channels,ES-379 > 339.17.478e+002
acquityraisin201204_002 1 ppb matrix matched standard Teflubenzuron
8.32
8.218.15
379 > 339.1primary
quantificationion
379 > 196secondary confirmation
ion
r2 = 0.984

©2005 Waters Corporation
Analysis of Californian Raisins
min1.800 1.900 2.000 2.100 2.200 2.300 2.400
%
0
100
F6:MRM of 9 channels,ES+256.1>175.11.875e+004
acquityraisin201204_009 californian raisin sample
Imidacloprid
1.971.76
1.881.84 2.07 2.372.28
min
%
0
100
F6:MRM of 9 channels,ES+256.1 > 209.2
1.414e+004
acquityraisin201204_009 californian raisin sample
Imidacloprid
2.09
min6.800 7.000 7.200 7.400 7.600
%
0
100
F18:MRM of 11 channels,ES+353.2>297.23.059e+004
acquityraisin201204_009 californian raisin sample
Tebufenozide
min
%
0
100
F18:MRM of 11 channels,ES+353.2 > 1333.078e+004
acquityraisin201204_009 californian raisin sample
Tebufenozide
6.867.36
7.15 7.22 7.637.547.497.47
Imidacloprid2.2 ppb
Tebufenozide1.7 ppb
256.1 > 209.2primary
quantificationion
256.1 > 175.1secondary
confirmationion
353.2 > 133primary
quantificationion
353.2 > 297.2secondary
confirmationion

©2005 Waters Corporation
The TargetLynx Data Manager
• Comprehensive Tool for Data Processing– Quantitative Data Generation and Evaluation– QA/QC System and Method suitability
• When injecting a series of samples, the analyte concentrations are reported as follows:
– Analytes which are below the reporting limit are not reporteduser defined values, i.e. MRL, LOQ, S/N, etc
– Analytes between the reporting limit and the maximum allowed MRL are reported
– Analytes above the MRL are reported in red Bold
– The method QA/QC parameters are flagged in red if exceeds user defined limits, and the explanation appears as tool tip
RT, S/N, r2, plate count, calib checks, spiked duplicates, etc

©2005 Waters Corporation
TargetLynx Application ManagerExample
• Carbaryl detected as positive in a raisin matrix blank using the pesticide multi-residue screening method
• 6 additional analytes also detected in matrix blank– Confirmatory method created, monitoring 3 MRM transitions per
compound– TargetLynx method created by exporting the compounds from the
screening method– Matrix blank, matrix spiked and ‘real’ raisin samples acquired and
processed
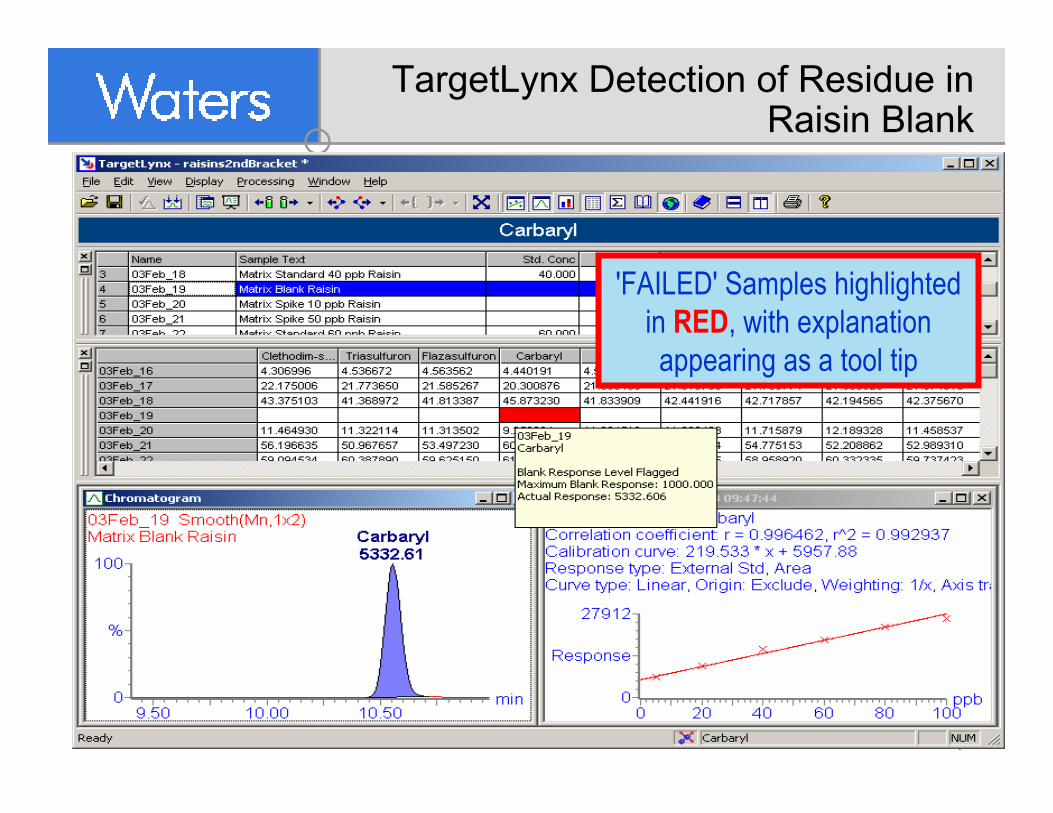
©2005 Waters Corporation
TargetLynx Detection of Residue in Raisin Blank
'FAILED' Samples highlighted in RED, with explanation appearing as a tool tip

©2005 Waters Corporation
TargetLynx Processing of Confirmatory Analysis

©2005 Waters Corporation
Waters Application Solution• Multi-residue method for surveillance monitoring of 100 pesticide
residues in food and natural products, complex matrices– GC/MS/MS and UPLC/MS/MS
• Chromatographic and MS/MS Selectivity to allow generic sample preparation– Enhanced chromatographic resolution and shorter analysis times– Ability to group MRM functions into time windows, enabling the
incorporation of confirmatory MRM traces– Ability to switch rapidly between MRM channels and between positive and
negative ionization modes
• Good sensitivity (<5 ppb generally) for pesticide residues– Sufficient to limit the amount of matrix introduced into the chromatographic
inlet

©2005 Waters Corporation
Acknowledgments
• Waters Corporation, Manchester, UK– David Douce– Gordon Kearney– Peter Hancock– Catherine Ryan
• TNO, Zeist, The Netherlands– Hans Mol
• FIRA, Berlin, Germany– Lutz Alder– Jeannette Klein