multi-scale observations of structure and chemical
TRANSCRIPT

Construction and Building Materials 212 (2019) 486–499
Contents lists available at ScienceDirect
Construction and Building Materials
journal homepage: www.elsevier .com/locate /conbui ldmat
Multi-scale observations of structure and chemical composition changesof portland cement systems during hydration
https://doi.org/10.1016/j.conbuildmat.2019.04.0130950-0618/� 2019 Published by Elsevier Ltd.
⇑ Corresponding author.E-mail address: [email protected] (M. Moradian).
1 Conventional cement chemistry notation is used throughout this paper: C = CaO,S = SiO2, H = H2O.
Masoud Moradian a,⇑, Qinang Hu a, Mohammed Aboustait a, M. Tyler Ley a, Jay C. Hanan b, Xianghui Xiao c,Volker Rose c,d, Robert Winarski d, George W. Scherer e
aOklahoma State University, School of Civil and Environmental Engineering, Stillwater, OK 74078, USAbOklahoma State University, School of Mechanical and Aerospace Engineering, Tulsa, OK 74106, USAcArgonne National Laboratory, Advanced Photon Source, Argonne, IL 60439, USAdArgonne National Laboratory, Center for Nanoscale Materials, Argonne, IL 60439, USAe Princeton University, Department of Civil & Environmental Engineering, Princeton, NJ 08544, USA
h i g h l i g h t s
� Non-uniform growth and dissolution were observed on the surface of particles.� Hydration products with Ca/Si > 3 form on and near the particles before the acceleration period.� Chemical composition of hydration products changed from the induction period to the acceleration period.
a r t i c l e i n f o
Article history:Received 1 February 2019Received in revised form 28 March 2019Accepted 3 April 2019
Keywords:X-ray Computed TomographyCement hydrationAcceleration periodCalorimetryInduction period
a b s t r a c t
There is little agreement about the mechanisms and few direct observations of the transition of cementpaste from a slurry to a solid. This paper uses four different imaging techniques at multiple length scales(from 15.6 nm to 1 lm) to follow the three-dimensional microstructural evolution of portland cement,and monoclinic tricalcium silicate (mC3S) paste over the first 16 h of hydration. Measurements of over60,000 particles captured every 10 min were made at the micron scale. Nanoscale examinations of thestructure and chemical composition are used to support this work. The results show that hydration prod-ucts with an average Ca/Si > 3 form on and near the surface of the hydrating particles prior to the accel-eration period that appears to control the reaction rate. These hydration products appear to change inchemical composition as more rapid dissolution of C3S and formation of hydration products occur duringthe acceleration period. The findings are used to provide insights into the origin of the induction andacceleration periods during hydration.
� 2019 Published by Elsevier Ltd.
1. Introduction
Despite decades of study, there is no general agreement aboutthe processes or mechanisms that govern the early age hydrationof C3S1 or portland cement paste. Improved knowledge of this pro-cess would allow for better control over cementitious materialsand improved use of both chemical and mineral admixtures. Thiswould allow for improvements in the economy, constructability,and sustainability of concrete, the most commonly used buildingmaterial in the world.
Several hypotheses have been proposed in the literature toexplain the initial dissolution of cement particles and the subse-quent formation of the microstructure. Some suggest that ahydrated layer forms at the particle surface that reduces the acces-sibility to the surrounding solution and then this material subse-quently disappears [1–3]. More recent publications have focusedon the localized formation of etch pits [4,5] or more uniform disso-lution, depending on the calcium concentration in the solution [6].Others hypothesize that early hydration products form withinthese etch pits, which slows the release of ions and controls thelocal dissolution of the anhydrous particle by covering the mostreactive sites [7–9].
Previous work studying changes in the chemical composition ofthe solution during the first 4 h of hydration of C3S with w/s from

M. Moradian et al. / Construction and Building Materials 212 (2019) 486–499 487
0.70 to 20 shows that the Si concentration, [Si], is low (between1 lmol/L and 4.5 lmol/L for w/s = 0.70) while the Ca concentrationin solution, [Ca], increases over time and reaches a maximum(�1700 mg/L for w/s = 0.70) near the end of the induction period[10]. After reaching a maximum value, [Ca] begins to decreaseand [Si] begins to increase slightly. At the same time, the heatgiven off by the reaction begins to increase [5,11,12]. It is not clearwhat causes this heat release but it has been proposed to be causedby rapid dissolution of C3S [5,11,13]. Unfortunately, these mea-surements only examined the average ionic concentration in thesolution and no information is obtained about the change inmicrostructure for these periods.
Many hydration studies use bulk measurements and so theycannot provide detailed information about the individual particlesduring the reactions. Some examples of these bulk measurementtechniques include isothermal calorimetry, chemical shrinkage,pore solution analysis, quasi-elastic neutron scattering (QENS),and nuclear magnetic resonance (NMR) [13–22]. Imaging has beenused to make complementary observations of the evolution of themicrostructure over time. This is typically done with scanning elec-tron microscopy (SEM) or transmission electron microscopy (TEM)after arresting hydration [23–26]. Hydration is typically stopped byusing isopropyl alcohol or other solvents to remove the waterthrough solvent exchange followed by drying [27–30]. The samplesare then cast into epoxy and polished or fractured and a surface isinvestigated. This process has the potential to introduce artifacts[7,24,25,28,29,31]. If an in-situ technique could be used to studythis process then more insights might be gained.
One important study used a single particle of C3S with w/s = 2.Hydration was arrested on three different samples with acetoneafter 5, 30, and 60 min [31]. The selected times corresponded tothe initial reaction, the induction period, and the onset of the accel-eration period in the calorimetry curve. After arresting hydration,the sample was broken and investigated by SEM. The authorsobserved a non-uniform layer of hydration product around theoriginal particle which grew in thickness in the induction periodand then shrank at the onset of the acceleration period. Poorlycrystallized CH precipitates were observed at the end of the induc-tion period that dissipated during the acceleration period. Thisobservation complements other publications suggesting that theformation of CH is an important feature of the transition fromthe induction period to the acceleration period [12,32,33]. The sug-gestions of the CH forming during the acceleration period and thendissipating was first introduced in [31]. This important observationis rarely discussed in the literature, perhaps because the imagequality was poor, there was no chemical analysis to support theirclaims, and there may have been concerns over the high w/s andthe use of acetone to arrest hydration.
Juenger et al. used soft X-ray transmission imaging to collecttime-lapse transmission images while C3S reacted at w/s = 5 [34].These images suggest that the hydration process is not limited tothe surface of the C3S particle and can occur inside the particleas well. However, if the transmission path of the X-rays is too long(>10 lm for anhydrous C3S), then there will be insufficient trans-mission of X-rays and so no images can be produced. Higher energyX-ray imaging techniques, such as laboratory and synchrotron X-ray Computed Tomography (XCT) allow for more than an orderof magnitude higher penetration. This can allow the 3Dmicrostructural data to be obtained non-destructively from themicron to nanometer length scale [35–43].
Recent work has combined nano-tomography and nano-X-rayfluorescence in a technique called nano-tomography assistedchemical correlation (nTACCo) to capture quantitative measure-ments of 3D structure, chemical composition, and mass densityof the hydration products. This method has been used to observeearly particle dissolution and subsequent hydration product
growth with a resolution of 50 nm [44,45]. These experimentsreveal changes in structure and chemical composition, but havenot been performed continuously.
More in-situ observations are needed of cement particles asthey react at relevant w/s. However, the acquisition time for typicalXCT is several hours and there will be artifacts created if there ismovement. Because of this, XCT is a challenging technique to useto study in-situ early age hydration reactions and often requiresthe reactions to be first arrested in order to be studied [46,47]. For-tunately, recent developments in fast data acquisition rates fromhigh-flux synchrotron sources have made it possible to collect 3Ddata at the micron scale in a few seconds [46–51]. This techniqueis named fast computed tomography (fCT). This reduction in acqui-sition time makes this technique useful for studying early cementhydration.
In this paper, four different types of imaging techniques areused to study hydration of portland cement related powders at dif-ferent length scales. These include fCT and Nano ComputedTomography (nCT) at multiple length scales. In addition, SEM withEnergy-Dispersive X-ray Spectroscopy (EDS) and Nano X-ray Fluo-rescence (nXRF) were used to evaluate compositional changes ofsome samples before and after hydration. The focus of this workis to find greater insights into the mechanisms that control thechange from the induction to the acceleration period in both port-land cement and C3S hydration.
2. Method and experiment
2.1. Materials
Cementitious materials used for the tests were NIST cementnumber 168 from the Cement and Concrete Reference Laboratory(Frederick, Maryland) (OPC) [52], and monoclinic C3S (mC3S). ThemC3S samples were produced by Mineral Research Processing(Meyzieu, France). These materials were investigated by XRF, auto-mated scanning electron microscopy (ASEM), XRD analysis,isothermal calorimetry, and Blaine fineness (ASTM C204).
The specifications and bulk chemical composition of the inves-tigated materials are presented in Table 1. The experimentaldetails of ASEM are included in other publications and the Appen-dix [38,53]. According to ASEM and Blaine fineness, OPC wasslightly finer than mC3S.
XRD analysis demonstrates that mC3S powder is close to pureC3S. XRD analysis of OPC powder can be found in another publica-tion [52]. The heat release measurements were conducted by aTam Air Isothermal Calorimeter at a constant temperature of25 �C, and the hydration rate was monitored for 24 h. More detailabout this test can be found in the Appendix.
2.2. Examination of pastes
2.2.1. Sample preparation and instruments settingFour paste samples were examined at different w/s with a pixel
size of 1 mm/voxel with fCT as reported in Table 2. Two different w/s (one lower and one higher) were used for each powder because itwas important to make a sample that was well compacted and toinvestigate the differences in performance. The technique was ableto collect a tomograph in less than 5 s. Each tomograph was acylinder that was 2016 mm wide and 1536 mm tall. These experi-ments were conducted at beamline 2-BM at the Advanced PhotonSource (APS) at Argonne National Laboratory. This is possiblebecause of advancements in detector design and high photon flux.More details about the facility and reconstruction can be found inother publications and the Appendix [50,51]. Since each scan wasonly 5 s in length, this means that each sample was only exposed

Table 1Specifications and chemical composition of binders.
Blaine (cm2/gr) Density (gr/cm3) Mass composition (%) Phase concentration (%)
SiO2 CaO Al2O3 MgO Fe2O3 SO3 C3S C2S C3A C4AF
OPC 3790 3.15 19.91 62.27 5.11 3.87 2.15 3.49 54.5 15.7 8.0 7.0mC3S 3588 3.12 26.54 71.97 0.94 0.06 0.48 – �100 – – –
Table 2Properties of fCT and calorimetry samples and scan times for fCT test.
Cementitiousmaterial
w/s Time for thefirst tomograph(hours: minutes)
Time for thelast tomograph(hours: minutes)
mC3S 0.70 1:10 15:40mC3S 0.45 1:10 15:40OPC 0.60 0:34 11:34OPC 0.40 0:34 11:34mC3S powder – – –OPC powder – – –
488 M. Moradian et al. / Construction and Building Materials 212 (2019) 486–499
to the X-ray radiation for � 7.5 min over roughly 15 h, so the dam-age from X-ray radiation is expected to be negligible. This is sup-ported by other work done with the same instrument toinvestigate inorganic materials [54]. Samples were prepared with5 g of powder and the necessary water to reach the desired w/s.Water was added to the cementitious powder, and the mixturewas stirred 10 times clockwise and 10 times counterclockwise ina vial by a stainless steel rod. Then the vial was placed in a VortexMixer produced by Stuart (Staffordshire, UK) and mixed with aspeed of 1000 rpm for three minutes. The same procedure wasused for the calorimetry test but 3 g of powder was used. Moredetail about mixing and sample preparation are discussed in theAppendix. Dry powders were also investigated to aid in the seg-mentation of the data sets. This will be discussed in Section 2.2.3.
2.2.2. Overview of fCT and XCTSample alignment took between 34 and 70 min. After align-
ment, 3D tomographs were collected every 10 min. Fig. 1 showsthe 3D tomograph and a typical slice from the mC3S sample withw/s = 0.70. The gray values in the XCT and fCT datasets correlateto the X-ray absorption of the material. Therefore, a change in grayvalue for a given location could be attributed to the difference inchemical composition, density, or both. These gray values allowthe data to be separated into different constituents and then quan-titatively evaluated. This process is called segmentation. A seg-mented or binary image showing the material with high X-rayabsorption is shown in the lower right of Fig. 1. The steps usedto create this image will be discussed in the next section and theAppendix.
2.2.3. Image processingFirst, a median filter (radius of 2.5 lm) was used to remove
noise. Next, ranges of gray values were chosen to separate the dif-ferent materials for data processing. To help guide this decision,the dry powder was scanned and the bulk density was measured.By using the bulk density and the volume of the container, the vol-ume of the powder was calculated. Once the volume of powderwas known, different threshold values were chosen and the vol-ume was estimated and compared to the calculated volume ofpowder. This threshold level was used to determine the gray valuethat indicates the anhydrous material. The anhydrous material andall hydration products with similar X-ray absorption will be knownas high absorption material for this work. The calculated thresholdvalue was applied to all collected tomographs and the single voxel
regions were removed from the data as they are at the spatial limitof the method and so could not be investigated reliably.
Because there was not a clear difference in the gray values ofthe different materials, it was decided to separate the data intolow and high X-ray absorption material due to the high X-rayenergy level in fCT measurements. The low-absorption materialconsists of voids, water-filled space, mixtures of water and submi-cron anhydrous particles, and low-density hydration products. Thehigh-absorption material consists of everything else, includinganhydrous cement and some hydration products close to the sur-face of the anhydrous cement grains with an X-ray absorption sim-ilar to or higher than the original reactant.
A limited region of the sample that is 1000 lm in diameter by100 lm in height was used for the analysis. This region was usedto reduce the computational expense and also to avoid beam hard-ening artifacts that may occur near the edges. This allowed over60,000 particles to be investigated from each sample in the regionof interest. The same settings were then used to segment the high-absorption material in the slurry scans. Fig. 1 shows a region of across section before and after the segmentation of high-absorption materials.
The slurry samples contain water, but this should have minimalimpact on the measured gray values, as water has a low X-rayabsorption. In medical CT scans it is common to use a fixed rangeof gray values for segmentation regardless of the surrounding fluid[55]. The sensitivity of the results of the segmentation was inves-tigated by altering the segmentation values by ±2.5% of the calcu-lated threshold value. These differences were chosen based on theexpected variation that may occur from the bulk density calcula-tion of the powder. Over this range of values, the same trends wereobserved and the magnitudes only slightly changed. Therefore, theselected segmentation method seems reliable. More details aboutsegmentation and quantification can be found in the Appendix.
2.3. Examination of individual particles
A collection of individual particles was investigated with otherimaging techniques at higher resolutions to complement the fCTdata. Because of the high resolution of these techniques, only afew microns of a sample could be scanned. In addition, the sourceenergy of the instruments is low at nano scale resolutions and sothe samples have to be small enough to obtain high-quality data.These explain why individual particles (and not paste) werehydrated and examined for this section. These particles were epox-ied to the end of a graphite rod and then allowed to react in higherw/s solutions. These more dilute solutions were used to allow forimaging. The reaction of cement particles in dilute solutions israpid because of the undersaturation of the solution surroundingthe particles [56]. To address this, the particles were immersedin 15 mM lime or saturated lime + gypsum solutions. These solu-tions were shown to have heat evolution curves comparable to sus-pensions with w/s from 0.5 up to 5.0 [1,56]. SO4 ions were used inthis solution as it is more representative of the pore solution inportland cement. nCT was used to investigate the microstructuralchange of the reacting particles, while SEM/EDS and nXRF wereconducted to obtain chemical information from individualparticles.

Fig. 1. Examples of the 3D reconstruction, a 2D slice, and a region before and after segmentation of high-absorption materials from mC3S paste with w/s = 0.70.
M. Moradian et al. / Construction and Building Materials 212 (2019) 486–499 489
2.3.1. nCTA 3D tomograph was acquired at nanoscale resolution both
before and after a certain period of reaction. The measurementswere made using an UltraXRM-200 with an X-ray energy 8.3 keVat a voxel size of 130 nm and with an Ultra 810 with an X-rayenergy of 5.3 keV at 65 nm and 15 nm/voxel. The details of theinstruments can be found in the Appendix. The lower X-ray energylevels of these imaging methods provide higher contrast to the X-ray absorption of the hydration products. This gives more insightsinto the hydration products that might not be detected with thehigher energy imaging methods, such as fCT.
Two samples with a collection of particles on the tip of a gra-phite rod were investigated for hydration periods of 2 h and 10 hwith w/s = 5 in a solution saturated with lime + gypsum. The sche-matic of the test setup is shown in the Appendix. Both sampleswere imaged before and after the reaction to compare theirchanges relative to their initial state. After the initial scan, the sam-ple was placed in a N2 environment and then added to a sealed cellfor the reaction. The cell was stored in the N2 environment to pro-tect it from carbonation as it hydrated. The reactions were thenarrested by 99% isopropyl alcohol after the desired time of hydra-tion and the sample was scanned again with nCT.
A computer algorithm for 3D image registration was created toalign the two scans [37,44]. A qualitative segmentation of the
anhydrous C3S and hydration product was completed by choosinggray values that adequately separated the materials and mini-mized background noise. The threshold values for anhydrous C3Swere chosen to match the border of the sample as found by thenXRF scans. Since the nXRF shows the high contrast between airand solid material, this was useful to compare the data sets. Thismethod has been successfully used in the past [45].
2.3.2. Changes in chemical composition2.3.2.1. nXRF and nTACCo. The chemical composition of the reactedparticles in nCT was investigated with nXRF. In this technique, aprimary X-ray beam illuminates the sample and X-ray fluorescenceradiation leaving the sample is detected by a four-element silicondrift diode detector that is perpendicular to the X-ray beam direc-tion (Vortex ME4) [57]. The measurements were conducted withan X-ray spot size smaller than 50 nm at the hard X-ray nano-probe beamline at sector ID-26 of the Advanced Photon Source(APS) and the Center of Nanoscale Materials (CNM) at ArgonneNational Laboratory. Details about calibration and analysis can befound in the Appendix and in other publications [44,57].
Nano-tomography assisted chemical correlation (nTACCo) is atechnique that combines nCT and nXRF data. By fusing the 3Dstructural information into the 2D chemical mapping, the elemen-tal density (g/cm3) can be measured for intermixed phases at the

490 M. Moradian et al. / Construction and Building Materials 212 (2019) 486–499
nanometer length scale. The details of this procedure are given inprevious publications and the Appendix [37,44,45].
Fig. 2. Volume change of high-absorption material versus time after mixing.
2.3.2.2. SEM/EDS. To learn more about the changes in the surfacechemical composition, OPC and mC3S particles were examined bySEM/EDS analysis in the same orientations and locations beforeand after being placed in dilute 15 mM lime solution with w/s = 10 and then subsequently in isopropyl alcohol. A typical samplecan be seen in the Appendix.
Since the goal of this work was to investigate the changes in thesurface chemical composition at known locations, no samplepreparation or surface coatings were used. Previous work hasshown that this method of investigation showed agreement withnXRF of hydration products and so a validation of the procedureis not presented [45].
For this analysis, several samples were investigated before andafter hydration for OPC and mC3S. The samples were carefullyaligned after reaction so that the same orientation and locationswere investigated. Different samples were investigated after5 min, 10 min, 20 min, and 36 min of hydration in 15 mM limesolution with w/s = 10. Points were only investigated if the Ca/Siwas less than 4. This is done to exclude points that are likely tobe CH.
3. Results
3.1. Paste samples
3.1.1. Changes in high-absorption materialFig. 2 illustrates the changes of the volume of high-absorption
materials during hydration. These measurements are based onthe volume of more than 60,000 particles. Since it took time toalign the samples, there are no tomography data for the early agehydration of the pastes.
In all samples, the volume of the high-absorption materialsincreased to a maximum value and then decreased and did notchange. The initial increase was not observed in mC3S with w/s = 0.45; however, the peak could have occurred prior to the firsttomograph at 70 min. For all samples, the volume of high-absorption material is higher than the estimated volume of theanhydrous powder at the time of mixing. This observation willbe discussed in detail throughout the paper. The increase washigher for pastes with higher w/s.
The shape of the curve is similar for all four samples. This repro-ducible behavior by different samples and materials is not likely tobe an artifact. Instead, the maximum appears to be a real event inthe hydration of both mC3S in calcium + gypsum solution and port-land cement. This seems to be the formation of high X-ray absorp-tion hydration product that then changes to hydration productwith a lower absorption. Furthermore, the observed changes areseveral times higher than the variation after � 5 h when the dataare not changing. This suggests that these changes observed inthe first � 5 h of hydration are significant.
To examine the sensitivity of these measurements to the seg-mentation method, the gray value thresholds for mC3S paste withw/s = 0.70 were varied by ±2.5%. While the changes in the thresh-old value did affect the magnitude of the measured values, they donot change the trend and timing of the curves. Therefore, the seg-mentation procedure seems to be robust enough for the conclu-sions drawn. The details of this analysis can be found in theAppendix.
Fig. 3 shows the isothermal calorimetry and the percentage ofhigh-absorption material on the same plot. Since the preparationof the paste samples for fCT uses the same mixing procedure asthe calorimetry experiment, the results from two different experi-
ments should be comparable and provide insight into correlationsbetween the microstructural changes and the rate of reaction.
The increase in the high-absorption material appears to occurduring the induction period. Others have suggested that hydrationproducts begin forming as soon as the solution is introduced toanhydrous particles [10,12,31]. If these hydration products formon the surface of the original high-absorption material then thiscould explain why the material is observed to increase in size.
The decrease in the high-absorption material occurs at thebeginning of the acceleration period, except in OPC with w/s = 0.6, which could occur if the products are not stable or if thelocal solution chemical composition changes enough to cause thesehydration products to dissolve or transform to another phase withdifferent chemical composition. The high-absorption materialstays almost constant in volume as the acceleration period contin-ues; however, the calorimetry curves suggest the rates of reactionare still high. The OPC system has a greater volume increase andheat release than the mC3S powder. This may occur because ofthe lower w/s, particle size distribution, differences in chemicalcomposition, and the simultaneous formation of multiple hydra-tion products. While bulk observations of the change in the high-absorption material are useful, investigation of individual particlescould provide more insight into what is occurring.
3.1.2. Change of high-absorption material in individual particlesSingle mC3S and OPC particles were investigated to determine
how particles of different sizes change over time. The particleswere categorized into three diameter ranges between 8 lm and60 lm. The number of individual particles investigated can befound in the Appendix. Particles smaller than 8 mm could not bemeasured reliably with the method in all time periods.
Fig. 4 shows the volume change of high-absorption materials ofindividual particles with respect to their volume in the first col-lected tomograph (70 min for mC3S and 34 min for OPC). The abso-lute volume change was calculated by subtracting the volume ofthe particle at the target time period from the volume of the parti-cle in the first measurement. The percentage change was calcu-lated by normalizing the absolute volume change to the volumeof the particle at first measurement. Each point shows the averagevolume change of the investigated particles. One standard error(SE) of the mean is also reported in the graphs. The standard errordepends on both sample size and standard deviation and is used tocalculate a confidence interval around the mean [58]. The varia-tions for the larger particles are wide because there was a large

Fig. 3. Comparison of isothermal calorimetry to the volume change of high-absorption material from fCT (arrows in the graphs point to the corresponding Y-axis for eachcurve).
M. Moradian et al. / Construction and Building Materials 212 (2019) 486–499 491
difference in the starting diameters of these particles. Despite thishigh variation, the averages show that there are distinct perfor-mances of different sized particles:
� All particles, except the smallest group in the OPC sample, hadan increase in the volume of high-absorption materials followedby a decrease.
� The volume percentage change of high-absorption materials insmaller particles was higher than for the larger ones over theperiod of the test.
� The absolute volume of high-absorption materials in the largerparticles changed more than smaller particles. This could besimply due to the fact that the quantity of large particles is morethan the quantity of small particles.
The general performance of the individual particles was inaccordance with the trends of the changes in total particle volumeexcept that an initial increase in high-absorption volume was notobserved in the smallest particles of OPC. It is possible that the ini-tial increase in high-absorption occurred before the first collecteddata set.
After the initial volume change, the larger particles seem tohave a negligible change in volume while the smaller particles
are monotonically decreasing in volume. Since the smaller parti-cles have a higher surface to volume ratio this would promotemore rapid dissolution. On the other hand, the larger surface areaof the larger particles make them more likely to serve as points ofnucleation and therefore they appear to grow in size over the firstthree hours of hydration [59].
These results provide insights as to why the change in volumeof high-absorption material can be almost constant while thecalorimetry results suggest that there is a continued reaction.The particles that are smaller than 8 lm – which were not directlyobserved – are likely to continue to dissolve. Since the large parti-cles account for the majority of the volume of the paste theirbehavior will govern the observed volume changes. Given thatfCT can only observe the high-absorption material, these measure-ments do not provide a comprehensive picture of all hydrationproducts. Nevertheless, these observations are useful in under-standing the complex nature of hydration.
Three-dimensional reconstructions of three mC3S particles atw/s = 0.70 in different size ranges are shown in Fig. 5. The volumeof high-absorption material and average diameter are alsoreported. The particles are shown at the first measurement andthen at different time periods that match critical times in hydra-tion as suggested by the calorimetry curve. Regions that appear

Fig. 4. Percentage and absolute volume change in individual high-absorption particles with respect to the initial volume at 34 min for OPC and 70 min for mC3S pastes.
492 M. Moradian et al. / Construction and Building Materials 212 (2019) 486–499
to have decreased X-ray absorption to where they would not beconsidered low absorption material are shown in green. Theseare regions where part of the anhydrous particle is no longerdetected as high-absorption materials. This space may now befilled with fluid and/or low absorption hydration products. Regionsthat appear to have increased X-ray absorption are shown in darkgray.
Smaller high-absorption particles show more volume decreaseand the larger particles show growth. The 3D renderings show thatsome regions near the surface of the anhydrous particles increasewhile others decrease in X-ray absorption. These regions of changeseem to be found at only a few locations on the surface and do notoccur uniformly. This could be attributed to enhanced reactivity atcrystallographic defects or mechanical damage sites as suggestedin other publications [8,13,44,60–64]. A recent study of hydrationof C3A particle showed non-uniformly reacted surface with the
hydration products on surfaces varying in thickness up to 1 to1.5 lm after 143 min of hydration in the presence of gypsum andwater as observed by nCT at a voxel resolution of 20 nm [65].
3.2. Complementary experiments on individual particles
3.2.1. Microstructure observations by nCTThe nCT results for a collection of mC3S particles are shown in
Figs. 6 and 7 for hydration periods of 2 h and 10 h. These periodsshow the evolution of the microstructure from the induction per-iod to the end of the acceleration period. The slice images fromthree different locations from both before and after hydration arelabeled on the 3D reconstruction by dashed lines. The 3D recon-structions also show where hydration product has formed whereit was not previously present.

Fig. 5. Three Dimensional views of three mC3S particles from different size ranges in critical time periods.
M. Moradian et al. / Construction and Building Materials 212 (2019) 486–499 493
The sample that has hydrated for 2 h shows that hydration pro-duct forms directly on the surface of the particle and also extendsover a micron away from the original particle. The hydration pro-duct that covers the surface of the anhydrous particle has a thick-ness between 60 and 100 nm. A product layer of this thicknesswould not be expected to be detected by the fCT experiments.However, the product that extends from the anhydrous particlesurface could be detected. Furthermore, as particles hydrate inproximity to one another in lower w/s then this could create moreextended product growth that would be detected. This has beenobserved in previous publication where collections of particleswere observed in similar experiments [45].
The product occurs on only certain local regions of the particlesurface while other regions remain almost unreacted. This non-uniform reaction of a pure anhydrous C3S particle has beenreported in previous publications to be caused by a high densityof defects or differences in crystal structure [4,6–9,44].
After 10 h of hydration, the isolated regions of hydration pro-duct that were observed at 2 h are no longer present. Instead, thesample shows a high degree of reaction with a decrease in theanhydrous boundary by as much as 1 mm. This change in the anhy-drous particle dimensions will contribute to the decrease in high-absorption material observed in the fCT data.
Although the overall volume of the particle shows an increase insize from the formation of hydration product, if these products aremade up of a hydration product with a low X-ray absorption thenthis may explain why they are not observed in the fCT dataset. Thisinterpretation is consistent with the observations of the individualparticles in the fCT datasets shown in Fig. 4, where particles that
range in size from 8 to 20 mm show a significant decrease in thevolume of high-absorption material at the end of the accelerationperiod. This could be explained by changing chemical compositionand/or structure over time. This will be addressed in more detailafter discussing the chemical composition of the hydrationproducts.
3.2.2. Observations of chemical composition3.2.2.1. nXRF and nTACCo. The elemental maps for Ca, Si, S
�and Ca/Si
from nXRF are shown in Fig. 8 and results from nTACCo are given inTable 3. The average density and one standard deviation are
reported for [Ca], [Si], [S�], and molar Ca/Si. The maps at 2 h and
10 h are both normalized to the maximum value for each elementin the figure. The volume of anhydrous mC3S and hydration prod-ucts, obtained from nCT dataset, is also included in Table 3. Thechemical composition of the anhydrous samples from each timeperiod is very similar, with a maximum difference in elementaldensity of 0.02 g/cm3. This shows the reproducibility of themeasurement.
For the sample hydrated for 2 h, the Ca/Si map shows that thehydration product was almost entirely above 4, and several loca-tions were observed with a Ca/Si above 10. These regions with aCa/Si above 10 are likely almost pure CH and were excluded fromthe averages in Table 3.
For the 10 h data, the Ca/Si of the hydration product is around 2and there were no regions of Ca/Si above 10, but there is a regionwhere the Ca/Si is above 4. The average Ca/Si is 2.3 for the hydra-tion product and the sulfur density has decreased 5-fold when

Fig. 7. The nCT dataset for an mC3S particle showing the 3D structure and threedifferent cross sections before and after 10 h of hydration in saturated lime+ gypsum solution.
Fig. 6. The nCT dataset for an mC3S particle showing the 3D structure and threedifferent cross sections before and after 2 h of hydration in saturated lime + gypsumsolution.
494 M. Moradian et al. / Construction and Building Materials 212 (2019) 486–499
compared to the hydration product at 2 h. This suggests that thehydration product at 10 h could be mainly C-S-H with only localintermixing of CH.
The decrease in Ca/Si while Si remains almost constant in thehydration product from 2 h to 10 h is an important observation. Oneexplanation is that the hydration product at 2 h contains soluble
phases that are rich in [Ca] and [S�] (such as calcium hydroxide
and calcium sulfate) that dissolve between 2 h and 10 h of hydra-tion. This change in chemical composition is expected to alter theX-ray absorption of the material and this would change how thematerial is observed in the fCT experiments.
To further investigate this change in X-ray absorption, the massattenuation coefficients for mixtures of C-S-H and CH with H/Sbetween 1.2 and 4 and Ca/Si between 4 and 7.5 were calculated,and shown to produce an X-ray absorption similar to anhydrousC3S. The details are included in the Appendix. Therefore, the hydra-tion product formed at 2 h with Ca/Si = 4.40 ± 2.39 would beexpected to have an X-ray absorption similar to C3S. This couldexplain why this hydration product would cause an apparentgrowth in the high-absorption material measured by fCT. As Ca/Si is reduced to 2.3 ± 0.21 at 10 h, the X-ray mass attenuation coef-ficient of the hydration product would be between 20% and 27%lower than anhydrous C3S and so it would be identified as low-absorption material in the fCT analysis.
3.2.2.2. SEM/EDS investigation. Analysis with SEM-EDS was used toprovide a measurement of the chemical composition of the surfacematerials. The method was first used to make repeated measure-ments on the surface of the anhydrous OPC and mC3S particles toexamine the repeatability of the method and determine an initialchemical composition at the surface. A repeat measurement ofanhydrous OPC was completed for two samples and the individualmeasurements show less than 1% difference for the mean and stan-dard error in all measurements except Al showed a 1.9% differencein the mean. The differences in [Al] could be caused by differentamounts of C3A and C4AF in the analyzed material. This shows thatthe method is repeatable.
Next several OPC and mC3S particles were investigated bothbefore and after hydration for 5, 10, 20, and 36 min in 15 mM limesolution with w/s = 10. As described in the Methods, the sampleswere carefully aligned before and after the reaction to measurethe chemical composition changes. The normalized mass percent-age of Ca, Si, O, Fe, and Al before and after hydration can be foundin the Appendix. The molar Ca/Si ratio is used to provide additionalinsight and allow comparison with other measurements. This ratiomay be more accurate than the separate elemental contents,because this technique uses normalized elemental content andnot actual concentrations. The average variation of Ca/Si betweentwo repeat measurements of anhydrous materials was 0.1.
Fig. 9 shows the change in Ca/Si in different testing conditions.One standard error is also reported on the curves. The figure showsthat the Ca/Si of the anhydrous samples were close to 3.0 asexpected. The OPC particles hydrated for 5 min show that the Ca/Si changed from 2.8 to 3.5, which could represent the initial forma-tion of hydration products. The Ca/Si in mC3S particles did notchange considerably after 5 min. This may reflect the higher reac-tivity of OPC compared to mC3S as observed by the calorimetrycurves and volume change in fCT data from Fig. 3.
In each system, the measured Ca/Si increased until 20 min andthen started to decrease. At 20 min there was an increase in Ca/Siof 36% and 19% for OPC and mC3S, respectively, which is greaterthan the standard error. Further investigation suggests that [Ca]seems to be increasing while [Si] is almost constant. This couldmean that these materials are a mixture of C-S-H and CH with alarger amount of CH or possibly another hydration product that
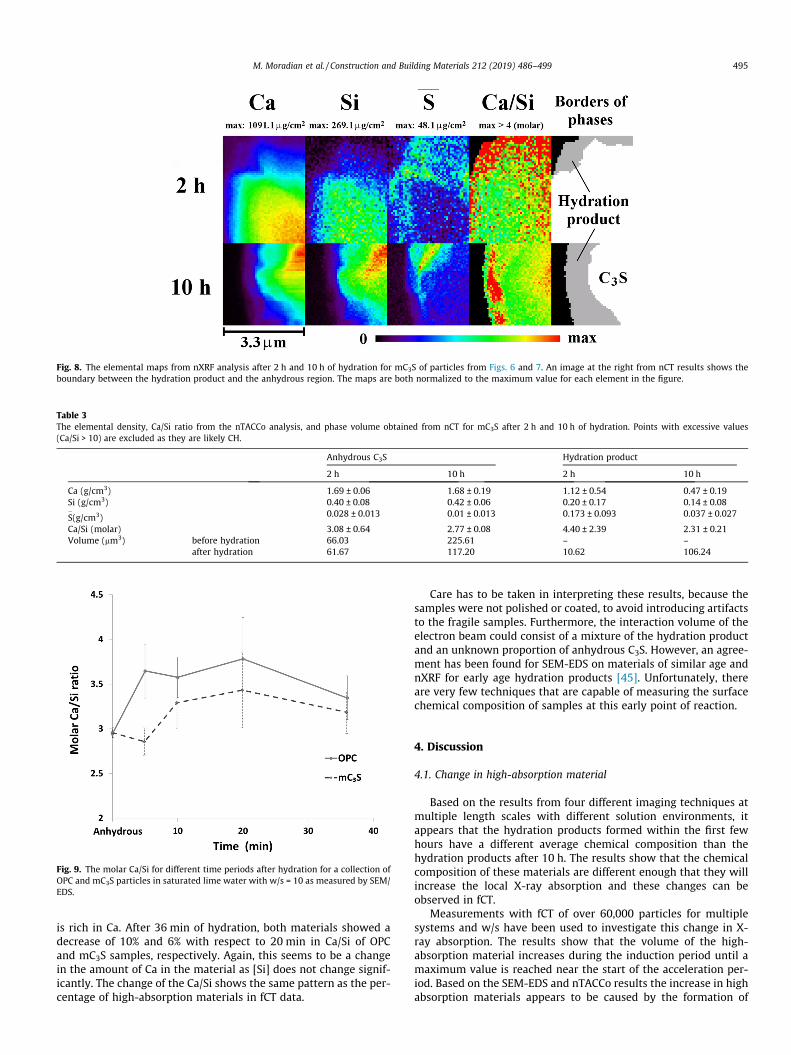
Fig. 8. The elemental maps from nXRF analysis after 2 h and 10 h of hydration for mC3S of particles from Figs. 6 and 7. An image at the right from nCT results shows theboundary between the hydration product and the anhydrous region. The maps are both normalized to the maximum value for each element in the figure.
Table 3The elemental density, Ca/Si ratio from the nTACCo analysis, and phase volume obtained from nCT for mC3S after 2 h and 10 h of hydration. Points with excessive values(Ca/Si > 10) are excluded as they are likely CH.
Anhydrous C3S Hydration product
2 h 10 h 2 h 10 h
Ca (g/cm3) 1.69 ± 0.06 1.68 ± 0.19 1.12 ± 0.54 0.47 ± 0.19Si (g/cm3) 0.40 ± 0.08 0.42 ± 0.06 0.20 ± 0.17 0.14 ± 0.08
S�(g/cm3) 0.028 ± 0.013 0.01 ± 0.013 0.173 ± 0.093 0.037 ± 0.027
Ca/Si (molar) 3.08 ± 0.64 2.77 ± 0.08 4.40 ± 2.39 2.31 ± 0.21Volume (mm3) before hydration 66.03 225.61 – –
after hydration 61.67 117.20 10.62 106.24
Fig. 9. The molar Ca/Si for different time periods after hydration for a collection ofOPC and mC3S particles in saturated lime water with w/s = 10 as measured by SEM/EDS.
M. Moradian et al. / Construction and Building Materials 212 (2019) 486–499 495
is rich in Ca. After 36 min of hydration, both materials showed adecrease of 10% and 6% with respect to 20 min in Ca/Si of OPCand mC3S samples, respectively. Again, this seems to be a changein the amount of Ca in the material as [Si] does not change signif-icantly. The change of the Ca/Si shows the same pattern as the per-centage of high-absorption materials in fCT data.
Care has to be taken in interpreting these results, because thesamples were not polished or coated, to avoid introducing artifactsto the fragile samples. Furthermore, the interaction volume of theelectron beam could consist of a mixture of the hydration productand an unknown proportion of anhydrous C3S. However, an agree-ment has been found for SEM-EDS on materials of similar age andnXRF for early age hydration products [45]. Unfortunately, thereare very few techniques that are capable of measuring the surfacechemical composition of samples at this early point of reaction.
4. Discussion
4.1. Change in high-absorption material
Based on the results from four different imaging techniques atmultiple length scales with different solution environments, itappears that the hydration products formed within the first fewhours have a different average chemical composition than thehydration products after 10 h. The results show that the chemicalcomposition of these materials are different enough that they willincrease the local X-ray absorption and these changes can beobserved in fCT.
Measurements with fCT of over 60,000 particles for multiplesystems and w/s have been used to investigate this change in X-ray absorption. The results show that the volume of the high-absorption material increases during the induction period until amaximum value is reached near the start of the acceleration per-iod. Based on the SEM-EDS and nTACCo results the increase in highabsorption materials appears to be caused by the formation of

496 M. Moradian et al. / Construction and Building Materials 212 (2019) 486–499
hydration products that are rich in CH and CS�with an average
Ca/Si > 4.The changes of individual high-absorption particles from fCT
show that particles smaller than 20 lm decrease in size with timewhile the larger particles increase in size. This decrease in particlesize is caused by a higher amount of dissolution than the formationof hydration products. This same process may be happening on allparticles, but the smaller particles may show these changes to agreater degree, because of the larger density of defects and/or theirhigher surface area to volume ratio and therefore higher reactivityof the smaller particles [61,66].
One important observation in the particles larger than 20 lm isthat the amount of high-absorption material increases until thebeginning of the acceleration period and then decreases. The nXRFand nTACCo results suggest that the Ca and S
�concentration in the
hydration products is greater at 2 h of hydration than at 10 h. Infact, the Ca/Si at 10 h is 2.3 compared to 4.40 at 2 h of hydration.These changes in chemical composition and density may causethe X-ray absorption to decrease, which decreases the contrast in
Fig. 10. Schematic demonstration of the proposed mechanism; a) region of defect onwithin, c) increased ionic concentration within the pit and formation of hydration prodconcentration increases within the pit, e) ion concentration increase continues and CH anuntil hydration products form in the bulk solution, g) the hydration product formationsurface of the more slowly reacting surface of the anhydrous particle, h) surface of part
the fCT data and consequently reduces the detected amount ofhigh-absorption material.
4.2. Insights into the cause of the induction and acceleration period
Based on the findings from this work and others[10,12,31,44,45] important insights are provided into hydration.Conceptual images of this process are included in Fig. 10 to accom-pany the explanation.
Anhydrous C3S has surfaces with different levels of reactivity asshown in Fig. 10a. When these reactive regions are exposed to thesolution they will cause etch pits on the surface of the reactinggrains as shown in Fig. 10b [4–6,8]. The smaller particles may havea higher density (quantity-of-defects/volume) of these regions andthis could cause their rapid dissolution as shown with fCT resultsin this paper. This could also be caused by smaller particles havinga higher number of exposed lattice plane edges that would initiatedissolution [67,68].
anhydrous cement particle, b) formation of etch pit with high ionic concentrationucts, d) the region of defect continues to react but at a reduced rate and local iond CS
�precipitate within the pores of the C-S-H, f) ion concentration builds in solution
in the bulk solution causes the CH and CS�precipitates to dissolve and modifies the
icle is covered by hydration products and this slows dissolution.

M. Moradian et al. / Construction and Building Materials 212 (2019) 486–499 497
Because of the pit geometry, the ion concentration may becomehigh enough that hydration products start forming within the pitas shown in Fig. 10c. Experiments investigating hydration of tri-clinic C3S with nTACCo in w/s = 5 have found C-S-H with Ca/Si = 1.53 and 1.68 and a mass density of 1.34 and 1.69 g/cm3 fillingthese pits during the induction period [44]. This density and chem-istry of the C-S-Hmatch the measurements for inner product C-S-Hthat is several months old [69,70]. These reacted regions werefound in� 34% of the volume of the particles investigated with vol-umes between 17 lm3 and 98 lm3 at 2 h of hydration. This is a sig-nificant amount of material that has dissolved. The ions will causethe formation of hydration products and increase the ion concen-tration in the bulk solution.
The C-S-H formed in the pit will decrease the access of solutionto the fast reacting surfaces and this will slow the rate of reaction.As the reactive surface continues to react, it will continue to releaseions that will be forced to travel through the C-S-H to escape thepit. As this process continues the local ionic concentration withinthe pit will increase (Fig. 10d). Once the concentration is high
enough this will cause precipitates such as CH and CS�to form
within the pores of the C-S-H (Fig. 10e). Since these pores areexpected to be fine, these precipitates may be only a few nanome-ters in size. Fig. 8 shows observations of localized concentrations of
CH and CS�at 2 h of hydration (i.e., during the induction period).
Once these precipitates form they increase the X-ray absorptionof the hydration products. This is why the fCT shows an increasein the high-absorption material.
The ionic concentration of Ca in the pore solution increases dur-ing the induction period until hydration products start forming inthe bulk solution [10,12] as shown in Fig. 10f. Since these precipi-tates are not constrained they will be much larger than the nano
CH and CS�. Because of the large size difference, the smaller crystals
are expected to dissolve while the larger precipitates grow throughOstwald ripening.
The 10 h nTACCo results show that the hydration product has aCa/Si � 2.3 ± 0.21, which is much lower than the Ca/Si � 4.4 ± 2.39at 2 h. This supports the idea that the chemical composition of thehydration product is changing and lowering the X-ray absorption.This reduction in X-ray absorption supports the changes in high-absorption material observed by fCT in Fig. 2.
After 10 h of hydration, it appears that there is dissolution of allregions on the surface of the C3S particle. While the observations inthis paper do not reveal why surfaces change their reactivity dur-ing the acceleration period, one possible explanation is that theslowly reacting regions may be hydroxylated or covered with ahydration product such as a metastable layer [2,13,71–73]. Thedrop in the ionic concentration at the start of the acceleration per-iod may disturb this layer and allow all surfaces to begin reacting.More work is needed to better understand this.
Another observation made at 10 h is that the particle surface iscovered inhydrationproducts (Fig. 10h). Theseproductsmay reducethe availability of the solution to the surface and then slow the dis-solution and therefore the reaction of the surface. This may beresponsible for the deceleration period. Others have suggested thatreactive surfaces may be obscured by hydration products [1–3].
This interpretation of the measurements gives insights into aplausible explanation for the onset of the induction period, fol-lowed by rapid cement dissolution during the acceleration period,and later by the slowing of reaction during the deceleration period.This interpretation is based on observations using several X-rayimaging methods to measure the structure and chemical composi-tion of the hydration products. It suggests that a detailed under-standing of both composition and structural changes is needed toaccurately describe these phenomena. Additional work is under-
way to make a larger number of observations as well as nano-scale in-situ measurements of these critical periods. Ultimatelythis work will be useful to build mechanistic numerical modelsthat can more accurately predict the behavior of hydrating cementsystems. This could also be used to provide new insights intoadmixture design and manufacturing processes of cement toimprove performance.
5. Conclusions
This paper provides observations of the evolution of OPC andmC3S during hydration over the first 16 h by using four differentimaging methods. A strength of the current study is the use offCT to observe 3D changes of roughly 60,000 particles at 1 lmvoxel size. These observations are then supported by nanoscaleobservations in dilute solutions with nCT. Quantitative measure-ments of the chemical composition and structure at the nanoscalewere made by nTACCo. The following conclusions can be drawn:
� Micron-scale measurements show that the volume of the highX-ray absorption material increases during the induction periodand seems to form on the surface of the particles >20 lm, whilethe particles smaller than 20 lm show primarily dissolution.These same measurements show that as the acceleration periodbegins the X-ray absorption of the hydration product decreases.
� Nanoscale measurements during the induction period for 2 h ofhydration in a saturated lime + gypsum solution found an aver-age Ca/Si of 4.4 (±2.39), while the same measurements on par-ticles after 10 h of hydration found an average Ca/Si of 2.31(±0.21).
� After 2 h of hydration, some regions have Ca/Si > 10 which are
likely to contain CH and phases with high S�content.
� Both the nano and micron scale measurements show non-uniform growth and dissolution on the surface of the reactingparticles. The nanoscale measurements show that at 2 h ofhydration the hydration products extend only a few micronsaway from the particle surface.
This work provides novel observations into the formation andsubsequent change in chemical composition of early age hydrationproducts. Based on these observations several mechanisms aresuggested that could control the induction and acceleration periodin cement hydration. This work shows the value of combiningtime-resolved imaging at different length scales and the insightsthat they can provide on complicated physical and chemicalprocesses.
Conflict of interest
None.
Acknowledgment
This work was sponsored by funding from Federal HighwayAdministration (FHWA) Exploratory Advanced Research (EAR) pro-gram and funding from the United State National Science Founda-tion CMMI 1150404 CAREER Award. We thank our collaborators,Brad Chmelka (University of California, Santa Barbara), AndreasLüttge and Rolf Arvidson (University of Bremen), Denise Silva andJosephine Cheung (GCP Applied Technologies), and Larry Robert(Roberts Consulting), for their insightful advice on this work. A spe-cial thanks are also given to Narges Nourian for all of her help onwith the data analysis. The XRD measurements were made atGCP by Jeffrey Nicolich.

498 M. Moradian et al. / Construction and Building Materials 212 (2019) 486–499
Use of the Center for Nanoscale Materials and the AdvancedPhoton Source, both Office of Science user facilities, was supportedby the U.S. Department of Energy, Office of Science, Office of BasicEnergy Sciences, under Contract No. DE-AC02-06CH11357.
Appendix A. Supplementary data
Supplementary data to this article can be found online athttps://doi.org/10.1016/j.conbuildmat.2019.04.013.
References
[1] J.G.M. Dejong, H.N. Stein, J.M. Stevels, Hydration of tricalcium silicate, J. Appl.Chem. 17 (9) (1967) 246–250.
[2] H.M. Jennings, P.L. Pratt, Experimental argument for the existence of aprotective membrane surrounding portland-cement during the inductionperiod, Cem. Concr. Res. 9 (4) (1979) 501–506.
[3] H.N. Stein, J.M. Stevels, Influence of silica on hydration of 3cao, Sio2, J. Appl.Chem. 14 (8) (1964) 338.
[4] P. Juilland, E. Gallucci, Morpho-topological the mechanisms and kineticregimes of alite dissolution, Cem. Concr. Res. 76 (2015) 180–191.
[5] K.L. Scrivener, P. Juilland, P.J.M. Monteiro, Advances in understandinghydration of Portland cement, Cem. Concr. Res. 78 (2015) 38–56.
[6] J.W. Bullard, G.W. Scherer, J.J. Thomas, Time dependent driving forces and thekinetics of tricalcium silicate hydration, Cem. Concr. Res. 74 (2015) 26–34.
[7] F. Bellmann, T. Sowoidnich, H.M. Ludwig, D. Damidot, Dissolution rates duringthe early hydration of tricalcium silicate, Cem. Concr. Res. 72 (2015) 108–116.
[8] P. Juilland, E. Gallucci, R. Flatt, K. Scrivener, Dissolution theory applied to theinduction period in alite hydration, Cem. Concr. Res. 40 (6) (2010) 831–844.
[9] L. Nicoleau, M.A. Bertolim, Analytical model for the alite (C3S) dissolutiontopography, J. Am. Ceram. Soc. 99 (3) (2016) 773–786.
[10] P.W. Brown, E. Franz, G. Frohnsdorff, H.F.W. Taylor, Analyses of the aqueousphase during early C3s hydration, Cem. Concr. Res. 14 (2) (1984) 257–262.
[11] K.L. Scrivener, A. Nonat, Hydration of cementitious materials, present andfuture, Cem. Concr. Res. 41 (7) (2011) 651–665.
[12] J.F. Young, H.S. Tong, R.L. Berger, Compositions of solutions in contact withhydrating tricalcium silicate pastes, J. Am. Ceram. Soc. 60 (5–6) (1977) 193–198.
[13] J.W. Bullard, H.M. Jennings, R.A. Livingston, A. Nonat, G.W. Scherer, J.S.Schweitzer, K.L. Scrivener, J.J. Thomas, Mechanisms of cement hydration, Cem.Concr. Res. 41 (12) (2011) 1208–1223.
[14] D.H.C. Harris, C.G. Windsor, C.D. Lawrence, Free and bound water in cementpastes, Mag. Concr. Res. 26 (87) (1974) 65–72.
[15] B. Lothenbach, F. Winnefeld, C. Alder, E. Wieland, P. Lunk, Effect oftemperature on the pore solution, microstructure and hydration products ofPortland cement pastes, Cem. Concr. Res. 37 (4) (2007) 483–491.
[16] I. Pane, W. Hansen, Investigation of blended cement hydration by isothermalcalorimetry and thermal analysis, Cem. Concr. Res. 35 (6) (2005) 1155–1164.
[17] X.Y. Pang, P. Boul, W.C. Jimenez, Isothermal calorimetry study of the effect ofchloride accelerators on the hydration kinetics of oil well cement, Constr.Build. Mater. 77 (2015) 260–269.
[18] J. Stark, Recent advances in the field of cement hydration and microstructureanalysis, Cem. Concr. Res. 41 (7) (2011) 666–678.
[19] J. Bensted, Some applications of conduction calorimetry to cement hydration,Adv. Cem. Res. 1 (1987) 35–44.
[20] M.D. Andersen, H.J. Jakobsen, J. Skibsted, Characterization of white Portlandcement hydration and the C-S-H structure in the presence of sodiumaluminate by Al-27 and Si-29 MAS NMR spectroscopy, Cem. Concr. Res. 34(5) (2004) 857–868.
[21] E.T. Rodriguez, I.G. Richardson, L. Black, E. Boehm-Courjault, A. Nonat, J.Skibsted, Composition, silicate anion structure and morphology of calciumsilicate hydrates (C-S-H) synthesised by silica-lime reaction and by controlledhydration of tricalcium silicate (C3S), Adv. Appl. Ceram. 114 (7) (2015) 362–371.
[22] T. Sowoidnich, F. Bellmann, D. Damidot, H.M. Ludwig, New insights intotricalcium silicate hydration in paste, J. Am. Ceram. Soc. 102 (5) (2019) 2965–2976.
[23] A. Bazzoni, M. Cantoni, K.L. Scrivener, Impact of annealing on the earlyhydration of tricalcium silicate, J. Am. Ceram. Soc. 97 (2) (2014) 584–591.
[24] K.O. Kjellsen, H. Justnes, Revisiting the microstructure of hydrated tricalciumsilicate – a comparison to Portland cement, Cem. Concr. Comput. 26 (8) (2004)947–956.
[25] K.O. Kjellsen, B. Lagerblad, Microstructure of tricalcium silicate and Portlandcement systems at middle periods of hydration-development of Hadley grains,Cem. Concr. Res. 37 (1) (2007) 13–20.
[26] D. Menetrier, I. Jawed, T.S. Sun, J. Skalny, Esca and Sem Studies on Early C3sHydration, Cem. Concr. Res. 9 (4) (1979) 473–482.
[27] G.W. Groves, Portland-cement clinker viewed by transmission electron-microscopy, J. Mater. Sci. 16 (4) (1981) 1063–1070.
[28] P.J.M. Monteiro, S.J. Bastacky, T.L. Hayes, Low-temperature scanning electron-microscope analysis of the portland-cement paste early hydration, Cem. Concr.Res. 15 (4) (1985) 687–693.
[29] D.M.F. Orr, Application of the scanning electron-microscope to the study of theinitial hydration of portland-cement paste, Cem. Concr. Res. 13 (1) (1983)146–148.
[30] L. Zhang, G.W. Scherer, Comparison of methods for arresting hydration ofcement, Cem. Concr. Res. 41 (10) (2011) 1024–1036.
[31] J.B. Ings, P.W. Brown, G. Frohnsdorff, Early hydration of large single-crystals oftricalcium silicate, Cem. Concr. Res. 13 (6) (1983) 843–848.
[32] J.W. Bullard, R.J. Flatt, New insights into the effect of calcium hydroxideprecipitation on the kinetics of tricalcium silicate hydration, J. Am. Ceram. Soc.93 (7) (2010) 1894–1903.
[33] S. Garrault, E. Finot, E. Lesniewska, A. Nonat, Study of C-S-H growth onC3S surface during its early hydration, Mater. Struct. 38 (278) (2005)435–442.
[34] M.C.G. Juenger, P.J.M. Monteiro, E.M. Gartner, G.P. Denbeaux, Soft X-raymicroscope investigation into the effects of calcium chloride on tricalciumsilicate hydration, Cem. Concr. Res. 35 (1) (2005) 19–25.
[35] E.E. Bernardes, E.V.M. Carrasco, W.L. Vasconcelos, A.G. de Magalhaes, X-raymicrotomography (mu-CT) to analyze the pore structure of a Portland cementcomposite based on the selection of different regions of interest, Constr. Build.Mater. 95 (2015) 703–709.
[36] T.J. Chotard, M.P. Boncoeur-Martel, A. Smith, J.P. Dupuy, C. Gault, Applicationof X-ray computed tomography to characterise the early hydration of calciumaluminate cement, Cem. Concr. Comput. 25 (1) (2003) 145–152.
[37] Q. Hu, M. Aboustait, M.T. Ley, J.C. Hanan, V. Rose, R. Winarski, Combined three-dimensional structure and chemistry imaging with nanoscale resolution, ActaMater. 77 (2014) 173–182.
[38] M. Moradian, Direct Observations on Microstructure Evolution of CementSystems at Early Ages, State University, Oklahoma, 2017.
[39] M. Moradian, Q. Hu, M. Aboustait, M.T. Ley, J.C. Hanan, X. Xiao, G.W. Scherer, Z.Zhang, Direct observation of void evolution during cement hydration, Mater.Des. 136 (2017) 137–149.
[40] M. Moradian, M.T. Ley, Z.C. Grasley, Stress induced dissolution and time-dependent deformation of portland cement paste, Mater. Des. 157 (2018) 314–325.
[41] M. Ley, Q. Hu, M. Aboustait, T. Kim, M. Moradian, J. Hanan, V. Rose, R. Winarski,J. Gelb, Combining Nano X-ray Tomography and Nano X-ray Fluorescence toCreate Time-dependent Three Dimensional Constitutive Maps, 2015.
[42] G. Sokhansefat, M.T. Ley, M.D. Cook, R. Alturki, M. Moradian, Investigation ofconcrete workability through characterization of aggregate gradation inhardened concrete using X-ray computed tomography, Cem. Concr. Compos.98 (2019) 150–161.
[43] G. Sokhansefat, Feature Investigation using Micro Computed Tomographywithin Materials, Oklahoma State University, Stillwater, OK, 2018.
[44] Q. Hu, M. Aboustait, T. Kim, M.T. Ley, J. Bullard, G. Scherer, J.C. Hanan, V. Rose,R. Winarski, J. Gelb, Direct measurements of 3d structure, chemistry and massdensity during the induction period of C3s hydration, Cem. Concr. Res. 89(2016) 14–26.
[45] Q. Hu, M. Aboustait, T. Kim, M.T. Ley, J.C. Hanan, J.W. Bullard, R. Winarski, V.Rose, Direct three-dimensional observation of the microstructure andchemistry of C3S hydration, Cem. Concr. Res. 88 (2016) 157–169.
[46] J.J. Williams, Z. Flom, A.A. Amell, N. Chawla, X. Xiao, F. De Carlo, Damageevolution in SiC particle reinforced Al alloy matrix composites by X-raysynchrotron tomography, Acta Mater. 58 (18) (2010) 6194–6205.
[47] X.D. Zhang, C.J. Xia, X.H. Xiao, Y.J. Wang, Fast synchrotron X-ray tomographystudy of the packing structures of rods with different aspect ratios, ChinesePhys B 23 (4) (2014).
[48] M. Holt, R. Harder, R. Winarski, V. Rose, Nanoscale hard X-Ray microscopymethods for materials studies, Annu. Rev. Mater. Res. 43 (2013) 183–211.
[49] N.D. Parab, B. Claus, M.C. Hudspeth, J.T. Black, A. Mondal, J.Z. Sun, K. Fezzaa,X.H. Xiao, S.N. Luo, W.N. Chen, Experimental assessment of fracture ofindividual sand particles at different loading rates, Int. J. Impact Eng. 68(2014) 8–14.
[50] F. De Carlo, P.B. Albee, Y.S. Chu, D.C. Mancini, B. Tieman, S.Y. Wang, High-throughput real-time X-ray microtomography at the advanced photon source,in: International Symposium on Optical Science and Technology, InternationalSociety for Optics and Photonics, 2002, pp. 1–13.
[51] F. De Carlo, B. Tieman, High-throughput X-ray microtomography system at theadvanced photon source beamline 2-BM, in: In Optical Science andTechnology, the SPIE 49th Annual Meeting, International Society for Opticsand Photonics, 2004, pp. 644–651.
[52] J.W. Bullard, B. Lothenbach, P.E. Stutzman, K.A. Snyder, Couplingthermodynamics and digital image models to simulate hydration andmicrostructure development of portland cement pastes, J. Mater. Res. 26 (4)(2011) 609–622.
[53] T. Kim, M. Moradian, M.T. Ley, Dissolution and leaching of fly ash in nitric acidusing automated scanning electron microscopy, Adv. Civ. Eng. Mater. 7 (1)(2018) 291–307.
[54] F.R. Brushett, L. Trahey, X.H. Xiao, J.T. Vaughey, Full-field synchrotrontomography of nongraphitic foam and laminate anodes for lithium-ionbatteries, ACS Appl. Mater. Inter. 6 (6) (2014) 4524–4534.
[55] A. Momose, T. Takeda, Y. Itai, K. Hirano, Phase-contrast X-ray computedtomography for observing biological soft tissues (vol 2, pg 473, 1996), Nat.Med. 2 (5) (1996). 596 596.
[56] D. Damidot, A. Nonat, P. Barret, Kinetics of tricalcium silicate hydration indiluted suspensions by microcalorimetric measurements, J. Am. Ceram. Soc. 73(11) (1990) 3319–3322.

M. Moradian et al. / Construction and Building Materials 212 (2019) 486–499 499
[57] R.P. Winarski, M.V. Holt, V. Rose, P. Fuesz, D. Carbaugh, C. Benson, D.M. Shu, D.Kline, G.B. Stephenson, I. McNulty, J. Maser, A hard X-ray nanoprobe beamlinefor nanoscale microscopy, J. Synchrotron Radiat. 19 (2012) 1056–1060.
[58] D.G. Altman, J.M. Bland, Statistics notes – standard deviations and standarderrors, Brit Med J 331 (7521) (2005). 903 903.
[59] S. Garrault, T. Behr, A. Nonat, Formation of the C-S-H layer during earlyhydration of tricalcium silicate grains with different sizes, J. Phys. Chem. B 110(1) (2006) 270–275.
[60] J.N. Maycock, J. Skalny, R. Kalyoncu, Crystal defects and hydration I. Influenceof lattice defects, Cem. Concr. Res. 4 (1974) 835–847.
[61] L. Nicoleau, A. Nonat, D. Perrey, The di- and tricalcium silicate dissolutions,Cem. Concr. Res. 47 (2013) 14–30.
[62] I. Odler, H. Dorr, Early hydration of tricalcium silicate. 2. Induction period,Cem. Concr. Res. 9 (3) (1979) 277–284.
[63] I. Odler, J. Schuppstuhl, Early hydration of tricalcium silicate. 3. Control of theinduction period, Cem. Concr. Res. 11 (5–6) (1981) 765–774.
[64] T. Sakurai, T. Sato, A. Yoshinaga, The effect of minor components on the earlyhydraulic activity of the major phases of Portland cement clinker, 5th ISCC(1969) 300-321.
[65] G. Geng, R.J. Myers, Y.-S. Yu, D.A. Shapiro, R. Winarski, P.E. Levitz, D.A. Kilcoyne,P.J. Monteiro, Synchrotron X-ray nanotomographic and spectromicroscopic
study of the tricalcium aluminate hydration in the presence of gypsum, Cem.Concr. Res. (2018).
[66] A. Navrotsky, Nanoscale effects on thermodynamics and phase equilibria inoxide systems, ChemPhysChem 12 (12) (2011) 2207–2215.
[67] L. Briese, R.S. Arvidson, A. Luttge, The effect of crystal size variation on the rateof dissolution–A kinetic Monte Carlo study, Geochim. Cosmochim. Acta 212(2017) 167–175.
[68] M. Petrik, B. Harbrecht, Dissolution Kinetics of Nanocrystals, ChemPhysChem14 (11) (2013) 2403–2406.
[69] I.G. Richardson, The nature of C-S-H in hardened cements, Cem. Concr. Res. 29(8) (1999) 1131–1147.
[70] E. Gallucci, P. Mathur, K. Scrivener, Microstructural development of early agehydration shells around cement grains, Cem. Concr. Res. 40 (1) (2010) 4–13.
[71] E.M. Gartner, A proposed mechanism for the growth of C-S-H during thehydration of tricalcium silicate, Cem. Concr. Res. 27 (5) (1997) 665–672.
[72] E.M. Gartner, J.M. Gaidis, Hydration mechanisms: I, Mater. Sci. Concr. III I (1)(1989) 95.
[73] E. Gartner, I. Maruyama, J. Chen, A newmodel for the CSH phase formed duringthe hydration of Portland cements, Cem. Concr. Res. 97 (2017) 95–106.