multinationals and monopolies pharmaceutical industry in india after
TRANSCRIPT

INDIAN INSTITUTE OF MANAGEMENT CALCUTTA
WORKING PAPER SERIES
WPS No. 685/ November 2011
Multinationals and Monopolies
Pharmaceutical Industry in India after TRIPS
by
Sudip Chaudhuri
Professor, Indian Institute of Management Calcutta, Joka, Kolkata 700104

1
Multinationals and Monopolies
Pharmaceutical Industry in India after TRIPS
Sudip Chaudhuri♣
An American Senate Committee (Kefauver Committee) found in the 1960s that India was among the highest priced nations in the world in pharmaceuticals.
Abstract: India abolished product patent protection in pharmaceuticals in 1972. Before 1972 the industry was underdeveloped and the MNCs charged very high prices for patented drugs. After 1972, the monopoly power of the MNCs was eliminated, the industry experienced rapid growth and India emerged as a major player in the global pharmaceutical industry receiving world-wide recognition as a low-cost producer of high quality. In accordance with the TRIPS agreement, drug product patent protection has been re-introduced in India since 1 January 2005. This paper deals with the behaviour of the MNCs in the post-TRIPS situation. The study shows that that the days of product monopolies and high prices are back in India. The MNCs have started marketing new patented drugs at exorbitant prices particularly for life threatening diseases such as cancer. Imports of high priced finished formulations are expanding rapidly with manufacturing investments lagging behind. The aggregate market share of the MNCs in the formulations market has gone up dramatically with the taking over of some Indian companies by the MNCs.
Keywords: MNCs, patents, prices, pharmaceuticals, generics
I: Background
1
♣Financial support from the Indian Institute of Management Calcutta is gratefully acknowledged. The author also thanks Sunil Sriwastava and Sushanta Roy for research assistance and Amitava Guha for discussions.
In 2007, Médecins sans Frontières, the international medical aid organisation operating in more than 70 countries described India as

2
the “pharmacy for the developing world”. One of the most important factors contributing to this remarkable transformation is the abolition of product patent protection in pharmaceuticals in 1972. After independence when India wanted to develop the pharmaceutical industry, the multinational corporations (MNCs) were invited to come to India to help develop the industry. But before 1972 while the MNCs themselves were not very keen on manufacturing in India, they used their patent rights to prevent Indian companies from manufacturing. As a result, on the one hand the industry remained underdeveloped and on the other hand the monopolies led to high prices.The abolition of product patents eliminated the monopoly power of the MNCs. The cost efficient processes developed by the indigenous sector often in collaboration with government laboratories could be used for manufacturing the latest drugs, introducing them at a fraction of international prices and dislodging the MNCs from the position of dominance in the domestic market. India became self-reliant in drugs. India emerged as a major player in the global pharmaceutical industry receiving world-wide recognition as a low-cost producer of high quality drugs. India supplies medicines not only to other developing countries but also to developed countries such as the United States.2
But from 1 January, 2005, drug product patent protection has been re-introduced in India to comply with the requirements under the Agreement on Trade Related Aspects of Intellectual Property Rights (TRIPS) of the World Trade Organization. How are the MNCs responding to the new policy environment? As in the pre-1972 situation, is India likely to see monopolization of the industry and high prices? Will the positive features of the post-1972 experience be diluted or negated? This paper deals with the behaviour of the MNCs in the post-TRIPS situation.
II: Rising MNC Dominance
The Indian generic companies are no longer permitted to manufacture the new patented drugs. These can now be manufactured only by the patentees and their licencees. Thus depending on the rate of introduction of the new patented drugs, the market share of the MNCs is expected to go up. We discuss in Section III below, the changes in the patented drug market in India.
But the MNCs are interested not only in the patented markets. They are trying to grow aggressively in the generic segments as well. Traditionally MNCs have relied for their growth on patented drugs and focused mainly on developed country markets. The high monopoly prices of patented drugs yielded high returns. But recent years have witnessed a sharp fall in the number of new drugs introduced in the market. The MNCs are increasingly finding it difficult to fill up the product gap as the patents on their blockbuster drugs are expiring and are facing constraints on further profitable growth in developed country markets. Pfizer, for example is set to lose a US$ 10 billion a year revenue stream as the patent on its blockbuster drug Lipitor expires. Desperate attempts by Pfizer to find a replacement has not yielded results.3The net

3
profit of top 15 MNCs declined sharply by 20.1 per cent in 2010 with major setback for companies such as Merck, Bristol-Myers and GlaxoSmithKline.4
Involvement of the MNCs in the generic market is nothing new in India. When product patents were abolished in India in 1972, the MNCs did not stop their business in India. All the major MNCs decided to stay back. GlaxoSmithKline (GSK) (earlier known as Glaxo) in fact remained the largest seller in the domestic formulations market till recently. But the MNCs in general maintained a low profile. They were hesitant to introduce their latest products. Some of them continued to compete but created new local brands rather than using their international brands. Others stopped selling products they thought were priced too low (Chaudhuri 2005, chapter 4).
On the other hand, some developing country markets are experiencing rapid growth. The seven emerging markets of China, Brazil, India, Russia, South Korea, Mexico and Turkey contributed to more than half of the growth of the pharmaceutical market of the world in 2009 compared to only 16 % by the developed country markets of North America, Western Europe and Japan. The figures were respectively 7% and 79% in 2001 (Tempest 2011). Not unexpectedly, the MNCs are targeting the generic industry in these emerging markets as well.
What is new in the post-TRIPS situation is the vigour with which the MNCs are trying to expand not only in the patented markets, but in the generic markets. MNCs such as Pfizer, GSK, Merck earlier opted not to introduce in India some of their blockbuster drugs. These are now being introduced. Examples are azithromycin and quinapril by Pfizer, simvastatin by Merck and carvedilol by GSK. In fact the MNCs are not hesitating to market even products developed by the other MNCs. Pfizer, for example is marketing telmisartan developed by Boehringer Ingelheim (IDFC-SSKI 2010, p. 16).
So far as India is concerned, the most obvious reflection of such changes in strategy is taking over of Indian companies by MNCs and strategic alliances between MNCs and Indian companies (Table 1). Indian companies such as Dr Reddys, Aurobindo, Cadila Healthcare, Torrent have entered into supply agreements with MNCs such as GSK, Astrazeneca and Abbot. Dr Reddys, for example will supply about 100 branded formulation to GSK for marketing in different emerging markets across Latin America, Africa, Middle-East and Asia-Pacific excluding India. Dr Reddys will get a pre-determined share of the revenue earned by GSK for these products. In some markets where Dr Reddys has a presence, the formulations will be marketed jointly. Another example is Aurobindo-Pfizer deal. Aurobindo will supply more than 100 formulations to Pfizer for the regulated markets of USA and EU and more than 50 products for about 70 non-US/EU markets. It has been reported that apart from revenue sharing, the deal involves payment of upfront licence fees by Pfizer to Aurobindo. These deals enable the MNCs to get access to low cost reliable products without undergoing the lengthy process of getting regulatory approvals in

4
different markets and without incurring any capital expenditure for setting up manufacturing plants. The Indian companies gain by having access to the formidable marketing resources of the MNCs. Experience suggests that it is not easy to simultaneously enter into different markets on their own. Efforts by some Indian companies to enter and expand in foreign markets with their own marketing infrastructure have not always led to the desired results. The Indian companies hope to better realize their manufacturing capacities and capabilities through these alliances with the MNCs (IDFC-SSKI 2009; IDFC-SSKI2010).
More significant than these alliances is the taking over of Indian companies by the MNCs. The share of the MNCs in the domestic formulations market has dramatically increased from less than 20% in March 2008 to 28% in December 2010with the taking over of Ranbaxy by Daiichi Sankyo in June 2008; Dabur Pharma by Fresenius Kabi Oncology in August 2008; Shantha Biotechs by Sanofi-Aventis in July 2009 and the domestic formulations business of Piramal Healthcare by Abbott in May 2010 (Table 2). In March 2008, there was only one MNC (GSK) among the top 10 companies in India. By December 2010 the number of MNCs in top 10 went up to three (GSK, Ranbaxy and the Abbott group). The Abbott group comprising Abbott, Piramal Healthcare and Solvay Pharma is now the largest company in India with a market share of 6.2% ahead of the second largest Cipla (5.7%). Abbott was the 30th
Thus the declining trend in the aggregate market share of the MNCs which started in the 1970s has been reversed. The MNCs are recovering the lost ground. The post-TRIPS environment and the strategy being adopted by the MNCs suggest that they are on the way to dominating the industry again. First, unlike in the earlier period, the MNCs are aggressively pursuing growth in the generic segments. Second, they will enjoy monopoly power in the patented drugs market. Third, they have the financial capacity to take over more Indian companies. If a few other major Indian companies such as Cipla (5.7% market share in 2010), Sun (4.3%), Cadila Healthcare (3.9%), Mankind (3.2%), Alkem (3%), Lupin (2.9%) are taken over, the MNC share will exceed 50% immediately.
largest company in the domestic formulations market in March 2008 with a market share of only 1.1% (Table 2).
The MNCs are not only taking over Indian companies. They are also consolidating their control over the Indian counterparts. Under the Foreign Exchange Regulation Act, 1973, (FERA), the pharmaceutical MNCs, which were manufacturing only formulations or bulk drugs not involving ‘high technology’ were required to reduce foreign equity to 40 per cent or below. With the abolition of FERA as a part of economic reforms of the 1990s, not surprisingly the MNCs have increased their equity stakes. Currently all the pharmaceutical MNCs listed in Indian stock exchanges have majority shareholding of more than 50%. The tendency of stepping up equity stake has actually accelerated in the last few years (Table 3). Novartis has increased foreign

5
equity from 50.93% in 2005 to 76.42% in 201, Pfizer from 40% to 70.75%, Abbott from 61.7% to 68.94% and Aventis from 50.1% to 60.4%.
III Rising Imports of Finished Formulations
Legitimately the abolition of product patent protection in India has attracted more attention. But two other policies which helped were FERA and the New Drug Policy, 1978 (revised in 1986). The drug policy imposed restrictions on the FERA companies (i.e., those with more than 40% foreign equity) which were not applicable to Indian companies. One of the most important policies that were implemented was that the MNCs were not allowed to market formulations unless they themselves produced the bulk drugs in specified ratios. This compelled the MNCs to undertake manufacturing investments from basic stages. In fact together with the Indian companies, the manufacturing activities of the MNCs too expanded after the 1970s.5
But after the mid-1990s with the withdrawal of such restrictions, the MNCs started disinvesting in manufacturing operations. They have sold a number of plants which they had set up earlier under government pressure. Thanks to the development of the bulk drugs industry in India 1970s onwards, most of the bulk drugs are now produced by a number of Indian producers and are available at very low competitive prices. Now that it is no longer mandatory for the MNCs to manufacture bulk drugs, they could afford to close down the plants previously set up and rely on cheaper supplies form Indian bulk drugs manufacturers (see Chaudhuri 2005, chapter 4).
In 1994, the investments in plant and machinery (including computers and electrical installations) of the top 9 MNCs was Rs 4555.1 million, accounting for about 70% of that of the top 10 Indian companies. 6Thereafter as Figure 1 shows, whereas plant and machinery investments by the Indian companies increased rapidly, that of the MNCs essentially stagnated. By 2010, MNC investments accounted for only 5% of the investments of Indian companies of Rs 137652.5 million. These data at current prices suggest that real investments by the MNCs have been falling in absolute terms. If we use the Wholesale Price Index (1993-94 series) of the broad manufacturing group of “machinery and machine tools”7
Thus the manufacturing activities of the MNCs after economic liberalization are reminiscent of the 1950s and 1960s when the official policy was quite liberal but the MNCs were reluctant to undertake manufacturing. In fact as in the previous period one finds that the propensity to import finished medicines for the purposes of marketing in India has gone up.
, then MNC investments at 1994 prices show a decline from Rs 4555.1 million in 1994 to Rs 4065.6 million in 2009.
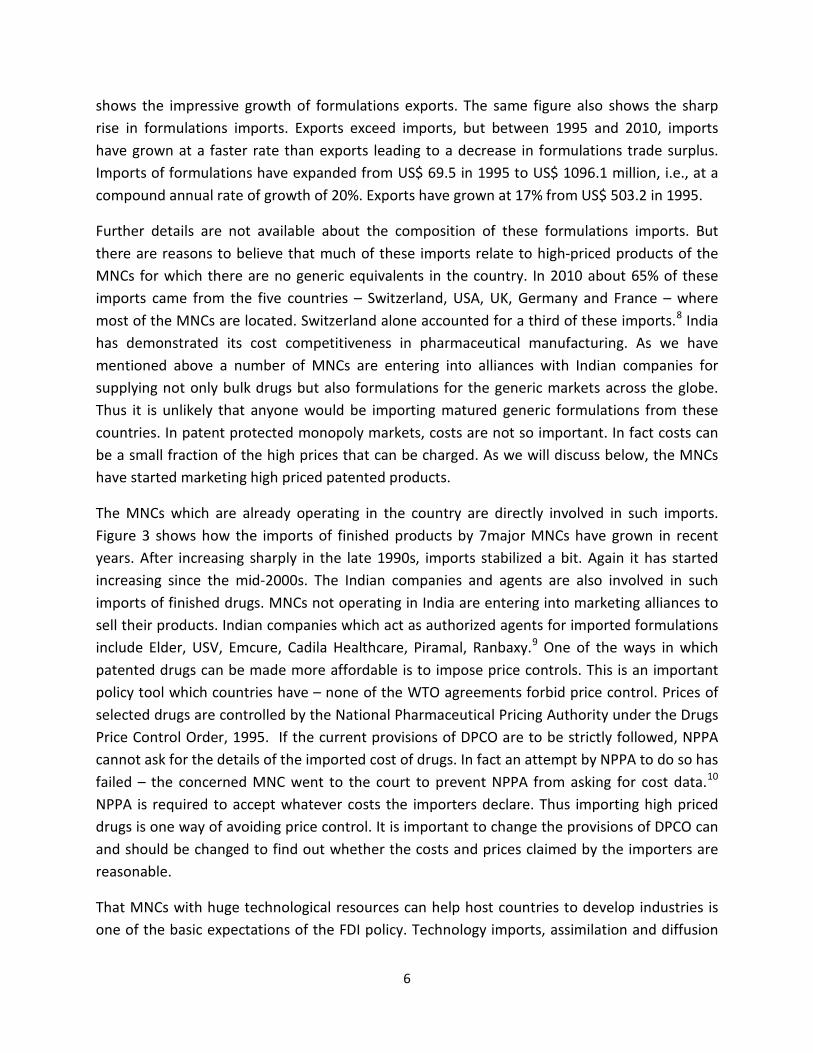
What has attracted widespread attention is India’s success as a pharmaceutical exporter. What is less noticed is that in recent years imports of formulations have been rising sharply. Figure 2
6
shows the impressive growth of formulations exports. The same figure also shows the sharp rise in formulations imports. Exports exceed imports, but between 1995 and 2010, imports have grown at a faster rate than exports leading to a decrease in formulations trade surplus. Imports of formulations have expanded from US$ 69.5 in 1995 to US$ 1096.1 million, i.e., at a compound annual rate of growth of 20%. Exports have grown at 17% from US$ 503.2 in 1995.
Further details are not available about the composition of these formulations imports. But there are reasons to believe that much of these imports relate to high-priced products of the MNCs for which there are no generic equivalents in the country. In 2010 about 65% of these imports came from the five countries – Switzerland, USA, UK, Germany and France – where most of the MNCs are located. Switzerland alone accounted for a third of these imports.8
The MNCs which are already operating in the country are directly involved in such imports. Figure 3 shows how the imports of finished products by 7major MNCs have grown in recent years. After increasing sharply in the late 1990s, imports stabilized a bit. Again it has started increasing since the mid-2000s. The Indian companies and agents are also involved in such imports of finished drugs. MNCs not operating in India are entering into marketing alliances to sell their products. Indian companies which act as authorized agents for imported formulations include Elder, USV, Emcure, Cadila Healthcare, Piramal, Ranbaxy.
India has demonstrated its cost competitiveness in pharmaceutical manufacturing. As we have mentioned above a number of MNCs are entering into alliances with Indian companies for supplying not only bulk drugs but also formulations for the generic markets across the globe. Thus it is unlikely that anyone would be importing matured generic formulations from these countries. In patent protected monopoly markets, costs are not so important. In fact costs can be a small fraction of the high prices that can be charged. As we will discuss below, the MNCs have started marketing high priced patented products.
9 One of the ways in which patented drugs can be made more affordable is to impose price controls. This is an important policy tool which countries have – none of the WTO agreements forbid price control. Prices of selected drugs are controlled by the National Pharmaceutical Pricing Authority under the Drugs Price Control Order, 1995. If the current provisions of DPCO are to be strictly followed, NPPA cannot ask for the details of the imported cost of drugs. In fact an attempt by NPPA to do so has failed – the concerned MNC went to the court to prevent NPPA from asking for cost data.10
That MNCs with huge technological resources can help host countries to develop industries is one of the basic expectations of the FDI policy. Technology imports, assimilation and diffusion
NPPA is required to accept whatever costs the importers declare. Thus importing high priced drugs is one way of avoiding price control. It is important to change the provisions of DPCO can and should be changed to find out whether the costs and prices claimed by the importers are reasonable.

7
can help build the technological base of a country. But this happens only when manufacturing activities are undertaken by the MNCs. If they are more interested in selling imported drugs and/or drugs manufactured by others in India, obviously the question of technological progress does not arise. In view of the progress of the Indian companies, India may not require foreign technology for matured products. But the new drugs being introduced may require new technologies. If these products are manufactured in the country, the country may gain. But if that is not happening then it is legitimate to question the role of the MNCs and ask for proper regulation to tune their activities more in line with country’s interest.
Not only with respect to manufacturing technology. On several other counts the performance of the MNCs compare unfavourably with that of the top Indian companies (Table 4). Unlike the Indian companies, the MNCs spend more in foreign exchange for imports, interest payments, royalty/technical fees, dividend remittances etc than they earn through exports and other means. Whereas the foreign exchange deficit of the MNCs has gone up from US $ 20.52 million in 1994 to US $ 205.05 million in 2019, i.e., at 15% per annum (CARG), foreign exchange surplus of the top Indian companies increased at 29% per annum during the same period. Between 1994 and 2010, MNC export earnings increased by only 5% per annum (compared to 22% by the Indian companies), but dividend remittances increased by 16% per annum. Export intensity, i.e., exports as a percentage of sales has remained stagnant for the MNCs at around 4% in 2010 compared to about 50% for the Indian companies.
IV Market Structure and Prices of Patented Products
Considering the role that abolition of product patent protection played in the pharmaceutical industry in India, re-introduction of product patent protection since 2005 has crucial significance. The basic apprehension is whether India will go back to the pre-1972 situation of MNC monopoly and high prices? Though product patents have been introduced from 1 January 2005, earlier from 1 January, 1995, a mailbox facility was put in place to receive and hold product patent applications.11
Indian generic companies are no longer permitted to manufacture and market new drugs for which patents have been granted in India. But not all new drugs are patentable in India. Under Article 70(3) of TRIPS, a WTO member country has no obligation to provide patent protection for any subject matter which has fallen into the “public domain” before WTO came into being, i.e., before 1 January, 1995. Thus any drug product patented abroad before 1995 can continue to be manufactured and sold in India after 1995 even though these may be under patent protection in other countries.
As per the TRIPS agreement, these applications are being processed since 1 January, 2005 for grant of patents. Thus to understand the impact on the market structure and prices, we consider the period since 1995.

8
Drugs patented after 1 January, 1995 can be classified into the following categories: 1. Those involving new chemical entities (NCEs) (also known as new molecular entities (NMEs),
and new biological entities (NBEs) patented after 1995 2. Those involving NCEs/NBEs developed before 1995 but with patents after 1995 for :
a. new formulations and compositions b. new combinations c. new chemical derivatives (salts, esters etc)
According to Article 27(1) of TRIPS, patents are required to be provided for inventions, which are “new, involve an inventive step and are capable of industrial application” The agreement however does not define these terms. This provides some flexibility. India has taken advantage of this flexibility by enacting Section 3(d) in the amended patents Act and restricting product patents to some extent. Under Section 3(d), India is not obliged to provide protection to any secondary patents (of new formulations/combinations/chemical derivatives) after 1995 involving NCEs developed before 1995 “unless they differ significantly in properties with regard to efficacy.” Further, in cases where Indian companies were already producing and marketing before 1 January, 2005, the products for which patent applications have been made in the mailbox, they need not suspend production even if MNCs get the patents. Under Section 11A(7), they can continue to produce on payment of “reasonable royalty”. In the Appendix, we have listed all the new drugs marketed in India since 1995 (and till 2010). We consider as new drugs all NCEs and NBEs approved for marketing in the United States by the United States Food and Drug Administration (USFDA). This has been obtained from the website of the US FDA. We used the website of the Central Drugs Standard Control Organization to find out whether and when these have been approved for marketing in India. Since it is difficult to get systematic information on pharmaceutical product patents granted by the patent office in India, we have used the website of the USFDA for this purpose as well.12
As Table 5 shows, 180 new drugs are being marketed in India. This constitutes about 9.1% of the total pharmaceutical market in India in 2010. These 180 drugs are further classified into:
1. 62 drugs for which patents have expired in USA (3.8% of the Indian market) 2. 67 drugs for which patents were granted in USA before 1995 and hence not patentable
in India in accordance with the TRIPS agreement (4.2%) 3. 51 drugs for which patents were granted in USA after 1995 and hence patentable in
India subject to section 3(d) provisions (1.2%).

9
Thus the market share of patentable new drugs market in India is still very small. It would however not be correct to infer from here that patented drugs are not a problem in the country. As we will see below, for life threatening diseases such as cancer, exorbitant prices are being charged for the new patented drugs. For these patients it is a question of not getting proper treatment if they cannot afford the high cost. Moreover, it is just a few years that product patent protection has been introduced in India. Considering the time lag between the time when an NCE/NBE is patented and when it is finally approved for marketing, all the post- 1995 NCEs/NBEs are not yet ready for the market. Some of the MNCs, for example GlaxoSmithKline have revealed ambitious plans to launch a basket of patented products. They are expanding their marketing infrastructure in anticipation of the future patented market.13
Table 6 shows the nature of competition in these three categories of new drugs. In the first two categories where patent barriers are not there in India, the markets are much more competitive than the third category. For patent expired molecules, there are 5 or more sellers for 43 products accounting for 97.9% of the market. For pre-1995 molecules the figures are 46 products and 97.9% respectively. There are monopolies for only 1% of the market. Thus these markets are essentially competitive.
But for the third category of post-1995 drugs, there are monopolies in 50% of the products accounting for 20% of the market. Surprisingly even for the post-1995 products, for about three-fourths of the market the number of sellers is 5 or more. Two TRIPS flexibilities may explain this. Under Section 11A(7), Indian generic companies which have started manufacturing before 2005 are not required to suspend production even if patents are granted (after2005).
More important is the Section 3(d) flexibility. Consider for example the two post-1995 products, Novartis’ anti-cancer drug, imatinib mesylate and Gilead’s anti-HIV/AIDS drug, tenofovir disoproxil fumarate. Product patents are in force in the United States for these products. But for both these products the original compound – imatinib and tenofovir - were disclosed before 1995. What actually have been patented are a particular (beta crystalline) form (mesylate) and a particular salt (disoproxil fumarate). Hence these are not patentable in India subject to the enhanced efficacy clause of Section 3(d). Patent Office/High Courts have rejected these patent applications. The matter is currently with the Supreme Court.14
In the absence of any legal barrier to enter these markets a number of Indian generic companies are manufacturing and selling these products in the market. There are 14 companies selling imatinib mesylate and 6 companies selling tenofovir disoproxil fumarate. Another product where the MNC product patent has been contested relates to the anti-cancer drug, erlotinib. This is manufactured by 6 Indian companies.

10
In a product patent regime, the main interest centres around the behaviour of the MNCs. The MNCs are involved in marketing in India in 92 out of the 180 new drugs. As Table 7 shows, MNCs have monopolies in 33 products accounting for 31% of their sales of Rs 5171.42 million of these 92 products. In fact in 53 products accounting for more than three-fourths of their sales they have a market share of 50% or more. It is interesting to note that out of these 33 products, patents have expired or are pre-1995 molecules for 8 products, for example, anidulafungin, caspofungin, micafungin and pegaptanib. This suggests that that there are entry barriers other than patent barriers, for example complex manufacturing process or the use of USFDA Orange Book did not correctly reveal the patent status15
.
Table 8 gives an idea about the pricing policy adopted by the MNCs for these 33 monopoly products. A 50 ml injection of Roche’s anti cancer drug Herceptin (generic name: trastumuzab) costs Rs 135200. Among the other high priced drugs are Merck’s Erbitux (cetuximab) (Rs 87920), Bristol-Myers-Squibb’s Ixempra (ixabepilone) (Rs 66430), Pfizer’s Macugen (pegaptanib) (Rs 45350), Sanofi-Aventis’ Fasturtec (rasburicase) (Rs 45000) Roche’s Avastin (bevicizumab) (Rs 37180). There are 6 products costing between Rs 10000 and Rs 45000 (for example Wyeth’s Enbrel (etanercept): Rs 15761), 8 products between Rs 10000 and Rs 1000 (GSK’s Tykerb (lapatinib: Rs 4468), another 6 products between Rs 100 and Rs 1000 (for example Bayer’s Xarelto (rivaroxaban): Rs 480) and only 8 products with prices below Rs 100 (for example MSD’s Januvia (sitagliptin): Rs 43). It is important to note that the prices mentioned in Table 8 are for a single injection/tablet etc. The cost of treatment per person per year would be much higher. Consider, for example, Dasatinib used for the treatment of chronic myeloid leukaemia. The price of a 70 mg dasatinib tablet is Rs 3905. Assuming a treatment regimen of 100mg per day, the cost of treatment per person per year exceeds Rs 2 million. The corresponding cost in the United Kingdom is GBP 30,477 suggesting that the company (Bristol Myers Squibb) is essentially charging the same price and not using differential pricing.16
All the drugs listed in Table 8 are monopoly drugs in the sense there are only one seller of the molecule concerned. Effective competition in pharmaceuticals takes place within therapeutic categories, for example cardiac, anti-diabetic etc where different molecules may compete against each other. It is important to note that in therapeutic categories such as cardiac and anti-diabetic, where different molecules are available in the market, the prices of the monopoly molecules in Table 8 are relatively low, for example, cerivastation, dronedarone, saxagliptin, sitagliptin. But for life threatening diseases such as cancer, for essential drugs without effective substitutes, prices are exorbitant as in the cases trastuzumab, cetuximab, ixabepilone etc. Similarly the prices of vital drugs such as Wyeth’s Enbrel (etanercept) (Rs 15761 per injection)

11
used for rheumatoid arthritis, which can incapacitate people, Pfizer’s Macugen (pegaptanib) (Rs 45350 per 90 ml injection) used for preventing loss of vision in the case of age related masucular degeneration, Sanofi-Aventis’ Fasturtec (rasburicase) (Rs 45000 per injection) used to treat side effects of chemotherapy for treating leukaemia and lymphoma are very highly priced. Table 8 does not cover all the patented and monopoly drugs marketed in India. We have tried to focus on products where MNCs have a monopoly. There are also products where MNCs do not have a monopoly but are charging very high prices pending the settlement of patent disputes. This paper has not systematically studied these products. But an example can be given. The price of pegalyted interferons beta (Roche’s Pegasys) costs between Rs 14000 and Rs 18000 per dose. It is used for Hepatitis co-infected with HIV. Roche got the product patent in India. But due to patent disputes, some Indian generic companies are also manufacturing and marketing it.17
Table 8 lists the monopoly products directly marketed by MNCs. But as we have mentioned above, MNCs not operating in India are using the marketing infrastructure of Indian companies to import and sell their products. We have also not been able to structure of prices of these imported products. But the example of poractant alfa shows that these prices also can be very high. The drug is imported by Piramal.18
Piramal as the sole seller charges a price of Rs 17957.8 per 80 mg injection 3 ml vial.
Though we have not been able to list all the products with high prices in Table 8, it is clear from the table that the days of monopolies and high drug prices are back again in Indiaparticularly for drugs without close substitutes.
In the product patent regime, the prices of new drugs will depend on:
• What prices the MNCs holding the patents would charge
• What steps can be taken to regulate such prices including through price control or price negotiation or
• What steps are taken to provide competition from generic producers. If MNCs charge affordable prices for patented drugs in developing countries, access may not be adversely affected. Some MNCs are selling drugs at a discount compared to the prices charged in the developed country markets. GSK is an example – the company has adopted the policy of selling drugs at a discount compared to the US price. But even with a discount, the cost of treatment of Tykerb is about Rs 0.6 million per person per year.19Or if the MNCs give voluntary licences to generic companies to manufacture the patented drugs, the consequent competition

12
can make drugs more affordable. But, voluntary licenses have mainly been given for products which have very little patent life left and have rarely been given voluntarily. Usually they follow some public pressure or legal action and sometimes they have been used as a strategy to thwart oppositions by generic companies (Amin and Radhakrishnan 2007). Price control is not forbidden under TRIPS or any other agreement of the WTO. The “Draft National Pharmaceuticals Policy, 2006” (p. 15) recommended mandatory price negotiations of patented drugs before granting marketing approval and stressed the importance of studying the experiences of Canada, Australia France and other countries believed to have a good system. In fact a “Committee on Price Negotiations on Patented Drugs” has been set up in the Department of Pharmaceuticals. This is an important initiative and efforts should be expedited to initiate measures to control the prices of patented drugs. One important difference between direct price control measures and efforts to enhance generic competition to keep price in directly under control may be noted. The former if properly implemented makes drugs more affordable but does not provide any room for the generic companies. The latter not only makes the prices more affordable through competition. It also ensures some space to the generic companies, which is vital for their long term sustenance.
The importance of generic competition is clear from section 3(d) cases. Like dasatinib, imatinib mesylate is indicated for chronic myeloid leukaemia. But unlike dasatinib, there are about 14 Indian generic companies manufacturing imatinib mesylate. As a result the cost of treatment has gone down sharply compared to that of the product of Novartis. Sun the market leader charges a price of Rs 203 for a 400 mg tablet. Similarly there are 6 manufacturers of tenofovir. Cipla the market leader charges a price Rs 150 per 30 mg tablet. Again for erlotinib, compared to Roche’s Tarceva’s price of Rs 4200 (150mg tablet) Cipla’s Erlocip costs Rs 1530.
While section 3(d) has played quite an useful role in India in recent years, the policy option which is much more potent and sustainable in the longer run in compulsory licensing. Compulsory licensing is a permission given by the government to a non-patentee to manufacture a drug without (or even against) patentee’s consent. As is widely recognised, compulsory licensing is one of the ways in which TRIPS attempts to strike a balance between promoting access to existing drugs and promoting R&D into new drugs. If generic companies are given licenses to produce a patented drug on payment of royalty, then competition among manufacturers would drive down prices, but the royalty paid to the innovators would continue to provide funds and the incentive for R&D.
The exorbitant prices being charged by the MNCs for some of the products provide a very good rationale for compulsory licensing intervention. It is really surprising that it has not yet

13
attracted the attention it deserves among generic companies, civil society organizations and government.
V Conclusions The most important conclusion of this study is that the days of product monopolies and high prices are back in India. The MNCs have started marketing new patented drugs at exorbitant prices particularly for life threatening diseases such as cancer.
The manufacturing and importing behaviour since the 1990s bear a close resemblance to that before the 1970s. Imports of high priced finished formulations are expanding rapidly with manufacturing investments lagging far behind.
The MNCs are also expanding vigorously in the generic segments. They are trying to grow not only organically but through M&As and strategic alliance with Indian generic companies. The aggregate market share in the formulations market has gone up dramatically with the taking over of some Indian companies by the MNCs. The MNCs are on the way of dominating the industry again.

14
References:
Chaudhuri Sudip, Chan Park and K M Gopakumar (2010), Five Years into the Product Patent Regime: India’s Response”, New York: United Nations Development Programme, December.
Chaudhuri, Sudip (2005), “The WTO and India’s Pharmaceuticals Industry: Patent Protection TRIPS and Developing Countries”, New Delhi: Oxford University Press, 2005
Chaudhuri, Sudip (2010), “The Industry Response” in Chaudhuri, Park and Gopakumar 2010.
Park, Chan (2010), “Implementation of India’s Patent Law: A review of patents granted by the Indian Patent Office” in Chaudhuri, Park and Gopakumar 2010.
DIPP (2010), “Discussion Paper: Compulsory Licensing”, New Delhi: Department of industrial Promotion and Policy, Government of India.
Gopakumar, K M (2010), “Landscape of pharmaceutical patent applications in India: implications for access to medicines” in Chaudhuri, Park and Gopakumar 2010.
IDFC-SSKI (2009), “Recent MMNC alliances: Signalling Paradigm Shift?”, IDFC-SSKI Securities Ltd, June.
IDFC-SSKI (2010), “ MNC Pharma: New Avatar?”, IDFC-SSKI Securities Ltd, March.
Kidron, Michael (1965), Foreign Investments in India, London: Oxford University Press.
Ministry of Commerce and Industry (2008), “Strategy of Increasing Exports of Pharmaceutical products – Report of a Task Force”, New Delhi: Ministry of Commerce and Industry.
Sengupta, Amit, Reji K Joseph, Shilpa Modi and Nirmalya Syam (n.d.), Economic Constraints to Access to Essential Medicines in India, New Delhi: Centre for Technology and Development Studies, Society for Economic and Social Studies.
SBICAP (2010), “India Equity: Pharma”, SBICAP Securities Ltd.
Tempest, Brian (2011), “The Structural Changes in the Global Pharmaceutical Marketplace and Their Possible Implications for Intellectual Property”, UNCTAD-ICTSD Project on IPRs and Sustainable Development,
Policy Brief Number 10, July (http://ictsd.org/i/publications/111430/).

15
Table 1 M&As and Tie-ups in Indian Pharmaceutical industry, 2006-10
Indian company
Foreign company Date Type Comments
Aurobindo Astrazeneca Sep-10 Tie-up
Licensing and supply agreements for several solid dosage and sterile products for emerging markets across anti-infectives, CVS & CNS segments
Primal Healthcare Abbott May-10 M&A
Abbott acquired the domestic formulation business of Piramal for US$ 3.7 billion.
Cadila Abbott May-10 Tie-up
Abbott licences 24 Cadila products in 15 high growth emerging markets, holds option for more than 40 additional products
Orchid Chemicals Alvogen May-10 Tie-up
Alvogen to have marketing rights for 8 oral generic formulations for US in the area of CNS and Osteoporosis. The product to be sourced exclusively from Orchid
Indoco Aspen Mar-10 Tie-up
Generic supply deal for ophthalmic products across 30 countries in emerging markets. Aspen will have market authorisation over these products
Torrent Astrazeneca Mar-10 Tie-up
Generic supply deal for 18 products across 9 countries. Further flexibility to add more products and new countries
Strides Pfizer Jan-10 Tie-up
Generic supply of off-patent sterile injectable and oral products. Expects supplies of 40 off patent products in oncology therapeutics
Orchid Chemicals Hospira Dec-09 M&A
Hospira acquired generic injectable business for US$400 million.
Shantha Biotech
Sanofi-Aventis Jul-09 M&A
Sanofi-Aventis acquired Shantha for US$ 783 million
Dr Reddy's GSK Jun-09 Tie-up
GSK will gain exclusive access to Dr Reddy's rich and diverse portfolio and future pipeline. Dr Reddy’s to manufacture but will be licensed and

16
Indian company
Foreign company Date Type Comments
supplied by GSK in Latin American markets with the exception of co-marketing in certain markets
Aurobindo Pfizer May-09 Tie-up
Licensing and supply agreements for several solid dosage and sterile products for emerging markets. Offers rights to Pfizer for 55 solid and 5 sterile products in Latin American markets covering anti-infective CVS & CNS
Claris Lifescience Pfizer May-09 Tie-up
The deal offers Pfizer with marketing right for 15 injectables product in area of Anti-infective and pain mgt for regulated markets
Ranbaxy Daiichi-Sankyo Jun-08 M&A
Daiichi-Sankyo acquired Ranbaxy for US$ 4.6 billion
Dabur Pharma Fresenius Kabi Apr-08 M&A
Fresenius Kabi of Singapore acquired Dabur for US$ 219 million
Matrix Laboratories Mylan Aug-06 M&A
The US generic company Mylan acquired Matrix for US$ 736 million
Sources: SBICAP 2010; DIPP 2010.

17
Table 2 MNCs in the domestic formulations market in India, 2008-2010
MNC
Annual sales in Rs million (March 2008)
Market share (%) (March 2008)
Annual sales in Rs million (Dec 2008)
Market share (%) (Dec 2008)
Annual sales in Rs million (Dec 2009
Market share (%) (Dec 2009)
Annual sales in Rs million (Dec 2010)
Market share (%) (Dec 2010)
GlaxoSmithKline
Pharmaceuticals 17,618.9 5.15 20,607.3 5.39 21,647.6 4.85 24,511.8 4.71
Pfizer 6,561.3 1.92 7,961.2 2.08 9,075.5 2.03 11,273.9 2.17
Sanofi-Aventis 6,274.3 1.83 6,218.7 1.63 8,348.1 1.87 10,104.8 1.94
Novartis India 6,618.2 1.93 7,338.6 1.92 7,578.5 1.70 8,788.9 1.69
Abbott India 3,690.5 1.08 4,346.8 1.14 5,236.8 1.17 6,233.9 1.20
Novo Nordisk India 3,681.2 1.08 3,601.9 0.94 3,992.0 0.89 4,812.4 0.92
Wyeth 3,070.8 0.90 3,311.1 0.87 3,678.4 0.82 4,245.8 0.82
Astrazeneca Pharma India 2,134.0 0.62 2,674.6 0.70 3,421.2 0.77 4,106.9 0.79
Solvay Pharma India 1,959.1 0.57 2,160.8 0.57 2,667.3 0.60 3,424.1 0.66
Merck 2,444.1 0.71 2,568.2 0.67 3,106.0 0.70 3,249.7 0.62
MSD Pharmaceuticals 0.0 0.00 1,104.1 0.29 2,516.9 0.56 2,718.9 0.52
Johnson & Johnson 1,560.1 0.46 1,732.5 0.45 2,322.2 0.52 2,516.3 0.48
Eli Lilly and Company (India) 1,225.7 0.36 1,341.2 0.35 1,455.8 0.33 1,645.2 0.32
Fulford (India) 1,128.7 0.33 1,269.8 0.33 1,431.2 0.32 1,629.3 0.31
Allergan India 832.1 0.24 984.8 0.26 1,169.0 0.26 1,455.3 0.28
Organon (India) 951.7 0.28 1,051.6 0.28 1,201.2 0.27 1,212.8 0.23
UCB India 681.2 0.20 718.6 0.19 913.3 0.20 1,053.0 0.20
Serdia Pharmaceuticals (India) 792.9 0.23 836.8 0.22 878.0 0.20 1,003.9 0.19
Galderma India 554.5 0.16 569.6 0.15 791.0 0.18 1,002.4 0.19
Alcon Laboratories 466.6 0.14 483.5 0.13 789.1 0.18 983.9 0.19
Bayer Pharmaceuticals 513.5 0.15 543.4 0.14 756.3 0.17 706.7 0.14
Roche 676.9 0.20 235.9 0.06 475.6 0.11 673.3 0.13
Molekule (Ind) 283.0 0.08 381.3 0.10 534.0 0.12 672.0 0.13
Merck Consumer Health Care 399.1 0.12 407.5 0.11 330.5 0.07 449.9 0.09
Walter Bushell 104.6 0.03 127.5 0.03 151.3 0.03 141.5 0.03
Ferring Pharmaceuticals 76.4 0.02 82.0 0.02 103.6 0.02 117.7 0.02
Lundbeck India Private 79.7 0.02 78.0 0.02 101.5 0.02 116.5 0.02

18
MNC
Annual sales in Rs million (March 2008)
Market share (%) (March 2008)
Annual sales in Rs million (Dec 2008)
Market share (%) (Dec 2008)
Annual sales in Rs million (Dec 2009
Market share (%) (Dec 2009)
Annual sales in Rs million (Dec 2010)
Market share (%) (Dec 2010)
Limited
LG Lifesciences 34.1 0.01 54.1 0.01 75.1 0.02 70.5 0.01
Baxter India 91.4 0.03 76.5 0.02 82.9 0.02 69.8 0.01
Heinz India 59.5 0.02 55.6 0.01 65.3 0.01 69.6 0.01
Menarini Raunaq Pharma 36.8 0.01 37.3 0.01 49.7 0.01 65.5 0.01
Reckitt Benckiser 14.0 0.00 19.2 0.01 46.2 0.01 43.6 0.01
BMS India 6.1 0.00 9.7 0.00 16.5 0.00 33.1 0.01
Eisai Pharmaceuticals India 1.1 0.00 10.3 0.00 20.6 0.00 27.7 0.01
Stiefel India 38.3 0.01 41.9 0.01 20.3 0.00 7.8 0.00
TOTAL (35 Companies) 18.88 19.12 19.06 19.07
Taken over Indian companies
Fresenius Kabi India 78.5 0.02 105.7 0.02 114.7 0.02
Piramal Healthcare Limited 22,652.1 4.35
Ranbaxy Laboratories 17,174.8 4.49 21,755.4 4.88 23,598.8 4.53
Shantha Biotech 0.3 0.00 1.3 0.00
TOTAL (4 companies) 0.0 4.52 4.90 8.91
Total (39 companies)
18.88
23.64
23.96
27.98
Sources and notes: (1) For annual sales and market share figures, we have used Sales audit dataof AIOCD Pharmasofttech AWACS Pvt. Ltd (AIOCD-AWACS). AIOCD-AWACS is a pharmaceutical market research company formed by All Indian Origin Chemists & Distributors Ltd. (AIOCD Ltd) in a joint venture with Trikaal Mediinfotech Pvt. Ltd. AIOCD Ltd. is a corporate pharma retail chain set up by 550000 members of All India Organization of Chemists and Druggists http://www.aiocdawacs.com/); (2) The first group of 35 companies are those which have been identified by us as MNCs out of the 671 companies reported by AIOCD-AWACS based on miscellaneous sources including, the list of top 50 MNCs in the world in Pharmaceutical Executive, May 2010 (www.pharmexec.com); CMIE Prowess database; the list of MNCs from market survey reports of ORG-IMS as used in Chaudhuri, 2005, Table 2.2, p. 18 and relevant company websites. The second group of 4 companies are the Indian companies which have been taken over by MNCs in recent years and are now part of the MNC sector.

19
Another Indian company, Matrix taken over by Mylan in August 2006, not being a domestic formulations player is not considered above.

20
Table 3 Foreign equity in pharmaceutical MNCs in India, 2001-10 (per cent)
2001 2005 2006 2007 2008 2009 2010
Astrazeneca Pharma India 51.5 90 90 90 90 90 90
Novartis India 50.99 50.93 50.93 50.93 50.93 50.93 76.42
Pfizer 40 40 41.23 41.23 41.23 41.23 70.75
Abbott India 51 61.7 61.7 65.14 65.14 68.94 68.94
Aventis Pharma 50.1 50.1 50.1 50.12 50.12 50.12 60.4
Fulford (India) 40 40 40 50.77 53.93 53.93 53.93
Merck 51 51 51 51 51 51 51.8
Wyeth 50.37 51.12 51.12 51.12 51.12 51.12 51.12
GlaxoSmithKline 51 49.15 50.67 50.67 50.67 50.67 50.67
Source: Foreign promoters equity data from CMIE Prowess database.

21
Sources and notes: Calculated from data from the CMIE Prowess database. See Notes to Table 4for the names of the companies considered.
0
20000
40000
60000
80000
100000
120000
140000
160000
1994
1995
1996
1997
1998
1999
2000
2001
2002
2003
2004
2005
2006
2007
2008
2009
2010
Rs m
illio
n
Figure 1 Plant and machinery investments
Top 10 Indian cos MNCs

22
Source and notes: Calculated from Directorate General of Commercial Intelligence & Statistics (DGCI&S) trade data obtained from CMIE India Trades database. Trade figures reported under Chapter 30 have been treated as formulations.
0
1000
2000
3000
4000
5000
600019
95
1996
1997
1998
1999
2000
2001
2002
2003
2004
2005
2006
2007
2008
2009
2010
US$
mill
ion
Figure 2 India's formulations trade
Imports Exports

23
Source and notes: Calculated from CMIE Prowess database. The MNCs considered here are Abbott, Aventis, GSK, Pfizer, Novartis, Merck and Wyeth. Data are available for each of the years 1997 to 2010 for these 7 MNCs only in the CMIE Prowess database. These 7 MNCs account for about 83% of sales of all the 16 MNCs reported by Prowess in 2010.
0
20
40
60
80
100
120
14019
97
1998
1999
2000
2001
2002
2003
2004
2005
2006
2007
2008
2009
2010
US
$ m
illio
n
Figure 3 Imports of finished goods by MNCs

24
Table 4 Relative performance of MNCs and top Indian companies
1994 2004 2010 CARG (1994-2010) (%)
CARG (2004-2010) (%)
Exports (US $ million)
MNCs 38.22 56.92 82.75 5 6
Top 10 Indian cos 167.50 1456.64 4006.48 22 18
Exports/sales (%)
MNCs 4.73 5.02 4.41
Top 10 Indian cos 27.78 45.71 49.31
Net forex earnings (US $ million)
MNCs -20.52 -79.66 -205.05 -15 -17
Top 10 Indian cos 40.07 702.20 2392.58 29 23
Dividend remittances (US $ million)
MNCs 5.18 27.43 54.67 16 12
Source: Calculated from CMIE Prowess database
Notes: * The MNCs are: Glaxosmithkline Pharmaceuticals, Pfizer, Aventis Pharma, Abbott India, Novartis India, Wyeth, Astrazeneca Pharma India, Merck, Fulford (India). Consistent data for 1994, 2004 and 2010 are available for only these 9 MNCs out of the 17 MNCs considered by the CMIE Prowess database. ** The Indian companies considered are Cipla, Dr.Reddy'S Laboratories, Ranbaxy Laboratories, Lupin, Aurobindo Pharma, Matrix Laboratories, Sun Pharmaceutical Inds., Ipca Laboratories, Torrent Pharmaceuticals, Orchid Chemicals & Pharmaceuticals. These are the top 10 Indian companies (in terms of sales in 2010) for which consistent data are available for 1994, 2004 and 2010. For some of the variables, the number of companies actually considered is less depending on the data available.

25
Table 5 Patent status of new drugs marketed in India, 1995-2010
No
Sales 2010 Rs million
Sales 2010 (%)
MNC share 2010
New drugs 180 47266.63 9.1 10.9
Patented post 1995 51 5999.51 1.2 25.2
Patented pre 1995 67 21732.00 4.2 5.5
Patent expired 62 19535.12 3.8 12.6
Total pharmaceutical market 520525.60 100.0 19.1
Source: Derived from the Appendix.

26
Table 6 Market structure of new drugs, 2010
Total no of molecules
No of molecules with 5 or more sellers
No of molecules with 2 to 4 sellers
No of molecules with 1 seller
Patented post 1995 No of molecules (No) 51 19 6 26
Sales 2010 (Rs million) 5999.51 4626.68 155.94 1216.89
No of molecules (%) 100.0 37.3 11.8 51.0
Sales 2010 (%) 100.0 77.1 2.6 20.3
Patented pre-1995 No of molecules (No) 67 46 11 10
Sales 2010 (Rs million) 21732.00 21153.82 309.21 268.97
No of molecules (%) 100.0 68.7 16.4 14.9
Sales 2010 (%) 100.0 97.3 1.4 1.2
Patent expired No of molecules (No) 62 43 11 8
Sales 2010 (Rs million) 19535. 12 19125.04 256.65 153.43
No of molecules (%) 100.0 69.4 17.7 12.9
Sales 2010 (%) 100.0 97.9 1.3 0.8
Source: Derived from the Appendix.

27
Table 7 New drugs marketed by MNCs, 2010
No of molecules
MNC sales 2010 Rs million
MNC sales (%)
Marketed by MNCs 92 5171.42 100.0
MNC monopoly 33 1601.87 31.0
Patented 25 1214.00 23.5
Patent expired 2 120.99 2.3
Pre-1995 6 266.88 5.2
MNC share: 50-100% 8 910.19 17.6
MNC share: 25-50% 12 1376.49 26.6
MNC share: 10-25% 7 566.98 11.0
MNC share: 5-10% 9 531.87 10.3
MNC share: 1-5% 12 165.92 3.2
MNC share: < 1% 11 18.10 0.3
Source: Derived from the Appendix.

28
Table 8 Prices of MNC monopoly drugs
Molecule name Brand name MNC MRP* in Rs Therapeutic group
Trastuzumab Herceptin Injection 50 Ml Roche 135200 Anti-cancer
Cetuximab Erbitux 700 Mg Injection 50 Ml Merck 87920 Anti-cancer
Ixabepilone Ixempra 45 Mg Injection 1 Bristol Myers Squibb 66430 Anti-cancer
Pegaptanib Macugen 0.3 Mg Injection 90 Ml Pfizer 45350 Ophthal/ otologicals
Rasburicase Fasturtec 1.5 Mg Injection 1 Vial Sanofi-Aventis 45000 Cancer related
Infliximab Remicade 100 Mg Injection 1 Fulford 41039 Pain/ analgesics
Tocilizunab Actemra 400 Mg Injection 1 Roche 40545 Anti-cancer
Bevacizumab Avastin 100 mg injection 1 #
37180
Abatacept Orencia 250 Mg Injection 1 - Bristol Myers Squibb 31851 Pain/ analgesics
Daclizumab Zenapax 25 Mg Injection 5 Ml Roche 28875 Anti-cancer
Etanercept Enbrel 50 Mg Injection 1 Wyeth 15761 Pain/ analgesics
Caspofungin Cancidas 70 Mg Injection 10 Ml MSD 12500 Anti-infectives
Anidulafungin Eraxis 100 Mg Injection 1 Pfizer 9107 Anti-infectives
Sunitinib Sutent 50 Mg Capsule 1 Pfizer 8715 Anti-cancer
Micafungin Mycamine 50 Mg Injection 1 Vial GlaxoSmithKline 6250 Anti-infectives
Lenograstim Granocyte 34 Injection 1 Sanofi Aventis 5720 Anti-cancer
Daptomycin Cubicin 350 Mg Injection 1 Novartis 5051 Others
Lapatinib Tykerb 250 Mg Tablet 1 GlaxoSmithKline 4468 Anti-cancer
Liraglutide Victoza 6 Mg Injection 3 Ml Abbott 4315 Anti diabetic
Dasatinib Sprycel 70 Mg Tablet 1 Bristol Myers Squibb 3905 Anti-cancer
Fondaparinux Arixtra 2.5 Mg Injection 0.5 Ml GlaxoSmithKline 620 Cardiac
Reviparin Clivarine PFS SC 4200 Iu Injection 0.6 Ml Abbott 482 Cardiac

29
Molecule name Brand name MNC MRP* in Rs Therapeutic group
Rivaroxaban Xarelto 10 Mg Tablet 1 Bayer 480 Cardiac
Ceftibuten Procadax 90 Mg Syrup 30 Ml Fulford 384 Anti-infectives
Zuclopenthixol Clopixol Depot 200 Mg Injection 1 Ml Lundbeck 247 Neuro / CNS
Certoparin Troparin 3000 Iu Injection 0.3 Ml Novartis 235 Cardiac
Dronedarone Multaq 400 Mg Tablet 1 Sanofi Aventis 84 Cardiac
Varenicline Champix 1 Mg Tablet 1 Pfizer 59 Neuro / CNS
Aliskiren Rasilez 300 Mg Tablet 1 Novartis 58 Cardiac
Sitagliptin Januvia 100 Mg Tablet 1 MSD 43 Anti diabetic
Saxagliptin Onglyza 5 Mg Tablet 1 Bristol Myers Squibb 38 Anti diabetic
Cerivastatin Lipobay 0.3 Mg Tablet 1 Bayer 32 Cardiac
Piribedil Trivastal L.A 50 Mg Tablet Serdia 20 Neuro / CNS
Mianserin Depnon 30 Mg Tablet 1 Organon 12 Neuro / CNS
Source: List of MNC monopoly products derived from the Appendix. Price data have been obtained from the Sales audit data of AIOCD Pharmasofttech AWACS Pvt. Ltd (AIOCD-AWACS). For the selected molecules, we also tried to find out the prices from two large retail outlets in Kolkata – Calcutta Chemist Corner and ANRI Hospitals.
*: MRP: maximum retail price
#: We have also included this product for which Roche accounts for 96% of the market.

30
Appendix
New Drugs Marketed in India 1995-2010
Molecule Patent status1) Total no of cos 3)
No of MNCs
Total Sales 2010 in Rs
MNC share in total sales 2010
Abatacept Patented* 1 1 246838 100.0
Acamprosate Patent expired 1 0 29251062 0.0
Adefovir Pre-1995 3 0 51373753 0.0
Alendronate Pre-1995 12 0 92271990 0.0
Alfuzosin Patent expired 9 0 152923587 0.0
Aliskiren Patented 1998 1 1 33241863 100.0
Amifostine Pre-1995 5 0 266852 0.0
Anastrozole Patent expired 17 2 98974350 72.4
Anidulafungin Pre-1995 1 1 13090556 100.0
Aprepitant Pre-1995 4 0 4997769 0.0
Artemether+ Lumefantrine Pre-1995 35 0 522355695 0.0
Atazanavir Patented-2000 4 0 30520061 0.0
Atomoxetine Patent expired 4 0 60469542 0.0
Atorvastatin Pre-1995 115 5 6348100931 0.1
Azelaic Acid Patent expired 3 0 25464698 0.0
Azelastine Eye Drops/ Ointment Patent expired 4 0 10167306 0.0
Azelastine Nasal Drops Patent expired 3 0 12898862 0.0
Balsalazide Patent expired 5 0 31104327 0.0
Bendamustine Patent expired 2 0 1017997 0.0
Bicalutamide Patent expired 10 1 152797846 7.7
Bivalirudin Pre-1995 5 0 10132486 0.0
Bortezomib Pre-1995 7 1 17109842 25.1
Brimonidine Eye Drops/ Ointment Patent expired 11 5 177090228 64.7
Butenafine Pre-1995 4 0 13259998 0.0
Cabergoline Patent expired 10 0 167721378 0.0

31
Molecule Patent status1) Total no of cos 3)
No of MNCs
Total Sales 2010 in Rs
MNC share in total sales 2010
Candesartan Pre-1995 6 0 10335701 0.0
Capecitabine Pre-1995 14 1 85897281 34.8
Carvedilol Patent expired 25 1 460106428 5.7
Caspofungin Pre-1995 1 1 237625635 100.0
Cefditoren Patented 1996 11 0 157379914 0.0
Ceftibuten Pre-1995 1 1 473860 100.0
Celecoxib Pre-1995 15 0 39829872 0.0
Cerivastatin Patent expired* 1 1 4832 100.0
Certoparin Patented* 1 1 9280 100.0
Cetuximab Patented* 1 1 270000 100.0
Ciclesonide Pre-1995 5 0 19962359 0.0
Cilostazole Patent expired 9 1 222913239 4.3
Citalopram Patent expired 24 0 56617274 0.0
Clopidogrel Pre-1995 57 3 1535556675 9.7
Daclizumab Patented* 1 1 1462500 100.0
Daptomycin Patented 1996 1 1 16730664 100.0
Darunavir Pre-1995 2 0 3400478 0.0
Dasatinib Patented 2000 1 1 1578366 100.0
Deferasirox Patented 1997 2 1 7754512 1.8
Desvenlafaxine Patented 2002 8 0 97932981 0.0
Dexrazoxane Patent expired 1 0 57308 0.0
Docetaxel Patent expired 21 2 124427852 45.6
Donepezil Patent expired 16 0 289831793 0.0
Dronedarone Pre-1995 1 1 599652 100.0
Duloxetine Pre-1995 35 0 301175661 0.0
Dutasteride Patent expired 8 0 100113731 0.0
Efavirenz Pre-1995 7 0 51558261 0.0
Emtricitabine+ Tenofovir Pre-1995 5 0 25063347 0.0
Entacapone Pre-1995 2 0 12486081 0.0
Entecavir Patented 1995 5 1 20963938 1.8
Epinastine Eye Drops / Ointment Patent expired 3 1 19199518 37.7
Eplerenone Patent expired 5 0 116608039 0.0

32
Molecule Patent status1) Total no of cos 3)
No of MNCs
Total Sales 2010 in Rs
MNC share in total sales 2010
Eptifibatide Pre-1995 12 1 54004643 0.038
Erlotinib Patented 1998 6 1 14438709 78.9
Etanercept Patented* 1 1 43861014 100.0
EthinylEstradiol+ Drospirenone Patent expired 10 0 235972432 0.0
Exemestane Patent expired 3 1 9002421 94.3
Exenatide Patented 1996 3 1 24528567 54.1
Ezetimibe Pre-1995 21 0 23073475 0.0
Febuxostat Pre-1995 13 0 106512111 0.0
Fexofenadine Patent expired 44 2 661222851 85.6
Fondaparinux Patent expired 1 1 120988109 100.0
Fosphenytoin Patent expired 4 0 73701843 0.0
Fulvestrant Patented 2001 2 1 17235793 92.4
Gatifloxacin Patented 1995 103 1 300815155 0.024
Gemcitabine Patent expired 20 1 74103213 30.3
Gemifloxacin Patented 1995 23
278806732 1.2
Glimepiride Patent expired 93 3 2145782503 25.5
Imatinibmesylate Patented -1995 14 0 58809956 0.0
Imiquimod Patent expired 4 0 12714818 0.0
Indinavir Pre-1995 5 0 4979707 0.0
Infliximab Patented* 1 1 30032228 100.0
Irinotecan Patent expired 1 0 12947 0.0
Ixabepilone Patented 1998 1 1 645693 100.0
Lamivudine Pre-1995 10 0 56929951 0.0
Lapatinib Patented 1997 1 1 21987616 100.0
Latanoprost Patent expired 9 1 165150400 31.4
Leflunamide Patent expired 8 1 251860518 19.6
Lenalidomide Patented 1996 5 0 5672436 0.0
Lenograstim Patented* 1 1 3401200 100.0
Letrozole Patent expired 29 1 482828313 0.5
Levetiracetam Patent expired 19 2 800406716 6.9
Linezolid Pre-1995 26 2 993781949 0.9
Liraglutide Patented 1 1 3846515 100.0
Losartan Patent expired 72 0 1951512997 0.0

33
Molecule Patent status1) Total no of cos 3)
No of MNCs
Total Sales 2010 in Rs
MNC share in total sales 2010
Loteprednol Eye Drops / Ointment Pre-1995 5 0 56547175 0.0
Lubiprostone Pre-1995 1 0 231884 0.0
Meloxicam Patent expired 15 0 32124257 0.0
Memantine Patented 1995 7 0 70147715 0.0
Meropenem Patent expired 56 5 1547410147 28.0
Mianserin Patented* 1 1 338172 100.0
Micafungin Pre-1995 1 1 5290471 100.0
Mifepristone Patent expired 25 0 2243458848 0.0
Miglitol Patent expired 11 0 167596321 0.0
Milnacipran Patented 2001 5 0 46771909 0.0
Modafinil Pre-1995 6 0 59404180 0.0
Moxifloxacin Pre-1995 9 1 298732127 0.002
MycophenolateMofetil Patent expired 18 2 246781151 4.5
Nateglinide Patent expired 4 0 17854696 0.0
Nelfinavir Pre-1995 3 0 2210524 0.0
Nepafenac Pre-1995 2 0 19753837 0.0
Nevirapine Pre-1995 7 0 13537102 0.0
Olanzapine Pre-1995 55 1 583835582 1.6
Olmesartan Patented 1996 26 5 750872301 8.3
Orlistat Patented 1998 16 0 431823193 0.0
Oseltamivir Patented 1995 5 0 22110310 0.0
Oxaliplatin Patent expired 15 0 25126058 0.0
Oxcarbazepine Patent expired 23 2 908244489 12.6
Paliperidone Patent expired 6 0 46429622 0.0
Pantoprazole Patent expired 231 2 3640200734 1.0
Pegaptanib Pre-1995 1 1 9795600 100.0
Pioglitazone Pre-1995 62 2 843996483 0.0
Piribedil Patented* 1 1 29657626 100.0
Pitavastatin Patented 1995 3 0 114414 0.0
Poractant Alfa Patent expired 1 0 2880693 0.0
Pramipexole Pre-1995 5 0 135775476 0.0
Prasugrel Pre-1995 18 0 38425415 0.0
Pregabalin Pre-1995 33 3 795467106 22.1

34
Molecule Patent status1) Total no of cos 3)
No of MNCs
Total Sales 2010 in Rs
MNC share in total sales 2010
Quetiapine Pre-1995 22 0 297157599 0.0
Rabeprazole Pre-1995 150 7 2411734911 7.7
Raloxifene Pre-1995 15 2 35158851 1.0
Ranolazine Patented 1999 13 0 285164436 0.0
Rasagiline Pre-1995 3 0 29419085 0.0
Rasburicase Patented* 1 1 69231 100.0
Repaglinide Patented 1998 6 1 77902119 47.4
Retapamulin Patented 2001 1 0 2895287 0.0
Reviparin Patented* 1 1 17038662 100.0
Rifaximin Patented 2004 5 0 134748771 0.0
Ritonavir Pre-1995 5 0 11532534 0.0
Rivaroxaban Patented 1 1 822857 100.0
Rivastigmine Patent expired 5 1 19439629 0.011
Rizatriptan Pre-1995 4 0 33135071 0.0
Rofecoxib Patent expired* 54 2 5918264 2.6
Rosiglitazone Pre-1995 14 1 130910717 20.7
Rosuvastatin Patented 1996 27 2 1384584698 11.1
Saxagliptin Patented 1 1 16105780 100.0
Sertaconazole Pre-1995 5 0 88813265 0.0
Sevelamer Pre-1995 8 0 102595427 0.0
Sildenafil Pre-1995 59 2 2021683779 3.1
Sirolimus Pre-1995 8 1 34240422 4.0
Sitagliptin Patented 1997 1 1 867512791 100.0
Solifenacin Patented 1998 3 0 75782806 0.0
Sparfloxacin Patent expired* 104 2 205820612 0.001
Sunitinib Patented 2000 1 1 68152081 100.0
Tadalafil Patented 1996 19 0 411705577 0.0
Tamsulosin Patent expired 17 1 547708081 0.010
Tazarotene Pre-1995 6 0 15306338 0.0
Tegaserod Patent expired* 10 0 34722632 0.0
Telmisartan Pre-1995 62 3 1850158337 1.7
Temozolomide Patent expired 13 1 26933077 13.8
Tenofovir Patented 1997 6 0 76028937 0.0
Thalidomide Pre-1995 11 0 16202350 0.0

35
Molecule Patent status1) Total no of cos 3)
No of MNCs
Total Sales 2010 in Rs
MNC share in total sales 2010
Tiagabine Pre-1995 1 0 23624 0.0
Tigecycline Pre-1995 6 1 214596427 20.1
Tiotropium Pre-1995 7 0 208687885 0.0
Tirofiban Pre-1995 16 1 264115302 7.2
Tizanidine Patent expired 9 1 69224520 48.9
Tocilizunab Patented* 1 1 678196 100.0
Tolterodine Pre-1995 10 1 166909187 9.5
Topiramate Patent expired 19 1 269494900 39.3
Topotecan Patent expired 1 0 225782 0.0
Trandolapril Patent expired 1 0 6461 0.0
Trastuzumab Patented* 1 1 24275819 100.0
Travoprost Pre-1995 4 1 123784103 88.2
Trospium Patent expired 2 0 14161666 0.0
Valdecoxib Patent expired* 37 0 3072770 0.0
Valsartan Pre-1995 5 2 159390842 29.3
Varenicline Patented 2000 1 1 25505138 100.0
Voriconazole Patent expired 14 1 99740448 6.4
Zafirlukast Pre-1995 1 0 74355 0.0
Zaleplon Patent expired 7 0 203731 0.0
Zanamivir Pre-1995 1 0 1770860 0.0
Ziprasidone Pre-1995 3 0 15388298 0.0
Zonisamide Patent expired 7 1 65317418 0.1
Zuclopenthixol Patented* 1 1 6526837 100.0
Sources and notes:
1) The Appendix lists all the new drugs introduced in India since January 1995 (and till December 2010). The list of NCEs/NBEs since 1995 has been obtained from the website of USFDA. Marketing status in India has been ascertained from the website of the Central Drugs Standard Control Organization. For the period 1999 to 2010, we have used the ready lists available at the websites of USFDA and CDSCO respectively, http://www.fda.gov/Drugs/DevelopmentApprovalProcess/HowDrugsareDevelopedandApproved/DrugandBiologicApprovalReports/ucm121136.htm)and http://cdsco.nic.in/listofdrugapprovedmain.html. For the period 1995-1998. For the

36
period 1995-1998, we have used, Gopakumar 2010, Table F. This table covers only NMEs. Hence NBEs approved in USA between 1995 and 1998 are not included above. Products approved in USA before 1995 but introduced in India after 1995 are not included above. Another limitation is that products not in use in USA (and hence not approved by USFDA) but in use in India are not covered. But the table also lists the following 12 molecules marketed in India for which MNCs are the sole sellers. This to an extent may take care of the limitation of our methodology that all the NMEs/NBEs approved during 1995-2010 may not have been included initially. These 12 molecules are: certoparin, daclizumab, etanercept, infliximab, lenograstim, mianserin, piribedil, rasburicase, reviparin, tocilizunab, trastuzumab, zuclopenthixol.
2) The number of sellers and the sales figures have been obtained from the Sales audit data of AIOCD Pharmasofttech AWACS Pvt. Ltd (AIOCD-AWACS). Only single ingredient formulations have been considered here except in the cases of emtricitabine with tenofovir, ethinylestradiol with drospirenone and artemether with lumefantrine. We have considered the simplified names of the molecules as given in AIOCD-AWACS, for example tenofovir rather than tenofovir disoproxil fumarate.
3) For the patent status we have used the electronic “Orange Book: Approved Drug Products with Therapeutic Equivalence Evaluations” accessed from http://www.accessdata.fda.gov/scripts/cder/ob/default.cfm. The Orange book also lists the patents with expiry dates relating to the NMEs covered by it. Typically several patents – not only the patent on the NME but also secondary patents, for example formulation patents - are listed with different expiry dates. The patent with the earliest expiry date is considered to be the NME patent since NME patent is usually the first patent which is applied for. The term patent is 20 years. Hence any patent with an expiry date before 31 December 2014 is considered to be a drug for which the patent has been granted before 1 January 1995. These drugs are considered to be “pre-1995” molecules. For example pegaptanib. The expiry date of the earliest patent is 27 October, 2013. Hence it is considered to be a drug with the NME patent granted in the year 1993. Where the earliest expiry date is after 31 December 2014, the drug is considered to be patented. For example lapatinib. The earliest expiry date is 11 July, 2017. Hence it is considered to be a drug patented in 1997 (“patented 1997”). When the Orange Book mentions that there are “no unexpired patents for this product”, the drug is considered to be “patent expired”. For example tamsulosin. The Orange Book lists generic manufacturers such as Wockhardt and Sun. Where information on patent status is not available from the Orange Book, as for example in the case of NBEs, we have treated the drug as patented (signified as “patented*” in the table) if an MNC is the sole seller in India. The drug is treated as “patent expired*” where there are multiple sellers. It is important to point out that use the Orange Book is not a full proof way of finding out

37
the patent status. One of the major limitations is that patents on NBEs are not required to be listed there. We have relied upon the Orange Book in the absence of any systematic information on pharmaceutical product patents granted in India.

38
Notes
1Cited by Kidron 1965, p. 251. 2See Chaudhuri 2005, chapter 2 for an account of the rise and growth of the Indian pharmaceutical industry. 3 “Drug firms face billions in losses as patents end”, New York Times article re-produced in Business Standard, 3August, 2011.
4 Sanjay Pingle, “Leading 15 global pharma majors suffer setback in 2010, net falls by over 20%”, www.pharmabiz.com, June 6, 2011.
5MNCs invested more in India during 1972-94 than they did in the earlier period see the interview with N.H. Israni, in IDMA Bulletin, XXXIII (42), 14 November 2002. 6CMIE Prowess data base. Consistent data for 1994 to 2010 are available for only these 9 MNCs out of the 17 MNCs considered by the CMIE Prowess database. For the names of these MNCs and the top 10 companies, see Table 4.
7Accessed from the website of the Office of the Economic Adviser, Ministry of Commerce and Industry (www.eaindustry.nic.in). 8Calculated from CMIE India Trades database. 9 See, for example, “List of Finished formulation registered from 2003 to 2009” accessed from the website of Central Drugs Standard Control Organization (www.cdsco.nic.in). 10 “Eli Lilly insulin brand paves way for hike in imported rug prices”, Economic Times, 11 June, 2011. 11 Under Articles 65.2 and 64.4 of TRIPS, India had time till 1 January, 2005 to introduce product patent protection in pharmaceuticals. But Articles 70.8 and 70.9 put a limitation on the transition period allowed under Article 65 – India was required to introduce “mail box” and “exclusive marketing rights” from 1 January, 1995. 12 See the notes to the Appendix for further elaboration of the methodology and also of the limitations. 13Business Monitor, “India: Pharmaceuticals and Healthcare Report”, June, 2011 14For the background, see Park 2010. 15 As explained in the notes to the Appendix, we have considered the patent with the earliest expiry date as the NME patent. The earliest patents for these four products, for example expires during 2011 to 2013 and hence these have been treated as pre-1995 molecules. But there are also other patents listed expiring after 2014 and if any of these are the relevant product patents, then these are actually post-1995 products.
16“Leukaemia (chronic myeloid) - dasatinib, high dose imatinib and nilotinib (review): appraisal consultation document” in thewebsite of the National Institute for Health and Clinical Excellence, http://guidance.nice.org.uk/TA/WaveR/99/Consultation/DraftGuidance. Foreign exchange rates fluctuate. Assuming a rate of Rs 70 per GBP, the cost of treatment is same.
17 “Hepatitis C virus – prevention and treatment”, Press statement issued by International Treatment Preparedness Coalition – India (ITPC-India), 21 October, 2011. 18 See, for example, “List of Finished formulation registered from 2003 to 2009” accessed from the website of Central Drugs Standard Control Organization (www.cdsco.nic.in). 19 “GlaxoSmithKline launches two cancer drugs at reduced prices” in The Hindu Business LIne, July 22, 2011, http://www.thehindubusinessline.com/companies/article2285697.ece.