multiple causality in developmental disorders ... · different underlying cognitive deficits will...
TRANSCRIPT
Developmental Science 6:5 (2003), pp 537–556
© Blackwell Publishing Ltd. 2003, 9600 Garsington Road, Oxford OX
4
2DQ, UK and
350
Main Street, Malden, MA 02148, USA.
UNCORRECTED PROOF
DESC_311 Pages:
20
Blackwell Publishing Ltd
PAPER
Multiple causality in developmental disorders
Multiple causality in developmental disorders: methodological implications from computational modelling
Michael S.C. Thomas
Neurocognitive Development Unit, Institute of Child Health, London
Abstract
When developmental disorders are defined on the basis of behavioural impairments alone, there is a risk that individuals withdifferent underlying cognitive deficits will be grouped together on the basis that they happen to share a certain impairment. Thisphenomenon is labelled
multiple causality
. In contrast, a developmental disorder generated by a single underlying cognitive deficitmay nevertheless show variable patterns of impairments due to individual differences. Connectionist computational models ofdevelopment are used to investigate whether there may be ways to distinguish disorder groups with a single underlying cause(homogeneous disorder groups) from disorder groups with multiple underlying causes (heterogeneous disorder groups) on thebasis of behavioural measures alone. A heuristic is proposed to assess the underlying causal homogeneity of the disorder groupbased on the variability of different behavioural measures from the target domain. Heterogeneous disorder groups are likely toshow smaller variability on the measure used to define the disorder than on subsequent behavioural measures, while homogeneousgroups should show approximately equivalent variability. Homogeneous disorder groups should show reductions in the variabilityof behavioural measures over time, while heterogeneous groups may not. It is demonstrated how these predictions arise fromcomputational assumptions, and their use is illustrated with reference to behavioural data on naming skills from two develop-mental disorder groups, Williams syndrome and children with Word Finding Difficulties.
Introduction
Take a group of children with a particular developmen-tal disorder, such as a problem with productive vocabu-lary. How do we establish what is atypical about theunderlying cognitive system? The standard approachwithin psychology is to run behavioural experiments andlook for anomalous but consistent patterns across indi-viduals in the disorder group. Such patterns can indicatedifferences in the way representations or processes havedeveloped. Perhaps these children demonstrate a par-ticular delay in producing certain types of words, or aparticular pattern of errors. Of course, individual dif-ferences and measurement error will add ‘noise’ to thedata, but the hope is that consistent patterns character-izing the disorder will nevertheless emerge. Once theunderlying cause of behavioural deficits is understood,we can begin to consider an appropriate form of reme-diation for the disorder, and use it theoretically to shedlight on processes of normal development.
However, consider the following situation. What ifthere is no single cause for the behavioural impairment,
if instead the behavioural metric used to define the dis-order (such as slow production of words) can be causedby a number of different processing anomalies in thelanguage system. In this case, the definitional measurewill have brought together a disorder group with hetero-geneous underlying causes. As a consequence, it may bedifficult to discern a consistent pattern in the data gen-erated from behavioural experiments.
The problem here is that ‘noise’ in experimental datamay be either the result of individual differences (andmeasurement error) arising from a disorder group witha single underlying cognitive cause, or it may be theresult of a disorder group in which there are multipleunderlying causes, each producing its own consistentbehavioural pattern (with individual variation and meas-urement error). Multiple patterns are then superimposedon each other when the results are viewed for the groupas a whole. The question considered in this paper is, howcan we tell the difference between these two possibilities?Presuming that we expect some degree of individual vari-ation in people with a developmental disorder, whatbehavioural evidence will tell us whether a given disorder
Address for correspondence: Michael Thomas, School of Psychology, Birkbeck College, University of London, Malet Street, London WC1E 7HX,UK; e-mail: [email protected]

538 Michael S.C. Thomas
© Blackwell Publishing Ltd. 2003
UNCORRECTED PROOF
group has a single underlying cognitive cause or multipleunderlying causes? In this paper, this question is ex-plored from the perspective of computational modelling,building on recent work in the modelling of atypicaldevelopment and individual variation. First, however,this issue is briefly situated within the wider perspectiveof the study of developmental disorders.
If one excludes disorders caused by exposure to animpoverished environment, broadly speaking develop-mental disorders can be split into two groups: (1) dis-orders defined by a genetic aetiology (such as FragileX syndrome, Down’s syndrome, Williams syndrome,velocardiofacial syndrome, Turner’s syndrome), and (2)those defined on behavioural grounds (such as autism,Attention Deficit Hyperactivity Disorder, Specific Lan-guage Impairment (SLI), and developmental versions ofvarious acquired disorders such as dyslexia, dyscalculia,prosopagnosia and amnesia). Although precise geneticscauses have not yet been identified for disorders withinthe behaviourally defined group, these disorders canoften show significant degrees of heritability, for ex-ample as in the cases of SLI and autism (Bishop, North& Donlan, 1995; Pennington & Smith, 1997; Simonoff,Bolton & Rutter, 1998).
Where no evidence exists to identify robust sub-typesof a disorder, it is assumed that each disorder can becharacterized in terms of a distinct, atypically devel-oping cognitive architecture. Attempts to identify thisarchitecture then proceed via experimentation within apsychological framework. Such attempts must necessar-ily deal with the fact of individual variation: even whena disorder group can be identified as sharing an identicalgenetic anomaly (such as in the case of Williams syn-drome), individuals can nevertheless show a large degreeof variability in the behavioural deficits they exhibit (e.g.for Williams syndrome, see Pezzini, Vicari, Volterra,Milani & Ossella, 1999). Even when there is reason tobelieve that there is a single underlying cause at the cog-nitive level, this cause must be identified through ascreen of individual variation. Variability is also to beexpected in behaviourally defined developmental disor-ders, but now there is no independent basis to suggest asingle underlying cause. Therefore, it is legitimate to askwhether the variability in the disorder stems from indi-vidual variation overlying a single cognitive cause, orfrom different underlying cognitive causes, each with itsown individual variability. Such debates can already befound in the study of Specific Language Impairment(e.g. Tomblin & Pandich, 1999; van der Lely, 1999) andin the study of developmental dyslexia (e.g. Fletcher,Foorman, Shaywitz & Shaywitz, 1999). Importantly, thefact that many behaviourally defined developmental dis-orders are associated with high levels of heritability does
not preclude the possibility that they have multiple un-derlying causes, since
each
of the multiple causes coulditself produce an equivalent level of heritability. Highheritability does not necessarily imply single underlyingcause.
Even though
multiple causality
in behaviourallydefined disorders is a distinct possibility, the difficultylies in how we identify that it is present in a given disor-der group. Specifically, we currently lack a behaviouralmarker for multiple causality because we cannot system-atically compare what sort of data would be producedby a disorder group with a single underlying cause andone with multiple causes. Computational modelling, onthe other hand, provides a controlled, formal environ-ment in which exactly this sort of question can be con-sidered. It provides the opportunity to construct modelswhich have developmental deficits, and to define inadvance disorder groups that share a common under-lying deficit versus those that contain individuals withdifferent underlying deficits. By comparing thesegroups, we may then seek to identify a behaviouralmarker of multiple causality. First, however, it is importantto understand how computational models have beenused to study atypical development and individualdifferences.
Computational models of typical and atypical development
The increasing emergence of computational modellingas an approach to the investigation of typical develop-ment has made possible an extension of these techniquesinto the realm of atypical development. Much of themodelling of typical development has taken place withinthe connectionist framework (see e.g. Elman, Bates,Johnson, Karmiloff-Smith, Parisi & Plunkett, 1996). It isthis framework that will form the focus of this article.
A connectionist model of typical development beginsby formulating the chosen cognitive domain as a set ofinputs or input-output mappings. These are thenencoded in a psychologically plausible representationalformat. The training set is applied (according to someregime) to a connectionist network deemed appropriatefor acquisition of the cognitive domain. A successfulmodel will exhibit an improvement in performance thatfollows the developmental trajectory found in children,as well as the final level of competence found at the endof development. Implicit in such models are computa-tional constraints built into the system prior to thedevelopmental process. These constraints shape the sub-sequent developmental trajectory when the training setis applied to the model. The constraints include the ini-
Multiple causality in developmental disorders 539
© Blackwell Publishing Ltd. 2003
UNCORRECTED PROOF
tial architecture, the representational scheme used todepict the cognitive domain as a set of mappings, thelearning rule and the dynamics of activation flowthrough the network.
Connectionist models of developmental disordersassume that differences in these initial computationalconstraints are the cause of subsequent atypical traject-ories of development, trajectories which may includebehavioural impairments during or at the end of thedevelopmental process (see Thomas & Karmiloff-Smith,2002a, for a review). For example, categorization deficitsin
autism
have been modelled in a system which pos-sesses an atypical initial architecture (Cohen, 1994,1998).
Developmental dyslexia
has been modelled by vari-ous researchers using models which possess atypicalitiesin initial architecture, in initial activation dynamics or inthe initial learning rule (e.g. Harm & Seidenberg, 1999;Seidenberg & McClelland, 1989). Deficits in inflectionalmorphology in
SLI
have been modelled in a system withinitial atypicalities in representational schemes (Hoeffner& McClelland, 1993), and deficits in inflectional mor-phology in
Williams syndrome
have been investigated ina model experiencing a variety of changes in initial con-straints to the processing of semantic or phonologicalknowledge (Thomas & Karmiloff-Smith, 2002b).
This approach to explaining deficits in developmentaldisorders accords with the recently elucidated
neurocon-structivist
approach (Elman
et al.
, 1996; Karmiloff-Smith,1998; Oliver, Johnson, Karmiloff-Smith & Pennington,2000), which argues that despite behavioural similarit-ies, no strong analogies can be drawn between develop-mental deficits and acquired deficits which emerge inadults who have experienced brain damage. While the lat-ter may well correspond to selective damage to high-levelcognitive modules, the former will be the consequenceof atypical trajectories of development operating underdifferent low-level neurocomputational constraints. Inthe case of genetic disorders, it is likely that geneticanomalies will act on these low-level neurocomputa-tional constraints, rather than coding directly for (thesuccess or failure of) high-level cognitive modules. Inthe developmental disorder, the developmental processitself is a key mediator between genome and phenotype(Karmiloff-Smith, 1998; see Thomas & Karmiloff-Smith,in press a, for a detailed computational considerationof the relation of acquired and developmental deficits).The advantage of computational models in this con-text is that they move away from a static considerationof developmental deficits, and allow for a much moreprecise consideration of dynamic explanations of de-velopmental deficits that focus on the developmentalprocess itself as a key causal element in generating thedisorder.
Multiple causality in models of disorders
The computational modelling of developmental dyslexiaillustrates one important idea to emerge from this workon atypical development. It is that a given behaviouralimpairment (such as poor reading of exceptions wordsin dyslexia) can be generated by more than one atypicalcomputational constraint. For example, poor exceptionword reading was simulated in separate studies by reduc-ing the number of internal processing resources availablein the model, by slowing down the learning rate, and byusing an inefficient learning algorithm (Bullinaria, 1997;Harm & Seidenberg, 1999; Plaut, McClelland, Seidenberg& Patterson, 1996; Seidenberg & McClelland, 1989; seeThomas & Karmiloff-Smith, in press a, for review). Eachof these manipulations punishes the learning of patternsthat are less strongly encoded in the training set.
Thomas and Karmiloff-Smith (2002b) carried out amore systematic exploration of the potential for multiplecausality in such models. This work initially set out totest computationally the viability of six competing hypo-theses for explaining the pattern of performance shownby individuals with Williams syndrome in one area oflanguage development, the acquisition of the Englishpast tense. Starting with a model of typical develop-ment in the domain, initial computational constraintswere varied in line with each theoretical hypothesis,and the subsequent atypical trajectories compared againstempirical data. Importantly, Thomas and Karmiloff-Smith did not stop with the evaluation of just these sixhypotheses; they also went on to explore the backgroundflexibility of the model in producing different patternsof impairments under a range of changes to the initialcomputational constraints in the model. The results de-monstrated two points. First, for a given behaviouralmeasure, there were often several initial constraints thatwould generate a deficit in this measure. For example,generalization of regularities within the past tense do-main to novel exemplars (such as the ‘add -ed’ rule)could be impaired by initial changes to the architecture(use of a four-layer rather than three-layer network;use of fewer hidden units), by initial changes to therepresentational schemes (a reduction in the similaritybetween training exemplars) or by initial changes to pro-cessing dynamics (processing noise, decreased discrim-inability in the activation function of units). Second,changes in initial computational constraints did tend toproduce distinct
patterns
of deficits (and sometimesimprovements) across
sets
of behavioural measures per-taining to the domain, in this case six measures used toassess the overall performance of the system.
These simulations confirm that, to the extent that con-nectionist systems are valid models of development,

540 Michael S.C. Thomas
© Blackwell Publishing Ltd. 2003
UNCORRECTED PROOF
multiple causality of deficits is highly plausible. Theyalso indicate that causes of deficits are only ambiguouswhen the deficits are narrowly defined on a restrictednumber of measures. The wider the range of measuresused to assess a system, the smaller the chance of mul-tiple causality, since a
pattern
of deficits across severalmeasures is likely to have a unique cause. The narrowerthe deficit used to define a behavioural disorder, thegreater the chance of recruiting systems into the disordergroup which have different computational causes under-lying their deficit and which overlap only on this particu-lar deficit.
We have, then, a computational framework in whichissues of single or multiple causality in the genesis ofdevelopmental deficits can be considered. But for thepurposes of this paper, a computational theory of indi-vidual differences is also required, since it is individualvariation that intervenes between the cognitive cause(s)of a disorder and our ability to assess it empiricallythrough group studies.
Computational accounts of individual variation
Little systematic work on individual variation has beencarried out in connectionist psychology. When Thomasand Karmiloff-Smith (in press b) reviewed this area,they found that researchers had proposed that indivi-dual variation could be accounted for by manipulationsto the same computational parameters previouslyemployed to capture other forms of cognitive variation.For example, an alteration to the level of internalprocessing resources (numbers of hidden units) in con-nectionist networks has been proposed as a candidate toexplain individual variation, but also (independently) asa candidate to explain change in performance acrosscognitive development, and as a candidate to explainchanges in ageing, and as a candidate to explain atypicaltrajectories of development. The proposal that
all
formsof cognitive variation can correspond to changes to thesame underlying parameter is unlikely to be theoreticallytenable. However, it is perhaps unfair to consider this
defacto
position as an explicit theory, given the very recentapplication of cognitive modelling across the full set ofdomains. A more coherent and differentiated positionmay emerge with time.
With respect to connectionist accounts of individualdifferences, two things can currently be concluded. First,many connectionist researchers (sometimes implicitly)take the view that differences in the initial random con-nection strengths in their networks and differences in therandom order of exposure to items in the training settogether form a possible explanation of individual vari-
ability. Second, this view is almost certainly wrong, bothon neurobiological grounds (i.e. it seems unlikely thatnormal brains are anatomically identical save for initialdifferences in connection strengths) and on empiricalgrounds (i.e. to explain the general factor of intelligenceby appeal to random initial connectivity alone, onewould have to make the speculative leap that certainindividuals have beneficial initial random weights in allthe separate components of their cognitive systems). Ifwe must appeal to other constraints to explain indivi-dual variation, it then becomes necessary to tackle thequestion of whether these constraints will be the same asthose that explain cognitive development or atypicaldevelopment or ageing. There are many possibilities. Itmay be, for example, that atypical lies at the extreme endof a continuum of individual variation, but that cognit-ive development and ageing correspond to quite differ-ent computational parameters. A discussion of theseissues can be found in Thomas and Karmiloff-Smith (inpress b).
Despite the preceding comments, in the following simu-lations, the assumption was indeed made that indivi-dual differences can be generated by differences in initialrandom weights and in training regime! Despite thewider problems associated with this assumption, formodelling purposes it permitted the definition of asource of computational variability that could be appliedto typically developing and atypically developing groupsalike. The variation of random initial weights and train-ing regime within a small range was used to simulateindividual differences, while variation of other initialcomputational constraints to more extreme values wasused to create disordered development of various types.The important assumption here is not about the sourceof individual differences
per se
(one could shift the assign-ment of some of the computational constraints from theatypical set to the individual differences set, or defineranges of variation that correspond to individual differencesversus those that correspond to atypical development).Rather, the important assumption for the simulations isthat the variation of one (or more) constraints within acertain range explains individual variability
across allgroups
, while the variation of the same constraint orother constraints to more extreme values explains thedivergence of atypical from typical development.
The simulations
The following simulations are, to my knowledge, the firstto address the implications of individual variability inbehaviourally defined developmental disorders. Theiraim was to generate heuristics that could separate

Multiple causality in developmental disorders 541
© Blackwell Publishing Ltd. 2003
UNCORRECTED PROOF
behaviourally defined disorder groups of two types: thosewith a single (homogeneous) underlying cause versusthose with multiple (heterogeneous) underlying causes.The advantage that computational models conferredhere was that
it was known in advance what was wrongwith each network
, because certain initial computationalconstraints had been deliberately manipulated. It wastherefore possible to create a disorder group containingindividuals that shared a single cause and a group thatwas a collection of several causes; and subsequently, tostep outside the model and examine whether the twogroups could be distinguished merely on behaviouralgrounds. Moreover, the full developmental trajectories ofeach individual network were accessible, allowing com-parison of groups not only at the ‘point of diagnosis’,but also longitudinally. It could therefore be determinedwhether, even if homogeneous and heterogeneous groupswere initially indistinguishable, they nevertheless divergedover developmental time.
In the following simulations, then, the procedure wasas follows: (1) for a given domain, define a develop-mental disorder according to a specific behaviouralimpairment; (2) establish two groups of networks show-ing the impairment, one comprising individual networkswith a homogeneous underlying computational cause,one comprising networks with heterogeneous underlyingcauses; (3) search for behavioural grounds that wouldallow the two groups to be distinguished, either at asingle point in developmental time or longitudinally.
The model
Below, a qualitative description of the design and resultsof the simulation work is given. Technical details can befound in Appendix A. The simulations were based onthe well-explored developmental domain of past tenseformation, and employed a standard three-layer back-propagation network and a training set adapted fromPlunkett and Marchman (1991, 1993).
The simulations can be viewed in abstract terms, ascorresponding to a notional cognitive system required tolearn a set of input-output mappings in a domain char-acterized by a partial regularity (i.e. where the majorityof the mappings conform to a rule but a minority formexceptions). On the other hand, they can be viewed inmuch more concrete terms, as corresponding to the simu-lation of the English past tense acquisition. A number ofexisting developmental disorders have been evaluatedwith respect to this domain, including SLI (Montgomery& Leonard, 1998; Moore & Johnston, 1993; Oetting &Horohov, 1997; Ullman & Gopnik, 1999; van der Lely &Ullman, 2001), Williams syndrome (Bromberg, Ullman,
Coppola, Marcus, Kelley & Levine, 1994; Clahsen &Almazan, 1998; Thomas, Grant, Gsödl, Laing, Barham,Lakusta, Tyler, Grice, Paterson & Karmiloff-Smith,2001), spinal muscular atrophy (Sieratzki & Woll, 1998),early and continuously treated phenylketonuria (Badali,Izvorski, Ozawa, Diamond & Ullman, 1999), and chil-dren with non-specific developmental disabilities(Newfield & Schlanger, 1968). This aspect of languagedevelopment has been of great theoretical interest sincechildren must acquire a rule-based inflectional paradigm(English verbs form their past tense by adding -ed tothe verb stem) in the face of exceptions to these rules(e.g. sleep-slept, hit-hit, go-went). This is a task thatsome researchers argue requires qualitatively differentcognitive mechanisms to reflect the two types of map-ping. This debate is not directly relevant to our goalshere, and no strong claims are made that this is anideal model of past tense disorders. Conceiving of themodel in relation to this domain does, however, providea more tangible grounding for the simulation data to beencountered.
In abstract terms, the model domain corresponds tothe acquisition of regular and exception patterns. Here,then, are two initial behavioural metrics for the domain:how well does the system acquire regular mappings, andhow well does it acquire exception mappings? A thirdmetric can be defined according to error patterns, speci-fically the prevalence of a particular class of errors wherethe regularity in the training set is mistakenly over-extended to the exception mappings. The way the systemgeneralizes its knowledge to novel exemplars providesthree more metrics. These are, first, in terms of theextension of the regularity to novel exemplars which aresimilar to existing regular mappings; second, in terms ofthe extension of the regularity to exemplars which aresimilar to existing exception mappings; and third, interms of generalization of exception patterns to novelexemplars sharing a similarity with existing exceptionmappings. Together, these six metrics allowed
patterns ofdeficits
to be probed for in the disordered networks.In terms of past tense formation, the model can be
viewed as learning to associate phonological representa-tions of verb stems with their corresponding past tenseforms. The six metrics of performance can then berephrased as follows: (1) levels of acquisition of the regu-lar past tense (e.g.
talk
-
talked
); (2) levels of acquisitionof the set of irregular past tenses (e.g.
think
-
thought
,
sleep
-
slept
); (3) rates of over-generalization errors onirregular past tenses (e.g.
thinked
,
sleeped
); (4) general-ization of the regular past tense to novel verbs dissimilarto existing exception verbs, which will be termed ‘non-rhymes’ (e.g.
vask
-
vasked
); (5) generalization of the re-gular past tense to novel verbs rhyming with existing
542 Michael S.C. Thomas
© Blackwell Publishing Ltd. 2003
UNCORRECTED PROOF
exception verbs, termed ‘rhymes’ (e.g.
crive
rhymes with
drive
,
frink
rhymes with
drink
, past tense generalized as
crived
and
frinked
); and (6) generalization of irregularpast tense patterns to these ‘rhymes’, termed ‘irregular-ization’ (e.g.
crive
-
crove
;
frink
-
frank
).In Study 1, a developmental disorder was defined on
the following behavioural grounds. Partway throughtraining, certain individual networks were found to showexaggerated levels of the error involving over-extensionof the regularity to exception patterns (i.e.
over-general-ization
). The networks were approached as if they suf-fered from a mysterious developmental disorder markedby over-generalization, and designed a notional empir-ical study to investigate what might be the underlyingcause of this disorder. The study compared the beha-viour of the disordered networks with that of normallydeveloping networks of the same ‘chronological age’ (i.e.evaluated at the same point in training) to establish thelevel of impairment. It then compared the disorderednetworks to a set of younger, less-trained networks.These younger networks also exhibited higher levels ofthe over-generalization error, but in this case as a sign ofimmaturity. The second comparison allowed the invest-igation of whether the mystery networks were ‘simplyshowing symptoms of developmental delay’, a standardhypothesis in the field. The comparison of individualswith developmental disorders against chronological-age-matched controls and against mental-age-matched con-trols is a common empirical paradigm in the study ofatypical development. Lastly in this notional study, indi-vidual networks were also examined longitudinally toestablish their final performance outcomes.
Elevated levels of over-generalization errors in pasttense formation have been reported in several studies ofdevelopmental disorders, including children with WS,spinal muscular atrophy, and early and continuouslytreated phenylketonuria. In the current case, however,the ‘over-generalization’ disorder is solely viewed as a beha-vioural disorder. (Such a criterion might seem rathernarrow, but this is not unprecedented. For instance,the primary behavioural definition of developmentalphonological dyslexia is a difficulty in naming indivi-dually presented novel letter strings [see Fletcher
et al.
,1999].) This notional study of the past tense disorder canbe roughly calibrated against existing empirical data (e.g.Thomas
et al.
, 2001). The study corresponds to childrenwho exhibit the ‘over-generalization’ disorder at age10. They are compared to typically developing childrenof the same age (the chronological-age match) and toyounger children of about 6 years of age (the mental-age match), where in all cases, the individual children arefollowed longitudinally to evaluate their final past tenseperformance as adults.
Suffice to say, the claims made about multiple causal-ity are intended to be more general than the past tensedomain, for reasons discussed later. Indeed one of theresulting heuristics will be illustrated via empirical datafrom an unrelated domain. The precise definitions of thedisorder and control groups will now be considered.
Study 1
A behavioural developmental disorder was definedbased on the demonstration of elevated level of over-generalization (OG) errors occurring midway throughtraining, against a baseline of typically developing net-works. Several atypical initial computational constraintscould produce a developmental trajectory exhibitingsuch elevated errors. There is insufficient space here todiscuss the computational reasons why each manipula-tion has the developmental effect it has – readers aredirected to Thomas and Karmiloff-Smith (2002b). How-ever, these reasons are not central to the argument. Fourtest groups were established, each with ten individualnetworks trained with different initial random weightsand order of presentation of the training set. The groupswere as follows:
1.
A homogeneous disorder group
. At the designatedpoint in training (500 exposures to the training set),this group exhibited a mean level of OG errors of35.9% of exception patterns, approximately ten timeshigher than the normal rate. A single computationalcause was responsible for the impairment in this dis-order group, specifically the use of localist rather thandistributed representations to represent the phono-logy of the verb stem and past tense (see AppendixA). These networks were a random set of networkstrained with this initial impairment.
2.
A heterogeneous disorder group
. At the designatedpoint in training, this group of ten individuals exhib-ited a mean level of OG errors of 34.4% of exceptionpatterns. Five different computational causes wereresponsible for this impairment in the heterogeneousgroup, with two individuals suffering from each ‘con-dition’. Two individuals shared the localist impair-ment of the homogeneous group (but were differentindividuals); two individuals used a compressed rep-resentational scheme that while still distributed, ex-aggerated the similarity between phonemes; twoindividuals were trained with a slower learning rate;two individuals were trained with a learning algo-rithm with reduced plasticity; and two individualshad a network architecture without a hidden layer.Other computational constraints may also cause

Multiple causality in developmental disorders 543
© Blackwell Publishing Ltd. 2003
UNCORRECTED PROOF
increased OG errors: the particular conditions usedwere chosen at random from those producing indivi-dual networks with meeting the behavioural criterion.Note that not every individual network suffering fromthese five separate atypical conditions necessarilygenerated the same high level of OG errors: the indi-vidual networks used in the heterogeneous group werehand picked to be precisely those with a combinationof atypical initial constraints and elevated OG errors.But it must be emphasized,
this is the whole point ofa behaviourally defined developmental disorder
: theindividuals recruited may as easily be outliers from onedistribution of individuals with a particular deficit ascentral members of another distribution. The criterionpicks the individuals, not the underlying cause.
3.
A ‘chronological age’ (CA) matched control group
. Atthe designated point in training, this typically devel-oping control group exhibited a mean level of OGerrors of only 2.9% of exception patterns. These net-works were a random set of networks trained withnormal initial constraints.
4.
A ‘mental-age’ (MA) matched control group
. For theindividual networks in the CA control group, perform-ance was traced back to an earlier point in training,when OG errors were more frequent. After just 100presentations of the training set, the error level wasapproximately equivalent to the disorder groups, at32.8% of the exception patterns. This group of ‘younger’individuals was then defined as the MA control.
T
-tests revealed no significant differences between theMA control group and both disorder groups on the met-ric used to define the disorder, OG errors (all
p
>
.2). Onthis measure alone, neither disorder group was dis-tinguishable from delayed development. Subsequently,performance was compared across the other fiveperformance metrics, and longitudinally at the end oftraining (5000 exposures to the training set).
Study 2
For reasons that will become apparent shortly, it wasnecessary to validate the initial results by defining a sec-ond behavioural developmental disorder. This was basedon the criterial measure of low performance on excep-tion patterns (which did not turn out to have a directlycomplementary relationship to the level of OG errorssince other types of error were possible). For this ‘poorexception’ disorder, CA, MA groups were the same, anew random set of individuals was generated for thehomogeneous disorder group, and a new heterogeneousdisorder group was recruited to give a closer match to
the homogeneous group on the new metric. The newheterogeneous group contained none of the individualnetworks from Study 1.
1.
Homogeneous disorder group
. A new set of ten net-works trained with different initial randomized con-nection weights, and with the ‘localist’ impairment.
2.
Heterogeneous disorder group
. This group comprisedten individual networks with six different underlyingcomputational causes of their disorder. One individualemployed the compressed representational scheme;two individuals employed processing units withreduced discriminability; two individuals employedthe learning algorithm with reduced plasticity; threeindividuals used networks in which the initial weightswere randomized with greater initial variance;
1
oneindividual used a network with no hidden layer; andone individual used a network in which the numberof units in the hidden layer was reduced.
3.
CA-matched control group
. As for Study 1.4.
MA-matched control group
. As for Study 1.
For the CA group, performance on exception patternswas at 85.6% after 500 exposures to the training set. Forthe homogeneous disorder group, performance was at20.3%, while that for the heterogeneous group was at20.6%. The younger MA networks performed at 25.7%.Homogeneous and heterogeneous groups did not differsignificantly from one another (
p
>
.8) on the defini-tional measure. The MA group was not as well matchedfor this study, exhibiting slightly better performancethan both disorder groups (
p
=
.005 and
p
=
.047 for thehomogeneous and heterogeneous groups, respectively).Once again, performance was examined across beha-vioural metrics other than that used to define the disor-der, as well as longitudinally for all individual networks.
Results and discussion
Multiple causality
Employing simple connectionist learning models of thetype widely used in the study of cognitive development,it is relatively straightforward to demonstrate that abehavioural developmental disorder can have multipleunderlying computational causes. The disorder definedin Study 1 had five potential causes and the disorder inStudy 2 had six potential causes, yet in both cases, the
1
This is an example where atypical development and individual differ
-
ences are generated by the same computational constraint. Initialweight randomization within a small range contributes to individualdifferences. Set to an extreme value, it generates atypical development.

544 Michael S.C. Thomas
© Blackwell Publishing Ltd. 2003
UNCORRECTED PROOF
homogeneous and heterogeneous disorder groups werenot significantly different on the criterial measure forthe disorder. Note, however, that multiple causality isnot a question of computational equivalence between theunderlying causes. Particular computational causes tendto produce a unique pattern of changes across a set ofperformance metrics, even though these causes oftenoverlap on individual metrics (see Thomas & Karmiloff-Smith, 2002b). The narrower the defining metric for abehavioural developmental disorder, the more likely it isthat the disorder will have multiple underlying causes.Disorders defined across wider patterns are more likelyto have single underlying causes.
The point here is perhaps a slightly subtle one,because it might be argued that a narrowly definedbehavioural disorder will certainly recruit a more similarset of individuals than a vaguely defined disorder, whichsweeps together individuals who really don’t have thesame type of disorder. For example, the definition ofphonological developmental dyslexia (problems withdecoding single novel words) is much narrower than ‘anychild who has a problem with reading’ and surely morelikely to unify children with a similar sort of deficit. Theargument here distinguishes between two different altern-atives to narrow: narrow vs. vague, and narrow vs. wider-but-clearly-specified. Thus a narrowly defined disorderwill recruit a more homogeneous group than a vaguelydefined disorder. But a disorder that is strictly definedacross a greater number of behavioural measures relevantto the target domain is likely to increase the homogene-ity of the group still further, and increase the chances ofindexing a unique underlying computational cause.
Do additional behavioural measures per se help to differentiate disorder groups?
It may seem obvious that if one collects more behavi-oural measures, one is automatically more likely to gaina greater basis to distinguish homogeneous and hetero-geneous disorder groups. The results show that this canbe the case. In Study 2, although the homogeneous andheterogeneous disorder groups did not significantly dif-fer in their mean performance on the defining behavi-oural metric, they showed differences significant at the.05 level in four of the other five behavioural metrics.However, it is not necessarily the case. In Study 1, againhomogeneous and heterogeneous disorder groups didnot significantly differ on the definitional metric, but nordid they differ on mean performance in four of the otherfive performance metrics. On only one metric (regular-ization of novel non-rhymes) could the groups be distin-guished on their means ( p < .001; all other p > .3). Extrameasures do not necessarily help.
This result arises because, as will become apparent,the heterogeneous group demonstrated larger variabilityin its individual scores, and this variability was sufficientto eliminate many significant differences between thedisorder groups. (As an illustration, the MA controlscan be used as a neutral baseline. Compared to thisbaseline, the homogeneous group was distinguishable onthe mean values of four of the five additional measures,while the heterogeneous group was not distinguishablefrom MA controls on any of the further measures.)
Parametric tests such as the T-test assume homo-geneity of variance between the comparison groups.Therefore, one possibility why a heterogeneous disordergroup can be statistically indistinguishable from a homo-geneous disorder group on mean scores is that the vari-ability of the two groups is not equivalent, violatingthe assumptions of the parametric test. However, thisappears not to be the explanation here: use of the non-parametric Mann-Whitney U test produced the samepattern of results. The heterogeneous disorder group wasindistinguishable from homogeneous and MA controlgroups due to greater overlap of scores with other com-parison groups, rather than greater score variability perse.
In short, there is no automatic guarantee that by col-lecting more performance metrics relevant to the domainand comparing mean scores, homogeneous and het-erogeneous disorder groups can be disambiguated onbehavioural grounds.
Will time always differentiate disorder groups?
One might also expect that, even if the two disordergroups are indistinguishable at a certain point in devel-opment, time will subsequently separate them. When indi-vidual performance is examined longitudinally, surelywe should expect the homogeneous and heterogeneousdisorder groups to diverge in terms of their mean scores?Again, the answer is, not necessarily so. In Study 1, atthe end of training, the two disorder groups were notsignificantly different at the .05 level on any of the sixperformance metrics. In Study 2, the groups differed ononly one of the six measures (interestingly, this was noteven the original criterial measure for the disorder). Thesame pattern was revealed using the non-parametricMann-Whitney test. Again, the explanation here lies interms of variability and overlap. Although networkswith different computational causes did diverge in theirperformance over development, the consequence wasgreater variability in the heterogeneous group, increasingthe overlap between the groups, and denying the abilityto distinguish significant differences between the meanlevels of performance at the end of training.
Multiple causality in developmental disorders 545
© Blackwell Publishing Ltd. 2003
UNCORRECTED PROOF
The use of variability to distinguish disorder groups
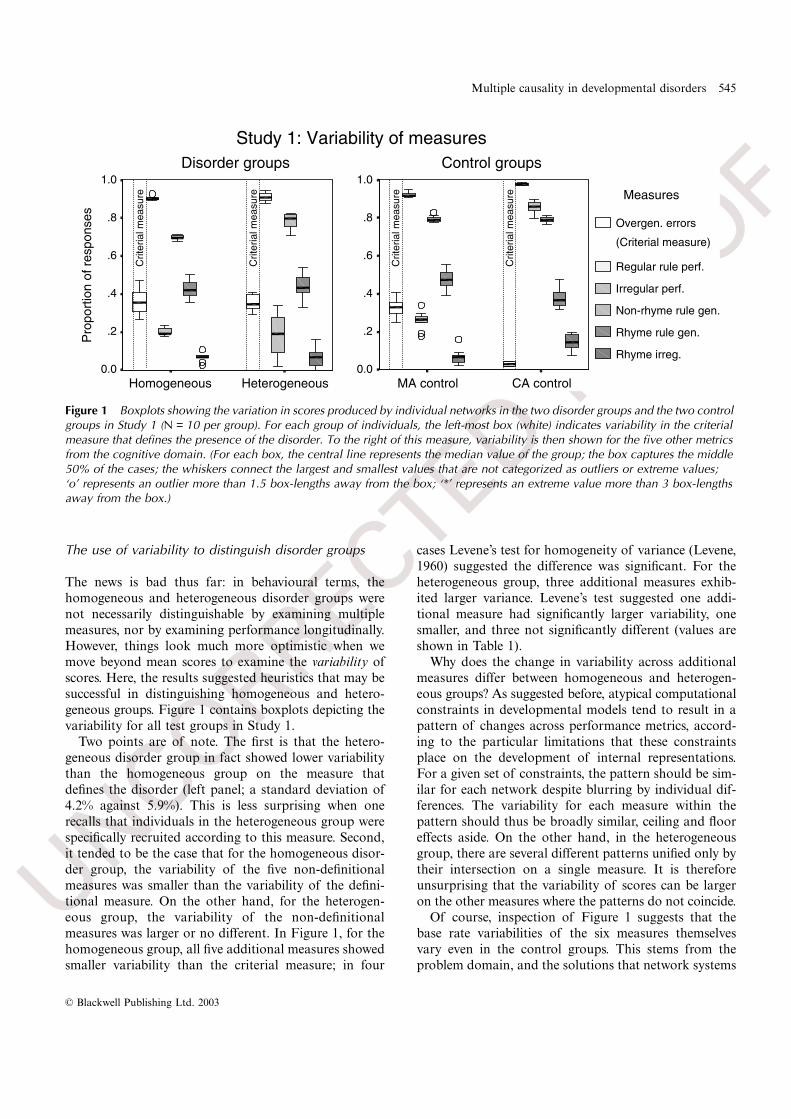
The news is bad thus far: in behavioural terms, thehomogeneous and heterogeneous disorder groups werenot necessarily distinguishable by examining multiplemeasures, nor by examining performance longitudinally.However, things look much more optimistic when wemove beyond mean scores to examine the variability ofscores. Here, the results suggested heuristics that may besuccessful in distinguishing homogeneous and hetero-geneous groups. Figure 1 contains boxplots depicting thevariability for all test groups in Study 1.
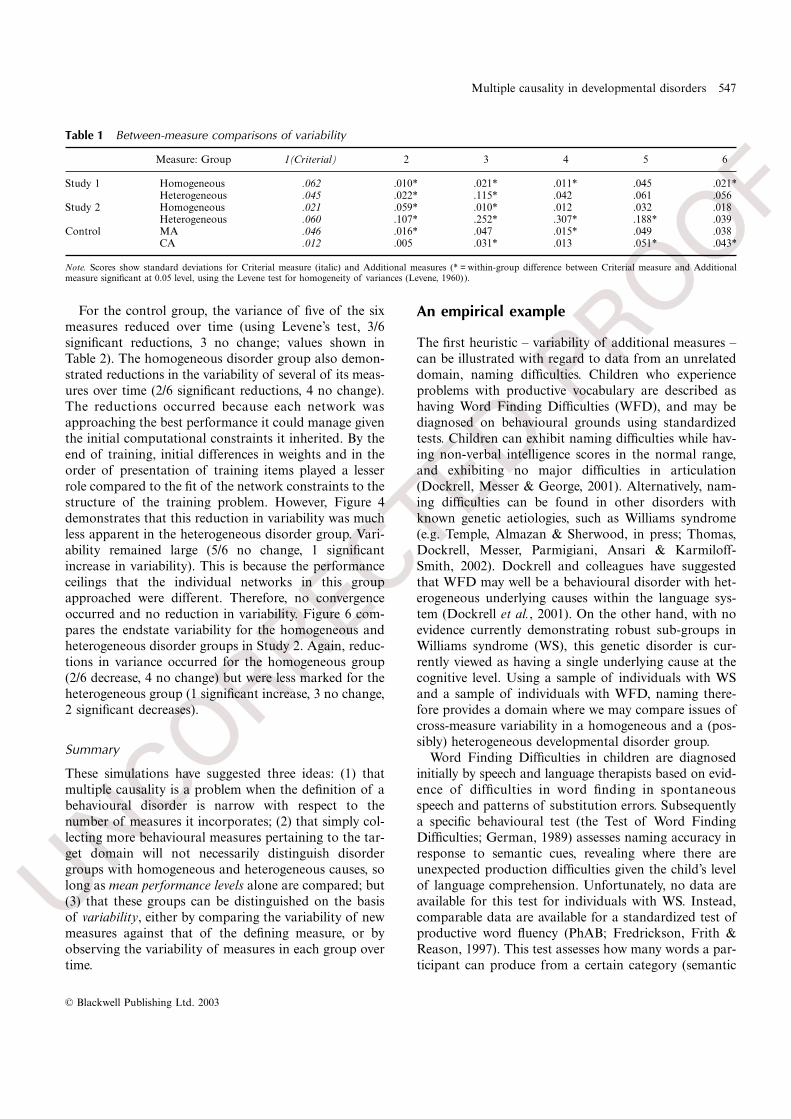
Two points are of note. The first is that the hetero-geneous disorder group in fact showed lower variabilitythan the homogeneous group on the measure thatdefines the disorder (left panel; a standard deviation of4.2% against 5.9%). This is less surprising when onerecalls that individuals in the heterogeneous group werespecifically recruited according to this measure. Second,it tended to be the case that for the homogeneous disor-der group, the variability of the five non-definitionalmeasures was smaller than the variability of the defini-tional measure. On the other hand, for the heterogen-eous group, the variability of the non-definitionalmeasures was larger or no different. In Figure 1, for thehomogeneous group, all five additional measures showedsmaller variability than the criterial measure; in four
cases Levene’s test for homogeneity of variance (Levene,1960) suggested the difference was significant. For theheterogeneous group, three additional measures exhib-ited larger variance. Levene’s test suggested one addi-tional measure had significantly larger variability, onesmaller, and three not significantly different (values areshown in Table 1).
Why does the change in variability across additionalmeasures differ between homogeneous and heterogen-eous groups? As suggested before, atypical computationalconstraints in developmental models tend to result in apattern of changes across performance metrics, accord-ing to the particular limitations that these constraintsplace on the development of internal representations.For a given set of constraints, the pattern should be sim-ilar for each network despite blurring by individual dif-ferences. The variability for each measure within thepattern should thus be broadly similar, ceiling and flooreffects aside. On the other hand, in the heterogeneousgroup, there are several different patterns unified only bytheir intersection on a single measure. It is thereforeunsurprising that the variability of scores can be largeron the other measures where the patterns do not coincide.
Of course, inspection of Figure 1 suggests that thebase rate variabilities of the six measures themselvesvary even in the control groups. This stems from theproblem domain, and the solutions that network systems
Figure 1 Boxplots showing the variation in scores produced by individual networks in the two disorder groups and the two control groups in Study 1 (N = 10 per group). For each group of individuals, the left-most box (white) indicates variability in the criterial measure that defines the presence of the disorder. To the right of this measure, variability is then shown for the five other metrics from the cognitive domain. (For each box, the central line represents the median value of the group; the box captures the middle 50% of the cases; the whiskers connect the largest and smallest values that are not categorized as outliers or extreme values; ‘o’ represents an outlier more than 1.5 box-lengths away from the box; ‘*’ represents an extreme value more than 3 box-lengths away from the box.)

546 Michael S.C. Thomas
© Blackwell Publishing Ltd. 2003
UNCORRECTED PROOF
can find to acquire the domain given their structure.Specifically, the higher net frequency of regular map-pings in the training set strongly drives learning andforces the networks to dedicate most of their internalrepresentational resources to reducing error on thesemappings. Given that the representations are shaped byregular patterns, exception patterns must then be fitted‘around the edges’, and it turns out that there are moresolutions to this problem than there are to learning theregular verbs, and more ways to go wrong. The conse-quence is greater variability in irregular performancethan regular performance.2
In Study 1, by chance the measure chosen to definethe disorder happened to be the one that showed thelargest variability in the homogeneous disorder group. Itwas possible, therefore, that the subsequent finding ofsmaller variability on the other measures in this groupwas artefactual. To check for this possibility, the exercise
was repeated in Study 2, but now choosing a definitionalmeasure on which the homogeneous disorder group hada smaller variability. A new heterogeneous group wasthen recruited according to this new definitional meas-ure. The comparison of variability for these two groupscan be seen in Figure 2. Although by design it was nowtrue that the homogeneous group demonstrated largervariability across some of the additional measures, com-parison with the new heterogeneous group reveals thatthe increase in variability across additional measures wasvery much greater for the heterogeneous group. Here forthe homogeneous group, one additional measure hadstatistically greater variance than the criterial measure,one had less variance and three were not significantlydifferent. For the heterogeneous group, four additionalmeasures had significantly greater variance, while onewas not significantly different (values shown in Table 1).
Distinguishing the disorder groups using variability over time
Finally, the effect of developmental time on the vari-ability of measures was examined. Figures 3(a) to 3(c)depict respectively the variability of measures for thecontrol group, the homogeneous disorder group and theheterogeneous disorder group in Study 1 at two pointsin time; first, the initial stage when the disorder was‘diagnosed’, and second, the longitudinal outcome at theend of training.
Figure 2 Boxplots showing the variability of measures for the homogeneous and heterogeneous disorder groups in Study 2.
2 For partially regular domains of this sort, it turns out to be hard tospecifically disrupt the learning of regular patterns. Generally, changesin initial constraints cannot significantly deflect the trajectory of regu-lar learning without impairing all learning in the network. Hoeffnerand McClelland (1993) managed to specifically target regular map-pings in acquiring the past tense domain by altering the initial rep-resentational scheme to weaken the information that encoded theregularity, effectively redefining the nature of the domain. Marchman(1993) managed to produce a model in which learning of regulars wasweaker than learning of irregulars, by increasing the frequency of theirregular mappings such that they were able to dominate the regularmappings in determining the shape of the internal representations.
Multiple causality in developmental disorders 547
© Blackwell Publishing Ltd. 2003
UNCORRECTED PROOF
For the control group, the variance of five of the sixmeasures reduced over time (using Levene’s test, 3/6significant reductions, 3 no change; values shown inTable 2). The homogeneous disorder group also demon-strated reductions in the variability of several of its meas-ures over time (2/6 significant reductions, 4 no change).The reductions occurred because each network wasapproaching the best performance it could manage giventhe initial computational constraints it inherited. By theend of training, initial differences in weights and in theorder of presentation of training items played a lesserrole compared to the fit of the network constraints to thestructure of the training problem. However, Figure 4demonstrates that this reduction in variability was muchless apparent in the heterogeneous disorder group. Vari-ability remained large (5/6 no change, 1 significantincrease in variability). This is because the performanceceilings that the individual networks in this groupapproached were different. Therefore, no convergenceoccurred and no reduction in variability. Figure 6 com-pares the endstate variability for the homogeneous andheterogeneous disorder groups in Study 2. Again, reduc-tions in variance occurred for the homogeneous group(2/6 decrease, 4 no change) but were less marked for theheterogeneous group (1 significant increase, 3 no change,2 significant decreases).
Summary
These simulations have suggested three ideas: (1) thatmultiple causality is a problem when the definition of abehavioural disorder is narrow with respect to thenumber of measures it incorporates; (2) that simply col-lecting more behavioural measures pertaining to the tar-get domain will not necessarily distinguish disordergroups with homogeneous and heterogeneous causes, solong as mean performance levels alone are compared; but(3) that these groups can be distinguished on the basisof variability, either by comparing the variability of newmeasures against that of the defining measure, or byobserving the variability of measures in each group overtime.
An empirical example
The first heuristic – variability of additional measures –can be illustrated with regard to data from an unrelateddomain, naming difficulties. Children who experienceproblems with productive vocabulary are described ashaving Word Finding Difficulties (WFD), and may bediagnosed on behavioural grounds using standardizedtests. Children can exhibit naming difficulties while hav-ing non-verbal intelligence scores in the normal range,and exhibiting no major difficulties in articulation(Dockrell, Messer & George, 2001). Alternatively, nam-ing difficulties can be found in other disorders withknown genetic aetiologies, such as Williams syndrome(e.g. Temple, Almazan & Sherwood, in press; Thomas,Dockrell, Messer, Parmigiani, Ansari & Karmiloff-Smith, 2002). Dockrell and colleagues have suggestedthat WFD may well be a behavioural disorder with het-erogeneous underlying causes within the language sys-tem (Dockrell et al., 2001). On the other hand, with noevidence currently demonstrating robust sub-groups inWilliams syndrome (WS), this genetic disorder is cur-rently viewed as having a single underlying cause at thecognitive level. Using a sample of individuals with WSand a sample of individuals with WFD, naming there-fore provides a domain where we may compare issues ofcross-measure variability in a homogeneous and a (pos-sibly) heterogeneous developmental disorder group.
Word Finding Difficulties in children are diagnosedinitially by speech and language therapists based on evid-ence of difficulties in word finding in spontaneousspeech and patterns of substitution errors. Subsequentlya specific behavioural test (the Test of Word FindingDifficulties; German, 1989) assesses naming accuracy inresponse to semantic cues, revealing where there areunexpected production difficulties given the child’s levelof language comprehension. Unfortunately, no data areavailable for this test for individuals with WS. Instead,comparable data are available for a standardized test ofproductive word fluency (PhAB; Fredrickson, Frith &Reason, 1997). This test assesses how many words a par-ticipant can produce from a certain category (semantic
Table 1 Between-measure comparisons of variability
Measure: Group 1(Criterial) 2 3 4 5 6
Study 1 Homogeneous .062 .010* .021* .011* .045 .021*Heterogeneous .045 .022* .115* .042 .061 .056
Study 2 Homogeneous .021 .059* .010* .012 .032 .018Heterogeneous .060 .107* .252* .307* .188* .039
Control MA .046 .016* .047 .015* .049 .038CA .012 .005 .031* .013 .051* .043*
Note. Scores show standard deviations for Criterial measure (italic) and Additional measures (* = within-group difference between Criterial measure and Additionalmeasure significant at 0.05 level, using the Levene test for homogeneity of variances (Levene, 1960)).

548 Michael S.C. Thomas
© Blackwell Publishing Ltd. 2003
UNCORRECTED PROOF
category, words starting with a certain sound, or wordsrhyming with a target word) within a time limit of 30seconds. Semantic fluency in particular is very close towhat is measured in the productive elements of the Ger-man test, and for the purposes of this example, willstand as the definitional measure of Word Finding Dif-ficulties. Figure 5 depicts the performance levels and vari-ability on the fluency task for a sample of 31 children
with WFD drawn from one of the first studies to seek anobjective definition of this behavioural disorder (Dock-rell et al., 2001), and a sample of 12 children and adultswith WS (Thomas, Grant, Ansari, Parmigiani, Ewing &Karmiloff-Smith, 2002). These data are compared to theexpected level given the mean chronological ages ofthe individuals involved (solid horizontal lines). Giventhe post-hoc nature of the comparison between the two
Figure 3 Boxplots depicting the variability of the measures over time for (a) the control group; (b) the homogeneous disorder group; and (c) the heterogeneous disorder group in Study 1. Time 1 corresponds to the point of ‘diagnosis’ of the disorder (500 presentations of the training set). Time 2 corresponds to the end of training (5000 presentations).

Multiple causality in developmental disorders 549
© Blackwell Publishing Ltd. 2003
UNCORRECTED PROOF
disorder groups, it was unfortunately not possible to bal-ance their ages and ability levels. Nevertheless, Figure 5shows that both groups exhibit a fluency deficit com-pared to CA controls. Moreover, the variability issmaller in the WFD group than the WS group. In each of
the three fluency categories, the variance is numericallysmaller for the WFD group than the WS group. How-ever, within each group, variability is roughly similaracross the different fluency categories, even though dif-ferent numbers of words are produced for each category.
Figure 3 Continued.
Figure 4 Boxplots showing the variability of the measures for the homogeneous and heterogeneous disorder groups at the end of training in Study 2. (Compare with Figure 2 to see change over time.)

550 Michael S.C. Thomas
© Blackwell Publishing Ltd. 2003
UNCORRECTED PROOF
This implies that the variability is not a direct conse-quence of the different absolute number of words pro-duced by each group.
The next step is to compare the variability on these‘definitional’ scores to additional behavioural measures.The additional measures are taken from another taskused to assess the cognitive processes within the lan-guage systems involved in productive vocabulary. Theyfocus on speeded naming abilities, and in particular, on
the effect of different semantic categories (objects versusactions) and of frequency on the accuracy levels andlatencies achieved in picture naming (see Dockrell et al.,2001; Thomas, Dockrell et al., 2002). Figure 6(a) and6(b) indicate, respectively, the naming accuracy andlatency levels for the two disorder groups. Separate com-parisons to CA-matched controls indicate that bothgroups were slower and less accurate than would beexpected for their age. Of particular interest, here, is that
Table 2 Within-measure comparisons of variability over time
Measure: Group 1 2 3 4 5 6
Study 1 Homogeneous t1 .062 .010 .021 .011 .045 .021t2 .017* .005 .026 .010 .026* .035
Heterogeneous t1 .045 .022 .115 .042 .061 .056t2 .045 .026 .166 .110* .053 .041
Study 2 Homogeneous t1 .021 .060 .010 .012 .032 .018t2 .028 .014* .004 .010 .022 .025
Heterogeneous t1 .060 .107 .252 .307 .188 .039t2 .259* .037* .206 .238 .101* .063
Control t1 .012 .005 .031 .013 .051 .043t2 .000* .000* .000* .029 .046 .028
Note. Scores show standard deviations (* = difference between measure at t1 and t2 significant at 0.05 level, using the Levene test for homogeneity of variances (Levene,1960)).
Figure 5 Empirical data on word fluency for two developmental disorders. WFD = children with Word Finding Difficulty (Dockrell et al., 2001). WS = children and adults with Williams syndrome (Thomas, Grant et al., 2002). The fluency test requires the individual to produce as many words as possible within a time limit, according to either a semantic criterion, a phonological criterion, or a rhyme criterion. For the purposes of this example, fluency is taken as the criterial measure defining the Word Finding Difficulty group. The solid line marks expected performance for chronological-age-matched control groups.

Multiple causality in developmental disorders 551
© Blackwell Publishing Ltd. 2003
UNCORRECTED PROOF
both Figures 6(a) and 6(b) now suggest greater levels ofvariability in the WFD group than the WS group. Indeedthe behaviourally defined WFD group shows numer-ically larger variances than the genetically defined WS
group in seven of the eight measures, the exception beingthe accuracy of naming low frequency objects where vari-ances are equal. While variability levels differ across theadditional measures within each group, in part due to
Figure 6 Variability for WFD and WS groups on a speeded picture naming task (Dockrell et al., 2001; Thomas, Dockrell et al., 2002). (a) Accuracy levels; (b) Naming times. HF = high frequency words, LF = low frequency words. The WFD group shows larger variability than WS group on these measures but smaller variability on the criterial measure.

552 Michael S.C. Thomas
© Blackwell Publishing Ltd. 2003
UNCORRECTED PROOF
ceiling/floor effects (e.g. high frequency words showlower variability), cross-group comparisons are suggest-ive of heterogeneous underlying causality in the WFDgroup.
The comparison used in this example is not idealbecause of the different levels of performance of the twogroups. It is possible that the lower level of performanceof the WFD group contributes to the differential vari-ability. Prospective studies are obviously in a better posi-tion to balance disorder groups on performance levels.Nevertheless, this example offers an illustration of howone might apply the heuristic of cross-measure variabil-ity to the study of behaviourally defined developmentaldisorders: if each new (theoretically domain-relevant)measure of the target domain beyond the definitionalmeasure increases the variability across the disordergroup, this is not a good sign regarding its causalhomogeneity.3
General discussion
A computational model of development has been usedto derive heuristics that might distinguish between dis-order groups with a homogeneous underlying cognitivecause and developmental disorder groups with hetero-geneous underlying causes. The model builds in assump-tions concerning the different computational sources ofvariability that produce individual differences and atyp-ical development.
Three caveats need to be added to clarify the status ofthese heuristics. First, even assuming that the computa-tional model is a valid one, the relative changes to thevariability of scores, across different measures and overtime, that distinguished homogeneous and heterogen-eous groups were tendencies rather than absolutes. Notall additional performance metrics for the heterogeneousgroup showed larger variability (in Study 1 the figure
was 60%, in Study 2 80%). For groups of individualnetworks sharing the same computational constraints,not all performance metrics showed reduced variabilityover time (for the homogeneous disorder group inStudies 1 and 2 the figure was 67%, and for the controlgroup it was 83%). The effects appear as tendenciesbecause the variability in each metric is not solely deter-mined by the source of individual differences and thesource of atypical development. The structure of theproblem domain itself partially determines the vari-ability across measures and its change over time. Moregenerally, one might expect that in problem domainswhere individuals receive widely different experience,and in problem domains where many partially adequatesolutions are available, the contribution of individualand atypical differences to variability may be reduced,and thus the heuristics are less effective. Conversely, inmore uniformly experienced domains where success andfailure are unambiguous, the heuristics may be highlyeffective.
It is also worth pointing out that variability in experi-mental data may also stem from measurement error. Toproperly compare variability across groups, for instance,it is important to establish as far as possible that meas-urement error is equivalent. This requires checking thattask demands have an equivalent influence acrossgroups. Given that comparison groups can differ in over-all ability levels, it may sometimes be necessary to matchdisorder groups not just against control groups on MAor CA but on absolute level of performance, as a way ofcontrolling for effective task difficulty. However, theissue of measurement error is likely to be of less signific-ance in comparing variability across different measureswithin disorder groups.
The second caveat is that the simulations depicted theideal situation of an entirely homogeneous disordergroup compared to largely heterogeneous disordergroups. Of course in reality, disorder groups might behomogeneous to different extents. A group might have amajority of individuals with one underlying cause andonly a few others with different causes. Here, one wouldhope that across additional measures and over develop-mental time, the homogeneous portion of the groupwould hang together more tightly, and allow the othersto be identified as outliers.
The third caveat is that the issue of multiple causalityhas been explored in the much studied and reason-ably well understood realm of past tense formation.The findings on multiple causality using this model arelikely to generalize to other domains because theyessentially derive from only three assumptions: (1) thatindividual and atypical differences have differentsources; (2) that each set of atypical initial computational
3 In response to this example, one might ask the following – whycouldn’t the speeded naming results form the definitional measure forWFD? Surely then, with fluency as the ‘additional’ measure, variabilitywould reduce in the behaviourally defined group from the definitionalmeasure to the additional measure? The crucial point here, however, isthat if speeded naming were the definitional criterion, the WFD groupwould not contain the same individuals. Those at the higher end ofspeeded naming performance would not have been recruited to thegroup in the first place. And new individuals who may have had poorerspeeded picture naming performance but perhaps higher fluency levelswould have been added. Thus if the WFD group were indeed causallyheterogeneous, defining it according to speeded naming would causethe variability of this measure to go down, and the variability of thefluency measure to go up. On the other hand, since the causally homo-geneous WS group was defined independently, its variability would notchange.

Multiple causality in developmental disorders 553
© Blackwell Publishing Ltd. 2003
UNCORRECTED PROOF
constraints tends to cause a consistent pattern ofchanges across different behavioural measures within adomain; and (3) that through development, perform-ance tends towards a ceiling in large part determined bysystem constraints. So long as these assumptions hold,the heuristics may well prove useful across a range ofdomains.
However, generalizing the finding does raise one sig-nificant problem. What constitutes a ‘cognitive domain’,and what constitute ‘additional behavioural measures’within that domain? For some cases, the answer is relat-ively straightforward: for example, for reading, measureswould include reading regular words, reading irregu-lar words, reading words with different frequencies,reading words with different semantic properties, pro-nouncing nonwords of different sorts, and so forth.For other cases, the answer may be less easily forthcom-ing. For instance, if a developmental disorder is definedon the basis of poor face recognition, should one includeobject recognition as an additional behavioural measureof the ‘domain’? If a developmental disorder is definedaccording to poor arithmetic, should one include read-ing skills or grammar skills as relevant additional meas-ures? This issue pertains not only to the identification ofseparate cognitive domains, but also to how thosedomains ‘hang together’ developmentally. Broadly, how-ever, what are conceived of here for the notion of ‘addi-tional measures’ are aspects of behaviour that might beexpected to be dealt with by the same cognitive systemaccording to current theories; or alternatively, that aredealt with by a system that might be expected to sharethe same computational constraints as that which pro-cesses the target domain (as perhaps in the case of faceand object recognition).
In conclusion, however, it is proposed that the simpleheuristics identified in this article are an important firstcheck when one studies a behaviourally defined develop-mental disorder:
• If most additional behavioural metrics applied to thedisorder group appear to be generating larger variabil-ity than the definitional measure, then there is a goodchance that the disorder does not have a single under-lying cognitive cause.
• If variability in the disorder group does not appear tobe decreasing over time in line with a control groupmatched on initial levels of performance, then oncemore there is a good chance that the disorder groupdoes not share a single underlying cognitive cause.
Finally, the great value of the modelling approach isthat it permits us to focus on principles without the dif-ficulties associated with uncertain phenotypes and vaguebehavioural classifications. The fact that conclusions
about the character of multiple causality in developmen-tal disorders can be derived from computational model-ling supports the idea that such models are likely to playan essential role in helping us to understand how com-putational constraints affect the success (and failure) ofdevelopmental processes.
Appendix A
Simulation details
The Plunkett and Marchman (1991, 1993) model wastaken as the baseline system. The model employed anartificial language representative of the past tensedomain, comprising 500 triphonemic verb stems createdby combining English consonants and vowels into threepossible templates conforming to the phonotactics ofEnglish. In this model, a connectionist network had tolearn to associate the stem of each verb with its pasttense form. To date, the Plunkett and Marchman pasttense model is the one most thoroughly applied to andevaluated within the developmental framework (see e.g.Marcus, 1995; Plunkett & Marchman, 1996). Morerecent models have added greater complexity in the formof additional semantic inputs and the requirement to learnmultiple inflections (see Thomas & Karmiloff-Smith, 2002b,for a review). Here, the simpler model is retained forsimplicity and clarity – although the effect of the manipu-lations on developmental performance for this simplemodel was qualitatively the same as in a more complexmodel that incorporated semantic representations.
Baseline ‘normal’ model
Training set
The training set was based on the ‘phone’ vocabularyfrom Plunkett and Marchman (1991, p. 70). Triphone-mic stems mapped either to regular past tenses (410) orone of three types of irregular past tense, arbitrary (2),no change (20) or vowel change (68). For clarity, per-formance is reported only on the vowel change irregularverbs, although the results were similar for the other twotypes. Each stem was assigned to be high or low fre-quency. Frequency was implemented by modulating thelevel of weight change. High frequency stems were givena frequency of 0.3, low frequency verbs 0.1, with theexception of arbitrary irregular past tenses, which had ahigh frequency value of 0.9 and low frequency of 0.3. Aset of 500 novel verb stems was created to evaluate gen-eralization. Novel stems either shared two phonemeswith existing regular verbs or irregular verbs.

554 Michael S.C. Thomas
© Blackwell Publishing Ltd. 2003
UNCORRECTED PROOF
Network details
Representations
The input comprised three phonemes and the outputcomprised three phonemes and an optional inflection.Each of 32 possible phonemes was represented over avector of 30 binary values. This was based on a 6-bitdistributed code based on articulatory features, to whicha five-fold noisy copying process was applied to create amore redundant version of the phonological code (seeThomas & Karmiloff-Smith, 2002a, for further details).There were 90 input units and 100 output units in thebaseline model.
Architecture
A three-layer feedforward network with 50 hidden unitswas used.
Training and testing regime
The networks were initialized with connection weightsrandomized between ±0.5, and then trained by exposureto the entire training corpus for 5000 presentations witha learning rate of 0.01 and a momentum of 0. Patternpresentation was in random order without replacement.Weight changes were calculated using the backpropaga-tion algorithm (Rumelhart, Hinton & Williams, 1986)and the cross-entropy error measure (see Hinton, 1989).Network performance on both the training and general-ization sets was tested at 10, 25, 50, 100, 250, 500, 1000,2000 and 5000 epochs. Disordered networks were ‘diag-nosed’ at 500 epochs. Networks trained for 100 epochs wereused as a ‘mental-age match’ for the disordered networks.
Manipulations
The following changes were made to the initial con-straints of the network to produce various forms of dis-ordered development.
Localist representations
Each phoneme in the verb stem/past tense form was rep-resented by a single unit instead of a distributed patternover a set of units. This served to eliminate similaritybetween phonemes. This network had 96 inputs and 100outputs.
Compressed representations
Each phoneme was represented by the original 6-bit dis-tributed code prior to the addition of redundancy. This
served to increase similarity between phonemes. Thisnetwork had 18 inputs and 20 outputs.
Slow learning rate
The network was trained ten times more slowly, with alearning rate of 0.001 rather than 0.01.
Use of mean-squared error measure rather than cross-entropy
The error between the output and target was calculatedby a Euclidean distance measure rather than an entropymeasure. When output units were very inaccurate (e.g.outputting 1 instead of 0 or 0 instead of 1), this reducedthe effectiveness of the learning algorithm in adaptingthe network weights.
Greater initial weight variance
Initial network weights were randomized within therange ±1.5, three times the normal value. This caused aneffective delay in development as large weights that wereinitially inappropriately set for the required mappingshad to be corrected.
Two-layer network
The input and output layers were directly connectedreducing the computational power of the network.
Reduced hidden units
The hidden layer contained 10 units instead of 50, creat-ing a bottleneck in the internal representations andreducing computational power.
Reduced discriminability
The sigmoid activation function in the processing unitswas assigned a temperature value of 4 instead of 1 (seeHinton & Sejnowski, 1986). This reduced the ability ofthe units in the hidden and output layers to discriminateeffectively between small differences in the activationlevels they were receiving.
Acknowledgements
Thanks to Annette Karmiloff-Smith for helpful discus-sions contributing to this paper. Thanks to Julie Dockrelland David Messer for kindly making their raw data avail-able from children with WFD. Thanks also to Julia Grant,
Multiple causality in developmental disorders 555
© Blackwell Publishing Ltd. 2003
UNCORRECTED PROOF
Dorothy Bishop and three anonymous reviewers for theirmany helpful suggestions. This work was supported byMRC Project Grant no. G9809880 and MRC ProgrammeGrant no. G9715642 to Annette Karmiloff-Smith.
References
Badali, S., Izvorski, R., Ozawa, K., Diamond, A., & Ullman,M.T. (1999). Phenylketonuria as a model for investigatingthe role of dorsolateral prefrontal cortex in language. Paperpresented at the 6th Annual Meeting of the Cognitive Neuro-science Society, Washington, DC, April.
Bishop, D.V.M., North, T., & Donlan, C. (1995). Genetic basisof specific language impairment. Developmental Medicine &Child Neurology, 37, 56–71.
Bromberg, H., Ullman, M., Coppola, M., Marcus, G., Kelley,K., & Levine, K. (1994). A dissociation of lexical memoryand grammar in Williams syndrome: evidence from inflec-tional morphology. Paper presented at the 6th InternationalProfessional Conference of the Williams Syndrome Associ-ation, San Diego, CA.
Bullinaria, J.A. (1997). Modelling reading, spelling, and pasttense learning with artificial neural networks. Brain and Lan-guage, 59, 236–266.
Clahsen, H., & Almazan, M. (1998). Syntax and morphologyin Williams syndrome. Cognition, 68, 167–198.
Cohen, I.L. (1994). An artificial neural network analogue oflearning in autism. Biological Psychiatry, 36, 5–20.
Cohen, I.L. (1998). Neural network analysis of learning inautism. In D. Stein & J. Ludick (Eds.), Neural networks andpsychopathology (pp. 274–315). Cambridge: Cambridge Uni-versity Press.
Dockrell, J.E., Messer, D., & George, R. (2001). Patterns ofnaming objects and actions in children with word findingdifficulties. Language and Cognitive Processes, 16, 261–286.
Elman, J.L., Bates, E.A., Johnson, M.H., Karmiloff-Smith, A.,Parisi, D., & Plunkett, K. (1996). Rethinking innateness: Aconnectionist perspective on development. Cambridge, MA:MIT Press.
Fletcher, J.M., Foorman, B.R., Shaywitz, S.E., & Shaywitz,B.A. (1999). Conceptual and methodological issues in dys-lexia research: a lesson for developmental disorders. In H.Tager-Flusberg (Ed.), Neurodevelopmental disorders (pp.271–305). Cambridge, MA: MIT Press.
Fredrickson, N., Frith, U., & Reason, R. (1997). PhonologicalAssessment Battery. Windsor: NFER-Nelson.
German, D.J. (1989). Test of Word Finding TWF. Chicago, IL:Riverside Publishing Company.
Harm, M., & Seidenberg, M.S. (1999). Phonology, readingacquisition, and dyslexia: insights from connectionist models.Psychological Review, 106, 491–528.
Hinton, G.E. (1989). Connectionist learning procedures. Arti-ficial Intelligence, 40, 185–234.
Hinton, G.E., & Sejnowski, T.J. (1986). Learning and relearn-ing in Boltzmann machines. In D.E. Rumelhart, J.L.McClelland & the PDP Research Group, Parallel distributed
processing: Explorations in the microstructure of cognition, Vol. 1:Foundations (pp. 282–317). Cambridge, MA: MIT Press.
Hoeffner, J.H., & McClelland, J.L. (1993). Can a perceptualprocessing deficit explain the impairment of inflectionalmorphology in developmental dysphasia? A computationalinvestigation. In E.V. Clark (Ed.), Proceedings of the 25thChild Language Research Forum. Stanford: Stanford Univer-sity Press.
Karmiloff-Smith, A. (1998). Development itself is the key tounderstanding developmental disorders. Trends in CognitiveSciences, 2, 389–398.
Levene, H. (1960). Robust test for the equality of variance. InI. Olkin (Ed.), Contributions to probability and statistics(pp. 278–295). Palo Alto, CA: Stanford University Press.
Marchman, V.A. (1993). Constraints on plasticity in a connec-tionist model of the English past tense. Journal of CognitiveNeuroscience, 5, 215–234.
Marcus, G.F. (1995). The acquisition of the English past tensein children and multilayered connectionist networks. Cogni-tion, 56, 271–279.
Montgomery, J.W., & Leonard, L.B. (1998). Real-time inflec-tional processing by children with specific language impair-ment: effects of phonetic substance. Journal of SpeechLanguage and Hearing Research, 41, 1432–1443.
Moore, M., & Johnston, J. (1993). Expressions of past time bynormal and language-impaired children. Journal of Commun-ication Disorders, 28, 57–72.
Newfield, M.U., & Schlanger, B.B. (1968). The acquisition ofEnglish morphology by normal and educable mentallyretarded children. Journal of Speech and Hearing Research,11, 693–706.
Oetting, J., & Horohov, J. (1997). Past tense marking by chil-dren with and without specific language impairment. Journalof Speech and Hearing Research, 40, 62–74.
Oliver, A., Johnson, M.H., Karmiloff-Smith, A., & Pennington,B. (2000). Deviations in the emergence of representations:a neuroconstructivist framework for analysing develop-mental disorders. Developmental Science, 3, 1–23.
Pennington, B.F., & Smith, S.D. (1997). Genetic analysis ofdyslexia and other complex behavioral phenotypes. CurrentOpinion in Pediatrics, 9, 636–641.
Pezzini, G., Vicari, S., Volterra, V., Milani, L., & Ossella, M.T.(1999). Children with Williams syndrome: is there a singleneuropsychological profile? Developmental Neuropsychology,15, 141–155.
Plaut, D.C., McClelland, J.L., Seidenberg, M.S., & Patterson,K. (1996). Understanding normal and impaired word read-ing: computational principles in quasi-regular domains. Psy-chological Review, 103, 56–115.
Plunkett, K., & Marchman, V. (1991). U-shaped learning andfrequency effects in a multi-layered perceptron: implicationsfor child language acquisition. Cognition, 38, 1–60.
Plunkett, K., & Marchman, V. (1993). From rote learning tosystem building: acquiring verb morphology in children andconnectionist nets. Cognition, 48, 21–69.
Plunkett, K., & Marchman, V. (1996). Learning from a con-nectionist model of the English past tense. Cognition, 61,299–308.

556 Michael S.C. Thomas
© Blackwell Publishing Ltd. 2003
UNCORRECTED PROOF
Rumelhart, D.E., Hinton, G.E., & Williams, R.J. (1986).Learning internal representations by error propagation. InD.E. Rumelhart, J.L. McClelland & the PDP ResearchGroup, Parallel distributed processing: Explorations in themicrostructure of cognition. Vol. 1: Foundations (pp. 318–362). Cambridge, MA: MIT Press.
Seidenberg, M.S., & McClelland, J.L. (1989). A distributed,developmental model of word recognition and naming. Psy-chological Review, 96, 452–477.
Sieratzki, J.S., & Woll, B. (1998). Toddling into language: pre-cocious language development in motor-impaired childrenwith spinal muscular atrophy. In A. Greenhill, M. Hughes,H. Littlefield & H. Walsh (Eds.), Proceedings of the 22ndAnnual Boston University Conference on Language Develop-ment, Volume 2 (pp. 684–694). Somerville, MA: CascadillaPress.
Simonoff, E., Bolton, P., & Rutter, M. (1998). Genetic per-spectives on mental retardation. In J.A. Burack, R.M.Hodapp & E. Zigler (Eds.), Handbook of mental retardationand development (pp. 41–79). Cambridge: Cambridge Uni-versity Press.
Temple, C., Almazan, M., & Sherwood, S. (in press). Lexicalskills in Williams syndrome: a cognitive neuropsychologicalanalysis. Journal of Neurolinguistics.
Thomas, M.S.C., Dockrell, J.E., Messer, D., Parmigiani, C.,Ansari, D., & Karmiloff-Smith, A. (2002). Naming in Wil-liams syndrome. Manuscript submitted for publication.
Thomas, M.S.C., Grant, J., Ansari, D., Parmigiani, C., Ewing,S., & Karmiloff-Smith, A. (2002). Fluency scores for a sam-ple of children and adults with Williams syndrome. Unpub-lished data.
Thomas, M.S.C., Grant, J., Gsödl, M., Laing, E., Barham, Z.,
Lakusta, L., Tyler, L.K., Grice, S., Paterson, S., &Karmiloff-Smith, A. (2001). Past tense formation in Wil-liams syndrome. Language and Cognitive Processes, 16,143–176.
Thomas, M.S.C., & Karmiloff-Smith, A. (2002a). Modellingtypical and atypical cognitive development. In U. Goswami(Ed.), Handbook of childhood development (pp. 575–599).Oxford: Blackwell.
Thomas, M.S.C., & Karmiloff-Smith, A. (2002b). Modellinglanguage acquisition in atypical phenotypes. Manuscriptsubmitted for publication.
Thomas, M.S.C., & Karmiloff-Smith, A. (in press, a). Aredevelopmental disorders like cases of adult brain damage?Implications from connectionist modelling. Behavioural andBrain Sciences.
Thomas, M.S.C., & Karmiloff-Smith, A. (in press, b). Connec-tionist models of development, developmental disorders andindividual differences. In R.J. Sternberg, J. Lautrey & T.Lubart (Eds.), Models of intelligence for the next millennium.American Psychological Association.
Tomblin, J.B., & Pandich, J. (1999). Lessons from children withspecific language impairment. Trends in Cognitive Sciences,3 (8), 283–285.
Ullman, M.T., & Gopnik, M. (1999). Inflectional morphologyin a family with inherited specific language impairment.Applied Psycholinguistics, 20, 51–117.
Van der Lely, H.K.J. (1999). Learning from grammatical SLI.Trends in Cognitive Sciences, 3 (8), 286–287.
Van der Lely, H.K.J., & Ullman, M.T. (2001). Past tense mor-phology in specifically language impaired and normallydeveloping children. Language and Cognitive Processes, 16,177–217.