multipollutant air quality management reinventing the wheel critical review commentary air and waste...
TRANSCRIPT

Multipollutant Air Quality Management
Reinventing the WheelCritical Review commentary
Air and Waste Management Association Annual Meeting
June 23, 2010Calgary, Alberta
John BachmannVision Air Consulting, LLC
Ammonium

Overview• Hidy and Pennell’s Critical Review suggests
– Multipollutant AQM is a logical extension of risk-based AQM– A multipollutant perspective with greater emphasis on accountability
provides a useful paradigm for air quality related policy, regulation, legislation, and science
– Full implementation is probably impossible - ever
• Some riffs– Is the recommended MP risk-based paradigm really the best approach for
merging climate, ecosystem effects, and air toxics?• Is the current US CAA program really single pollutant driven?• Multipollutant/accountability technology-based programs deserve equal
consideration• Suggestions for more feasible interim improvements in the near term (<10yr)• Examples of difficult climate and air quality trade-offs based on current
information

Why risk-based multipollutant programs?• Not discussed much in the CR, which cites NRC and NARSTO
– The Holy Grail: optimized control strategies to maximize risk reductions at minimum costs, with tracking to show actual benefits and costs. What’s not to like?
– Effectiveness and efficiency – flexibility vs. simplicity– You want it soon???
• NRC – ideal not possible soon; much of current system is good, transitional recommendations
1) strengthen capacity for assessing risk and tracking progress; 2) expand national and multistate performance oriented programs (technology based)3) move from SIPs to multipollutant AQM plans with tracking 4) integrate criteria and HAP programs5) enhance ecosystem protection
The NARSTO and CR recommendations are generally congruent with the NRC

Alternative Management Approaches• Risk-based
– e.g. Air quality management based on health and environmental goals (NAAQS) or risk estimates
– Emission limits based on residual risk (s. 112 post MACT)– Potentially most optimal, but information intensive, slow, some risk calls vex
decision makers (s 112 before 1990)
• Technology-based– e.g. ‘Best’ technology on all major source categories regardless of risk (MACT, NSPS,
RACT)– Fast, more equitable to sources, may go too far or not enough
• Market approaches– e.g. Cap and trade, emissions taxes/fees (Acid rain, CAIR)– Least cost solution for regional pollutants, hard to adjust cap
• NRC recommends them all for multipollutant approaches

The Clean Air Act Success Story
Cumulative benefits 1970-90 $6 to $50 trillionCumulative costs - $ 520 billion

NOx Trends
VOC Trends
Major CAA reductions in NOx, VOC, and CO, lead (not shown) from multipollutant tail-pipe and fuel standards.
Multipollutant power plant NSPS (SOx, NOx, PM) in 1979, CAIR (SOx, NOx, Hg caps) 2004 (remanded by court); acid rain (SOx, NOx) in 1990’s.
Technology-based source standards played a major role in CAA benefits

What’s wrong with current AQM?
Heavy emphasis on modeling forecasts, regional control strategies depend on multiple states
Determine Emissions
Reductions
Track and Evaluate Results
Implement and Enforce Strategies
Develop Programs to
achieve
Establish Goals
NAAQS revision timelines push single pollutant SIPs
The SIP process is inefficient, time consuming
Tracking focuses on air quality, attainment, 5 -10 years; no provisions for mid-course corrections or tracking; failure restarts the entire process
Federal role complicates state options, EPA not accountable for success of national rules

“Consider this…”*
*REM: Losing my Religion

PM and O3NAAQS: multipollutants and sources
Pollutants contributing to PM2.5 and OzoneSO2 – Sulfate particlesNOx – Nitrate PM, acid gases, formation of ozone and organic PM (toxics)VOC – formation of ozone and organic PM (toxics)C6+unsat. – secondary organic PM (toxics)NH3 – AmmoniumDirect PM of carbonaceous PM, crustal materials, metals (toxics – e.g. POM, Hg, Ni, V)CO, CH4 - background ozone formation
Sulfate
Esti Ammonium
Nitrate
Carbonaceous
Crustal
NRC: major AQM challenge, risk
Provides an obvious OPPORTUNITY for transition to multipollutant AQM, tracking, streamlined approaches
Multiple sources of multiple pollutantsHNO3
SO2
NO2
CH4
Organics
NH3
CO

Initial improvements to AQM
Less emphasis on modeling, more on inventories and tracking. EPA facilitates regional control strategies.
Determine Emissions
Reductions
Track and Evaluate Results
Implement and Enforce Strategies
Develop Programs to
achieve
Establish Goals
SIP replaced by Comprehensive AQM plan, streamlined process for developing rules. Provisions for S/L/T actions on existing mobile sources.
Tracking includes air quality, attainment; but adds interim benchmarks to permit mid-course corrections. Failure leads directly to implementing additional measures.
Maintain Federal enforceability; EPA commits to reductions under national rules
Coordinate PM/O3 implementation dates, multi-pollutant NAAQS (SOx/NOx, extinction)

• How multipollutant consideration might make a difference to today’s AQM– Climate and air quality (asymmetrical risks)– PM and the seven dwarves– Body counts, benefits, and equity
• The limits of accountability
Making it real – some examples
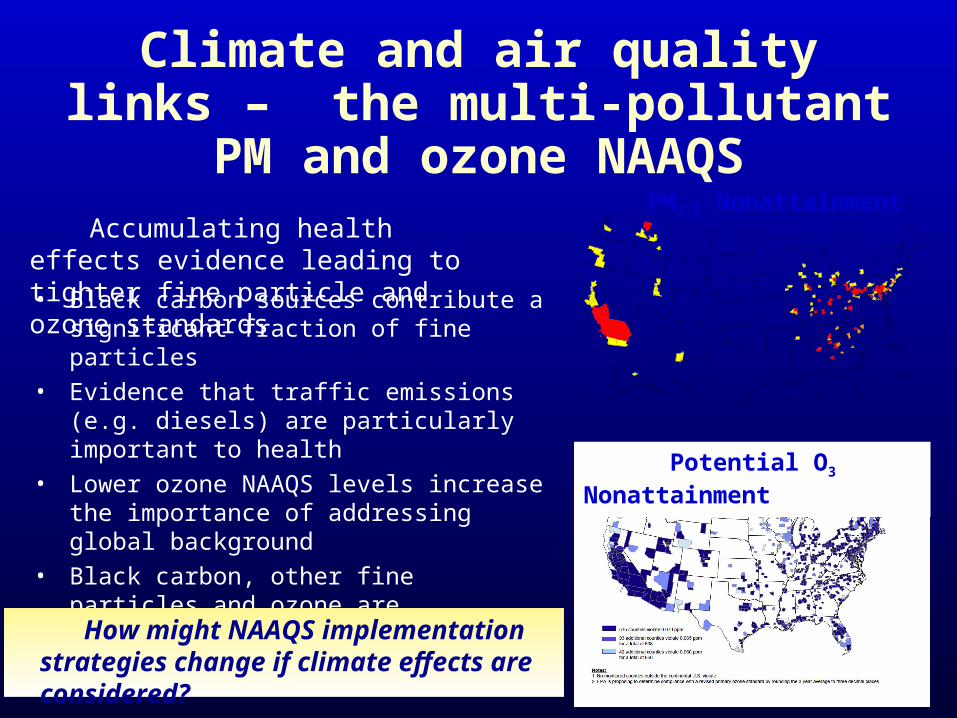
Climate and air quality links – the multi-pollutant PM and ozone NAAQS
Accumulating health effects evidence leading to tighter fine particle and ozone standards
PM2.5 Nonattainment
• Black carbon sources contribute a significant fraction of fine particles
• Evidence that traffic emissions (e.g. diesels) are particularly important to health
• Lower ozone NAAQS levels increase the importance of addressing global background
• Black carbon, other fine particles and ozone are significant ‘short-lived climate forcers’
Potential O3 Nonattainment
How might NAAQS implementation strategies change if climate effects are considered?

Implications of considering climate
• Implementing fine particle and ozone standards– Current PM2.5 and O3 NAAQS implementation relies heavily
on regional SO2 and NOx reductions (least cost)– The downside for climate – Consider strategies, guidance for more balanced programs
that consider health, exposure, and climate implications
• Slow arctic melting, near-term- Reduce black carbon
- Retrofit diesels, I/M; biodiesel fuels
- Shift springtime agricultural burning
- Reduce methane, ozone

‘Unmasking’ committed warming
• IPCC modeling shows masking of about 1 degree C from all sulfates. Increase in temperature is immediate with assumed SO2 reduction.
• SO2 emissions forecast to continue decline under current programs
• A crash CO2 reduction program could not curb the projected unmasking for decades.
Eliminate anth. SOx
CO2 stays at 2000 levels
• Cooling by sulfate, nitrates, and organic particles masks some of warming expected from greenhouse gases and black carbon
• Reductions in SO2 – needed to reduce health and acid rain impacts - are ‘unmasking’ the warming already built into the system.
• Selective BC and O3 controls could partially counter the SO2 unmasking
• Implications for PM2.5 Air Quality Management Plans:
•Climate, health and exposure case for providing more balanced reductions in all PM components than provided by current least cost approach that emphasizes regional SOx
• This increases costs, but also both climate and health benefits.

Rethinking Ozone Implementation Strategy (again) • Ozone strategy – regional NOx control, VOC/NOx
in urban areas.
• EPA RIA – more regional NOx control needed to attain tighter standards.• See Chart: Net ‘forcing’ compared for multiple pollutants. More NOx reductions will warm by increasing lifespan of methane, reducing nitrate particles.
• At lower O3 NAAQS levels, hemispheric transport becomes more significant. Methane and CO reductions effective on that scale.
• NOx reductions still needed for health, but a long-term strategy to reduce methane and CO in the northern hemisphere could offset NOx warming - and also help attain and maintain ozone standards in US and other nations.
Ozone produced by methane
Shindell et al., 2009

Current tools: Relative PM Benefits
Average effectiveness ($benefit/ton) of alternative PM control options
Assuming equal potency, reducing primary PM emissions in populated areas is most effective – importance of population exposure in “body-count” riskAdding O3, toxics benefits would not change relative rankings significantly

812 Estimates* - fraction of total air pollution damages
*first prospective study, draft second study has larger numbers
Effect Pollutant Mean %Baseline
MortalityAges 30 or older
PM 23,000 1%
Chronic bronchitis PM 20,000 3Chronic asthma O3 7,200 4%HospitializationRespiratory admissions PM, CO, NO2,
SO2, O3
22,000 0.6%
Cardiovascular admissions PM, CO, NO2, SO2, O3
42,000 0.9%
Emergency room visits for asthma PM, O3 3,800 0.6%Minor IllnessAcute bronchitis PM 47,000 5%Upper respiratory symptoms PM 950,000 0.9%Lower respiratory symptoms PM 520,000 4%Respiratory illness NO2 330,000 10%Moderate or worse asthma PM 400,000 0.2%Asthma attacks O3, PM 1,700,000 1%Chest tightness, shortness of breath, or wheeze
SO2 520,000 0.0003%
Shortness of breath PM 01,000 2%Work loss days PM 4,100,000 1%Minor respiratory restricted activity days
O3, PM 31,000 2%
Restricted activity days PM 12,000,000 1%
Change in Incidence of Adverse Health Effects Associated with Criteria Pollutants in 2010 (Pre-CAAA minus Post-CAAA) – 48 State U.S. (avoided cases per year) 2010

Mortality risk in ‘Six Cities’ v. PM declines
Accountability is hard• Even with high ‘body count’ risk, air pollution is
typically a small contribution to non-specific effects– It takes large concentration changes and populations to
see effects i.e., low signal to noise– HEI, CDC/EPA pilot tracking – air change x CR functions– Routine level 4 not
realistic for foreseeable future, need better specific indicators
– Look for major interventions, reductions retrospective and prospective (CR – LA)

Parting shots• Multipollutant perspectives, accountability have
already informed AQM, technology-based programs on national, regional, and local scales – Conceptualizing more comprehensive programs is useful, but
more focus on how to include in policy now– PM, ozone epidemiology studies generally reflect
contribution of multipollutant mixtures, not single pollutants.
– Priority research on PM, VOC components• Highly toxic low mass contributors and higher than average potency
mass fractions – chemical classes and/ or source specific• Harder to identify interactions, enabling agents
– CR - Maximum risk = body count; CAA continues concerns for equity, sensitive individuals

Parting shots (cont’d)• EPA should be encouraged to continue comprehensive AQM
experiments, innovative NAAQS specification– SOx/NOx combination standards for deposition– Multipollutant indicator for secondary PM and visibility
NAAQS = aSO4 + bOrg + cEC + dNO3 + edust– But why can’t PM, O3 designation be coordinated?
• Legislative initiatives – Multipollutant legislation – (e.g. Carper power sector act) should include
requirements, funding for accountability research, measurements with periodic reports
– Post energy/climate legislation likely to consider revisions to the CAA. An opportunity to identify modest changes that authorize or promote improved AQM approaches