munich personal repec archive - uni-muenchen.de words: economic development, development divide,...
TRANSCRIPT

MPRAMunich Personal RePEc Archive
Development divide vs digital divide –cross country study
Lechman Ewa
Faculty of Management and Economics, Gdansk University ofTechnology
October 2009
Online at http://mpra.ub.uni-muenchen.de/37770/MPRA Paper No. 37770, posted 31. March 2012 14:27 UTC

1
Development divide vs digital divide – cross country study
Ewa Lechman1
Published in monograph: Growth and innovation – selected issues, Gdańsk 2009.
Key words: economic development, development divide, digital divide, digital gap, ICTs. JEL codes: 011, 033
Abstract The paper presents most recent estimates on the field of cross national digital gaps, in terms of application new information and communication technologies. The author proposes a way of measurement of the digital gaps among countries. The methodology is mainly based on the taxonomy principles, using the notion of the n-dimension metrics.
Additionally, there are some dynamics of ICTs usage and implementation calculated. The digital gaps the authors analyzes in comparisons to the overall level of economic development. The statistical relationship between the two – digital gaps and economic development, is found. All data used in the analysis, are drawn from the International Telecommunication Union and United Nations
datasets.
Introduction
The in the section below, the author explores the magnitude of existing development divide among economies from all around the world and confronts it with digital divide. Existence of ‘divides’ of both type is obvious and not neglected by anyone. It is quite clear that there are
many developmental differences among countries, which come from different sources.
Technology is treated as one of the most important development factors. But in fact, it also
causes great disparities among nations. Those who have apply and use new technologies
obtain great opportunities to develop national economy quickly, those countries which do not do it – they just lag behind. Use and application of Internet is growing fast and what must be
underlined and stressed, all countries are now permanently connected to the World Wide
Web. But despite that fact, still great disparities in access to the Internet exist, and what is
even more they co-exist along with the lines of national income differences. That suggests
that in modern economy technological advancement has become one of the most crucial determinants of development potential.
In the following sections, the author will successively explain: notion and way of measuring
level of economic development, technology advancement measurement methods (considering
new information and communication technologies – ICTs), way of understanding ‘digital divide’ and finally – using appropriate statistical tools – asses the magnitude of existing
development and digital divide.
Economic development and its measurement
There are number of ways to define economic development. It is also very often taken for
economic growth and that is why, at the very beginning these two ideas should be
distinguished very clearly. Economic growth is a process of increasing national income, and consequently national income per capita2. Economic growth means quantitative changes, so
according to that definition, an economy is growing when its output is growing. Economic
development is defined as a process of structural changes but also of increasing national
income. It stands for quantitative and qualitative changes at the same time.
Economists traditionally3 distinguish four desirable factors that let a country develop. They are also called ‘four wheels to the development vehicle4‘.
Among these are:
Natural resources – this refers to such resources as land, minerals, fish, forests, metals, oil, gas; generally considered as helpful but not a critical factor for economic
development.
1 Ph.D., [email protected]; Gdansk University of Technology, Faculty of Management and Economics 2 If birth rates are lower than GDP growth rates. 3 According to Samuelson P.A., Nordhaus W.D.(1995), Economics; McGraw-Hill Inc., International Edition; 4 Beardshaw , J. (1992), Economics. A student`s guide, Pitman: London.

2
Human resources – this refers to people who staff and operate an organization; it also means skills, labor, experience; closely related to ‘human capital’ which also concerns quality
of human resources; for economic development this seems to be a critical factor in many
cases, that is why most governments implement programmes aimed to improve general health and nutrition, education, reduce illiteracy and improve labor skills.
Capital formation – generally it refers to financial and fixed capital; nowadays considered as a necessary condition that enables a country to develop.
Technological change and innovation5 - nowadays considered as the most important factor determining economic progress; in most countries perceived as a prerequisite
for further development
Having defined economic development and briefly characterized its major determinants, we shall consider the aspect of its measurement. In many cases national income per capita is
treated as a measure of development, but definitely it is not the proper one. Why? GNP does
not reflect real conditions that a person is living in, does not say anything about freedom one
enjoys (if any), and what possibilities one has to be creative and benefit from using his vital
skills. There are also some major problems which motivated economists to develop an
alternative idea of measurement of economic development level. First – it quite obvious those poor countries are generally cheaper than rich ones. In other words – average price level is
lower in underdeveloped countries than in the developed ones, and consequently purchasing
power of one US dollar is higher in poor country than in a rich one. One dollar in Norway is the ‘same dollar’ as in – let`s say – Bangladesh. GDP per capita expressed in US dollars gives
an extraordinary exaggerated estimate of the differences in average living standards between poor and rich countries6. Besides GDP per capita does not measure directly well-being. Societies in economies with similar level of GDP per capita may differ widely in terms of
educational attainment or healthcare. So, there was an essential need to develop a measure that would go ‘beyond’ GDP per capita solely.
Presently, the most commonly used measure of economic development is the one developed in
1990 by United Nations Development Programme (UNDP). They introduced a new measure
that tries to express what economic development really is. It goes far beyond the income, in
order to assess the level of people’s long-term well-being. Bringing about development of the people7, the indicator emphasizes that the goals of development are choices and freedoms, not
just income. The measure, a non-monetary indicator, is Human Development Index (HDI). It
is regularly calculated to assess progress in achieving general welfare of nations and its
concept is broader than any other measure of human well-being8. HDI measures country’s
achievement in 3 basic dimensions9: long and healthy life (measured by life expectancy at birth), knowledge (measured by adult literacy rate and the combined gross enrolment ratio for primary, secondary and tertiary schools), and standard of living (measured by GDP per capita
in purchasing power parity). All dimensions have equal weights in creating final value of the
index. HDI value varies from 0 to 1, where 1 is the best score. Full list of countries with their
HDI values is available in Human Development Report 2007-200810.
ICTs and their measurement
Information and communication technologies (ICTs), broadly defined, are tools used to
achieve some economic and social targets. They facilitate – by electronic means – creation,
storage, management and dissemination of information and knowledge11. ICTs can be
understood as industry but also as a tool, or set of tools, and only if they are regarded as
tools they can potentially become an enabler of social and economic development. But why are these ICTs assigned such importance in the development context? Mostly it is because of
their unique characteristics, opportunities they offer and benefits they create. They are
relatively cheap and can be implemented and used practically everywhere. ICTs have great
5 Samuelson P.A. and W.D. Nordhaus (1995), Economics; McGraw-Hill Inc.: International Edition . 6 Meier G. and J.E. Rauch (2005), Leading Issues in Economic Development, Oxford University Press: New York, p.13. 7 http://hdr.undp.org/aboutus, accessed on 5 May 2009. 8 Human Development Report 2005, http://www.un.org, accessed on 6 May 2009. 9 Ibidem. 10 Fighting Climate Change. Human solidarity in a divided world. HDR 2007/2008, UNDP 2009; accessed on 10 May 2009. 11 Gester R. and S. Zimmermann, Information and communication Technologies for poverty reduction: discussion paper, Swiss Agency of
Cooperation & Development, 2003 Fighting Climate Change. Human solidarity in a divided world. HDR 2007/2008, UNDP 2009; accessed on 5 May 2009.

3
impact on individual user’s welfare, change the way business is run, transform societies, enable knowledge sharing and free from the so called ‘tyranny of physical distance’. ICTs
infrastructure create economies of scale12 and by stimulating building social and economic networks they spillover benefits. They enable overcoming distance, promote social inclusion,
foster information and knowledge sharing, offer new services, health care information and
learning opportunities. They also enhance job creating and local entrepreneurship. ‘ICTs
reduce transactions costs, change the structure of markets and of public services and
institutions, entrap human resources, and immediately increase potential values of human capital13‘. Much evidence from all around the world has shown that enormous benefits can be
derived from ICTs, if they facilitate mainstreaming of information and knowledge. ICTs if
deployed and used properly can solve many problems that many economies are struggling
with. Now, almost everyone would agree that technology has always been, and still is a great
and powerful tool for human development.
Trying to measure technological achievements of nations one should realize that usually they are much more extensive and complex than any index – even the most sophisticated – could
capture. But having in mind a necessity of being able to monitor countries progress in
implementing and using ICTs, but also making international rankings to compare their
achievements, there is an essential need for such index. Until now there have been
introduced three methods to measure ICTs development in a country. United Nations
Development Programme and International Telecommunication Union (ITU) have elaborated indices which try to measure overall achievements of countries and nations in implementing
ICTs, but also nation’s ability to benefit from multiple opportunities that ICTs offer. These are:
Digital Opportunity Index (DOI), ICT – Opportunity Index (ICT-OI), Networked Readiness
Index (NRI), ICT Development Index (IDI). Above all, these 4 mentioned indices they are commonly used to measure ‘digital divide’ among countries. In that case, ‘digital divide’ is
simply understood as people`s access – or lack of access – to information and communication technologies. The very problem of ‘digital divide’ will be discussed later in the paper, but for
now it should be underlined, that aside from defining strictly the term, it is relative. Literally
it means, that discussion on any kind of digital divide makes sense only when at least two –
or even better more – countries (objects) are proposed for the analysis. There are numerous
benefits of having a composite measure of digital divide. First of all it captures the magnitude
of it and let’s assessing its evolvement over time. It is essential to capture different dimensions of digital divide, and composite indices let we to compare magnitude of that divide
using a single number.
Below some general methodological hints of calculating each index are presented. In February
2005 ITU and the Korea Agency for Digital Opportunity and Promotion (KADO) announced a
new index to measure ICTs. DOI is a composite index that allows the tracking and comparison of countries in ICTs infrastructure capabilities, access path and device,
affordability and coverage, and quality14. DOI methodology utilizes 11 core indicators
categorized in 3 groups: opportunity, infrastructure and utilization. DOI value ranges from 0 to 1, where 1 is the best score. In the three groups of ‘opportunity, infrastructure, utilization’
some specific indicators (values) are taken into account. They are as follows15:
Opportunity: percentage of population covered by mobile cellular telephony, internet access tariffs as a percentage of per capita income, mobile cellular tariffs as a
percentage of per capita income;
Infrastructure: proportion of households with a fixed line telephone, proportion of households with a computer, proportion of households with Internet access at home,
mobile cellular subscribers per 100 inhabitants, mobile Internet subscribers per 100
inhabitants;
Utilization: proportion of individual that used the Internet, ratio of fixed broadband subscribers to total Internet subscribers, ratio of mobile broadband subscribers to
total mobile subscribers.
12 Torero, M. and J.Von Braun (2006), ICTs for the poor, International Food Policy Research Institute, www.ifpri.org/, accessed on 11 Oct 2008. 13 Spence, R. (2005), ICTs, Internet, Development and poverty reduction, 2005, http://www.developmentgateway.org, accessed on 6 Jan 2007. 14 http://www.itu.int/osg/spu/statistics/DOI/background.phtml, accessed on 1 May 2009. 15 World Information Society Report 2007, Information Telecommunication Union 2008, accessed on 15 Feb 2008.

4
The other index proposed by ITU is ICT Opportunity Index (ICT-OI)16. In this case there are 4
different groups of indicators applied in the calculation methodology. They are:
Info density (networks): main telephone lines per 100 inhabitants, mobile cellular subscribers per 100 inhabitants, international Internet bandwidth
Info density (skills): adult literacy rate, gross enrolment ratio
Info use (uptake): internet users per 100 inhabitants, proportion of households with a TV, computers per 100 inhabitants
Info use (intensity): total broadband Internet subscribers per 100 inhabitants, international outgoing international traffic (minutes) per capita.
In case of the third index – ICT Development Index17 (IDI), these groups of indicators are:
ICT access: fixed telephone lines per 100 inhabitants, mobile cellular subscriptions per 100 inhabitants, internet bandwidth per Internet user, proportion of households
with a computer, proportion of households with Internet access at home;
ICT use: Internet users per 100 inhabitants, fixed broadband Internet subscribers per 100 inhabitants, mobile broadband subscriptions per 100 inhabitants;
ICT skills: adult literacy rate, secondary gross enrolment ratio, tertiary gross enrolment ratio.
The last index – Networked Readiness Index (NRI) is the one, annually calculated by World
Economic Forum. Values applied in the calculation methodology are taken from 3 different
fields of interests18. They are:
Environment (market, political, infrastructure)
Readiness (individual, business, government)
Usage (individual, business, government) As stated by authors of the NRI, it is a measure which helps to understand and assess ‘the
degree of preparation of nation or community to participate in and benefit from ICT development’19.
All most recent values of all 4 indices are presented in the section where statistical analysis is
run.
What does the “digital divide” mean?
The diffusion of the Internet, its accessibility, application and effective use has become the fact – both in the high income, developed countries as also in these underdeveloped ones. The
Internet widespread has been really explosive in the past decades. To verify some numbers
see Table 3.1 (below) where we can see changes in real access and use of basic ICTs tools in
years 2000-2007 for different continents.
Table.1. Changes in the Internet usage, 2000-2007.
Subscribers per 100
inhab.
Users per 100
inhab.
Subscribers per 100
inhab.
Users per 100
inhab.
Subscribers growth rate(total)
Users growth
rate(total)
2000 2000 2007 2007 2000-2007
2000-2007
Africa 0.16 0.55 1.25 5.48 863 % 1 067 %
Americas 6.94 18.79 10.92 43.23 72 % 150 %
Asia 1.37 3.08 6.56 14.43 418 % 421 %
Europe20 8.12 14.07 20.60 43.65 190 % 218 %
Oceania21
14.60 35.58 31.68 52.36 92 % 62 %
World 2.88 6.51 8.29 20.79 219 % 253 %
Source: own estimates using data from ITU, 2009
As we can see from the Table 3.1, there exist huge disparities among continents when
comparing the widespread of the Internet. Although there is a significant progress in implementing ICTs in each continent, it is still clearly visible that great difference exist.
16 Measuring Information Society 2007, Information Telecommunication Union 2008, accessed on 15 Feb 2008. 17 Ibidem. 18 The Global Information Technology Report 2008-2009, World Economic Forum 2009, http://www.weforum.org, accessed on 8 Jan 2009. 19 Ibidem. 20 Including Russia. 21 Including Australia and New Zealand.

5
Using additional information22 about total number of subscribers in each continent and in
world as whole, we estimate an average internet subscribers and users growth rate for each year.
To estimate the following we use a formula:
Yt = Y0*(1 + a)n
Where: Yt – total number of users/subscribers of the Internet in 2007
Y0 – total number of users/subscribers of the Internet in 2000
a – an average growth rate per year
n – number of periods
The mathematical formula to find ‘a’ is given by:
a = (
- 1)*100%
As we can conclude from estimations, an average annual growth rate of Internet users – in
world – is at about 19,7%. In Africa, Americas, Asia, Europe and Oceania the annual growth rates are: 42,04%, 13,9%, 26,58%, 17,98% and 21,74% respectively. Africa has made the
greatest progress in ICTs` implementation, but still is lagging behind significantly. Relatively
lowest annual average growth rates are noted in Americas and Europe, but all countries in
these two continents are widely perceived as leaders in terms of ICTs` applying.
Table 2. Shares of global Internet subscribers and users in particular continents.
Subscribers
(in thousands)
Users (in
thousands)
Subscribers
(in thousands)
Users
(in thousands)
Share of
global
Internet subscribers
Share of
global
Interner users
Share of
global
Internet subscribers
Share of
global
Interner users
2000 2000 2007 2007 2000 2007 2000 2007
Africa 1 151 4486 11 091 52 348 0,68%
1,14 %
2,08% 3,76%
Americas 55 579 157221 96 025 393 014 33,30% 39,95% 18,02%
28,29%
Asia 48 449 110156 251 111 573 766 29,03% 27,99% 47,12%
41,30%
Europe23 57 213 110647 166 012 352 143 34,28% 28,12% 31,15%
25,35%
Oceania24 4 476 10939 8 623 17 746 2,68% 2,78% 1,61% 1,27%
World 166 868 393451 532 862 1389019
Source: own estimates using data from ITU, 2009
To complete the introductory analysis of digital divides in the world, we shall analyze Table
3.2, where shares of global Internet users and subscribers are presented. To have a clear idea about ‘real’ access to ICTs, we would better analyze figures showing numbers of Internet
users. We can observe that in all parts of the world these numbers are increasing
significantly, while distribution is slightly changing. Still share of total Internet users stays at
the lowest level in Africa and Oceania, in Europe it has changed a bit, while both in Americas and Asia shares has changed significantly. In Americas the share has fallen from 33,3% in
2000 to 18,02% in 2007, while in Asia – on the contrary – has risen from 29,03% in 2000 up
to 47,12% in 2007.
Whatever would be, no one can deny that never before, any innovation had not have such ‘ability’ to spread so fast all over the world. Looking once again at the Table 3.1 – above – the
spread of Internet seems extraordinary. Growth rates – considering Internet subscribers and users, are extremely high on the time period 2000-2007. Highest scores are observed for
Africa and Asia, which proofs that poor and low-income countries implement ICTs at high
speed.
22 All data is taken from www.itu.int, accessed on 7 April 2009. 23 Including Russia. 24 Including Australia and New Zealand.

6
Below in Table 3.3, there are presented results of calculation of Gini coefficients for each
continent separately (for years 2000 and 2007), taking account number of Internet subscribers and then number of Internet users.
Table 3. Gini coefficients for continents, internet subscribers and users. World
countries, 2007 and 2009. 2000 2007
Gini coef. (Internet
subscribers)
Gini coef. (Internet
users)
Gini coef. (Internet
subscribers)
Gini coef. (Internet
users)
Africa 0,86 0,70 0,74 0,64
Americas 0,81 0,72 0,69 0,74
Asia 0,82 0,74 0,72 0,64
Europe25 0,78 0,73 0,74 0,78
Oceania26 0,89 0,64 0,73 0,60
Source: own calculation using data from ITU 2009
As we can clearly see all coefficients are pretty high, despite slight decrease in 2007. These
differences are huge and proof existence of great digital divides among nations. Of course it is mainly a due to some particular characters of new information and
communication technologies (ICTs), which are cheap, easy to apply and use, have great
potential of implanting them in different aspects of life (social, cultural, economic). Many
people have been extremely enthusiastic considering the benefits and gains which can be
drawn form the use of Internet. Many have suggested that ICTs can reduce income
inequalities – within and among countries, lower – or even eliminate – barriers to getting crucial information and knowledge, could expand social networks, enhance education, foster
economic growth and many others. In contrast, others have mentions possible dangers which
could bring fast and uncontrolled development of ICTs use – especially in underdeveloped
countries. One cannot deny that the Internet diffusion is highly uneven among economies,
and as its consequence differential spread can cause increasing inequalities when ICTs access and use is considered27.
No research where society`s access to information is taken into account is new. Lately, the theory of the so called ‘knowledge gap’ has been discussed. In the theory there was suggested
that there is a significant gap between different segment in societies which is caused by
different access to knowledge and its acquisition. Tichenor28 states: ‘segments of the
population with higher socio-economic status tend to acquire information at a faster rate than the lower status segments so that the gap in knowledge between these segments tends to increase rather than decrease’29. His further studies have shown that there are many
independent factors (explaining variables) which contribute to knowledge acquiring and
perception. So level of knowledge should rather be perceived as a dependent variable,
depending on many others. In the studied case of digital divide, one could state that ICTs are
one of these independent variables explaining level of knowledge in a society. It is also fully justified to say that today`s ‘digital divide theory’ has its roots in ‘knowledge gap theory’.
Emergence of fully digital media, way of communication, way of data storage, made it possible and justifiable to discus problem of ‘digital divide’ at national and international level. Many
say that the very term ‘digital divide’ is a flip side of e-inclusion.
Digital divide or alternatively digital gap, can be defined as the ‘gap between citizens from
different socio-economic backgrounds with regard to their opportunities and abilities to access and use information and communication technologies’30. Here one should distinguish
two different terms in accordance to ICTs: ‘access’ and ‘use’. ‘Access’ is commonly understood as just simple possessing networked-connected tool or machine, and ‘use’ refers more to
25 Including Russia. 26 Including Australia and New Zealand. 27 Hargittai, E. (2009), The Digital divide and what to do about it, http://www.eszter.com/research/pubs/hargittai-digitaldivide.pdf, accessed on
6 May 2009. 28 Tichenor, P., C.O`Lien and G. Donohue (1970), ‘Mass media flow and differential growth in knowledge’, Public Opinion Quarterly, 34, http://poq.oxfordjournals.org/cgi/content/summary/34/2/159, accessed on: 10 Feb 2009. 29 Ibidem in Selhofer H., Husing T. (2002), The Digital Divide Index – a measure of social inequalities in the adoption of ICTs,
http://www.empirica.com/publikationen/documents/Huesing_Selhofer_DDIX_2002.pdf’ accessed on 6 May 2009. 30 Ibidem.

7
effective usage of ICTs tools. ‘to use’ is much more than just simple have ‘access to’. To have
access to ICTs tools does not have to mean a direct use of them. ‘Effective usage’ of ICTs
implies using them for improving general well being and socio-economic conditions of living, which can be quantified by simple observing of income of people using ICTs tools. ‘Effective usage’ of means translating ICTs potential into higher income and improvement of socio-
economic life. The term ‘digital gap’ is often uses in binary terms, verifying whether: someone has or has not
access to ICTs tools, and if someone is or is not using ICTs. But such simplification does not
show a complex nature of the digital divide. We would rather argue that its definition should
capture a wide array of aspects influencing existence and magnitude of the gap. Hargittai31 says that digital gap could also be defined as ‘inequality in access to and use of medium, with lower levels of connectivity’ among different social groups.
Chen and Wellman32 state that ‘digital divide involves the gap between individuals (and societies) that have the resources to participate in the information era and those who do not’.
They also underline that digital divide should be studied and analyzed in broad contexts of
international economic and social relations. While looking at the world map of the Internet access and use one can clearly see that there are large disparities among countries. Rich
nations which dominate and they situate in the core of global network, and on the opposite
side those economies which are rather peripheral ones. The poor nations still lack relatively
cheap access to World Wide Web, lack skills to use ICTs potential effectively and sometimes
basic infrastructure to connect with the net. Observing the character of ICTs one could argue that today`s ‘info-exclusion’ is rather an exclusion caused ‘by’ information and not ‘from’ information33.
Information and communication technologies are global ones. Their application can be
observed in almost all activities in all economies, ICTs are a wide bundle of different products
and applications used in worldwide markets. Because of global character of these technologies, any disparities among nations ‘caused’ by them also are global. The discussed
digital divide is also a ‘global digital divide’.
Statistical analysis
To learn about the magnitude of global development and global digital gap, a statistical
analysis is implemented. In the following section – by using appropriate statistical tools – the
magnitude of development and digital divides is estimated. All countries for which necessary
data is available are included in the analysis. Some countries – for technical reasons – had to be excluded from estimation process. In the Table 3A (at the end of article), all data used in
the analysis are compiled.
Methodology applied in the analysis is as follows. For all countries 6 different explanatory
variables are applied. To assess level of economic development two measures are taken into account: real GDP PPP per capita and Human Development Index (HDI). The other four of
them explain level of technological (ICTs) advancement, and these are: Digital Opportunity Index (DOI), ICT-Opportunity Index (ICT-OI), Networked Readiness Index (NRI) and ICT
Development Index (IDI). Countries where there is at least one data missing, they are
excluded from the analysis.
After selection, all data is standardized and after development and digital divides are
estimated. All data is standardized according to formal equitation:
a =
x
Where:
- is a raw score to be standardized
- is a mean of all scores in the population
31 Hargittai E., op. cit. 32 Chen, W. and B. Wellman (2004), ‘The global Digital divide – within and between countries’, IT&Society, 1, p.3; https://www.wiki.ed.ac.uk/, accessed on 8 Feb 2009. 33 Selhofer H. and T. Husing (2002), The Digital Divide Index – a measure of social inequalities in the adoption of ICTs,
http://www.empirica.com/publikationen/documents/Huesing_Selhofer_DDIX_2002.pdf’ accessed on 6 May 2009.
8
- is a standard deviation of scores in the population In this case the so called distance matrix is constructed to show ‘distances’ (divides) among
countries. The distance matrix is defined as matrix containing distances of a set of points.
These points are taken pairwise. Distances can be described as something expressing how far
apart objects are located. The most common method for calculating distances among objects, is calculating distances in the Euclidean space, but also the so called Chebyshev distance34
or Manhattan distance35 methodology are applied.
There will be 2 different distance matrixes constructed: for ICTs` indices only (meaning: DOI, IDI, NRI and ICT-OI), for economic development indices only (meaning: HDI, GDP PPP per capita). In each case a ‘leader’ country is selected – usually the one which is performing best
in the category. Its performance on each field a reference standard value. Results of the rest of countries are compared with the ‘leader`s’ performance. On that basis we are able to draw
conclusions about existing divides in world economy.
First, there has been estimated the magnitude of development divide among countries. 119
countries have been selected for the analysis purposes, the rest of them had to be excluded
from the estimation process. For each country statistical data considering level of economic
development, is applied. Namely – Human Development Index and real gross domestic product in PPP per capita. It is clearly shown that in this case a ‘leader’ country is Luxembourg as an economy of overall best performance in terms of real GDP PPP per capita
and HDI. Each other country is compared to Luxembourg.
Development divides have been calculated as distances of each single country and
Luxembourg. According to particular scores we can conclude about how far a given country is
from Luxembourg considering level of economic development. In Table 3.4, below there have
been presented results of calculation. In the two tables below, results of calculation of both – development and digital – divides
among countries. How to interpret numbers (note there are no units) in columns? Each numbers ‘tells’ how far is a country located from Luxembourg which is a selected reference
standard object. It tells we what is the distance – considering level of development and,
separately, technological advancement – of each country from Luxembourg which is the best
performing country. It is not very surprising that countries located on the top of both tables are usually best developed ones. It means that there are quit short distances between a
country and Luxembourg, which implies small divides among these economies. Consequently,
higher scores mean greater divides. In terms of development divide, Mali and Burkina Faso
are the most lagging behind countries, and in terms of digital divides – they are Ethiopia and Chad. What is surprising, Qatar is a country located at the top ‘of the list’ which means that
it is the ‘closest’ country to Luxembourg. It might seem a bit strange but consider the level of GDP per capita that citizens of Qatar are enjoying. It is relatively pretty high – Qatar`s GDP
PPP per capita is at 86 66936, while the same value in Luxembourg is 81 730. However Qatar
is performing best in terms of GDP PPP per capita, in terms of social (human) development its
results are not so good, which explains why in our ranking Qatar is not a reference country.
As it was already stated, level of overall development should not be understood and perceived
in terms of income levels only. Also presence of few more economies like United Arab
Emirates or Saudi Arabia might be rather surprising but, it is mostly due to their relatively (in comparison to Luxembourg) level of GDP PPP per capita, which explains their relatively good
position in the ranking.
In the overall ranking of development divide, Poland locates at 43rd place, right after such
economies as Latvia, Trinidad&Tobago (!), Lithuania and Hungary. That score locates Poland
almost in the middle of the ranking.
However, there are some differences in rankings between development and digital divides, one cannot deny that economic and technological backwardness they go along together.
Existence of such great disparities among economies, is mostly a direct consequence of the
following factors contributing (negatively) to digital and development divides37:
Unequal diffusion of technologies – here few particular factors should be underlined, there are: absolute lack of access to technological infrastructure which explains
34 Also known as chessboard distance. 35 Also known as city block distance or Manhattan length. 36 In international dollars. 37 Haslam, P.A., J. Schafer and P. Beaudet (2009), Introduction to International Development, Canada: Oxford University Press, p. 458.

9
divides among nations and within nations (between rural and urban areas). Other
factors are: lack of education, capabilities, high cost of usage.
Low affordability – physical access is a prerequisite for full and effective use of ICTs, but definitely is not a sufficient one. A person having potential access to technology
tools, he also must afford buying at least a basic set of services to use ICTs` tools. If
not – if relative costs are too high, then the extraordinary potential of ICTs is
unexploited.
Lack (or low) skills – factor closely related to educational attainment. It is especially apparent in areas where access to basic education is limited. Persons who have
limited access to education system also tend to have less capabilities use ICTs effectively.
Here should be stressed that on one hand, digital divide can be treated as a consequence of different ‘lacks’ of something – namely education, skills, capabilities, sufficient income to buy
basic set of ICTs` tools and services. But also reversely, digital divide can be understood as
one link in a causal chain, meaning that we treat digital divide as something which causes different exclusions. Social, economic, cultural, political exclusion which constitute a huge
bound of problems that some economies have to deal with. Limited access to new information
and communication technologies can cause different exclusions and divides – both among
nations and within them – but also, when applied properly, can help to solve some problems by simply ‘showing’ the way out38.
38 Servon, L.J. (2002), Briging Digital divide, Oxford: Blackwell Publishing, p. 9.

10
Table 4. Development divide among countries, estimates for 2008.
Euclidean distance
Manhattan distance
Chebyshev distance
Luxembourg 0,00 0,00 0,00
Qatar 0,52 0,72 0,43
Norway 1,59 1,73 1,58
Singapore 1,80 1,93 1,79
USA 2,07 2,11 2,07
Hong Kong 2,22 2,27 2,22
Switzerland 2,32 2,38 2,32
Ireland 2,32 2,41 2,32
Kuwait 2,45 2,76 2,43
Netherlands 2,46 2,52 2,46
Austria 2,51 2,53 2,51
Iceland 2,51 2,65 2,51
Canada 2,53 2,63 2,53
UAE 2,58 3,01 2,54
Denmark 2,59 2,62 2,59
Australia 2,64 2,75 2,64
Sweden 2,65 2,72 2,65
Finland 2,67 2,72 2,67
UK 2,69 2,70 2,7
Germany 2,75 2,81 2,75
Japan 2,81 2,87 2,81
France 2,83 2,88 2,83
Bahrain 2,88 3,33 2,84
Spain 3,04 3,07 3,04
Italy 3,04 3,06 3,04
Greece 3,04 3,15 3,04
Slovenia 3,15 3,31 3,15
Israel 3,19 3,26 3,19
Cyprus 3,19 3,43 3,18
New Zealand 3,26 3,27 3,26
Korea 3,30 3,44 3,30
Czech Rep 3,35 3,66 3,33
Oman 3,41 4,12 3,31
Malta 3,47 3,85 3,44
Saudi Arabia 3,53 4,25 3,43
Portugal 3,55 3,83 3,54
Slovakia 3,58 4,05 3,54
Estonia 3,67 4,15 3,63
Hungary 3,71 4,12 3,69
Lithuania 3,78 4,25 3,75
Trinidad&Tobago 3,78 4,50 3,70
Latvia 3,85 4,36 3,81
Poland (43rd place)
3,85 4,28 3,82
Croatia 3,93 4,47 3,89
Russia 4,00 4,79 3,91
Chile 4,02 4,47 3,99
Argentina 4,04 4,48 4,01
Mexico 4,06 4,71 4,00
Libya 4,07 4,78 4,00
Malaysia 4,10 4,84 4,02
Uruguay 4,15 4,68 4,11
Romania 4,19 4,92 4,11
Bulgaria 4,20 4,87 4,13
Turkey 4,20 5,11 4,07
Botswana 4,20 5,59 3,80
Venezuela 4,21 5,04 4,10
Mauritius 4,24 5,02 4,15
Costa Rica 4,27 4,83 4,22
Panama 4,28 5,02 4,20
Kazakhstan 4,28 5,11 4,18
Brazil 4,35 5,15 4,26
Macedonia 4,41 5,21 4,33
Colombia 4,47 5,32 4,37
Dominican Rep 4,48 5,38 4,36
Peru 4,48 5,42 4,36
Bosnia 4,50 5,29 4,42
Azerbaijan 4,51 5,56 4,34
Ukraine 4,52 5,38 4,41
Ecuador 4,55 5,49 4,42
Albania 4,55 5,35 4,46
South Africa 4,58 5,93 4,26
Jamaica 4,58 5,69 4,40
China 4,63 5,55 4,51
Algeria 4,64 5,76 4,46
Armenia 4,66 5,59 4,55
Jordan 4,68 5,62 4,56
El Salvador 4,69 5,80 4,51
Georgia 4,72 5,75 4,57
Paraguay 4,73 5,76 4,59
Egypt 4,75 5,98 4,52
Sri Lanka 4,76 5,84 4,60
Philippines 4,78 5,73 4,66
Syria 4,79 5,95 4,59
Indonesia 4,82 5,97 4,63
Guatemala 4,84 6,16 4,58
Honduras 4,86 6,13 4,62
Bolivia 4,86 6,15 4,61
Vietnam 4,88 6,01 4,70
Namibia 4,89 6,36 4,54
Mongolia 4,90 6,17 4,66
Moldovia 4,90 6,14 4,68
Nicaragua 4,93 6,16 4,71
Morocco 4,96 6,45 4,60
Kyrgyztan 4,98 6,27 4,74
Tajikistan 5,04 6,43 4,75
India 5,12 6,71 4,70
Cambodia 5,21 6,89 4,75
Pakistan 5,30 7,14 4,70
Mauritania 5,33 7,18 4,74
Lesotho 5,38 7,23 4,79
Bangladesh 5,38 7,24 4,79
Cameroon 5,38 7,29 4,74
Nepal 5,43 7,34 4,80
Kenya 5,44 7,38 4,77
Madagascar 5,44 7,35 4,81
Zimbabwe 5,45 7,42 4,75
Senegal 5,50 7,52 4,76
Gambia 5,51 7,52 4,79
Uganda 5,52 7,52 4,80
Nigeria 5,58 7,67 4,74
Tanzania 5,63 7,74 4,79
Benin 5,71 7,91 4,77
Zambia 5,73 7,94 4,79
Ethiopia 5,86 8,15 4,82
Chad 5,88 8,21 4,77
Mozambique 5,93 8,28 4,82
Mali 5,94 8,29 4,80
Burkina Faso 5,97 8,35 4,79
Source: own calculations
Secondly, distances among countries have been calculated considering only level of
technological advancement in ICTs. Analogous methodology is applied as in the first case.
Results are presented in Table 3.5.

11
Table 5. Digital divide estimates for countries, 2008
Euclidean distance
Manhattan distance
Chebyshev distance
Luxembourg 0,00 0,00 0,00
Hong Kong 0,48 0,7 0,44
UK 0,51 0,8 0,43
Norway 0,61 0,9 0,52
Netherlands 0,61 0,8 0,59
Canada 0,66 1,2 0,43
Belgium 0,68 1,2 0,46
Australia 0,69 1,3 0,46
Iceland 0,72 1,2 0,59
Switzerland 0,72 0,9 0,70
Singapore 0,75 1,3 0,65
Germany 0,76 1,3 0,65
Austria 0,81 1,4 0,63
USA 0,87 1,6 0,65
Sweden 0,96 1,3 0,93
Finland 0,98 1,5 0,74
Ireland 0,99 1,7 0,81
France 1,06 1,8 0,89
Israel 1,07 1,7 0,75
Denmark 1,08 1,6 1,00
Estonia 1,16 2,0 0,97
New Zeland 1,16 1,7 1,09
Korea 1,22 2,2 0,87
Japan 1,23 2,0 1,10
Spain 1,44 2,5 1,17
Slovenia 1,50 2,7 1,20
Italy 1,52 2,8 1,11
Malta 1,82 3,2 1,52
Portugal 1,85 3,2 1,55
Lithuania 2,02 3,6 1,63
UAE 2,09 3,7 1,74
Cyprus 2,09 4,0 1,44
Hungary 2,19 4,0 1,72
Czech Rep 2,20 4,1 1,62
Latvia 2,20 4,3 1,47
Qatar 2,32 4,3 1,68
Slovakia 2,39 4,5 1,75
Bahrain 2,44 4,5 1,81
Croatia 2,62 5,0 1,87
Greece 2,66 5,0 2,00
Chile 2,76 5,0 2,05
Poland (41st place)
2,80 5,4 1,97
Malaysia 2,91 5,0 2,12
Jamaica 2,96 5,7 1,98
Romania 3,04 5,8 2,12
Kuwait 3,15 6,0 2,09
Bulgaria 3,23 6,1 2,38
Mauritius 3,23 6,2 2,12
Argentina 3,28 6,3 2,21
Uruguay 3,31 6,4 2,19
Russia 3,31 6,3 2,24
Turkey 3,33 6,3 2,33
Brazil 3,39 6,5 2,25
Saudi Arabia 3,44 6,5 2,44
Costa Rica 3,48 6,7 2,31
Trinidad&Tobago 3,53 6,8 2,34
Mexico 3,58 6,9 2,37
Jordan 3,71 7,0 2,58
China 3,71 7,1 2,51
Macedonia 3,71 7,2 2,41
Ukraine 3,75 7,3 2,58
Colombia 3,78 7,3 2,55
Oman 3,79 7,2 2,60
Venezuela 3,82 7,4 2,46
Panama 3,85 7,5 2,64
Bosnia 3,87 7,5 2,47
South Africa 3,92 7,4 2,64
Kazakhstan 4,03 7,8 2,74
Peru 4,05 8,0 2,56
Dominican Rep 4,10 8,0 2,66
El Salvador 4,17 8,1 2,65
Morocco 4,19 8,0 2,80
Azerbaijan 4,21 8,2 2,76
Egypt 4,22 8,1 2,81
Georgia 4,23 8,3 2,69
Moldovia 4,26 8,5 2,58
Philippines 4,33 8,5 2,81
Algeria 4,39 8,5 2,84
Ecuador 4,40 8,7 2,64
Mongolia 4,47 8,8 2,72
Guatemala 4,48 8,7 2,87
Armenia 4,51 8,9 2,72
Vietnam 4,52 8,9 2,83
Botswana 4,55 8,8 2,92
Albania 4,58 9,0 2,80
Sri Lanka 4,58 8,9 3,00
Indonesia 4,61 9,0 2,91
Syria 4,62 9,1 2,83
Lesotho 4,63 9,1 2,92
Namibia 4,74 9,3 2,86
India 4,78 9,0 3,05
Bolivia 4,78 9,5 2,86
Paraguay 4,80 9,5 2,82
Honduras 4,88 9,6 2,95
Senegal 4,95 9,6 3,11
Kyrgyztan 5,01 10,0 2,91
Nicaragua 5,05 10,0 2,94
Pakistan 5,15 10,1 3,13
Tajikistan 5,26 10,4 3,13
Gambia 5,45 10,8 3,14
Kenya 5,46 10,7 3,15
Nigeria 5,52 10,9 3,13
Cameroon 5,54 11,0 3,18
Mauritania 5,58 11,0 3,14
Lebanon 5,58 11,1 3,26
Benin 5,68 11,3 3,22
Cambodia 5,70 11,3 3,29
Bangladesh 5,74 11,4 3,26
Zambia 5,77 11,5 3,19
Tanzania 5,78 11,4 3,26
Uganda 5,79 11,5 3,28
Nepal 5,80 11,5 3,30
Madagaskar 5,85 11,6 3,31
Zimbabwe 5,86 11,7 2,98
Mali 5,92 11,7 3,35
Burkina Faso 5,94 11,7 3,37
Mozambique 6,09 12,1 3,32
Ethiopia 6,21 12,4 3,39
Chad 6,65 13,3 3,59
Source: own estimations

12
Additionally a correlation coefficient has been calculated taking account average scores in
distances (see Figure 3.1, below) – both for development and digital divide. As result we obtain r = 0,988 (r is close to 1) which implies very high and statistically significant and
almost perfect correlation between these two scores. In that case the r2 = 0,97, which means
levels of dependent variable in 97% is explained by changes in explanatory variables. To
proof the statement, also a scatter plot has been put below, presenting relations between
development and digital divides.
Figure 1. Statistical relationship between magnitude of development and digital
divide.
Development Divide vs Digital Divide
0 1 2 3 4 5 6 7 8 9
Digital divide
0
1
2
3
4
5
6
7
Develo
pm
ent
Div
ide
Source: own calculations
The scatter plot explains that countries which are lagging behind it terms of technological
advancement (ICTs implementation) they also lag behind in terms of socio-economic
development.
After, there have been completed some estimations for three different groups of countries.
First group consists of economies where distance in terms of digital divide is no higher than
2 (there are 26 countries), the second one where the distance in terms of digital divide is between 2 and maximum 6,0 (29 countries), and finally the third group where divides are
highest (23 countries). In the first group the correlation coefficient is about r = 0,78, in the
second one – r = 0,99, and in the last one – r = 0,92. In all three cases coefficients are high
and statistically significant. But the lowest score is obtained in the highest developed
countries. Looking at numbers we can note that these countries digital divide (still comparing to Luxembourg) is relatively low, while development divide is ‘growing’ rather
fast. As consequence the r coefficient is relatively low – comparing to 2 other country groups. Analysing raw data – especially level of real GDP PPP per capita - we can suppose
that great disparities in GDP level are the main cause of such divides.

13
Table 6. Average scores in distances – both development and digital.
Digital
Divide
Development
Divide
Qatar 0,55 0,56
Norway 0,58 1,63
Singapore 0,67 1,84
USA 0,68 2,08
Switzerland 0,77 2,34
Hong Kong 0,77 2,24
Netherlands 0,78 2,48
Ireland 0,83 2,35
Kuwait 0,85 2,55
Austria 0,90 2,52
Iceland 0,91 2,56
Canada 0,96 2,56
UAE 1,03 2,71
Denmark 1,06 2,60
Australia 1,08 2,67
Sweden 1,17 2,67
UK 1,19 2,69
Belgium 1,22 2,71
Finland 1,25 2,69
Japan 1,32 2,83
Germany 1,36 2,77
France 1,42 2,84
Bahrain 1,44 3,02
Spain 1,71 3,05
Greece 1,79 3,08
Italy 1,82 3,05
Slovenia 2,18 3,20
Israel 2,21 3,21
Cyprus 2,42 3,27
New Zeland 2,49 3,26
Korea 2,52 3,35
Czech Rep 2,64 3,45
Oman 2,65 3,61
Malta 2,66 3,59
Saudi Arabia 2,75 3,74
Portugal 2,89 3,64
Slovakia 2,91 3,72
Estonia 3,17 3,82
Hungary 3,22 3,84
Lithuania 3,27 3,93
Latvia 3,34 4,01
Trinidad&Tobago 3,38 3,99
Poland 3,54 3,98
Croatia 3,67 4,10
Russia 3,76 4,23
Argentina 3,85 4,18
Chile 3,89 4,16
Mexico 3,94 4,26
Malaysia 3,97 4,32
Libya 3,98 4,28
Uruguay 3,98 4,31
Romania 4,06 4,41
Bulgaria 4,14 4,40
Turkey 4,18 4,46
Botswana 4,23 4,53
Venezuela 4,27 4,45
Mauritius 4,43 4,47
Costa Rica 4,45 4,44
Panama 4,45 4,50
Macedonia 4,54 4,65
Kazakhstan 4,54 4,52
Brazil 4,55 4,58
Colombia 4,57 4,72
Peru 4,61 4,75
Dominican Rep 4,65 4,74
Bosnia 4,67 4,73
Ukraine 4,86 4,77
Azerbaijan 4,86 4,80
Ecuador 4,90 4,82
Albania 4,97 4,79
South Africa 4,99 4,92
Jamaica 5,05 4,89
China 5,05 4,90
Algeria 5,07 4,95
Armenia 5,10 4,93
Jordan 5,20 4,95
Georgia 5,23 5,01
El Salvador 5,26 5,00
Paraguay 5,34 5,02
Egypt 5,36 5,08
Sri Lanka 5,39 5,07
Philippines 5,40 5,06
Syria 5,43 5,11
Indonesia 5,47 5,14
Guatemala 5,50 5,19
Honduras 5,51 5,20
Bolivia 5,52 5,21
Vietnam 5,56 5,20
Mongolia 5,62 5,24
Namibia 5,64 5,26
Moldovia 5,71 5,24
Nicaragua 5,71 5,26
Morocco 5,82 5,34
Kyrgyztan 5,88 5,33
Tajikistan 5,96 5,41
India 6,00 5,51
Cambodia 6,13 5,62
Pakistan 6,27 5,71
Lesotho 6,45 5,80
Mauritania 6,46 5,75
Bangladesh 6,51 5,80
Cameroon 6,58 5,80
Nepal 6,58 5,86
Kenya 6,64 5,86
Madagaskar 6,72 5,87
Zimbabwe 6,77 5,87
Gambia 6,80 5,94
Senegal 6,81 5,93
Uganda 6,82 5,94
Nigeria 6,85 6,00
Zambia 6,85 6,15
Tanzania 6,88 6,05
Benin 6,91 6,13
Ethiopia 6,98 6,27
Chad 7,02 6,29
Mozambique 7,17 6,34
Mali 7,32 6,35
Burkina Faso 7,84 6,37
Source: own estimation

14
According to the results above, the ‘average digital divide’ – average distance of a country
from the reference country – is about 4,11, and the ‘average development divide’ – at about
4,35. Having in mind all these estimates it seems to be obvious overcoming digital divides becomes one of the most urgent problems that must be solved as soon as possible. We all
know that specific characteristics of new information and communication technologies make
possible to develop and spread them rapidly. Also no one would argue that is in short time
perspective it causes great divides among countries, while one of them are these which
create ICTs and the rest – in that case the great majority of them – is lagging behind. That
lagging behind usually means that a country is not adopting new ICTs as fast as the rest does. No matter how much we would discuss the issues of digital and development divide, the question of their magnitude is not so important as the one ‘how to bridge it’. Bridging
different divides is reasonable for number of reasons and does need to be justified as such.
Conclusions
The problem of existing digital divide is widely recognized as an international issue. In the paper above we have discussed the problem of existing digital divides. As we know the very
problem can be approached both from global and social perspective. When one says about
global digital divide – usually a divide among nations is taken into account, and secondly
when one says about social divide – usually he thinks about divide within nations. The
problem of social divide has not been discussed here and it is a one of rather different kind. Global digital divide appears mostly because of difficulties that poor and underdeveloped
countries have with acquiring new information and communication technologies. These
difficulties are a simple consequence of relatively small number of persons who can afford to
buy computers and ICT`s services, overall low level of skills, illiteracy, income poverty,
relatively high cost of access. Is it necessary to close the divide? The answer is YES of course
– but it does not have to mean it is easy to accomplish. Firstly it is so important because intuitively we know that digital divide and economic divide these two they go hand-in-hand.
Also it widely thought that developing ICTs infrastructure in a country could help to foster
economic and social development significantly. In fact, by closing the gap we could also help
these unprivileged countries to reduce poverty, create jobs and opportunities for better life.
One thought is broadly accepted, that the very digital divide is rather a cause of a much larger and complex problem which is a development divide among nations. Now, after years
of dynamic and fast growth of use of new information and communication technologies,
even widespread access to technology will not solve all problems that some underdeveloped
countries have to cope with. But, at the same time, it is sure that widespread access to ICTs
can finally lead to economic and social changes. Although we do not really know if even
access and fully participative usage of ICTs could guarantee that there would be no digital gap between nation, it is quite clear and sure that even relatively ‘little’ access and use of
the Internet brings many benefits to its users. ICTs potential is definitely not fully explored
yet, but one can say that even when access to it is so uneven and even if the gap is widening, these nations which are lagging behind they still have a great ‘thing’ to gain using
the Internet.
References: Beardshaw, J. (1992), Economics. A student`s guide, London: Pitman.
Chen, W. and B. Wellman (2004), ‘The global Digital divide – within and between countries’, IT&Society, (7), https://www.wiki.ed.ac.uk/, 2009.
Fighting Climate Change. Human solidarity in a divided world. HDR 2007/2008, UNDP
2009, http://www.un.org. accessed on 5 May 2009. Gester, R. and S. Zimmermann, Information and communication Technologies for poverty reduction: discussion paper, Swiss Agency of Cooperation & Development, 2003,
www.gersterconsulting.ch/docs/Synthesis_report.pdf, accessed on 3 June 2009. Hargittai, E. (2009), The Digital divide and what to do about it,
http://www.eszter.com/research/pubs/hargittai-digitaldivide.pdf, accessed on 6 May 2009. Haslam. P.A., J. Schafer and P. Beaudet (2009), Introduction to International Development,
Canada: Oxford University Press. Human Development Report 2005, http://www.un.org, accessed on 6 May 2009
Koop, G. (2009), Analysis of Economic Data, Wiley.

15
Measuring the Information Society, Information Telecommunication Union 2009,
http://www.itu.int, accessed on 15 Feb 2008. Meier, G.M. and J.E. Rauch (2005), Leading Issues in Economic Development, Oxford: Oxford
University Press. Samuelson, P.A. and W.D. Nordhaus (1995), Economics, International Edition: McGraw-Hill
Inc. Selhofer H. and T. Husing (2002), The Digital Divide Index – a measure of social inequalities in the adoption of ICTs,
http://www.empirica.com/publikationen/documents/Huesing_Selhofer_DDIX_2002.pdf
accessed on 6 May 2009. Servon, J.L. (2002), Bridging the Digital Divide, Oxford: Blackwell Publishing.
Spence, R. (2005), ICTs, Internet, Development and poverty reduction, 2005,
http:www.developmentgateway.org, accessed on 6 Jan 2007. Stoneman, P. (2002), The Economics of Technological Diffusion, Oxford: Blackwell Publishers.
Tichenor, P., C.O`Lien and G. Donohue (1970), ‘Mass media flow and differential growth in knowledge’, Public Opinion Quarterly, 34, accessed on 10 Feb 2009
http://poq.oxfordjournals.org/cgi/content/summary/34/2/159, 2009. The Global Information Technology Report 2008-2009, World Economic Forum 2009;
accessed on 8 Jan 2009. The Global Information Society: a statistical view, United Nation Publication 2008
Torero, M. and J. Von Braun (2006), ICTs for the poor, International Food Policy Research
Institute, http://www.ifpri.org, accessed on 11 Oct 2008. World Information Society Report 2007, Information Telecommunication Union 2007,
http://www.itu.int, accessed on 15 Feb 2008. World Information Society Report 2006, Information Telecommunication Union 2006,
http://www.itu.int, accessed on 15 Feb 2008. Yang, X. (2003), Economic Development and the Division of Labor, Oxford: Blackwell
Publishing.

16
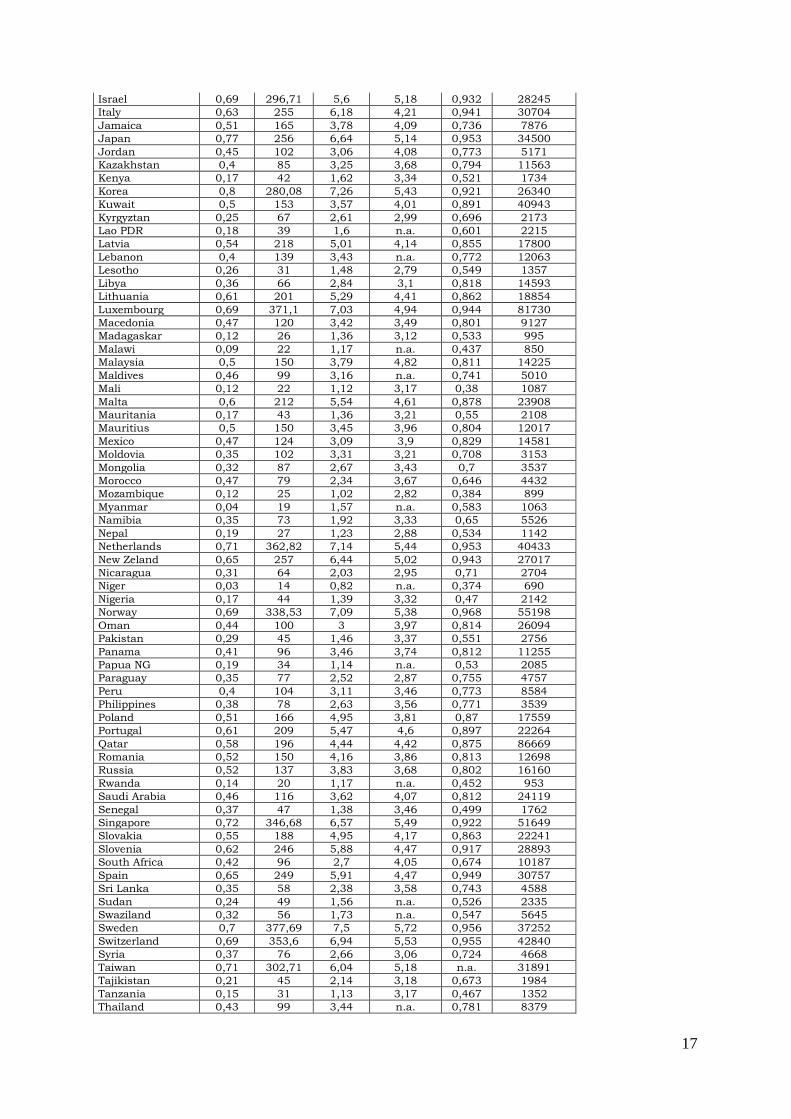
Appendix:
Table 3A DOI, ICT-OI, IDI, NRI, HDI and GDP PPP per capita values for different countries. Latest estimates – 2009.
Country DOI ICT-OI IDI NRI HDI
GDP PPP per capita
Albania 0,37 79 2,73 3,06 0,801 6797
Algeria 0,42 75 2,51 3,38 0,733 6927
Argentina 0,51 140 4,12 3,59 0,869 14354
Armenia 0,33 87 3,12 3,1 0,775 5436
Australia 0,65 322,73 6,58 5,28 0,962 37478
Austria 0,67 305,6 6,32 5,22 0,948 39647
Azerbaijan 0,38 83 2,71 3,72 0,746 8958
Bahrain 0,6 182 4,69 4,13 0,866 33988
Bangladesh 0,25 31 1,26 2,65 0,547 1408
Belarus 0,45 120 3,76 n.a. 0,804 12344
Belgium 0,65 324,21 6,14 4,92 0,946 36322
Benin 0,19 35 1,28 3,01 0,437 1610
Bhutan 0,22 55 1,63 n.a. 0,579 5239
Bolivia 0,33 73 2,45 3,05 0,695 4332
Bosnia 0,48 113 3,54 3,22 0,803 7618
Botswana 0,38 66 2,1 3,59 0,654 17947
Brazil 0,48 136 3,48 3,87 0,8 10298
Brunei 0,56 156 4,8 n.a. 0,894 50595
Bulgaria 0,54 123 4,37 3,71 0,824 12372
Burkina Faso 0,14 19 0,97 3,12 0,37 1259
Cambodia 0,18 28 1,53 2,96 0,598 1954
Cameroon 0,24 39 1,46 2,89 0,532 2160
Canada 0,67 337,16 6,34 5,3 0,961 39338
Chad 0,04 13 0,83 2,4 0,388 1670
Chile 0,57 157 4 4,35 0,867 14688
China 0,45 109 3,11 3,9 0,777 5943
Colombia 0,45 105 3,25 3,71 0,791 8336
Comoros 0,17 28 1,17 n.a. 0,561 1149
Congo 0,17 30 1,37 n.a. 0,548 4044
Congo DR 0,08 12 0,95 n.a. 0,411 340
Costa Rica 0,46 130 3,41 3,87 0,846 10832
Cote d`Ivoire 0,2 39 1,41 n.a. 0,432 1800
Croatia 0,53 176 4,68 4,06 0,85 16474
Cuba 0,28 55 2,53 n.a. 0,838 n.a.
Cyprus 0,57 221 4,97 4,23 0,903 28380
Czech Rep 0,57 202 4,88 4,33 0,891 25754
Denmark 0,76 360,79 7,22 5,78 0,949 38207
Dominican Rep 0,42 94 2,65 3,66 0,779 8558
Ecuador 0,4 96 2,75 3,09 0,772 7518
Egypt 0,41 78 2,54 3,74 0,708 5904
El Salvador 0,4 95 2,43 3,72 0,735 6052
Eritrea 0,07 27 1 n.a. 0,483 747
Estonia 0,65 269,81 5,97 5,12 0,86 20753
Ethiopia 0,1 17 1,03 2,77 0,406 871
Fiji 0,39 92 2,73 n.a. 0,762 4443
Finland 0,69 293,51 6,79 5,47 0,952 36843
France 0,64 278,34 6,16 5,11 0,952 34261
Gabon 0,37 68 2,14 n.a. 0,677 14746
Gambia 0,21 43 1,49 3,17 0,502 1384
Georgia 0,41 90 2,91 3,34 0,754 5001
Germany 0,66 303,42 6,61 5,19 0,935 35551
Ghana 0,21 40 1,63 n.a. 0,553 1513
Greece 0,53 162 5,25 3,94 0,926 30661
Guatemala 0,37 72 2,28 3,58 0,689 4899
Guinea Bissau 0,04 27 0,9 n.a. 0,374 496
Haiti 0,15 40 1,27 n.a. 0,529 1329
Honduras 0,27 63 2,28 3,35 0,7 4261
Hong Kong 0,7 365,54 6,7 5,31 0,937 44412
Hungary 0,59 192 5,19 4,28 0,874 19829
Iceland 0,74 340,57 7,14 5,44 0,968 39664
India 0,31 53 1,59 4,06 0,619 2786
Indonesia 0,34 67 2,13 3,6 0,728 3990
Iran 0,37 89 2,94 n.a. 0,759 11209
Ireland 0,61 286,32 6,37 5,02 0,959 42779
17
Israel 0,69 296,71 5,6 5,18 0,932 28245
Italy 0,63 255 6,18 4,21 0,941 30704
Jamaica 0,51 165 3,78 4,09 0,736 7876
Japan 0,77 256 6,64 5,14 0,953 34500
Jordan 0,45 102 3,06 4,08 0,773 5171
Kazakhstan 0,4 85 3,25 3,68 0,794 11563
Kenya 0,17 42 1,62 3,34 0,521 1734
Korea 0,8 280,08 7,26 5,43 0,921 26340
Kuwait 0,5 153 3,57 4,01 0,891 40943
Kyrgyztan 0,25 67 2,61 2,99 0,696 2173
Lao PDR 0,18 39 1,6 n.a. 0,601 2215
Latvia 0,54 218 5,01 4,14 0,855 17800
Lebanon 0,4 139 3,43 n.a. 0,772 12063
Lesotho 0,26 31 1,48 2,79 0,549 1357
Libya 0,36 66 2,84 3,1 0,818 14593
Lithuania 0,61 201 5,29 4,41 0,862 18854
Luxembourg 0,69 371,1 7,03 4,94 0,944 81730
Macedonia 0,47 120 3,42 3,49 0,801 9127
Madagaskar 0,12 26 1,36 3,12 0,533 995
Malawi 0,09 22 1,17 n.a. 0,437 850
Malaysia 0,5 150 3,79 4,82 0,811 14225
Maldives 0,46 99 3,16 n.a. 0,741 5010
Mali 0,12 22 1,12 3,17 0,38 1087
Malta 0,6 212 5,54 4,61 0,878 23908
Mauritania 0,17 43 1,36 3,21 0,55 2108
Mauritius 0,5 150 3,45 3,96 0,804 12017
Mexico 0,47 124 3,09 3,9 0,829 14581
Moldovia 0,35 102 3,31 3,21 0,708 3153
Mongolia 0,32 87 2,67 3,43 0,7 3537
Morocco 0,47 79 2,34 3,67 0,646 4432
Mozambique 0,12 25 1,02 2,82 0,384 899
Myanmar 0,04 19 1,57 n.a. 0,583 1063
Namibia 0,35 73 1,92 3,33 0,65 5526
Nepal 0,19 27 1,23 2,88 0,534 1142
Netherlands 0,71 362,82 7,14 5,44 0,953 40433
New Zeland 0,65 257 6,44 5,02 0,943 27017
Nicaragua 0,31 64 2,03 2,95 0,71 2704
Niger 0,03 14 0,82 n.a. 0,374 690
Nigeria 0,17 44 1,39 3,32 0,47 2142
Norway 0,69 338,53 7,09 5,38 0,968 55198
Oman 0,44 100 3 3,97 0,814 26094
Pakistan 0,29 45 1,46 3,37 0,551 2756
Panama 0,41 96 3,46 3,74 0,812 11255
Papua NG 0,19 34 1,14 n.a. 0,53 2085
Paraguay 0,35 77 2,52 2,87 0,755 4757
Peru 0,4 104 3,11 3,46 0,773 8584
Philippines 0,38 78 2,63 3,56 0,771 3539
Poland 0,51 166 4,95 3,81 0,87 17559
Portugal 0,61 209 5,47 4,6 0,897 22264
Qatar 0,58 196 4,44 4,42 0,875 86669
Romania 0,52 150 4,16 3,86 0,813 12698
Russia 0,52 137 3,83 3,68 0,802 16160
Rwanda 0,14 20 1,17 n.a. 0,452 953
Saudi Arabia 0,46 116 3,62 4,07 0,812 24119
Senegal 0,37 47 1,38 3,46 0,499 1762
Singapore 0,72 346,68 6,57 5,49 0,922 51649
Slovakia 0,55 188 4,95 4,17 0,863 22241
Slovenia 0,62 246 5,88 4,47 0,917 28893
South Africa 0,42 96 2,7 4,05 0,674 10187
Spain 0,65 249 5,91 4,47 0,949 30757
Sri Lanka 0,35 58 2,38 3,58 0,743 4588
Sudan 0,24 49 1,56 n.a. 0,526 2335
Swaziland 0,32 56 1,73 n.a. 0,547 5645
Sweden 0,7 377,69 7,5 5,72 0,956 37252
Switzerland 0,69 353,6 6,94 5,53 0,955 42840
Syria 0,37 76 2,66 3,06 0,724 4668
Taiwan 0,71 302,71 6,04 5,18 n.a. 31891
Tajikistan 0,21 45 2,14 3,18 0,673 1984
Tanzania 0,15 31 1,13 3,17 0,467 1352
Thailand 0,43 99 3,44 n.a. 0,781 8379

18
Togo 0,17 45 1,26 n.a. 0,512 824
Trinidad&Tobago 0,5 127 3,61 3,55 0,814 19686
Tunisia 0,41 95 2,73 n.a. 0,766 8020
Turkey 0,52 128 3,49 3,96 0,775 13447
Turkmenistan 0,22 53 2,23 n.a. 0,713 5765
UAE 0,59 190 5,29 4,55 0,868 39076
Uganda 0,16 29 1,21 3,06 0,505 1147
UK 0,69 346,37 6,78 5,3 0,946 36570
Ukraine 0,41 102 3,8 3,69 0,788 7633
Uruguay 0,48 143 3,88 3,72 0,852 12707
USA 0,66 323,85 6,44 5,49 0,951 47025
Uzbekistan 0,31 58 2,05 n.a. 0,702 2606
Venezuela 0,46 114 3,34 3,44 0,792 12933
Vietnam 0,29 76 2,61 3,67 0,733 2774
Yemen 0,28 46 1,47 n.a. 0,508 2404
Zambia 0,14 38 1,39 3,02 0,434 1397
Zimbabwe 0,16 60 1,46 2,5 0,513 2038
source: own compilation based data from http://www.un.org and http://www.itu.int, 2009.