municipal early years and youth plan 2014 to 2018 … · youth plan 2014 to 2018 appendix 1 –...
TRANSCRIPT

Funded by Whitehorse Council. Prepared by the Whitehorse MEYP and MYP Reference Groups.
Municipal Early Years and Youth Plan 2014 to 2018 Appendix 1 – Demographics

Municipal Early Years and Youth Plan Demographics - 2014-2018 Pg. 1
YOUTH AND EARLY YEARS STATISTICS 2013
Contents General Information ........................................................................................................................... 2
Forecasts ............................................................................................................................................. 2
Demographic information, 2011......................................................................................................... 3
Under 24s ............................................................................................................................................ 4
Family type and housing ..................................................................................................................... 5
Migration in and out of the City.......................................................................................................... 6
Housing ............................................................................................................................................... 7
Employment ........................................................................................................................................ 8
Change in employment between 2006 and 2011............................................................................... 9
Industries ............................................................................................................................................ 9
Occupations ...................................................................................................................................... 10
Income .............................................................................................................................................. 10
Unpaid work...................................................................................................................................... 11
Education .......................................................................................................................................... 11
Youth and education......................................................................................................................... 12
Total number of under 24s ............................................................................................................... 12
Early Years 0 – 4 year olds................................................................................................................. 13
Middle Years 5 – 11 year olds ........................................................................................................... 14
Secondary Schoolers 12 – 17 year olds............................................................................................. 14
18 – 24 year olds ............................................................................................................................... 15
Health data........................................................................................................................................ 15
Health behaviours ............................................................................................................................. 16
References ........................................................................................................................................ 17
Appendix 1 ........................................................................................................................................ 18 Additional Supporting Statistics

Municipal Early Years and Youth Plan Demographics - 2014-2018 Pg. 2
General Information
As of June 2012, there was an estimated resident population of 159,133. The City of Whitehorse has a lower proportion of pre-schoolers and higher proportion of people at post retirement age than Greater Melbourne. The City of Whitehorse is located 12 -22km East of Melbourne CBD. The major features of the city include the large technology precinct in the Tally Ho area, the Melbourne campus of Deakin University, Box Hill TAFE, Box Hill Hospital. The three major activity centres are Box Hill, Forest Hill Chase and the Nunawading mega mile. Nunawading also has several smaller neighbourhood shopping centres scattered around the municipality.
The areas attract a range of ages to the municipality, and although local government boundaries are often irrelevant to young people, they are hubs for recreational and educational activity for the city.
Key findings:
• Whitehorse has a lower proportion of pre-schoolers and a higher proportion of people at post retirement age than greater Melbourne.
• Box Hill TAFE and Deakin University invite a high proportion of 18 – 24 year olds into the municipality, in particular for Box Hill and Burwood.
• There is a large proportion of international students in the municipality, and it is likely they are from predominantly Asian backgrounds.
• Most children aged 0 - 4 (make up 5.8% of the population, at 8,829 people) are found in Mitcham, followed by Nunawading and Blackburn.
• Most children aged 5 – 11 (which make up 8.1% of the population, at 12,255) are found in Mitcham, closely followed by Blackburn and Nunawading.
• Those aged 12 – 17 (which make up 6.8% of the population, at 10,256) are found in Vermont South, Blackburn and Mitcham.
• The indigenous population of 314 (0.22%) of the population. 0 – 4 year olds make up 11%, 5 – 14 years make up 17% and 15 – 24 make up the 17% of that indigenous population group.
Forecasts
By 2031 it is expected that the population as a whole will increase, however this is likely to occur in the older age groups rather than the younger groups. The age group which is forecast to have the largest proportional increase (relative to its population size) by 2021 is 85 year olds and over, who are forecast to increase by 46.5% to 5,001 persons.
As described above, different areas within the City of Whitehorse have different functions based on both area of development and proximity to education and employment opportunities. Box Hill, Box Hill North, Box Hill South, Burwood, and to a lesser extent, Nunawading and Mitcham attract large numbers of young adults based on the location of tertiary education institutions and access to employment. Mont Albert, Mont Albert North and Surrey Hills are attractive areas for mature families, while Vermont, Vermont South and Burwood East are expected to experience a net migration loss in the early part of the forecast period as children leave home to establish new households elsewhere. The variety of function and role of the small areas in the City of Whitehorse means that population outcomes differ significantly across the LGA.
• The 20 – 24 year olds as percentage of the population (8.4% to 7%) will drop the most (by
1,929 persons over the next 20 years); again this is likely due to the higher percentage of older population groups.
• The largest increase is forecast to be in Group households, which will increase by 599 households, comprising 4.5% of all households, compared to 3.9% in 2006.

Municipal Early Years and Youth Plan Demographics - 2014-2018 Pg. 3
Num
ber o
f peo
ple
• In contrast Couple families with dependents are forecast to increase by 201 households, to comprise 30.3% of all households in 2021, compared to 33.1% in 2006.
2006
2011
2016
2021
2026
2031
2036
Population
150,532
157,740
167,699
173,194
177,538
181,567
185,970
Average annual % change
0.5%
0.9%
1.2%
0.6%
0.5%
0.4%
0.5%
Households
58,024
59,915
63,877
66,396
68,442
70,331
72,256
Change in households (5yrs)
--
1,892
3,962
2,518
2,046
1,889
1,925
Average h/hold size
2.55
2.59
2.58
2.56
2.55
2.54
2.53
16,000
14,000
2011 2036
12,000
10,000
8,000
6,000
4,000
2,000
0
Demographic information, 2011
F i g u r e 1: t o t a l r e s i d e n t s f o r W h i t e h o r s e
Age group
2011 2006 Change
Number % Greater Melbourne
Number % Greater Melbourne
2006 - 2011
0 to 4 8,829 5.8 6.5 8,989 6.2 6.3 -160
5 to 9 8,781 5.8 6.0 8,537 5.9 6.3 +244 10 to 14 8,529 5.6 5.9 7,804 5.4 6.4 +725
15 to 19 9,180 6.1 6.3 8,913 6.2 6.7 +267 20 to 24 11,970 7.9 7.5 10,105 7.0 7.4 +1,865 25 to 29 10,318 6.8 7.9 8,712 6.0 7.1 +1,606 30 to 34 9,389 6.2 7.5 10,333 7.1 7.7 -944
35 to 39 10,570 7.0 7.5 11,339 7.8 7.9 -769 40 to 44 11,274 7.4 7.5 10,436 7.2 7.5 +838
45 to 49 10,288 6.8 6.9 10,028 6.9 7.2 +260 50 to 54 9,697 6.4 6.4 8,995 6.2 6.4 +702 55 to 59 8,429 5.6 5.6 8,403 5.8 5.9 +26

Municipal Early Years and Youth Plan Demographics - 2014-2018 Pg. 4
60 to 64 7,873 5.2 5.1 7,183 5.0 4.5 +690
65 to 69 6,577 4.3 3.9 6,241 4.3 3.6 +336 70 to 74 5,809 3.8 3.0 5,664 3.9 3.0 +145 75 to 79 5,091 3.4 2.4 5,397 3.7 2.6 -306 80 to 84 4,457 2.9 2.0 4,227 2.9 2.0 +230
85 and over 4,277 2.8 1.8 3,461 2.4 1.6 +816 Total 151,338 100.0 100.0 144,767 100.0 100.0 +6,571
F i g u r e 2 : A g e t r e n d s 2 0 0 6 - 2 0 1 1 , a l l a g e g r o u p s
25,000
20,000
2011 2006
15,000
10,000
5,000
0 0-4 5-9 10-14 15-19 20-24 25-29 30-34 35-39 40-44 45-49 50-54 55-59 60-64 65-69 70-74 75-79 80+
Under 24s
In 2011, there were a total of 47,152 people aged 0 to 24 in the municipality, making up 31% of the total population. See figure 3 for the breakdown by number and percentage of the age groups. See figure 4 for the breakdown by suburb.
F i g u r e 3 : T o t a l n u m b e r o f y o u n g p e o p l e i n W h i t e h o r s e
Total Number % of Whitehorse residents
0-4 8,803 5.81 5-11 12,327 8.14
12-17 10,183 6.72
18-24 15,839 10.46
F i g u r e 4 : U n d e r 2 4 s b y s u b u r b
0-4 5-11 12-17 18-24 Total Blackburn 756 1146 917 1138 3957 Mont Albert 248 378 402 551 1579 Mitcham 1083 1308 899 1050 4340 Forest Hill 583 806 658 760 2807 Burwood East 483 663 654 1256 3056 Burwood 473 736 669 2260 4138 Box Hill South 473 685 498 848 2504 Box Hill North 660 904 693 1106 3363 Box Hill 384 557 499 1780 3220 Blackburn South 683 910 706 832 3131 Blackburn North 535 683 534 511 2263 Mont Albert North 341 424 417 486 1668 Nunawading 760 905 622 894 3181

Municipal Early Years and Youth Plan Demographics - 2014-2018 Pg. 5
Surrey Hills 313 437 373 556 1679 Vermont 544 916 663 705 2828 Vermont South 484 869 979 1106 3438 total 8,803 12,327 10,183 15,839 47,152
Family type and housing
In 2011, the total number of households in Whitehorse was 57,207. See figure 5 for the household types.
• The median age for the City of Whitehorse is 39 years. • Households with children make up 43% of the population in Whitehorse, 34% of these are
couples with children. This ratio is the same as the Greater Melbourne average. • Of these couple households, most (18%) are couples with young children aged less than 15
years. Single parents are more likely to have older children aged over 15 years at 6.3%.
F i g u r e 5 : H o u s e h o l d t y p e s i n t h e C i t y o f W h i t e h o r s e
Other not classifiable household
2%
Visitor only households
1%
Lone person
24%
Couples with children
34%
Group household 4%
Other families
1%
One parent families 10%
Couples without children
24%
Between 2006 and 2011, the number of households with children increased by 1,020 households or 4.3%. The total number of couples with children increased by 759 households, whilst the total number of single parents with children increased by 269 households. The breakdown can be seen in the figure 6, below.
Birth notifications were 1,814 in 2011 and increased only slightly to 1,889 in 2011/12.
F i g u r e 6 : C h a n g e f r o m 2 0 0 6 t o 2 0 1 1 p a r e n t s w i t h c h i l d r e n
+543
+83 +133
+391
with young children
with mixed- age children
with older children
-117 with
young children
-13 with mixed- age children
with older children
Couples Single parents

Municipal Early Years and Youth Plan Demographics - 2014-2018 Pg. 6
Migration in and out of the City
Migration, or residential mobility, together with births and deaths are significant components of population change. The movement of people into, and out of an area directly influences the characteristics of the population and the demand for services and facilities. Migration is the most volatile component of population change and can be affected by changing housing and economic opportunities such as housing affordability issues or the mining boom.
There are three main types of migration in Australia, overseas migration, between-state migration, and within-state migration. By far the most common form of migration is within-state, and largely involves moves between neighbouring and existing urban areas where moves are often short.
The City of Whitehorse has experienced a strong growth in population born from China. Its population almost doubled between 2006 and 2011. While most young people in Whitehorse were born in Australia; China and India are the most common places of birth for those born outside of Australia and in those aged under 24, they tend to be in the ages between 15 and 24. This trend generally reflects the high numbers of international students attending tertiary institutions in the municipality.
F i g u r e 7 : P l a c e o f b i r t h f o r u n d e r 2 4 y e a r o l d s
0-14 15 – 24 Australia 22,833 13,234 China (excludes SARs and Taiwan) 415 3,125 India 208 492 Malaysia 201 457 Hong Kong (SAR of China) 75 444 Sri Lanka 63 220 Vietnam 22 206 New Zealand 244 206 England 263 194 Indonesia 34 178
Most people who moved into the municipality by far, came from overseas at 13, 581 persons. Next they came from Boroondara, outside of Victoria, Monash and Manningham. Most people who moved out of the municipality moved to Maroondah, Boroondara, Knox, Manningham and Monash. In terms of young people, they represent the highest mobility across the age groups as can be seen in figure 9. The total numbers can be seen in figure 10.
F i g u r e 9 : P l a c e o f b i r t h f o r u n d e r 2 4 y e a r o l d s
20.8 17.5
26.6
12.0
49.5
25.4
59.5
49.7
55.6
46.9
37.9
32.0
25.2
21.5
15.6 19.0
15.5 13.9
% Moved in: Whitehorse % Moved out: Whitehorse
13.4 13.2 11.2 12.2
8.5 9.6

Municipal Early Years and Youth Plan Demographics - 2014-2018 Pg. 7
F i g u r e 10 : N u m b e r w h o m o v e d i n c om p a r e d t o t h o s e w h o m o v e d o u t 2 0 0 6 - 2 0 1 1
Age Number Moved In Number moved Out
0 to 14 5,448.8 4,576.6
15-19 2,439.6 1,103.5
20-24 5,919.6 3,040.3
25-29 6,141.4 5,134.7
30-34 5,219.7 4,405.0
When comparing Whitehorse to the neighbouring municipalities, the difference in relation migration in and out of the city is quite obvious. Whilst the City of Whitehorse has many 20 to 24 year olds coming to the area, Monash showed a 60% more migration in this age group. For those aged 0 to 14 year olds, Whitehorse had 25% less net migration than Boroondara. Boroondara may be receiving a lot of youths due to their educational facilities in the area, whilst Monash also receives a lot of tertiary students due to their tertiary institution, Monash being in that municipality. The other age groups seem to maintain relatively stable in the different age groups. See figure 11.
F i g u r e 1 1 : N e t m i g r a t i o n c o m p a r i s o n s W h i t e h o r s e a n d n e i g h b o u r i n g c o u n c i l s 2 0 0 6 - 2 0 1 1
6,000
5,000
4,000
3,000
3,585
4,861
2,879
Whitehorse Boroondara Monash Maroondah
2,000
1,000
0
872
1,336
1,007 815 631
415
351
149 -16 -73 -276
-1,000
0 to 14 15-19 20-24 25-29 30-34 35-39 40-44 45-49 50-54 55-59 60-64 65+
Housing
Mortgage repayments are directly related to house prices in the City of Whitehorse, length of occupancy and the level of equity of home owners. When viewed with Household Income data it may also indicate the level of housing stress households in the community are under. Despite less than the Greater Melbourne average 31% - 35% (17,995) of those living in Whitehorse have mortgages. 28% of those households with a mortgage, were making high loan repayments of $2,600 or more per month. See figure 12.
F i g u r e 12 : P e r c e n t a g e a n d t o t a l m o r t g a g e r e p a y m e n t s p e r m o n t h
$5000 and over
$4000-$4999
$3000-$3999
$2000-$2999
$1000-$1999
$1-$999
3% 4.3%
13%
14.8%
27%
30%

Municipal Early Years and Youth Plan Demographics - 2014-2018 Pg. 8
• Most people (57%) have monthly repayments of between $1,000 and $3,000 per month. • Slightly less (24%) people in the City of Whitehorse rent than the Melbourne average of 26%. • Unemployment (5%) is slightly less than the average for Melbourne (6%). • Density for Whitehorse is 24.77 persons per hectare which is slightly less than the City of
Boroondara (28.1) and slightly more than the City of Monash (22.14), Maroondah (17.58), Manningham (10.34) and Knox (13.54).
• 73% of homes have a broadband internet connection, slightly higher than the Greater Melbourne area (at 70%).
Non-residential forms of housing
Number Percentage Hotel, motel, bed and breakfast 337 9 Nurses' quarters 0 0 Staff quarters 0 0 Boarding house, private hotel 162 4 Boarding school 117 3 Residential college/hall of residence 295 8 Public hospital (not psychiatric) 405 11 Private hospital (not psychiatric) 247 7 Psychiatric hospital or institution 62 2 Hostel for the disabled 206 6 Nursing home 1,176 32 Accommodation for retired/aged 517 14 Homeless hostel/night shelter/refuge 19 1 Childcare institution 5 0 Corrective institution for children 0 0 Other welfare institution 115 3 Prison, corrective inst. for adults 5 0 Immigration detention centre 0 0 Convent, monastery, etc. 34 1 Other and non-classifiable 28 1 Total in Non-Private Dwellings 3,730 100
Employment
In the 2011 census, the size of the City of Whitehorse’s labour force was 75,308, of which 27,124 were employed part-time and 42,918 were full time workers. Of the 61,432 people who work in the City of Whitehorse, 17,807 or 29% also live in the area. Understanding where workers reside assists in planning and advocacy for roads and public transport provision. This can be useful in relation to families, as it helps understand how far residents commute to work, can also help to analyse whether people spend much time parents may spend commuting or away from home before and after school hours.
The labour force participation rate refers to the proportion of the population over 15 years of age that are either employed or actively looking for work. In Whitehorse, 60% of residents identified as being in the workforce, which is less than for Greater Melbourne at 63%. It is likely this is linked with the age structure of the municipality, which includes a larger population aged 60 and over. Analysis of the employment status (as a percentage of the labour force) in the City of Whitehorse in 2011

Municipal Early Years and Youth Plan Demographics - 2014-2018 Pg. 9
compared to Greater Melbourne shows that there was a similar proportion in employment, as well as a similar proportion unemployed. See figure 13 for the percentages.
F i g u r e 13 : P e r c e n t a g e o f p o p u l a t i o n a n d e m p l o y m e n t S t a t u s , 2 0 1 1
Looking for part-time
work
Looking for full-time work
Hours worked not stated
Employed part-time
Employed full-time
2.4 3
3 2.5
2.1 2
Greater Melbourne Whitehorse
32.3 36
60 57
0 10 20 30 40 50 60 70
Change in employment between 2006 and 2011
Most of the 94.7% of the labour force was in either full or part time employment, while 5.3% were unemployed. 25% of residents also work within the City of Whitehorse. Whitehorse has a greater proportion of people in part time work (36%) and a smaller proportion in full time work (57%), relative to Greater Melbourne (33.8% employed part time and 59.6% full time). Whilst the number of people in employment in Whitehorse increased by 2,616 persons between 2006 and 2011, nearly all of the increase (99.8%) was in part time employment. See figure 14.
F i g u r e 1 4 : C h a n g e i n E m p l o y m e n t S t a t u s – C i t y o f W h i t e h o r s e ( n u m b e r ) 2 0 0 6 t o 2 0 1 1
Looking for part-time work Looking for full-time work
Unemployed Hours worked not stated
Employed part-time Employed full-time
Employed
- 198
+ 195 + 7
+ 499
+ 694
+ 2807
+ 2616
Industries
Industries can demonstrate the workforce capacity and economies which will enhance and support growth in the municipality as well as earning potential. The most popular industry sectors for the resident population in Whitehorse were in health care and social assistance, professional, scientific and technical services and retail trade. As with the rest of the Melbourne metropolitan area, the largest change in industry of employment has been in manufacturing. This has seen almost a 2% decrease from 2006 levels at 9.6% to 8%. All other industries have increased, in particular this has been seen in education and training, professional and technical services and health care and social assistance. See figure 15 for breakdown.
F i g u r e 1 5 : I n d u s t r i e s o f e m p l o y m e n t i n t h e C i t y o f W h i t e h o r s e 2 0 1 1 a n d 2 0 0 6
2011 2006 Change No. % No. %
Health Care and Social Assistance 9,072 12.7 8,114 11.8 +958 Professional, Scientific and Technical Services 7,869 11.0 6,906 10.1 +963 Retail Trade 7,476 10.5 7,742 11.3 -266 Education and Training 7,238 10.1 6,723 9.8 +515 Manufacturing 5,742 8.1 6,594 9.6 -852

Municipal Early Years and Youth Plan Demographics - 2014-2018 Pg. 10
Accommodation and Food Services 4,325 6.1 3,835 5.6 +490 Construction 4,252 6.0 3,937 5.7 +315 Financial and Insurance Services 3,941 5.5 3,906 5.7 +35 Wholesale trade 3,699 5.2 4,004 5.8 -305 Public Administration and Safety 3,643 5.1 3,600 5.2 +43 Other Services 2,672 3.7 2,578 3.8 +94 Administrative and Support Services 2,572 3.6 2,458 3.6 +114 Transport, Postal and Warehousing 2,138 3.0 2,003 2.9 +135 Information Media and Telecommunications 1,917 2.7 2,029 3.0 -112 Inadequately described or not stated 1,542 2.2 1,545 2.2 -3 Arts and Recreation Services 1,234 1.7 1,061 1.5 +173 Rental, Hiring and Real Estate Services 1,066 1.5 893 1.3 +173 Electricity, Gas, Water and Waste Services 655 0.9 530 0.8 +125 Mining 153 0.2 106 0.2 +47 Agriculture, Forestry and Fishing 114 0.2 143 0.2 -29 Total employed persons aged 15+ 71,320 100.0 68,707 100.0 +2,613
Occupations
The three most popular occupations of Whitehorse residents in 2011 were: • Professionals (30.8%), which increased by 2,026 people since 2006. • Clerical and administrative worker (15.4%), remained relatively the same from 2006. • Managers (13.1%) also remained stable from 2006
These three occupations accounted for nearly 60% of the employed resident population. Relative to Greater Melbourne, Whitehorse has a smaller percentage of persons employed as:
• Machinery Operators and drivers (3.0% compared to 5.9%) • Technicians and Trades Workers (11.1% compared to 13.4%) • Labourers (6.0% compared to 8.0%)
F i g u r e 1 6 : E m p l o y m e n t p e r c e n t a g e b y o c c u p a t i o n , G r e a t e r M e l b o u r n e c o m p a r i s o n , 2 0 1 1
Inadequately described
Labourers
Machinery Operators And Drivers
Sales Workers
Clerical and Administrative Workers
Community and Personal Service Workers
Technicians and Trades Workers
2.3
1.9
3.0
6.0
5.9
8.0
9.7 9.8
8.9 8.8
15.3 15.4
13.4
Greater Melbourne Whitehorse
Income
Professionals
Managers
11.1
12.5 13.1
24.1
30.8
Income quartiles allow for the comparison of relative income-earning capabilities over time. Compared to Greater Melbourne, Whitehorse had a similar portion of persons in the medium lowest as well as the highest income quartile. Whitehorse does have a greater proportion of people in the lowest income quartile which is likely due to the higher percentage of people in the municipality aged over 60 years. Between 2006 and 2011 the biggest growth occurred in the lowest income
Municipal Early Years and Youth Plan Demographics - 2014-2018 Pg. 11
quartile, which showed an increase of 3,661 persons. This may be linked to the municipality’s larger older populations (aged 60+) or the increase in student numbers across the same period.
F i g u r e 1 7 : I n e q u i t y i n I n c o m e s , i n d i v i d u a l i n c o m e q u a r t i l e s , 2 0 1 1
26.7
25.2 Whitehorse Greater Melbourne
27.6 27.1
23.2 23.0 22.4 24.7
Unpaid work
Lowest Medium lowest Medium highest Highest
The voluntary work sector is an important part of Australia's economy. The level of volunteering can indicate the cohesiveness of the community and how readily individuals are able to contribute to that community.
• At 21%, people in Whitehorse have a higher rate of volunteering than Greater Melbourne which is 16%.
• Whitehorse has a larger percentage of persons who did less than 5 hours of domestic work (71.5% compared to 68.8%) and a larger percentage of persons who did 30 hours or more of domestic work (12.3% compared to 10.9% for the Greater Melbourne area).
• There are also a larger percentage of persons who did between 15 and 29 hours of domestic work (25.9% compared to 24.9%)
• 14,163 Whitehorse residents were providing unpaid assistance (i.e. care) to a person with a disability, long term illness or old age living in the City of Whitehorse.
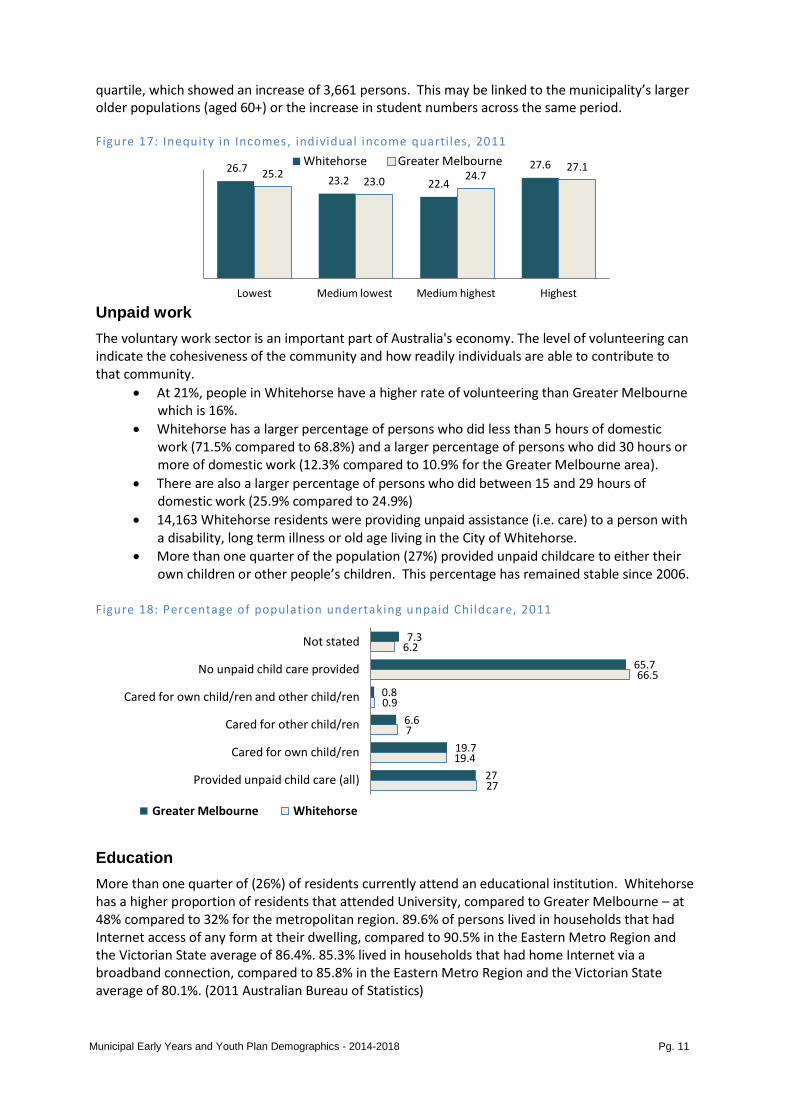
• More than one quarter of the population (27%) provided unpaid childcare to either their own children or other people’s children. This percentage has remained stable since 2006.
F i g u r e 1 8 : P e r c e n t a g e o f p o p u l a t i o n u n d e r t a k i n g u n p a i d C h i l d c a r e , 2 0 1 1
Not stated
No unpaid child care provided
Cared for own child/ren and other child/ren
Cared for other child/ren
Cared for own child/ren
Provided unpaid child care (all)
Greater Melbourne Whitehorse
0.8 0.9
7.3 6.2 6.6 7
19.7 19.4
27 27
65.7 66.5
Education
More than one quarter of (26%) of residents currently attend an educational institution. Whitehorse has a higher proportion of residents that attended University, compared to Greater Melbourne – at 48% compared to 32% for the metropolitan region. 89.6% of persons lived in households that had Internet access of any form at their dwelling, compared to 90.5% in the Eastern Metro Region and the Victorian State average of 86.4%. 85.3% lived in households that had home Internet via a broadband connection, compared to 85.8% in the Eastern Metro Region and the Victorian State average of 80.1%. (2011 Australian Bureau of Statistics)

Municipal Early Years and Youth Plan Demographics - 2014-2018 Pg. 12
F i g u r e 20 : P e r c e n t a g e o f p o p u l a t i o n c u r r e n t l y a t t e n d i n g a n E d u c a t i o n i n s t i t u t i o n , 2 0 1 1
University
TAFE
Secondary school
Primary school
Pre-school
1.7
2
2.2 2.2
5.3
6.3
6.2
7.6
7.6 7.5
Greater Melbourne Whitehorse Youth and education
Whitehorse has high proportion of students in education. • 95.6% of first year primary grade pupils who participated in pre-school in the year before
attending primary school. • 82.8% of 15-19 year-old school leavers were fully engaged in work or non-school study,
compared to 80.4% in the Eastern Metro Region and the Victorian State average of 71.9%. • Furthermore, 8% were disengaged, compared to 9.5% in the Eastern Metro Region and
the Victorian State average of 15.4%.
F i g u r e 21 : P a r t i c i p a t i o n r a t e s o f 2 0 – 2 4 y e a r o l d s i n T e r t i a r y e d u c a t i o n 100.0
50.0
0.0
32.6
48.9
8.4
Whitehorse Metro Melbourne
8.4
University TAFE
Total number of under 24s
• Most people under the age of 24 live in Mitcham with 4340, closely followed by Burwood (4138) and Blackburn with 3957 people aged under 24.
• The lowest number of people aged under 24 around found in Mont Albert North (1668), Mont Albert (1579) and Surrey Hills (1679).
• Most primary schoolers are found in Mitcham and Blackburn, whilst Box Hill, Mont Albert and Surrey Hills have less primary schoolers.
• Most secondary schoolers are found in Mitcham, Vermont South and Blackburn. • Most 18 - 24 year olds live in Burwood and Box Hill, which is reflective of the two tertiary
institutions found there.

Municipal Early Years and Youth Plan Demographics - 2014-2018 Pg. 13
Fig u r e 22 : P e r c e n t a g e o f p e o p l e a g e d u n d e r 2 4 p e r s u b u r b
0-4 5-11 12-17 18-24
7 11 9 8 10
18 7.6
21
12 7
12 7.6
6
11 9 8 7.4 9.7
7.2
10
6.7 5.2
6.3 6.5 6.2 6.5
6.5
9
8.5 8 6 7.3 7
8.5
8.6
9 8.6 8 9
6 8
7 6.5 8 8 8.6 10
7.6
6 7.6 6.5
4 6 6 4.4 5 6 7.3 5.3 6.3 7 6 5.7 4
Mitcham, Burwood and Blackburn have the highest number of people under the age of 24, while Mont Albert and Mont Albert North have the lowest number of youth under 24. As shown in figure 18, the largest percentage of residents aged under 24s are found in Burwood.
F i g u r e 23 : T o t a l n u m b e r o f p e o p l e a g e d u n d e r 2 4 p e r s u b u r b
3,957
2,263
3,131 3,220 3,363
2,504
4,138 3,056
2,807
4,340
1,579 1,668
3,181
1,679
2,828
3,438
Early Years 0 – 4 year olds
Mitcham has the highest number of children under the age of 4 (1,083), while Mont Albert has the lowest number of children under the age of 4 (341). As a percentage of the pulation as can be seen in figure 18, under four year olds, make up from 4% of the population in Vermont South and Box Hill, to Blackburn North (7.6%), Mitcham (7.3%) and Nunawading (7%) which all have hte highest parentage of 0 – 4 year olds.

Municipal Early Years and Youth Plan Demographics - 2014-2018 Pg. 14
F i g u r e 2 4 : N u m b e r o f 0 – 4 y e a r o l d s i n t h e m u n i c i p a l i t y b y s u b u r b 1083
756
535
683
384
660
583 473 473 483
248
341
760
313
544 484
Middle Years 5 – 11 year olds
Mitcham has the highest number of children aged of 4 (1,083), while Mont Albert has the lowest number of children under the age of 4 (341). In relation to a percentage of the population, Box Hill has the lowest proportion of those aged 5 – 11 at 6%, while Vermont and Blackburn North have 5 – 11 year olds make up 10% of their resident population. Box Hill South, Blackburn and Mitcham all have 5 – 11 year olds make up 9% of the population.
F i g u r e 2 5 : N u m b e r o f 5 – 1 1 y e a r o l d s p e r s u b u r b
1146
1308
683
910
557
904
685 736 663
806
378 424
905
437
916 869
Secondary Schoolers 12 – 17 year olds
The largest number of secondary schoolers are found in Vermont South, Mitcham and Blackburn. As can be seen in figure 18, Box Hill (5.2%), Mitcham (6%) and Nunawading (6%) have the lowest proportion of 12 – 17 year olds. While Mont Albert (8.5%), Vermont South (8.6%) and Mont Albert North (8%) have the largest proportion of 12 – 17 year olds in their suburbs.

Municipal Early Years and Youth Plan Demographics - 2014-2018 Pg. 15
F i g u r e 2 6 : n u m b e r o f y o u t h a g e d 1 2 – 1 7 y e a r s p e r s u b u r b
917 534
706
499
693
498
669 654 658
899
402 417
622
373
663
979
18 – 24 year olds
As previously stated, the largest number of youth aged between 18 and 24 are based in Burwood and Box Hill, largely due to the tertiary institutions nearby. Burwood (21%) and Box Hill (18%) have the highest proportion of 18 to 24 year olds, while the lowest proportion can be found in Blackburn North (7%), Mitcham (7%) and Vermont (7.4%).
F i g u r e 2 7 : N u m b e r o f 1 8 – 2 4 y e a r o l d s p e r s u b u r b
2260
1138
511
832
1780 1106
848
1256
760
1050
551 486
894
556
705
1106
Health data
In general the City of Whitehorse when compared to overall Victoria, has some health issues can could be improved residents. For example, although the percentage of low birth weight babies was 6%, which is slightly less than Victoria at 6.6%, Whitehorse has a higher percentage of people reporting asthma 13.3%, than Victoria, at 10.7%. Despite Whitehorse also having people less who are overweight or obese at 46.1%, (which still represents a very high percentage of the overall population), this is less than the rest of Victoria, which is 48.6%. The percentage of people reporting Type 2 diabetes in Whitehorse is 5.3%, which this is higher than Victoria, at 4.8%.

Municipal Early Years and Youth Plan Demographics - 2014-2018 Pg. 16
Health behaviours
Smoking
In the City of Whitehorse, 11% of 15 – 17 year olds reported to have smoked cigarettes. Although there is no Victorian comparison, the percentage was less than those living in Boroondara (23.8%) but slightly more than Monash (9.4%).
Consumed alcohol
In the City of Whitehorse, 44.7% of 15 to 17 year olds reported to have consumed alcohol in the last 30 days. This was more than when compared with Monash at 34.5% and less than those who live in Boroondara (53.5%).
Food
• The percentage of persons who share a meal with family at least 5 days per week is 55.3%.
• 4.4% of persons living in Whitehorse had experienced food insecurity, the same as 4.4% in the Eastern Metro Region but less than the Victorian State average of 6%.
• The percentage of mothers fully or partially breastfeeding at six months has increased steadily over time. From 2010/11 to 2011/12, the percentage increased from 58% to 62%.
• In 2011, the percentage of mothers fully breastfeeding at 6 months remains steady at 47%, which is higher than the Victorian average of 37%, but lower than the 2007/08 levels where it was 50%.
Adopt sun smart behaviour
Percentage of adolescents who adopt sun smart behaviours is only 2.3%.
Brush teeth
Percentage of adolescents who brush their teeth at least twice per day 73.7%.
Vulnerable in one or more domains
The percentage of children developmentally vulnerable in one or more domains is 13.8% and this is slightly less than the Victorian average of 20.3%.
Vulnerable in two or more domains
The percentage of children developmentally vulnerable in two or more domains 5.8% which is less than the Victorian average of 10.0%
Bullying at school
The percentage of adolescents who report being recently bullied is 35.8%, which is less than Monash who reported 51% and Boroondara that was 43%.
Percentage of adolescents who report positive psychological development 66.3%
Children in Whitehorse are generally healthy and have attendances to child health nurses higher than the Victorian average. In 2011 – 2012 it was found attendances were:
o Children aged 4 weeks; Whitehorse 99%, Victorian average 96%.
o Children at 12 months; Whitehorse 89%, Victorian average 82%
o Children at 2 years old; Whitehorse 80%, Victorian average 72%.
o Children at 3.5 years; Whitehorse 73%, Victorian average 68%

Municipal Early Years and Youth Plan Demographics - 2014-2018 Pg. 17
References
City of Whitehorse Community Profile http://profile.id.com.au/whitehorse
City of Whitehorse Community Atlas http://atlas.id.com.au/whitehorse
City of Whitehorse Population Forecasting http://forecast2.id.com.au/Default.aspx?id=123&pg=5000
Australian Bureau of Statistics: www.abs.gov.au
Community Indicators Victoria http://www.communityindicators.net.au/

Country of Birth data identifies where people were born and is indicative of the level of cultural diversity in the City ofWhitehorse. The mix of Country of Birth groups is also indicative of historical settlement patterns, as source countriesfor Australia's immigration program have varied significantly over time.
To get a more complete picture of cultural and ethnic characteristics, the City of Whitehorse's Country of Birth datashould be viewed together with Ancestry, Language Spoken at Home and Religion.
Birthplace
Birthplace ranked by size
City of Whitehorse 2011 2006 Change
Birthplace Number %
GreaterMelbourne
% Number %
GreaterMelbourne
%2006 to2011
China 11,048 7.3 2.3 5,788 4.0 1.5 +5,260
United Kingdom 5,372 3.5 4.1 5,828 4.0 4.4 456
India 3,514 2.3 2.7 2,100 1.5 1.4 +1,414
Malaysia 3,348 2.2 1.0 2,663 1.8 0.8 +685
Vietnam 2,167 1.4 1.7 2,006 1.4 1.6 +161
Hong Kong 2,040 1.3 0.4 1,905 1.3 0.5 +135
Greece 1,916 1.3 1.2 2,056 1.4 1.4 140
New Zealand 1,909 1.3 1.7 1,781 1.2 1.5 +128
Sri Lanka 1,790 1.2 1.1 1,452 1.0 0.8 +338
Italy 1,691 1.1 1.7 1,952 1.3 2.0 261
Excludes countries with fewer than 20 people, or less than 0.1% of the total population.
Birthplace summary
City of Whitehorse 2011 2006 Change
Birthplace Number %
GreaterMelbourne
% Number %
GreaterMelbourne
%2006 to2011
Total Overseas born 50,584 33.4 31.4 42,149 29.1 28.6 +8,435
NonEnglish speaking backgrounds 41,395 27.4 24.2 32,777 22.6 21.6 +8,618
Main English speaking countries 9,189 6.1 7.2 9,372 6.5 7.0 183
Australia 94,359 62.3 63.3 95,712 66.1 64.5 1,353
Not Stated 6,395 4.2 5.3 6,908 4.8 6.9 513
Total Population 151,338 100.0 100.0 144,769 100.0 100.0 +6,569
Source: Australian Bureau of Statistics, Census of Population and Housing 2006 and 2011. Compiled and presented in profile.id by.id, the population experts.
Page 3 of 15

Birthplace, 2011
Source: Australian Bureau of Statistics, Census of Population and Housing, 2011 (Usual residence data)Compiled and presented in profile.id by .id, the population experts.
Change in birthplace, 2006 to 2011
Source: Australian Bureau of Statistics, Census of Population and Housing, 2006 and 2011 (Usual residence data)Compiled and presented in profile.id by .id, the population experts.
Page 4 of 15

Dominant groupsAnalysis of the country of birth of the population in the City of Whitehorse in 2011 compared to Greater Melbourneshows that there was a larger proportion of people born overseas, as well as a larger proportion of people from anonEnglish speaking background.
Overall, 33.4% of the population was born overseas, and 27.4% were from a nonEnglish speaking background,compared with 31.4% and 24.2% respectively for Greater Melbourne.
The largest nonEnglish speaking country of birth in the City of Whitehorse was China, where 7.3% of the population,or 11,048 people, were born.
The major differences between the countries of birth of the population in the City of Whitehorse and GreaterMelbourne were:
A larger percentage of people born in China (7.3% compared to 2.3%)A larger percentage of people born in Malaysia (2.2% compared to 1.0%)
Emerging groupsBetween 2006 and 2011, the number of people born overseas increased by 8,435 or 20.0%, and the number ofpeople from a nonEnglish speaking background increased by 8,618 or 26.3%.
The largest changes in birthplace countries of the population in this area between 2006 and 2011 were for thoseborn in:
China (+5,260 persons)India (+1,414 persons)Malaysia (+685 persons)United Kingdom (456 persons)
Page 5 of 15

Proficiency in English measures the selfassessed proficiency in spoken English of people who speak a languageother than English at home. The data, when viewed with other ethnic and cultural indicators, such as Ancestry,Country of Birth, Language Spoken at Home and Religion, reflects the City of Whitehorse's ethnic composition andhow long the overseas born have been in Australia. This helps service providers determine whether they need tocommunicate with the local population in languages other than English.
Proficency in English
Proficiency in EnglishCity of Whitehorse Total persons (Usualresidence) 2011 2006 Change
English proficiency Number %
GreaterMelbourne
% Number %
GreaterMelbourne
%2006 to2011
Speaks English only 99,953 66.0 66.3 102,969 71.1 68.5 3,016
Speaks another language, and English well or very
well
37,442 24.7 24.0 29,654 20.5 21.1 +7,788
Speaks another language, and English not well or
not at all
8,301 5.5 5.0 6,705 4.6 4.9 +1,596
Not stated 5,643 3.7 4.6 5,440 3.8 5.6 +203
Total population 151,339 100.0 100.0 144,768 100.0 100.0 +6,571
Source: Australian Bureau of Statistics, Census of Population and Housing 2006 and 2011. Compiled and presented in profile.id by.id, the population experts.
Proficiency in English, 2011
Source: Australian Bureau of Statistics, Census of Population and Housing, 2011 (Usual residence data)Compiled and presented in profile.id by .id, the population experts.
Page 6 of 15

Dominant groupsAnalysis of the proficiency in English data of the population in the City of Whitehorse in 2011 compared to GreaterMelbourne shows that there was a similar proportion of people who spoke English only, as well as a similar proportionof people who spoke another language and English not well or not at all.
Overall, 66.0% of people spoke English only, and 5.5% spoke another language and English not well or not at all,compared with 66.3% and 5.0% respectively for Greater Melbourne.
Emerging groupsThe most significant changes in the proficiency in English of the population in this area between 2006 and 2011 werein those speaking:
Speaks another language, and English well or very well (+7,788 persons)Speaks English only (3,016 persons)Speaks another language, and English not well or not at all (+1,596 persons)
Change in Proficiency in English, 2006 to 2011
Source: Australian Bureau of Statistics, Census of Population and Housing, 2006 and 2011 (Usual residence data)Compiled and presented in profile.id by .id, the population experts.
Page 7 of 15

The City of Whitehorse's language statistics show the proportion of the population who speak a language at homeother than English. They indicate how culturally diverse a population is and the degree to which different ethnicgroups and nationalities are retaining their language.
The City of Whitehorse's language statistics should be analysed in conjunction with Country of Birth and Proficiencyin English to assist in identifying specific cultural and ethnic groups in the area and the services required by themulticultural community.
Language spoken at home
Language spoken at home ranked by size
City of Whitehorse 2011 2006 Change
Language (excludes English) Number %
GreaterMelbourne
% Number %
GreaterMelbourne
%2006 to2011
Mandarin 11,353 7.5 2.5 6,305 4.4 1.7 +5,048
Cantonese 7,766 5.1 1.8 6,746 4.7 1.8 +1,020
Greek 4,761 3.1 2.8 4,931 3.4 3.1 170
Italian 2,648 1.7 2.8 3,056 2.1 3.3 408
Vietnamese 1,862 1.2 2.1 1,606 1.1 1.9 +256
Hindi 1,192 0.8 0.8 758 0.5 0.5 +434
Sinhalese 1,031 0.7 0.7 674 0.5 0.5 +357
Korean 938 0.6 0.3 620 0.4 0.2 +318
Chinese, nfd 814 0.5 0.2 279 0.2 0.1 +535
Punjabi 790 0.5 0.7 329 0.2 0.2 +461
Excludes languages with fewer than 20 people speaking them at home, or less than 0.1% of the total population.
Language spoken at home summary
City of Whitehorse 2011 2006 Change
Language summary Number %
GreaterMelbourne
% Number %
GreaterMelbourne
%2006 to2011
Speaks English only 99,955 66.0 66.3 102,968 71.1 68.5 3,013
NonEnglish total 45,814 30.3 29.1 36,490 25.2 26.0 +9,324
Not stated 5,569 3.7 4.6 5,310 3.7 5.6 +259
Total Population 151,338 100.0 100.0 144,768 100.0 100.0 +6,570
Source: Australian Bureau of Statistics, Census of Population and Housing 2006 and 2011. Compiled and presented in profile.id by.id, the population experts.
Page 8 of 15

Language spoken at home, 2011
Source: Australian Bureau of Statistics, Census of Population and Housing, 2011 (Usual residence data)Compiled and presented in profile.id by .id, the population experts.
Change in language spoken at home, 2006 to 2011
Source: Australian Bureau of Statistics, Census of Population and Housing, 2006 and 2011 (Usual residence data)Compiled and presented in profile.id by .id, the population experts.
Page 9 of 15

Dominant groupsAnalysis of the language spoken at home by the population of the City of Whitehorse in 2011 compared to GreaterMelbourne shows that there was a similar proportion of people who spoke English only, and a larger proportion ofthose speaking a nonEnglish language (either exclusively, or in addition to English).
Overall, 66.0% of the population spoke English only, and 30.3% spoke a nonEnglish language, compared with 66.3%and 29.1% respectively for Greater Melbourne.
The dominant language spoken at home, other than English, in the City of Whitehorse was Mandarin, with 7.5% of thepopulation, or 11,353 people speaking this language at home.
The major differences between the languages spoken at home for the population of the City of Whitehorse andGreater Melbourne in 2011 were:
A larger percentage speaking Mandarin at home (7.5% compared to 2.5%)A larger percentage speaking Cantonese at home (5.1% compared to 1.8%)A smaller percentage speaking Arabic at home (0.3% compared to 1.6%)A smaller percentage speaking Italian at home (1.7% compared to 2.8%)
Emerging groupsBetween 2006 and 2011, the number of people who spoke a language other than English at home increased by9,324 or 25.6%, and the number of people who spoke English only decreased by 3,013 or 2.9%.
The largest changes in the spoken languages of the population in the City of Whitehorse between 2006 and 2011were for those speaking:
Mandarin (+5,048 persons)Cantonese (+1,020 persons)Chinese, nfd (+535 persons)Punjabi (+461 persons)
Page 10 of 15

The ability of the population to access services and employment is strongly influenced by access to transport. Thenumber of motor vehicles per household in the City of Whitehorse quantifies access to private transport and will beinfluenced by Age Structure and Household Type, which determine the number of adults present; access to PublicTransport; distance to shops, services, employment and education; and Household Income. Depending on thesefactors, car ownership can be seen as a measure of advantage or disadvantage, or a neutral socioeconomicmeasure, which impacts on the environment and quality of life.
Number of cars per household
Car ownership
City of Whitehorse 2011 2006 Change
Number of cars Number %
GreaterMelbourne
% Number %
GreaterMelbourne
%2006 to2011
No motor vehicles 4,883 8.5 9.0 4,791 8.6 9.4 +92
1 motor vehicle 20,836 36.4 33.9 20,170 36.3 33.4 +666
2 motor vehicles 21,176 37.0 35.5 20,544 37.0 35.1 +632
3 or more motor vehicles 7,569 13.2 15.4 7,146 12.9 14.3 +423
Not stated 2,743 4.8 6.3 2,893 5.2 7.8 150
Total households 57,207 100.0 100.0 55,544 100.0 100.0 +1,663
Source: Australian Bureau of Statistics, Census of Population and Housing 2006 and 2011. Compiled and presented in profile.id by.id, the population experts.
Car ownership, 2011
Source: Australian Bureau of Statistics, Census of Population and Housing, 2011 (Enumerated data)Compiled and presented in profile.id by .id, the population experts.
Page 11 of 15

Dominant groupsAnalysis of the car ownership of the households in the City of Whitehorse in 2011 compared to Greater Melbourneshows that 86.7% of the households owned at least one car, while 8.5% did not, compared with 84.8% and 9.0%respectively in Greater Melbourne.
Of those that owned at least one vehicle, there was a larger proportion who owned just one car; a larger proportionwho owned two cars; and a smaller proportion who owned three cars or more.
Overall, 36.4% of the households owned one car; 37.0% owned two cars; and 13.2% owned three cars or more,compared with 33.9%; 35.5% and 15.4% respectively for Greater Melbourne.
Emerging groupsThe largest changes in the household car ownership in the City of Whitehorse between 2006 and 2011 were:
1 motor vehicle (+666 households)2 motor vehicles (+632 households)3 or more motor vehicles (+423 households)No motor vehicles (+92 households)
Change in car ownership, 2006 to 2011
Source: Australian Bureau of Statistics, Census of Population and Housing, 2006 and 2011 (Enumerated data)Compiled and presented in profile.id by .id, the population experts.
Page 12 of 15

The City of Whitehorse SEIFA Index of Disadvantage measures the relative level of socioeconomicdisadvantage based on a range of Census characteristics. It is a good place to start to get a general view ofthe relative level of disadvantage in one area compared to others and is used to advocate for an area basedon its level of disadvantage.
The index is derived from attributes that reflect disadvantage such as low income, low educational attainment,high unemployment, and jobs in relatively unskilled occupations. When targeting services to disadvantagedcommunities, it is important to also look at these underlying characteristics as they can differ markedly betweenareas with similar SEIFA scores and shed light on the type of disadvantage being experienced.
A higher score on the index means a lower level of disadvantage. A lower score on the index means a higherlevel of disadvantage.
SEIFA by Local Government Area SEIFA by small areas
SEIFA disadvantage
Index of relative socioeconomic disadvantage
Local Government Areas in Victoria
Local Government Area2011index
Nillumbik (S) 1,098.3
Boroondara (C) 1,097.6
Bayside (C) 1,091.1
Stonnington (C) 1,083.7
Manningham (C) 1,071.4
Glen Eira (C) 1,069.4
Surf Coast (S) 1,066.5
Port Phillip (C) 1,065.7
Macedon Ranges (S) 1,055.1
Queenscliffe (B) 1,053.2
Whitehorse (C) 1,051.2
Knox (C) 1,049.3
Banyule (C) 1,047.4
Monash (C) 1,044.9
Maroondah (C) 1,043.9
Kingston (C) 1,037.7
Yarra Ranges (S) 1,037.1
Golden Plains (S) 1,030.1
Moonee Valley (C) 1,027.1
Melbourne (C) 1,025.8
Cardinia (S) 1,024.3
Mornington Peninsula (S) 1,022.5
Yarra (C) 1,019.1
Unincorporated Vic 1,019.0
Moyne (S) 1,017.3
Wyndham (C) 1,013.4
Page 13 of 15

Index of relative socioeconomic disadvantage
Local Government Areas in Victoria
Local Government Area2011index
Mansfield (S) 1,012.1
Indigo (S) 1,009.8
Moorabool (S) 1,008.5
Casey (C) 1,006.5
Melton (S) 1,002.1
Hobsons Bay (C) 1,001.7
South Gippsland (S) 999.5
Baw Baw (S) 998.1
Moreland (C) 998.1
Murrindindi (S) 997.2
Frankston (C) 996.7
Mitchell (S) 996.1
Towong (S) 995.9
Southern Grampians (S) 994.5
Greater Geelong (C) 992.9
Darebin (C) 990.3
Whittlesea (C) 988.6
Warrnambool (C) 988.6
Horsham (RC) 987.4
Alpine (S) 986.9
Corangamite (S) 986.1
West Wimmera (S) 985.6
Mount Alexander (S) 983.3
Greater Bendigo (C) 983.1
Wangaratta (RC) 981.1
Ballarat (C) 980.8
Hepburn (S) 979.6
Bass Coast (S) 977.5
Wodonga (RC) 974.7
Wellington (S) 974.1
Maribyrnong (C) 974.0
Strathbogie (S) 970.2
Buloke (S) 967.7
ColacOtway (S) 964.6
Campaspe (S) 964.1
Glenelg (S) 960.2
Gannawarra (S) 958.8
East Gippsland (S) 958.2
Benalla (RC) 957.2
Moira (S) 952.4
Yarriambiack (S) 952.4
Page 14 of 15

Index of relative socioeconomic disadvantage
Local Government Areas in Victoria
Local Government Area2011index
Greater Shepparton (C) 951.9
Hume (C) 951.8
Ararat (RC) 950.5
Swan Hill (RC) 949.8
Hindmarsh (S) 946.6
Pyrenees (S) 939.9
Latrobe (C) 939.7
Northern Grampians (S) 937.6
Mildura (RC) 935.0
Loddon (S) 934.1
Brimbank (C) 925.8
Central Goldfields (S) 904.6
Greater Dandenong (C) 894.9
Source: Australian Bureau of Statistics, Census of Population and Housing 2011. Compiled and presented in profile.id by .id, thepopulation experts.
Page 15 of 15