municipal facility planning - bouwstenenvoorsociaal.nl · information: poldy koot (assen), jaap...
TRANSCRIPT

2014
Aestate B.V. Lars Wolfkamp 1595608
MUNICIPAL FACILITY PLANNING Datum: 7 januari 2014 Docenten: Marieke Venselaar MSc & Ir. Arne van Overmeeren Vakcode: TBTB-V15AFAM-13
Vaktitel: Afstudeeronderzoek CM-AM

m
M u n i c i p a l f a c i l i t y p l a n n i n g – L a r s W o l f k a m p – A e s t a t e B . V .
Page 1
Titelblad Personalia Student : Lars Wolfkamp Adres: Hellestraat 6C 3811 LL Amersfoort Telefoonnummer: 06-38173807 E-mailadres: [email protected] Studentnummer: 1595608 Cursuscode: TBTB-V15AFAM-13 Stageperiode Startdatum: 8 juli 2013 Einddatum: 7 januari 2014 Presentatieweek: 20 t/m 31 januari 2014 Stagebedrijf Bedrijf: Aestate B.V. Adres: De Vork 2, 3984 PA Odijk Telefoonnummer: 030-6376377 Externe begeleider Naam: dr. ir. J.C. (Jackie) de Vries Functie: Managing partner Emailadres: [email protected] Telefoonnummer: 06- 54655638 Docentbegeleiders (Hogeschool Utrecht) 1e begeleider Marieke Venselaar MSc [email protected] 2e begeleider Ir. Arne van Overmeeren [email protected]

m
M u n i c i p a l f a c i l i t y p l a n n i n g – L a r s W o l f k a m p – A e s t a t e B . V .
Page 2
Acknowledgements It is with pleasure that I present my graduation thesis about municipal facility planning. This thesis is written as part of my graduation from Bouwtechnische Bedrijfskunde at the Hogeschool Utrecht. The research is used as input for the Reisgids maatschappelijk voorzieningen that is published by Bouwstenen voor Sociaal. It was a special experience to write something that is actually published. The cooperation with Bouwstenen voor Sociaal gave me the opportunity to look behind the scenes of the municipal facility planning. Without their help, I would not have gathered the information that I got now. I therefore would like to thank Bouwstenen voor Sociaal for this special opportunity. I also would like to thank the cooperating municipalities, and especially the people that were willing to provide extra information: Poldy Koot (Assen), Jaap Gorseling & Jacob Bruintjes (Borger-Odoorn), Marije van den Bogerd (Molenwaard), Desiree Meulenbroek (Oss), Daniël van Noordennen (Rotterdam) and Patrick van Herwaarden (Sluis). I also would like to thank Aestate for giving me the possibility to carry out my research in a professional and helpful environment. My special thanks go out to my mentor at Aestate Jackie de Vries. She was even available in the weekends and her ever critical comments really increased the quality of this research. My great appreciation go out to my mentor Marieke Venselaar for her ever supportive critics. I also would like to thank my second mentor Arne van Overmeeren for his critical notes. And last but not least, I would like to thank my friends and my girlfriend Marissa for their mental support during the last 4 months. I hope you will enjoy reading this thesis. Lars Wolfkamp January 2014

m
M u n i c i p a l f a c i l i t y p l a n n i n g – L a r s W o l f k a m p – A e s t a t e B . V .
Page 3
Summary Background During my trip to India, not a day went by without seeing people playing cricket on the streets, but I have not seen one cricket club or official cricket field. While in The Netherlands, every town has at least one soccer club. This example is symbolic for the high level of social facilities in The Netherlands. Besides sport facilities, are schools, community centres and multifunctional accommodations examples of social facilities. The total social real estate portfolio is 83,5 million square meters, of which 37 percent is owned by the Dutch municipalities. The portfolio costs about 14,5 billion euro per year (Bouwstenen voor sociaal, 2012). Most municipalities reduce their budget for social facilities because of the financial crisis. Because of the decentralization(s) and changes in the WMO the municipalities get more duties but their budget remains the same. To achieve more with the same budget, optimization is necessary. Finally there are demographic changes; ageing, the decrease of the younger population and, in about a quarter of the municipalities, a decrease in population (CBS, 2012). There are not only developments in the supply side, there are also changes in the demand for social facilities. Because people have access to facilities from out of their homes (on the internet), the barrier to use a physical facility becomes larger. Social interaction, experience and quality become important reasons for using a physical facility. So on the one hand municipalities have to optimize, and on the other hand they face a demand that is more and more based on quality instead of quantity. To meet this changing demand, most municipalities design a facility planning. To find out how they design this facility planning, the following research question is formulated:
How do municipalities decide which facilities they should and which they should not facilitate by real estate, and which difficulties are they facing during this process?
Results Six municipalities were examined to answer the research question; Assen, Borger-Odoorn, Molenwaard, Oss, Rotterdam and Sluis. At first, every municipality is characterised on the basis of a few characteristics (town- or centre municipality, developments in the population and ageing, size and organisational structure). Then the social policy (role citizens’ participation) and the real estate policy (the steps to get to the facility planning, Joroff, demand-/supply driven, the perspective and the scale level) are described. Besides the characterising of the municipal policy, the problems of the municipalities are given. A part of the problems are formulated by the municipalities themselves.. The other problems are based on the characterisation and the literature review. These problems are sometimes not experienced by the municipalities themselves. Conclusions & recommendations All these problems could be brought back to five general causes:
- The portfolio is not mapped properly - Lack of alignment between the social policy and the real estate policy - Wrong use of citizens participation - Lack of an integral plan - No clear vision which demand need to be facilitated and which not

m
M u n i c i p a l f a c i l i t y p l a n n i n g – L a r s W o l f k a m p – A e s t a t e B . V .
Page 4
To prevent municipalities from facing the same problems, the following recommendations are suggested:
- Map the portfolio and monitor proactively, every municipality has to be at least a Dealmaker on the levels of Joroff. Other municipalities should follow the example of Oss, this municipality monitors the short- and the long term costs of the portfolio.
- Citizens’ opinion will add value if taken into account that they argue form their own interest. - Make a master plan instead of designing a facility planning per neighbourhood. - Be consistent in the link between the real estate policy and the social policy. The steering
mechanisms in the real estate policy should be consistent with the social policy goals. The occupancy rate for example, is not a good indicator to check whether political goals are achieved.
- Before starting with facility planning, two question have to be answered: o Which demand do I HAVE to facilitate? o Which demand do I WANT to facilitate?

m
M u n i c i p a l f a c i l i t y p l a n n i n g – L a r s W o l f k a m p – A e s t a t e B . V .
Page 5
Samenvatting Achtergrond Tijdens mijn reis door India heb ik veel mensen cricket zien spelen, maar ik heb nergens een echt cricketveld of cricketclub gezien. Dit terwijl in Nederland in ieder dorp tenminste één voetbalclub gevestigd is. Dit verschil is symbolisch voor het hoge voorzieningenniveau in Nederland. Naast sportvoorzieningen gaat het dan ook om bijvoorbeeld scholen, buurthuizen, schouwburgen en multifunctionele accommodaties. In totaal beschikt Nederland over 83,5 miljoen vierkante meter maatschappelijk vastgoed, 37 procent hiervan is eigendom van de Nederlandse gemeenten. De totale maatschappelijke vastgoedportefeuille kost op jaarbasis ongeveer 14,5 miljard euro (Bouwstenen voor sociaal, 2012). Door de economische crisis besluiten veel gemeentes om hun budget voor maatschappelijke voorzieningen ieder jaar verder in te krimpen. De decentralisatie en de veranderingen in de WMO zorgen ervoor dat gemeentes meer taken krijgen terwijl het budget gelijk blijft. Om meer te doen met hetzelfde budget, is optimalisatie noodzakelijk. Ten slotte zijn er de demografische ontwikkelingen; vergrijzing, ontgroening en, in ongeveer een kwart van de gemeenten, krimp (CBS, 2012). De gemeenten kijken dus kritisch naar hun voorzieningenaanbod, tegelijkertijd zijn er ook ontwikkelingen waardoor de vraag naar voorzieningen verandert. Doordat mensen veel voorzieningen ook vanuit huis kunnen gebruiken (via internet), is de drempel groter om naar een fysieke voorziening toe te gaan. Bij de keuze voor een fysieke voorziening worden contact, beleving en kwaliteit steeds belangrijker. Gemeentes moeten dus aan de ene kant optimaliseren, en krijgen aan de andere kant te maken met vraag die meer en meer is gebaseerd op kwaliteit in plaats van op kwantiteit. Om aan deze veranderende vraag te voldoen, stellen veel gemeentes een voorzieningenplanning op. Om te achterhalen hoe gemeentes deze voorzieningenplanning opstellen, is de volgende hoofdvraag opgesteld:
Hoe maken gemeentes de afweging welke voorzieningen ze wel en niet (middels vastgoed) moeten faciliteren en tegen welke problemen lopen ze daarbij op?
Resultaten Om deze hoofdvraag te beantwoorden is onderzoek gedaan onder 6 gemeentes; Assen, Borger-Odoorn, Molenwaard, Oss, Rotterdam en Sluis. Iedere gemeente is allereest getypeerd aan de hand van een aantal kenmerken (kernen- of centrumgemeente, bevolkingsgroei en vergrijzing, omvang en de organisatiestructuur). Vervolgens is het sociale beleid (de rol en de burgerparticipatie) en het vastgoedbeleid (de stappen om tot de voorzieningenplanning te komen, Joroff, vraag-/aanbodgestuurd beleid, het perspectief en het schaalniveau waarop het beleid is uitgevoerd) getypeerd. Naast het typeren van het beleid van de gemeentes, zijn ook de problemen geformuleerd waar de gemeentes mee kampen. Deze problemen zijn gedeeltelijk door de gemeentes zelf geformuleerd. De andere problemen zijn op basis van de typeringen en de literatuur geformuleerd. Deze problemen worden soms nog niet door de gemeentes zelf ervaren. Conclusies & aanbevelingen Uiteindelijk zijn de problemen die gemeentes ervaren, terug te brengen tot vijf generieke oorzaken:
- De portefeuille is niet in kaart gebracht - Er is een gebrek aan afstemming tussen het sociale beleid en het vastgoedbeleid - Onjuist gebruik van burgerparticipatie - Niet helder inzichtelijk hebben aan welke vraag gemeenten WILLEN voldoen.

m
M u n i c i p a l f a c i l i t y p l a n n i n g – L a r s W o l f k a m p – A e s t a t e B . V .
Page 6
Om te voorkomen dat andere gemeentes ook tegen deze problemen aanlopen, worden volgende aanbevelingen gedaan:
- Breng de portefeuille in kaart en monitor deze proactief, op dit gebied moet iedere gemeente ten minste een Dealmaker zijn in de typering van Joroff. Gemeentes kunnen een voorbeeld nemen aan Os, deze gemeente monitort zowel de korte- als de lange termijn kosten van de portefeuille.
- Betrek burgers op de juiste manier. Alleen informeren van de burgers is niet genoeg is. Voordat burgers actief worden betrokken is het belangrijk dat een gemeente duidelijk bepaalt waar burgers wel en waar ze geen invloed op hebben. Burgers redeneren namelijk altijd vanuit hun eigen belang, een gemeente moet goed beseffen wat de consequenties zijn van het geven van zeggenschap aan de burgers.
- Maak een overkoepelend plan, en ga niet per kern of kernengebied werken zonder integrale terugkoppeling.
- Wees consistent in de koppeling tussen het maatschappelijk beleid en het vastgoedbeleid. De sturingsmechanismes uit het vastgoedbeleid moeten consistent zijn met de doelstellingen van het sociale beleid. De bezettingsgraad is bijvoorbeeld geen goede indicator of de politieke doelstellingen zijn bereikt.
- Beantwoord als gemeente duidelijk twee vragen: o Aan welke vraag MOET ik voldoen? o Aan welke vraag WIL ik voldoen?

Table of contents Acknowledgements ................................................................................................................................. 2
Summary ................................................................................................................................................. 3
Samenvatting ........................................................................................................................................... 5
1 Introduction .......................................................................................................................................... 9
1.1 Research background .................................................................................................................... 9
1.2 Problem statement, objective & main question ......................................................................... 10
1.3 Readers guide .............................................................................................................................. 10
2 Method ............................................................................................................................................... 12
3 Analysis framework ............................................................................................................................ 14
3.1 Features municipality .................................................................................................................. 14
3.2 Characteristics social policy ......................................................................................................... 15
3.3 Characteristics real estate policy ................................................................................................. 17
3.4 Comparison 7S-model ................................................................................................................. 19
4 Case description ................................................................................................................................. 21
4.1 Description Assen ........................................................................................................................ 21
4.1.1 Features municipality ........................................................................................................... 21
4.1.2 Characteristics social policy .................................................................................................. 21
4.1.3 Characteristics real estate policy .......................................................................................... 21
4.1.4 Problems ............................................................................................................................... 23
4.2 Description Borger-Odoorn ......................................................................................................... 23
4.2.1 Features municipality ........................................................................................................... 23
4.2.2 Characteristics social policy .................................................................................................. 23
4.2.3 Characteristics real estate policy .......................................................................................... 24
4.3 Description Molenwaard ............................................................................................................. 25
4.3.1 Features municipality ........................................................................................................... 25
4.3.2 Characteristics social policy .................................................................................................. 26
4.3.3 Characteristics real estate policy .......................................................................................... 26
4.3.4 Problems ............................................................................................................................... 27
4.4 Description Oss ............................................................................................................................ 27
4.4.1 Features municipality ........................................................................................................... 27
4.4.2 Characteristics social policy .................................................................................................. 28
4.4.3 Characteristics real estate policy .......................................................................................... 28
4.5 Description Rotterdam ................................................................................................................ 30
4.5.1 Features municipality ........................................................................................................... 30
4.5.2 Characteristic social policy ................................................................................................... 30
4.5.3 Characteristic social policy ................................................................................................... 30

m
M u n i c i p a l f a c i l i t y p l a n n i n g – L a r s W o l f k a m p – A e s t a t e B . V .
Page 8
4.6 Description Sluis .......................................................................................................................... 32
4.6.1 Features municipality ........................................................................................................... 32
4.6.2 Characteristics social policy .................................................................................................. 32
4.6.3 Characteristics real estate policy .......................................................................................... 33
5 Cross-case analysis ............................................................................................................................. 36
5.1 Horizontal analysis....................................................................................................................... 36
5.2 Reflection on characteristics ....................................................................................................... 38
6 Conclusions & recommendations ....................................................................................................... 42
6.1 Answer main question ................................................................................................................. 42
6.2 Recommendations for the municipalities ................................................................................... 43
6.3 Recommendations for further research ...................................................................................... 44
6.4 Higher objective .......................................................................................................................... 44
7 Discussion ........................................................................................................................................... 46
7.1 Limitations ................................................................................................................................... 46
7.2 Reflection..................................................................................................................................... 46
Bibliography ........................................................................................................................................... 47

m
M u n i c i p a l f a c i l i t y p l a n n i n g – L a r s W o l f k a m p – A e s t a t e B . V .
Page 9
1 Introduction 1.1 Research background During my trip to India, not a day went by without seeing people play cricket on the streets. Cricket is by far the most popular sport in India, even the hotel staff is watching it during breakfast! Because cricket is that popular, it is very strange that I have not seen one cricket club or official cricket field during my 3,5 week trip. To give you some indication, I pass by 3 soccer clubs during my daily 45 minute trip to Aestate. This example is symbolic for the high level of social facilities in The Netherlands. Besides sport facilities, are schools, community centres and multifunctional accommodations examples of social facilities. All these facilities are (partly) financed by the Dutch government. 37% of the real estate in which these social facilities are located is owned by the Dutch municipalities (Muskee, 2013). All together, the social real estate portfolio is 83,5 million square meters. That is more than the sum of the shop- and office supply in the Netherlands (Muskee, 2013). This huge real estate portfolio costs a lot, about 14,5 billion euro per year (Bouwstenen voor sociaal, 2012). This portfolio is not a result of governments policy, but a consequence of history. Partly because of the municipal statutory duty (the Dutch municipalities are responsible for: Centre for Youth and Family, Sport accommodations (inside and outside), Primary education and Secondary education, but mostly because there was no other option. There were no other parties interested in exploiting this kind of real estate. Most municipalities reduce their budget for social facilities because of the financial crisis. Because of the decentralization(s) and the changes in the WMO1 the municipalities get more duties but their budget remains the same. To achieve more with the same budget, optimization is necessary. Finally there are demographic changes; ageing, the decrease of the younger population and, in about 25% of the municipalities, a decrease in population (CBS, 2012). There are not only developments in the supply side, there are also changes in the demand for social facilities. Because people have access to facilities from out of their homes (on the internet), people will only leave home for social facilities which really add value to their lives (Bouwstenen voor sociaal, 2012). Quality of facilities is more important than quantity (Bouwstenen voor sociaal, 2012). Internet also makes it possible to offer facilities, like a social meeting point, online. This development means a separation between social facilities and real estate. The demand for social real estate is more than ever defined by the demand for social interaction and experience instead of the demand for social facilities (Bouwstenen voor sociaal, 2012). These developments lead to three important questions for municipalities:
- Which social facilities do we have to offer? - How many of these facilities should we offer? - How should we offer these facilities (do we need real estate or can we offer them otherwise,
for example online)? Answering these questions provides insight in the desired facility-supply. One important question remains unanswered; how should this facility-supply be realised? “A facility planning answers the question which social facilities are needed to accommodate all social activities; and how to get there” (Linders, 2009). In practise it turns out that most municipalities do not have a facility planning or that they are not able to design one.
1 “From the 1th of January 2015, municipalities become fully responsible for support, guidance and care

m
M u n i c i p a l f a c i l i t y p l a n n i n g – L a r s W o l f k a m p – A e s t a t e B . V .
Page 10
1.2 Problem statement, objective & main question Following on from the described developments, the platform Bouwstenen voor Sociaal started developing a guidebook for social facilities. This book will replace the previous guidebook ‘Spoorboekje voor maatschappelijke voorzieningen’ which was published in 2008 by the VNG (Association of Dutch Municipalities). The new book should provide the municipalities guidance with designing a facility planning. This research is used as input for the guidebook. Problem statement:
Municipalities have difficulty to decide which facilities they should and which they should not facilitate by real estate.
In order to provide guidance, the current problems should be mapped. Subsequently, recommendations are given to deal with the problems. The main question for this research is: Main question
How do municipalities decide which facilities they should and which they should not facilitate by real estate, and which difficulties are they facing during this process?
By characterising the municipalities and explaining why they are encountering these specific problems, other municipalities can prevent facing these same problems. The research’ objective is therefore: Objective
Provide municipalities insight in the way other municipalities design their facility planning and the difficulties of similar municipalities and thereby provide guidance for designing their facility planning.
Besides the research objective, there is also a higher objective. The results of this research contribute to the development of knowledge in the field of Corporate Real Estate Management (CREM). The higher objective of this research is: Higher objective
Optimizing the process of designing a social facility planning through the guidebook for social facilities
1.3 Readers guide Chapter 2 starts with the research method. Chapter 3 describes the analysis framework that is used to describe the cases, followed by the case descriptions in chapter 4. Chapter 5 contains the horizontal analysis and the reflection on the used characteristics. The conclusions are drawn in chapter 6. The research ends with the discussion in chapter 7.

m
M u n i c i p a l f a c i l i t y p l a n n i n g – L a r s W o l f k a m p – A e s t a t e B . V .
Page 11
H1 • Research background
• Problem statement, objective & main question
H2 • Method
H3
• Features municipality
• Characteristics of the social policy
• Characteristics of the real estate policy
• Conclusions
H4
• Description 6 cases, per case:
• Features municipality
• Characteristics social policy
• Characteristics real estate policy
H5 • Horizontal analysis
• Reflection characteristics
H6 • Conclusions
• Recommendations
H7 • Limitations
• Reflection

m
M u n i c i p a l f a c i l i t y p l a n n i n g – L a r s W o l f k a m p – A e s t a t e B . V .
Page 12
2 Method This research consists of five steps which are taken sequentially. In the next chapter, each step is explained and the intended result is given. The first part, the research background, is already given in the first chapter and will not be described in this chapter.
Figure 1 The research process shown schematically
Part B: Literature review The goal of the literature review was to design an analysis framework. This framework was used to process the cases from part C. To make sure that the cases were comparable, it was important that the cases were clearly typified. The used characteristics had to meet the following two criteria, the had to be; 1) distinctive 2) relevant for the municipal facility planning. To check whether the used characteristics provide a clear picture of the municipalities, the criteria are compared to the 7S-model (“An organizational model developed by in the 1980s by Tom Peters and Robert Waterman (the authors of In Search of Excellence) that analyses seven key internal aspects of an organization that need to be aligned if it is too achieve its objectives and improve performance” (businessdictionary.com, n.d.)). The 7S-model is used, because the model:
- is based on empirical research and thus guarantees a certain completeness. - takes both the hard as well as the soft elements of an organisation into account. Most
models only consider the hard elements, while the soft elements are also important designing an facility planning.
- assumes cohesion between de 7 characteristics of the 7S-model (Weber & Doelen, 2010). This makes it possible to use the characteristics for the cross case analysis (see part D).
Besides a description of each municipality based on the characteristics, the process of designing the facility planning, as far as possible, is described. The phases of the DAS (Designing an Accommodation Strategy)-framework are used as point of departure. The DAS-framework is used, because the framework:
- can be used for all kinds of real estate decisions, complex as well as relatively easy decision.

m
M u n i c i p a l f a c i l i t y p l a n n i n g – L a r s W o l f k a m p – A e s t a t e B . V .
Page 13
- focuses on the current situation as well as on the future situation. - consists of a few tangible steps. These steps can be examined to determine whether the total
process has been run through. - is the most commonly known used framework in the discipline of corporate real estate
management. Part C: Case studies The cases are described in part C. The used municipalities are; Assen, Borger-Odoorn, Molenwaard, Oss, Rotterdam en Sluis. These municipalities are chosen because all six have participated in the expert meetings organised by Bouwstenen voor Sociaal. The municipalities have joined Bouwstenen voor Sociaal because they are working on their facility planning at the moment. During the expert meetings, representatives from the municipalities have explained their social facility policy and their problems with facility planning. They also made their policy documents available. The description of the cases consist of filling in the analysis framework. Every characteristic is explained separately. Part D: Cross-case analysis The cross-case analysis is carried out in the fourth part. Yin (1994) distinguishes three forms of case studies; in this research only two of them are used (see figure 2). The cross-case analysis consists of a single (vertical) as well as a multiple (horizontal) analysis in which all cases are compared. The goal is to find the differences and the similarities in the process of social facility planning and the context variables. The description of the cases is based on the theory as described in part B and is therefore comparable. The goals of municipalities are often not clearly and SMART formulated. Even if the goals are formulated well, it is still impossible to judge because the real estate interventions cannot be isolated. Because of this, it is impossible to determine whether the success caused by the real estate strategy or by other context variables (De Vries, 2007). That is why the policy of the municipalities is not judged, there is no indication given whether a facility planning is successful or not. Furthermore, time plays an important role in judging a real estate strategy. When should the success be achieved? Is achieving a goal after two years less successful then after one year? Part E: Conclusions and recommendations In part E of the research the main questions is answered and recommendations for the municipalities are defined. In the conclusion, it is taken into account that the municipalities are not representative for all the Dutch municipalities. This municipalities participated in the expert meeting organised by Bouwstenen voor Sociaal because they are aware of the problems concering their facility planning.
Figure 2 Different kinds of case studies (Yin, 1994),
schematized in Van der Schaaf (2002)

m
M u n i c i p a l f a c i l i t y p l a n n i n g – L a r s W o l f k a m p – A e s t a t e B . V .
Page 14
3 Analysis framework In this chapter, the analysis framework is created. The framework is used to describe the process of the facility planning and to figure out which problems and opportunities this process comes with. The characteristics of the municipality itself are given first, then the characteristics of the social policy are given and the chapter ends with the characteristics of the real estate policy. For each characteristic is explained why it is relevant for facility planning, then is explained what the characteristic means? Finally the advantages en disadvantages are given. To check whether the used characteristics provide a clear picture of the municipalities, the criteria are compared to the 7S-model. The characteristics used in this chapter are not the same as the criteria that would originally be used. During the process, some characteristics were dropped en some were added. To get to the desired analysis framework was an iterative process. The size of the portfolio was dropped because it turned out that it was impossible to draw the necessary conclusions from it. The characteristics citizens' participation, scale level and Joroff were added later.
3.1 Features municipality Town municipality/centre municipality The first distinction that is made between the municipalities is the distinction between municipalities that consist of a few small towns (town municipal) and centre municipalities which consist of one big town. The difference is displayed in the pictures in figure 3. This distinction is made because the shape of a municipality affects the number of desired facilities. Because in a ‘town municipality’ the people are spread over a relatively large surface, reachability plays an important role in the facility policy. Furthermore, people in a ‘town municipality’ are in general more connected with their own town. This makes it difficult to share facilities with other towns (Moerkamp, 2012).
Size The second feature that is described, is the size. It is likely that big municipalities have to deal with other problems than small municipalities. Big municipalities often face more organisational problems like bureaucracy, and the distance between citizens and municipal councillors is bigger than in small municipals. Other problems can be lack of involvement from citizens in big municipalities and a strong focus on their own town. The size of the participating municipalities is displayed by the size of the point on the map in figure 4. In addition to the size of the point, there is also a distinction in small municipalities with less than 50.000 residents (the yellow points), middle municipalities with a maximum of 100.000 residents (the orange points) and big municipalities with more than 100.000 residents (the red point) (Weidum, 2012).
Figure 3 town (above),
centre (under)
Figure 4 The map of Holland with the 6 municipalities that
were used for the case studies

m
M u n i c i p a l f a c i l i t y p l a n n i n g – L a r s W o l f k a m p – A e s t a t e B . V .
Page 15
Developments in the population As well as the size of the population, the developments in the population are very important. Ageing and population decline can affect the demand for facilities. This leads to different processes and a different facility portfolio. The darts in figure 5 on the right show the trends in ageing and population growth. The developments in the short term (2020) as well as the developments in the long term (2030) are shown.
Organisational structure The organisation structure is described by the position of the real estate department within the municipality. Some municipalities have a centralised real estate department, this can either be a separated real estate department as well as an integrated real estate department. Other municipalities choose to include real estate in the different line departments. The Barometer Maatschappelijk vastgoed 2012 (Veuger, 2013) shows that more and more municipalities choose to have a centralised real estate department. Where in 2008 only 40 percent of the municipalities had a centralised real estate department, this percentage was increased to 58 percent in 2012. Some arguments for a centralised real estate department are more efficiency, more transparency and a better price/quality ratio (Twynstra Gudde, 2009). A centralised real estate department also gives more insight in the real estate portfolio. This makes it easier to act like an equal partner in the real estate market (Sluiter, 2009).
Besides advantages, a centralised real estate department also has some disadvantages. Centralising increases the risk to lose bonding with the users of social real estate. Not only will this lead to a real estate supply that does not meet the demand, the users also miss the stimulus to be efficient with their resources. This increases the risk that economy of scale and efficiency could become more important factors than realising the municipal social goals (Bank & Den Heijer, 2004).
3.2 Characteristics social policy Role The first characteristic of the real estate policy that is described, is the role of the municipality. The roles are described by the characterizations of Van Leent (2012). He makes a distinction between the degree of control and the used control mechanisms (see figure 7). In case of a high degree of control, the municipality initiates the plans, coordinates the implementation and selects its partners. With a high degree of control, the municipality can decide which facilities are offered. Disadvantage of the high degree of control are the higher costs. In case of a low degree of control, the municipality leaves the initiation and coordination to the market. A low degree of control stimulates entrepreneurship among citizens. It also saves money because citizens take initiatives instead of officials. Van Leent also distinguishes two methods of steering; steering with real estate and steering with content. In case of steering with real estate, the municipality facilitates meeting points, the activities that take place in the meeting points are left to the citizens. The big advantage of steering with real estate is that the municipality determines the location of social facilities. Facilities can evenly be spread the facilities over the municipality or be concentrated in deprived areas. Disadvantage of steering with real estate is the real estate portfolio the municipality has to manage. They have to
Figure 5 Developments in the population
Figure 6 A municipality with
(above) and without (under) a
centralised real estate
department

m
M u n i c i p a l f a c i l i t y p l a n n i n g – L a r s W o l f k a m p – A e s t a t e B . V .
Page 16
deal with real estate risks and pay for maintenance. Steering with content is the opposite of steering with real estate, in this more programming role the municipality focuses on social programs and activities. The municipality subsidizes social activities, where these activities take place is up to the organizers of the activity. The subsidizing reduces the real estate risk of the municipality because they do not have to own social real estate. As a result, the municipality can focus on their core business. Steering with content also increases the municipalities influence on the social activities. Real estate is considered a tool instead of a goal (Van Leent, 2008).
Figure 7 The 4 roles Van Leent distinguishes (Van Leent, 2012)
The four described roles represent the most extreme situations for only one of the two dimensions. In reality the role of every municipality is a combination of two by Van Leent described roles. The roles are operationalized in appendix 1, the criteria that come from this operationalization are used to analyse the cases in chapter 4. Unfortunately is it not always easy to position a municipality in one of Van Leent’s squares. Some municipalities play different roles depending on the situation. For example in deprived area they exercise a high degree of control and in richer parts of the city they leave the initiative to the citizens. Despite these different roles, all municipalities are positioned in the square that fits most in order to compare them in the horizontal analysis. Citizens' participation Some municipalities choose to let citizens participate when they draw up their policy. The extent to which the citizens participate, is illustrated in the participation ladder (Van Soest & Van de Loo, 2008). This ladder contains five rungs. The higher the rung, the more citizens are allowed to participate (see figure 8). The rungs are operationalized in appendix 2 and will be briefly explained in the next section. In case of the lowest rung, information, a one-sided relationship exists between the citizens and the municipality. The municipality draws up the policy without any citizens’ participation. Consultation implies interaction between the municipality and the Figure 8 The participation ladder
(Van Soest & Van de Loo, 2008)

m
M u n i c i p a l f a c i l i t y p l a n n i n g – L a r s W o l f k a m p – A e s t a t e B . V .
Page 17
citizens. Citizens are asked about their opinion, but the municipality has no obligation to use the opinions in their policy. This obligation is also lacking in the rung advising, but the municipality is in that rung obligatory to respond to the advices. Ignoring the advices has to be motivated. The fourth rung, coproduction, desires a cooperation based on equality. The municipality is obligated to stick to the together formulated solutions. The highest rung is codecision, in this case the municipality delegates the responsibility to the citizens. The municipality is obliged to stick to the citizens’ solutions. The participation of citizens has advantages as well as disadvantages for municipalities. By using citizens’ participation, facility supply better meets the demand in most cases. Citizens’ participation also comes with a big risk, citizens defend their own rights instead of the common rights. Moerkamp (2012) describes that citizens revolt if social facilities are closed in their town, even though research proves that social facilities do not affect the quality of life. By involving the citizens, the possibility increases that choices are made based on feelings instead of based on facts.
3.3 Characteristics real estate policy DAS-framework The different phases of the DAS-framework (Designing an Accommodation Strategy) are used to describe the steps that are taken to design a facility planning (or an accommodation strategy in common). This framework is designed by the TU Delft (Arkesteijn, et al., 2009) en contains of four ‘key coordination moments’ ; current match, future match, step by step plan en weigh alternatives and decide. These four steps form an iterative process, some steps can be taken multiple times. There is also no predefined starting point, but during the process all stages should be passed. The coordination moments are shortly explained in the next section. In the case description in chapter 4 is per case described which steps from the DAS-framework are taken. By analysing which steps are missing, it is tried to find explanations for the experienced problems.
The current match is the match between the current demand and the current supply. The easiest, and most commonly used indicator for the current match is the occupancy rate. The future match equals the current match but it uses the future demand instead of the current. The future match addresses which changes in the portfolio have to be made to meet the future demand. In the step “weigh alternatives and decide” are alternatives to meet the future demand judged. With this step the designers of the framework imply that a municipality designs more than one alternative. The step by step plan is a plan to get from the current supply to the future supply. The specificity of this plan depends on how specific the description of the future supply is. It can either be a very common plan as well as a very detailed plan including an estimate of costs and time schedule.
Figure 9 The DAS-framework (Arkesteijn, et al., 2009)
m
M u n i c i p a l f a c i l i t y p l a n n i n g – L a r s W o l f k a m p – A e s t a t e B . V .
Page 18
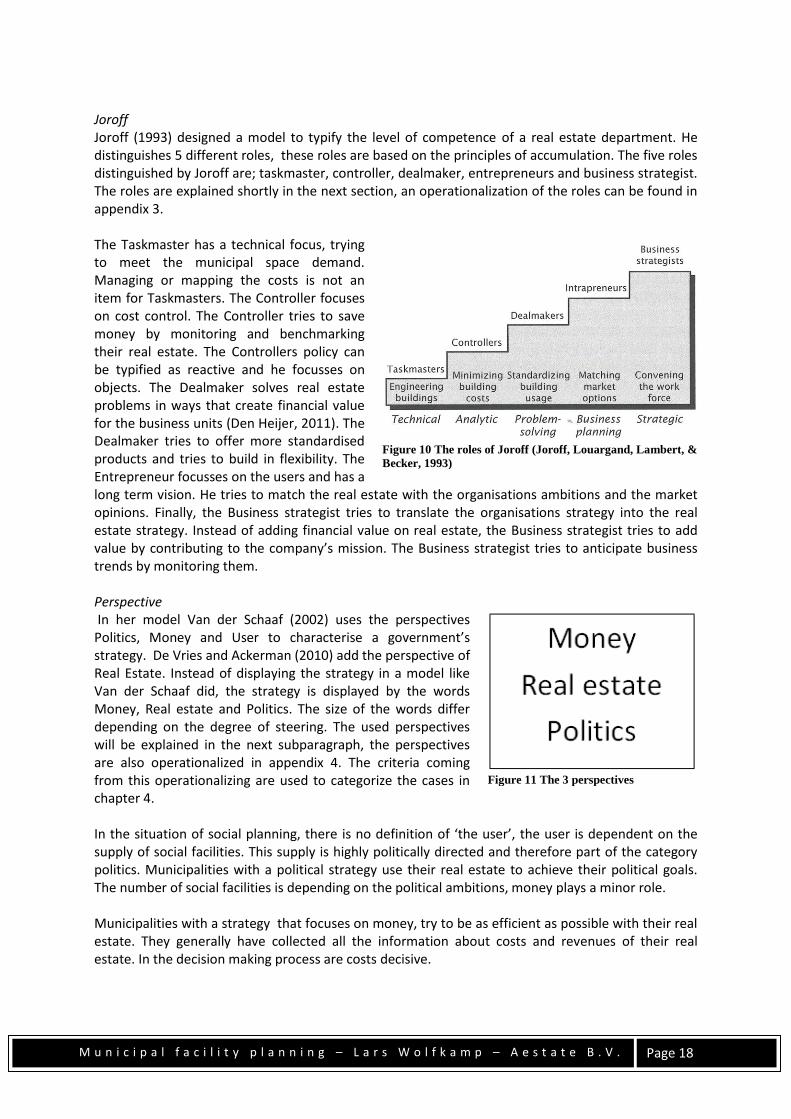
Joroff Joroff (1993) designed a model to typify the level of competence of a real estate department. He distinguishes 5 different roles, these roles are based on the principles of accumulation. The five roles distinguished by Joroff are; taskmaster, controller, dealmaker, entrepreneurs and business strategist. The roles are explained shortly in the next section, an operationalization of the roles can be found in appendix 3. The Taskmaster has a technical focus, trying to meet the municipal space demand. Managing or mapping the costs is not an item for Taskmasters. The Controller focuses on cost control. The Controller tries to save money by monitoring and benchmarking their real estate. The Controllers policy can be typified as reactive and he focusses on objects. The Dealmaker solves real estate problems in ways that create financial value for the business units (Den Heijer, 2011). The Dealmaker tries to offer more standardised products and tries to build in flexibility. The Entrepreneur focusses on the users and has a long term vision. He tries to match the real estate with the organisations ambitions and the market opinions. Finally, the Business strategist tries to translate the organisations strategy into the real estate strategy. Instead of adding financial value on real estate, the Business strategist tries to add value by contributing to the company’s mission. The Business strategist tries to anticipate business trends by monitoring them. Perspective In her model Van der Schaaf (2002) uses the perspectives Politics, Money and User to characterise a government’s strategy. De Vries and Ackerman (2010) add the perspective of Real Estate. Instead of displaying the strategy in a model like Van der Schaaf did, the strategy is displayed by the words Money, Real estate and Politics. The size of the words differ depending on the degree of steering. The used perspectives will be explained in the next subparagraph, the perspectives are also operationalized in appendix 4. The criteria coming from this operationalizing are used to categorize the cases in chapter 4. In the situation of social planning, there is no definition of ‘the user’, the user is dependent on the supply of social facilities. This supply is highly politically directed and therefore part of the category politics. Municipalities with a political strategy use their real estate to achieve their political goals. The number of social facilities is depending on the political ambitions, money plays a minor role. Municipalities with a strategy that focuses on money, try to be as efficient as possible with their real estate. They generally have collected all the information about costs and revenues of their real estate. In the decision making process are costs decisive.
Figure 10 The roles of Joroff (Joroff, Louargand, Lambert, &
Becker, 1993)
Figure 11 The 3 perspectives

m
M u n i c i p a l f a c i l i t y p l a n n i n g – L a r s W o l f k a m p – A e s t a t e B . V .
Page 19
When a municipal real estate strategy focusses on real estate, the size of the portfolio is a separately defined goal. There can be different reasons to focus on the size of the portfolio, one of the most common reasons is vacancy. Demand/supply The next characteristic to describe the municipalities, is the separation between municipalities that are demand or supply driven. A supply driven municipality takes the current supply as starting point and tries to optimize the occupancy. The biggest advantage is that there are little mutations within the portfolio and the costs can therefore be kept low. Most supply driven municipalities use the occupancy rate to determine whether a building can stay open. Demand driven strategies focus on the citizens’ demand, the portfolio Is changed depending on this demand. It is likely that a demand driven strategy leads to more mutations within the portfolio which leads to higher costs and thereby hard to predict. However, a demand driven strategy leads to a facility supply that meets the actual demand. The degree to which a strategy is demand or supply driven is shown by the red spot in figure 12. In some cases the municipalities are in the middle of a transition from supply to demand driven, this transition is imagined by a red dart instead of a spot. Scale level Every municipality organises its social policy on a different scale level. The policy can be organised on building-level, town-level, neighbourhood-level or municipality-level. The choice for a scale level influences the inequality between towns or neighbourhoods. The smaller the scale level, the bigger the problem of inequality is in common. A smaller scale level also makes it easier to match supply with the current demand. The scale level is imagined in figure 13 by marking the town or neighbourhood red.
3.4 Comparison 7S-model To check whether the used characteristics provide a clear picture of the municipalities, the criteria are compared to the 7S-model. Per ‘S’ is described what the S means, followed by a description of how the S is used in the characterisation of the municipalities. Not all S’s are used very specific in the characterisation. In the final section is explained why some S’s are described less in debt than other ones. Strategy The strategy is the way in which a municipality tries to achieve the formulated goals. The strategy can be seen as the action plan to achieve these goals. In this research the municipal strategy is described by comparing the steps of the DAS-framework to the steps they took to design their facility planning. Structure The structure is about the splitting and clustering from tasks within the organisation. Are they for example centralized or not? The structure is in this research characterised by describing whether there is a centralized real estate department or not.
Figure 12 Demand or
supply driven
Figure 13 Strategy per town (left) or per neighbourhood
(right)

m
M u n i c i p a l f a c i l i t y p l a n n i n g – L a r s W o l f k a m p – A e s t a t e B . V .
Page 20
Systems Systems represent the way in which is secured that the available resources are used in an effective and efficient way to achieve the municipal goals. In this research the three perspectives used to characterise the systems are Money, Real estate and Politics used to characterise the systems. It is important to notice that the perspectives are a tool to achieve the municipal goals instead of a separately defined goal. Staff Staff is about the capabilities of the municipal employees. These capabilities are not very specific described in this research. The only indication of Staff is given by describing whether there is a centralized real estate department or not. A centralized real estate department implies that the employees have knowledge about real estate and the way to manage a real estate portfolio. Skills The skills are the answer to the question: what are we good at? This research is not the place to judge whether a municipality is doing well or not, it is also not important for answering the research question. To answer the research question it is important to know which skills are used designing a facility planning. These skills are displayed by using the roles of Joroff. Style Style is about the way the management interacts with their employees. In fact, it is a characterisation of the culture within an organisation, the levels of authority and bureaucracy are taken into account. This research is not very specific about the style because it takes to much time to analyse a municipal culture and it is not very relevant for the research question. The citizens’ participation is used instead of the management style. Style in this case is not about the interaction between the management and the employees but about the interaction between the municipality and its citizens. Shared values The shared values are the municipal common norms and values. In the case of facility planning the shared values are displayed by the municipal role. A municipality that focuses on the poor people will have a high degree of control to secure that facilities are available for everybody. A more liberal municipality on the other hand, will have a lower degree of control because they believe that everybody has to take care of themselves. Conclusion The 7S-model contains 3 hard elements (strategy, systems en structure) and four soft elements (shared values, style, staff en skills). The description of the 7S’s illustrates that especially the hard elements are mapped out well. ‘Skills’ and ‘staff’ are the only soft elements that are mapped out well, the description of the shared values and the style are very minimal. The main reason is the limited available time and the relevance of the characteristics for the research. Because comparing the cases is an important part of the research, it is important that the style and the shared values are characterised in the same way as the other characteristics. It is almost impossible to characterise these soft elements without a broad research within the municipal organisations. Because ‘Culture’ is not the scope of the research, there is no time in the research planning to spend on the characterisation of the culture.

m
M u n i c i p a l f a c i l i t y p l a n n i n g – L a r s W o l f k a m p – A e s t a t e B . V .
Page 21
4 Case description In this chapter short versions of the case descriptions are presented. All characteristics of the analysis framework are explained, the large version of the case description can be found in appendices 6 to 11. The chapter ends with an overview of the conclusions in a table.
4.1 Description Assen 4.1.1 Features municipality Assen is a medium sized centre municipality in the north of the province Drenthe. At the moment Assen has a population of 68.000 residents. It is estimated that Assen will have a population of around 78.000 in 2030. Not only will Assen face a population growth, they will also face a serious growth in elderly. Till 2030 the number of elderly will rise with about 78 percent (CBS, n.d.). Assens social real estate portfolio is managed by a centralized real estate department (Van Hasselt, Sikma, & Zijlstra, 2009a). 4.1.2 Characteristics social policy Role Assen has a low degree of control and they steer with content. “If you want to simulate own initiative you have to lower the degree of control, but you have to support, facilitate and stimulate where the power is” (Koot, 2013). The municipality is willing to do a lot, but they will not take the initiatives, the initiative is left to the citizens. This is supported by their new funding policy, the fixed funds are abolished and substituted by a funding per initiative. The funding is offered for the initiative, not for the building to accommodate the initiative (Mathijsse & Oostmeijer-Oosting, 2013). “Not the community centre stimulates encounter, but the activities do” (Wolfkamp, Verslag bijeenkomst voorzieningenplanning gemeente Assen, 2013a). This quote from Poldy Koot (project leader ‘Wijkcentra en MFA’s’) proves that Assen is steering with content, initiatives are leading, the accommodation are supporting. Citizens’ participation The municipality has consulted the citizens during the design of the facility planning. At the beginning of the design the municipality has formulated the “Veranderagenda Zorg en welzijn 2012-2016” (Gemeente Assen, 2011b). This agenda is formulated in consultation with the citizens and shows the changes in facilities over the next years. Some meetings were organised during the designing process, these meetings gave the citizens the possibility to give their opinion about the required facilities. In this case can be spoken of consultation because the citizens were allowed to give their input, but the municipality was not obligated to use these input. 4.1.3 Characteristics real estate policy DAS-framework The figure on the next page shows the steps that are taken to get to the desired facility portfolio. Five different steps of the DAS-framework can be distinguished in the figure; current supply, current match, future demand, future supply and weigh alternatives and decide. The process started with organising the meetings for the “Veranderagenda Zorg en welzijn 2012-2016”, during these meetings, the future supply was broadly determined. The next step was the inventory of the current supply. During this step the current match was also made by determining the occupancy rate. With these data and the developments in the society a few alternatives were designed per building. The final step is to choose the best alternative. The used criteria are: is the building required in the

m
M u n i c i p a l f a c i l i t y p l a n n i n g – L a r s W o l f k a m p – A e s t a t e B . V .
Page 22
neighbourhood, are there alternatives, what is the value of the building, are there other parties interested? (Koot, 2013).
Joroff At the moment Assen acts as a Controller, despite the following ambition which is formulated in 2009. “To meet the upcoming complex real estate challenges over the next years and to add value with a proactive real estate management, the real estate department wants to develop the real estate management to the level of entrepreneur” (Van Hasselt, Sikma, & Zijlstra, 2009a). The statement from Albert Smit (member of the Assen municipal council, responsible for real estate and finance) illustrates that Assen still has a long way to go to become an Entrepreneur. He expressed the ambition to sell all the municipal real estate because it was not their core business to manage real estate. The municipality shows that they consider real estate as a disadvantage instead of something that adds value; this attitude does not fit in with the principles of an entrepreneur. The policy of Assen is object focussed and reactive, the only reason they draw up an inventory of their current supply is the design of the new facility planning. At the start of the design they had no information about their current supply (Wolfkamp, Verslag bijeenkomst voorzieningenplanning gemeente Assen, 2013a). Because the information was not available, it was impossible to design a policy that is integral because it is not clear which buildings are in good shape and which are not. Because of the lack of integral policy the decisions are taken on object- and neighbourhood level which may lead to inequality between the neighbourhoods. Perspective Assen is steering on costs and the size of the portfolio. The municipal perspective is illustrated by the goals that are formulated by the Council of Assen (Mathijsse & Oostmeijer-Oosting, 2013):
- Reduce the size of the social real estate portfolio - No new social real estate
So Assen tries to reduce the size of the portfolio. This perspective is chosen because Assen has too much real estate (compared to other municipalities) and the occupancy rate is very low (Koot, 2013). In addition, the municipality has invested a big part of their resources for Care in real estate. By selling a part of the real estate portfolio, they release a part of these resources (Koot, 2013). Demand/supply The ambition ‘no new social real estate’ illustrates the supply driven strategy, Assen will accommodate all the social activities in their current accommodations (Mathijsse & Oostmeijer-Oosting, 2013). Moreover, the municipality decides, based on a few criteria (is the building required in the neighbourhood, are there alternatives, what is the value of the building, are there other sides interested?) per building whether it is kept in the portfolio (Koot, 2013).

m
M u n i c i p a l f a c i l i t y p l a n n i n g – L a r s W o l f k a m p – A e s t a t e B . V .
Page 23
Scale level Assen designs a few alternatives and decides per building, but their policy is organised on a neighbourhood level: “On the basis of the neighbourhood analysis and conversations with partners is decided in which neighbourhood actions and a different way to deal with social real estate, are required” (Gemeente Assen, 2011a). The policy of Assen is therefore organised on a neighbourhood scale. 4.1.4 Problems Inconsistency between steering mechanisms and role A problem of Assens policy, is that they use the perspectives money and real estate. This is at odds with the intentions of the 5 programs from the Veranderagenda Zorg en welzijn 2012-2016. The agenda suggests a policy that is steering on content instead of hard factors like money and size of the portfolio. Instead of making decisions based on user’s interest, decisions are pragmatically based on costs. So there is inconsistency between the social ambitions and their real estate policy.
4.2 Description Borger-Odoorn 4.2.1 Features municipality Just like Assen is Borger-Odoorn located in the north of Drenthe. With a surface of almost 278 square kilometres is Borger-Odoorn one of the largest municipalities of The Netherlands. Despite this large surface, Borger-Odoorn has no more than 25.700 residents. Borger-Odoorn consists of 25 towns, the biggest town has more than 5.000 residents, the smallest just 31. Until 2030 the total population will decrease with a few percent and the population aged over 65 will increase with almost 45 per cent (CBS, n.d.). Borger-Odoorn has a centralized real estate department that manages the social real estate portfolio (Gemeente Borger-Odoorn, n.d.). 4.2.2 Characteristics social policy Role Borger-Odoorn’s policy has a high degree of control and they are steering with real estate. The steering with real estate is illustrated by the fact that the municipality does not offer funds for activities, but they offer the buildings and the citizens have the opportunity to organise activities in this buildings. Borger-Odoorn has a high degree of control, they use stringent norms to determine which facilities can stay open and which will be closed (Gemeente Borger-Odoorn, 2003a) Citizens’ participation The citizens were informed about the municipal policy, they had no input. De social department determined the budget and the norms to determine which facilities can stay open, the citizens were not involved in this process.

m
M u n i c i p a l f a c i l i t y p l a n n i n g – L a r s W o l f k a m p – A e s t a t e B . V .
Page 24
4.2.3 Characteristics real estate policy DAS-framework
Borger-Odoorn used 4 steps of the DAS-framework: current demand, current supply, current match and future supply. Borger-Odoorn started their facility planning with the goal to increase the quality of the facilities and reduce the size of the portfolio (Wolfkamp, 2013b), this is a broad description of the future supply. Then they grouped the towns into three classes and they zoned the municipality in six habitats. Every habitat got their own facilities. Then they determined the criteria to test the current supply, the criteria are shown in table 1.
Facilities Type kern Precondition
School Main town At least 50 students
Playgroups Main town Minimum occupancy of 6 day parts per week
Community centres
Na. - If possible link to an MFA (Multi-Functional Accommodation) - More than 50% users are from the own town - Minimum occupancy of 10 day parts per week
Gymnasiums Na. - Minimum occupancy of 10 day parts per week - Linked to an MFA
Sports fields Na. - should contain at least 1 practice field, 1 playing field + changing facilities
Libraries Na. - MFA has the right to a library for 0-12 year old - Based on the size of the town, Borger/Nieuw-Buinen/2e Exloermond /Valthermond has the right to get a library.
Table 1 The criteria to test the current facility supply (Gemeente Borger-Odoorn, 2004)
The criteria are meant to test the current demand, not the future demand. After the criteria were set, the municipality mapped out their current supply and tested this supply. One of the most important criteria is the occupancy rate, there is explicitly tested whether there is demand for a particular facility (Gemeente Borger-Odoorn, 2003b). Because after the test it turned out that some towns would not have any facilities left, the municipality decided to offer a custom made solution for these towns to sustain at least one meeting point. The budget for this meeting point is determined by norms based on the number of citizens. The described procedure is carried out per town. During this process, it turned out that the 6 determined zones were not in line with the perception of the citizens. In fact, the citizens experience only four habitats which means that the facility level in some parts of the municipality is unnecessarily high. The problem occurs because the municipality uses norms and standards without checking whether these norms and standard really meet the current demand.

m
M u n i c i p a l f a c i l i t y p l a n n i n g – L a r s W o l f k a m p – A e s t a t e B . V .
Page 25
The policy of Borger-Odoorn also involves a big risk. The analysis above shows that Borger-Odoorn focuses on the current demand, without taking the future demand into account. Borger-Odoorns arguments that not much importance can be attached to the predictions of the future demand. They argue that an increase in number of children in a town not always means that the occupancy of the school in town will rise because parents are free to send their kids to other schools in the region (for example because of religion reasons). An increase in elderly does not always mean that the demand for care increases because people are becoming ever healthier at more advanced ages. Joroff Borger-Odoorn is a Controller in the roles of Joroff. They are steering on real estate by testing their current supply against the mentioned criteria (Gemeente Borger-Odoorn, 2003a). The municipality tries to decrease the costs and has a strong object focus, their policy is also very pragmatic. Perspective The municipality has the ambition to increase the quality of the facilities and reduce the size of the portfolio (Wolfkamp, 2013b). The reason to reduce the real estate portfolio is a financial one. Calculations show that Borger-Odoorn needs occasional € 10.000.000,- to update all their social real estate and they furthermore need € 295.000,- per year for maintenance (Gemeente Borger-Odoorn, n.d.). That the municipality tries to reduce the cost by reducing the portfolio, is illustrated by the draft of the tested facilities. Per facility is calculated what the financial consequences are when the facility is preserved or abandoned (Gemeente Borger-Odoorn, 2007). Demand/supply The municipality has a focus on supply. The current portfolio is mapped out and tested against a few criteria without taking the citizens opinion into account. The municipality also determined to locate a MFA in every main town (Gemeente Borger-Odoorn, 2004). This is however no more than a clustering of the current facilities and is not inspired by the citizens demand. Scale level The municipal policy is organised on three different scale levels; municipality, town and building. The first level is the municipality level, Borger-Odoorn tries to spread the facilities throughout the municipality by addressing per facility in which kind of town it should be located (small town (outside), small town and main town). The next step is the testing of the facilities against the criteria on object level. Finally the municipality checks per town which facilities really disappear (Gemeente Borger-Odoorn, 2007). So the policy is in fact organised from big (municipality) to small (object) to middle (town). The citizens are very positive about the custom made policy that is offered. This policy gives them the opportunity to buy the facilities from the municipality. The policy is also very transparent which prevents the municipality from complaints about inequality afterwards.
4.3 Description Molenwaard 4.3.1 Features municipality Molenwaard is located in the province Zuid-Holland and is founded at the 1th of January 2013. This municipality is formed by the combining of the municipalities Graafstroom, Liesveld and Nieuw-Lekkerland. The population of Molenwaard is about 29.000 people, spread over 13 towns. The size of the towns varies from 700 to 8.700 citizens. The number of people is expected to remain the same over the next years, but a strong ageing is expected. This ageing is expected to be around 35 percent in 2020 and around 70 percent in 2030. Molenwaard is the only municipality in this research without a centralised real estate department.

m
M u n i c i p a l f a c i l i t y p l a n n i n g – L a r s W o l f k a m p – A e s t a t e B . V .
Page 26
4.3.2 Characteristics social policy Role Molenwaard is steering with content and has a low degree of control. “The municipal duties should be leading, the real estate has just a facilitating role” (Augustinus, Veuger, & Prins, 2013). This quote illustrates that the municipality is steering with content. That Molenwaard also has a low degree of control is illustrated by the next quotes:
- “Furthermore, it is the municipal vision to provide direction and leave the responsibility to the society (Gemeente Molenwaard, 2013).
- “The municipality on the other hand distance itself and focuses on providing direction instead of taking action. The municipality wants to support their citizens’ initiatives, an active citizen and facilitating municipality (Van Bunningen, Verslag bijeenkomst voorzieningenplanning gemeente Molenwaard, 2013a).
Citizens’ participation The citizens of Molenwaard were consulted during the design of the facility planning. By organising meetings and through the website www.geefmolenwaardkleur.nl were people able to express its views on the future of Molenwaard. The municipality is not committed to these advices, that is why it is consultation and not advising. 4.3.3 Characteristics real estate policy DAS-framework Molenwaard has used five steps of
the DAS-framework; current supply,
current match, step by step plan,
future demand and future supply.
The first step was inventorying the
current buildings in the portfolio,
the current users and the
occupancy rate. This information all
together forms the overview of the
current supply. Parallel with this
process, a review framework is
designed to test the current
portfolio and the new initiatives.
The first step to design this
framework, were meetings with the
citizens (Van Bunningen, 2013a).
During this meetings, the future
facility demand was inventoried.
Together with the current policy
and the developments in the population, the meetings form the input for the framework. The
framework is not a step by step plan, but it is used to get from the current supply to the future
supply.
Joroff In the ‘Strategic policy municipal real estate Molenwaard 2013’ (Augustinus, Veuger, & Prins, 2013), Molenwaard is described as a Taskmaster. They focus on optimising the occupancy rate, without steering on political goals. This focus is partly because Molenwaard is founded at the beginning of

m
M u n i c i p a l f a c i l i t y p l a n n i n g – L a r s W o l f k a m p – A e s t a t e B . V .
Page 27
this year from the combining of the municipalities Graafstroom, Liesveld and Nieuw-Lekkerland. Because the different municipalities had no real estate department, they had no insight in their current supply. Because Molenwaard has no real estate department as well, they still do not have inside in their real estate portfolio. Perspective Molenwaard is steering on politics and a little bit on money, the steering on politics is illustrated by the following quotes:
- “There will only be invested when the investment is supportive to the municipal goals” (De Waard, 2011)
- “Investments in facilities will only be made when they benefit to the municipal goals and target groups” (Augustinus, Veuger, & Prins, 2013).
In addition, the real estate department has to cut €50.000 per year, from 2016 it will even be €100.000 per year (Gemeente Molenwaard, 2013) Demand/supply The municipal policy is highly focused on the supply, this is illustrated by the steering on occupancy rate. The reason why they steer on occupancy rate is the lack of the required information about the current supply (Van Bunningen, Verslag bijeenkomst voorzieningenplanning gemeente Molenwaard, 2013a). In the ‘programmaplan voorzieningen’ the stated goal is to change their policy to a demand driven policy (Gemeente Molenwaard, 2013). A demand driven policy is at the moment impossible because it is not defined which demand they want to facilitate. Molenwaard is designing a framework to test the new initiatives which enables them to conduct a demand driven policy. Because the framework is not finished yet, they are still steering on supply. Scale level The facility policy is organised per town. “When the citizens’ demand and effort differ per town, we will accept an inequality in the level of facilities” (Gemeente Molenwaard, 2013). This quote illustrates the policy per town, otherwise the inequality would be impossible to happen. 4.3.4 Problems Molenwaard wants to use their real estate to achieve their political goals, that is why their policy is demand driven. At the same time they are steering on their occupancy rate. There is a mismatch with the demand driven strategy, because occupancy rate is a steering mechanism that is used for a supply driven strategy. Occupancy rate is not a good indicator to check whether political goals are achieved because there is no relation between these two variables. The municipality wants to use their social real estate to achieve the municipal goals. But because they are a Taskmaster, they have no insight in their real estate portfolio. When they do not know which real estate they own, it is impossible to use it in a strategic way to achieve the political goals. When they do not know what they own, they cannot use it efficient.
4.4 Description Oss 4.4.1 Features municipality Oss is a middle sized municipality in the north of Noord-Brabant. The most people in Oss, around 58.000, live in the biggest town that is also called Oss. The other 27.000 citizens are spread over the 21 other towns. This number of citizens is expected to rise with about 5 percent up to 2030. At the same time, the number of elderly will also rise, even with 62 percent up to 2030. Oss has a separated real estate department that is responsible for the real estate policy,

m
M u n i c i p a l f a c i l i t y p l a n n i n g – L a r s W o l f k a m p – A e s t a t e B . V .
Page 28
portfolio management, program management and object management. To design the facility planning, Oss created the project group Voorzieningenkaart 2030. 4.4.2 Characteristics social policy Role The policy of Oss has a low degree of control and they are steering on content. Oss believes that the citizens, professional institutions, entrepreneurs and associations will take the initiatives. That is why the policy is designed in coproduction (Meulenbroek, 2013). When the citizens will not take the initiative, coproduction will be impossible so the municipality has to come up with a plan. So the municipality has a low degree of control, but they are willing to higher the degree of control when the initiatives fail to happen. Oss perceives real estate to be a resource, not a goal itself. In line with this principle, the real estate from other players is also taken into account in the real estate policy. When the community argues that they are willing to perform the activity in the local café, the municipality is ok with that (Meulenbroek, 2013). Citizens’ participation One of the basic assumptions in the new facility policy, is to work in coproduction (Van Bunningen, 2013b). At the moment, the people of the project group Voorzieningenkaart 2030 are making an inventory of the demand for facilities in 2030 by entering into dialogue with citizens, professional institutions, entrepreneurs and associations. Main questions during this dialogues are:
- Which activities do we organise as town or neighbourhood in 2030? - Which people live in Oss in 2030 and where do they meet each other (at school? at the bar?)
By entering the dialogue with them, the project group Voorzieningenkaart 2030 tries to involve the people in the problems of ageing and the surplus of social real estate. By providing insight in the financing of the social facilities (funding, tax money, sponsor money and contribution), they are trying to make the citizens participants in the problems and the solutions. The next step is to find the optimal facility planning for the municipality and the citizens. During this process the citizens and the members of the project group are equal partners. 4.4.3 Characteristics real estate policy DAS-framework
During the design of their facility planning, Oss used four steps of the DAS-framework; current supply, future demand, step by step plan and future supply. The first step, current supply, is not really a step because Oss is continuously monitoring their current supply. They do not only monitor their own real estate, but also the real estate used as social facility of third parties. The occupancy rate is not a part of monitoring the current supply, because it is not considered to be a good indicator. What does a low occupancy rate mean? They better focus on social gains in relation to the real estate gains. The first real step in their facility planning, was mapping out the future demand. This is done in cooperation with citizens and by carrying out a trend analysis. In cooperation with the citizens is at first defined what the goal of the facility planning was. The municipality decides together with the citizens what the best way is to achieve these goals. The steps that are taken can be different per neighbourhood or town. The desired facility supply in 2030 is recorded in the ‘facility-map 2030’. The facility map is designed per area, the used areas are further described in the

m
M u n i c i p a l f a c i l i t y p l a n n i n g – L a r s W o l f k a m p – A e s t a t e B . V .
Page 29
section ‘scale level’. This map is used as a spot on the horizon and will, depending on the situation, also include an implementation plan. Joroff The real estate department of Oss acts like a Business strategist. The tasks of the real estate department are extended in 2003. From then on, they do not act like a Taskmaster anymore, but they act like a portfolio manager and advisor for the counsel. Some of their tasks are (afdeling vastgoedbedrijf Gemeente Oss, 2013):
- Implementing the policy - Portfolio management - Program management (facility-map) - Object management (information management, contracts, exploitation)
So the real estate department has more tasks than just managing the portfolio, they also focus on policy making. The real estate department also cooperates with other policy makers and the municipal council (Meulenbroek, 2013). This cooperation is because real estate is a resource and not a goal. The cooperation illustrates that Oss uses their real estate to add value and to achieve the municipal goals. This makes Oss a Business strategist. Because the real estate department constantly monitors the real estate portfolio, the decisions can be based on the short-term costs as well as on the long term costs. This leads to the best possible solution in the long term. Perspective Oss tries to find a balance between the perspectives money, real estate and politics. At the beginning of the facility planning were two goals set by the Council:
- EUR 6 million should be saved (because the costs of the real estate portfolio are higher than the available budget). The Council just stated that money should be saved, how this money is saved depends on the situation.
- Reduce the number of replacement investments With these goals in mind, the project group Voorzieningenkaart 2030 entered into dialogue with the citizens. The goal was to make them participants in the problems of the current real estate portfolio. Together they first try to answer the question: which criteria should be met by the final solution? When this question is answered, they together start the search for the best solution. During this search, the assessment should constantly be made between costs, size of the portfolio and the contribution to the municipal goals (Meulenbroek, 2013). The three perspectives are all displayed the same size, because the results of the assessment can defer per situation. Demand/supply On the one hand, the social policy of Oss is demand driven. The facility-map is used to map out the citizens’ demand. By designing a facility map per area is tried to let the supply perfectly meet the demand. On the other hand, Oss sticks to the current portfolio by formulating the goal to reduce the number of replacement investments (Meulenbroek, 2013). As a consequence of this goal, the facilities have to be located in the current portfolio or in the buildings of third parties. This precondition sometimes makes it impossible to meet the demand. So the current portfolio influences the future facility supply. Scale level The project group Voorzieningenkaart 2030 decided to organise their facility planning per area. There are 10 different areas (district Centre, Krinkelhoek, Mettegeupel, district Oss Noordwest, district Oss Zuid, district Ruwaard, district Schadewijk, town Berghem, town Herpen, town Megen, Haren, Macharen, town Ravenstein & town Lith) that are all represented by a town- or district-council. These 10 areas are determined by the project group, they are willing to revise the areas when the citizens are experiencing another zoning. Per facility the distinction is made between facilities with a municipal-, regional-, town- and neighbourhood reach (Noten, 2009). The risk of this distinction is

m
M u n i c i p a l f a c i l i t y p l a n n i n g – L a r s W o l f k a m p – A e s t a t e B . V .
Page 30
that the facility level defers per area (Van Bunningen, 2013b). Désirée Meulenbroek project manager of the Voorzieningenkaart 2030, recognizes the risk of inequality but she states that it rather is a chance instead of a risk. The chances are equal, whether they take this changes depends on the citizens’ dedication. So Oss accepts the inequality because they consider it a citizens problem. However, this inequality can be a problem for the municipality as well. The strategy per area can lead to sub-optimization because there is no coordination between the different plans.
4.5 Description Rotterdam 4.5.1 Features municipality Rotterdam is the biggest city of the province Zuid-Holland. The city consists of 14 sub-municipalities. With a population of 616.000, Rotterdam is the second largest municipality in The Netherlands. This population is expected to rise up to 640.000 in 2030. At the same time, the number of elderly will increase by 42 percent up to 2030. Since 2009, the municipal real estate (including the social real estate) is managed by an intern real estate company, the OBR (OntwikkelingsBedrijf Rotterdam). Meanwhile, the name is changed in SO (StadsOntwikkeling). Departments within SO are technical management, real estate development, social real estate, commercially & special real estate. 4.5.2 Characteristic social policy Role Rotterdam is steering with real estate and has a high degree of control. The intern real estate company makes an inventory of the desired facilities per sub-municipality. These facilities are all located in municipal real estate. So the municipality decides which facilities are required and these facilities are located in municipal real estate (Wolfkamp, 2013c). Citizens’ participation The citizens of Rotterdam are informed about the municipal social real estate policy. The demand for facilities is inventoried, but the opinion of the citizens is not taken into account. The demand is predicted on basis of the developments in the population and the municipal goals (OBR vastgoed / Maatschappelijk Vastgoed, 2010). During the expert meeting, Rotterdam expressed the ambition to involve the citizens in their policy but they also admitted that they did not know how they could do it. 4.5.3 Characteristic social policy DAS-framework
Rotterdam has taken all the steps of the DAS-framework besides the steps ‘current demand’ and ‘weigh alternatives and decide’. The steps that are described are all taken per sub-municipality. The first step was inventorying the current supply, the occupancy rate was also inventoried. The inventory of the current supply was a very time consuming process because there was no insight in

m
M u n i c i p a l f a c i l i t y p l a n n i n g – L a r s W o l f k a m p – A e s t a t e B . V .
Page 31
the current supply. Basic data like size and costs of the portfolio were unknown. The process was slowed because it was unclear which information was needed. Which information is needed depends on the demand the municipality wants to facilitate. At the same time as the supply was mapped out, the demand was inventoried on the basis of developments in the population and the political agenda. After that, a session is organised to check whether the demand and supply are fully mapped out. When fully mapped out, the demand and supply are matched. This displays the desired changes in the portfolio. The changes are established in a plan per sub-municipality. These plans are all together judged by the Council. After the test, an implementation plan per sub-municipality is designed. This plan contains a time schedule and a cost estimate (OBR vastgoed / Maatschappelijk Vastgoed, 2010). Joroff Rotterdam is a Controller. Their policy is focused on reducing their real estate costs. The policy is reactive and ad hoc, during the expert meeting the ambition was expressed to pursue a more proactive policy in the future (Wolfkamp, 2013c). This ambition is not yet implemented in the policy. Perspective Rotterdam tries to reduce their real estate portfolio in order to save money. This is illustrated by the next three quotes:
- “Finally we want to achieve more with the same resources by inventorying where clustering is possible, onoccupancy is reduced and double use increases which makes it possible to dispose accommodations” (OBR vastgoed / Maatschappelijk Vastgoed, 2010).
- “The clustering of facilities is expected to lead to financial benefits” (OBR vastgoed / Maatschappelijk Vastgoed, 2010)
- “The real estate policy focusses on efficiency and effectiveness” (Ontwikkelingsbedrijf Rotterdam, 2009)
Demand/supply The policy of Rotterdam is demand driven. But in contrast to the other demand driven municipalities, Rotterdam is not using the citizens demand but the demand from the different departments. Each departments formulates their demand, and SO tries to meet the demand. In case of the social facilities, the sub-municipality formulates an implementation plan. This plan is judged by the Council, the implementation plan is carried out by a core team. The core team consists of members of the sub-municipality, the social department and the real estate department. The problem in this case is the implementation plan, this plan is not based on citizens demand but is derived from the policy documents. It turned out that these policy documents were designed without the needed information because the supply that resulted from it did not meet the real demand. The citizens are not satisfied with the current supply and the occupancy rates are low, was the result of the expert meeting of Rotterdam. So Rotterdam wants to have a demand driven policy, but they do not know what the demand is. Scale level The policy of Rotterdam is organised per sub-municipality. Every sub-municipality designs their own facility planning (also see the section ‘DAS-framework’). These plans are all together judged by the council and subsequently implemented per sub-municipality (OBR vastgoed / Maatschappelijk Vastgoed, 2010).

m
M u n i c i p a l f a c i l i t y p l a n n i n g – L a r s W o l f k a m p – A e s t a t e B . V .
Page 32
4.6 Description Sluis 4.6.1 Features municipality Sluis is a small municipality in the south west of Zeeland, just near the Belgian border. Sluis consist of 15 towns, the smallest has 330 residents and the largest around 4.800. Sluis has a total population of 24.200. Just like many other small municipalities, Sluis is facing a drop in population. Up to 2020, this drop will be around 2 percent. Up to 2030 it will even be 11 percent. While the population decreases, the number of elderly will increases by 15 percent in 2020 and even 19 percent in 2030. Just like most of the other municipalities, Sluis has a centralised real estate department. 4.6.2 Characteristics social policy Role Sluis has a high degree of control and they are steering on content. The role of Sluis is illustrated by the following quotes from the ‘nota strategisch eigendommenbeleid’ (2012):
- “One meeting point per town, not necessarily owned by the municipality, can also be borrowed”
- “Activities are leading, the accommodations are not; activities can be carried out everywhere (For example in schools, bars, playgrounds)
- “Maintain the liveability in the towns. (Not the number of facilities determine the liveability, the activities do)
In the WMO-policy is determined that there should be a meeting point per town and the liveability should be maintained, so there is a high degree of control. Maintaining the liveability does not have to be achieved with real estate, Sluis is focussing on activities instead of real estate. Citizens’ participation The citizens have participated in the realisation of the facility planning. In Sluis were three meetings for the citizens and three meeting for the social organisations (Van Velzen, 2013). Citizens could also use the website www.nu2021.nl to talk about the upcoming problems like ageing and depopulation. During this meeting is tried to make the citizens aware of these problems. There were also discussions about the formulated alternatives. Sluis was very positive about participation, the biggest advantages were (Bakker, Icking, Thönissen, Vermeer, & Van der Wouw, 2011):
- Increased awareness about the developments in the population and the necessary changes in the facility supply
- The citizens’ input was used for the design of the alternatives. These quote illustrate the importance and the value of the input. The input was used, but is was non-binding input. Sluis categorised the input as Consultation in the Masterplan Voorzieningen Zeeuws-Vlaanderen 2011 (Bakker, Icking, Thönissen, Vermeer, & Van der Wouw, 2011). Despite these categorisation, Sluis considers the input Advising because they take the input very serious. Besides the advantages, Sluis also faces some disadvantages from the citizens’ participation. The citizens mainly focus on their own town and their own interest instead of the common interest. By involving them in the decision-making, they may overestimate their influence which increases the disappointment when the final plan is municipality oriented instead of town oriented. In that case, the citizens participation has a negative effect on the process instead of a positive effect. Although Sluis calls the citizens participation Consultation, they take their opinion more serious. When the citizens are opposed to closing facilities, Sluis will keep it open despite the result of their own research which shows that facilities do not influence the liveability.

m
M u n i c i p a l f a c i l i t y p l a n n i n g – L a r s W o l f k a m p – A e s t a t e B . V .
Page 33
4.6.3 Characteristics real estate policy DAS-framework Besides the steps ‘current demand’ and the ‘step by step plan’, all the steps of the DAS-framework are taken. The first step was inventorying the current policy papers, the citizens’ demand (see ‘citizens participation’) and the social factors (like population growth). These three inventories lead to the future demand. In the next step current supply was inventoried. It turned out that the facilities were not evenly spread over the municipality, in some towns were facing a surplus and other a shortage (Van Velzen, 2013). The current supply is compared to the future demand in the next step which results in the desired changes in the portfolio. The real estate department formulated four different alternatives to realise the changes. The alternatives are judged by 13 criteria (demographic task, social task, accessibility, support social cohesion, flexibility, cooperation, financial strength, innovations, quality, continuity, supports social policy, distinctiveness, public support) (Bakker, Icking, Thönissen, Vermeer, & Van der Wouw, 2011). The chosen alternative gives an indication of the future facility supply. The indication can be used as a spot on the horizon, it does not include a step by step plan.
Joroff Sluis acts like a Business strategist in their facility planning. They realise that they face a drop in population and ageing. Sluis designed a new facility planning to anticipate on these changes. In this plan is a strong link between the facilities and the liveability in the municipality. The facility planning is also demand driven and the opinion of the citizens is considered very important. Sluis uses their facility planning to increase the satisfaction of the citizens, so they use their social real estate to realise the municipal goals. The facility planning also takes the surrounding municipalities into account which illustrates that they focus on the whole market instead of their own facilities (Bakker, Icking, Thönissen, Vermeer, & Van der Wouw, 2011). Because the roles of Joroff are based on the principles of accumulation, acting like a Business strategist implies that Sluis is master of the skills from the previous roles. But Sluis acts like a Business strategist without insight the costs and benefits of their current supply. The portfolio is thereby unsalable and over-valued, so Sluis uses their real estate to realise municipal goals but they forget to manage their portfolio like a Controller (Van Velzen, 2013). Perspective Sluis uses their facility planning to achieve their political goals and save money. The next two quotes from the Structuurvisie (Gemeente Sluis, 2011a) illustrate that Sluis is steering on their political goals:
- “Maintaining the liveability in the towns. Liveability is in the first place quality of the social environment and social cohesion and in the second place the quantity of social facilities.
- “Achieve an affordable and high-quality social facility supply. The management is primary a task for the users”
So Sluis uses their real estate to achieve the political goals, maintaining the liveability with a high quality social facility supply. The second quote also pays attention to the affordability. In the Kadernota 2011-2015 (Gemeente Sluis, 2011c) ‘affordability’ is made concrete in the goal to save € 300.000 per year till 2015 and € 500.000 from 2015. The political and financial goals are also

m
M u n i c i p a l f a c i l i t y p l a n n i n g – L a r s W o l f k a m p – A e s t a t e B . V .
Page 34
displayed by the following quotes from the Nota Strategisch Eigendommenbeleid (Gemeente Sluis, 2012):
- “Maintain the liveability in the towns. (Not the number of facilities affect the liveability, the activities do)
- “An appropriate facility level for a reasonable price” Demand/supply The facility policy of Sluis is demand driven. This is illustrated by the used criteria to judge the alternatives (Bakker, Icking, Thönissen, Vermeer, & Van der Wouw, 2011):
- Demographic task - Social task - Accessibility - Support social cohesion - Flexibility - Cooperation - Financial strength - Innovations - Quality - Continuity - Supports social policy - Distinctiveness Public support
Just the criteria ‘continuity’ and ‘financial strength’ take the current supply into account. The other criteria all judge whether the alternative meets the future demand. So Sluis tries to meet the future demand, even if it means that the current portfolio has to change drastically. Scale level The facility planning is organised on municipal level, the implementation is organised on town-level (Bakker, Icking, Thönissen, Vermeer, & Van der Wouw, 2011). In the facility planning, the facilities are not offered on town level, but more on municipal, central level. Sluis strives for a facility supply that fits in with the nature and the size of the service area. Availability and distance are not the most important anymore, accessibility and balance in demand and supply are the most important. The implementation per town is chosen because of the social cohesion within the towns, people strongly focus on their own town.

Features municipal Social policy Real estate policy Problems Town/centre Developments population Organisational structure Role Citizens’
participation DAS-framework Joroff Perspective Demand/
A S S E N
Politics
Money
Real estate
1. Lack of integrality because information is unavailable 2. Social policy steers on content, real estate policy steers on money, real estate and supply
B O R G E R
Politics
Money
Real estate
3. Habitats were incorrect determined which cost extra time and money 4. Facility supply is based on current demand which may lead to a future mismatch
M O L E N W A A R D
Politics
Money
Real estate
5. Risk of inefficiency 6. Occupancy rate is not a good indicator for political goals 7.Taskmaster can’t steer on political goals because they don’t have the information 8. Can’t steer on demand when it’s unknown which demand should and which shouldn’t be facilitated
O S S
Politics
Money
Real estate
9. The risk of inefficiency because there is no integral plan
R O T T E R D A M
Politics
Money
Real estate
10. Rotterdam is steering on demand, but the demand they are using is not the citizens’ demand which leads to onoccupancy 11. Rotterdam doesn’t have information to design policy, which information is needed depends on the political goals which aren’t formulated well
S L U I S
Politics
Money
Real estate
12. The citizens have too much influence on the policy 13. Sluis tries to be an Business strategist but they don’t have enough information to be one

m
M u n i c i p a l f a c i l i t y p l a n n i n g – L a r s W o l f k a m p – A e s t a t e B . V .
Page 36
5 Cross-case analysis The cross-case analysis consists of two parts, the horizontal analysis and the reflection on the characteristics. In the horizontal analysis is tried to find the most common problems the municipalities face. These problems are derived from the problems that are explained in the case description. In the reflection on the characteristics, per characteristic is described whether it gives an explanation for the problems the municipalities face.
5.1 Horizontal analysis In the table below, all problems of the municipalities are given. The problems are derived from the case descriptions in chapter 4.
Problems Municipality
1. Lack of integral vision because information is unavailable Assen
2. Social policy steers on content, real estate policy steers on money ,real estate and supply
Assen
3. Habitats were incorrect determined which cost extra time and money Borger-Odoorn
4. Facility supply is based on current demand which may lead to a future mismatch
Borger-Odoorn
5. The risk of inefficiency because there is no integral plan Molenwaard
6. Occupancy rate is not a good indicator for political goals Molenwaard
7. Taskmaster can’t steer on political goals because they don’t have the information
Molenwaard
8. Can’t steer on demand when it’s unknown which demand should and which shouldn’t be facilitated
Molenwaard
9. The risk of inefficiency because there is no integral plan Oss
10. Rotterdam is steering on demand, but the demand they are using is not the citizens’ demand which leads to onoccupancy
Rotterdam
11. Rotterdam doesn’t have enough information to design policy, which information is needed depends on the political goals which aren’t formulated well
Rotterdam
12. The citizens have too much influence on the policy Sluis
13. Sluis tries to be a Business strategist but they don’t have enough information to be one
Sluis
Table 2 The problems of the 6 municipalities
All these problems could be brought back to five general causes: 1. The portfolio is not mapped properly 2. Lack of alignment between the social policy and the real estate policy 3. Wrong use of citizens participation 4. Lack of an integral plan 5. No clear vision which demand need to be facilitated and which not
Table 3 below shows how the causes are derived from the problems in table 2. The problem ‘Facility supply is based on current demand which may lead to a future mismatch’ is not taken into account because there are no other municipalities that face this problem.

m
M u n i c i p a l f a c i l i t y p l a n n i n g – L a r s W o l f k a m p – A e s t a t e B . V .
Page 37
Main causes for the problems Problems
Information about the current portfolio is unavailable Assen (1) Molenwaard (7) Rotterdam (11) Sluis (13)
Discrepancy between social policy and real estate policy Assen (2) Molenwaard (6)
Citizens’ opinion is not used in the right way Borger (3) Rotterdam (10) Sluis (12)
There is no integral plan on municipal level Molenwaard (5) Oss (9)
Municipality has not clearly determined which demand should be facilitated and which should not
Molenwaard (8) Rotterdam (11)
Table 3 The five main causes of the problems
The first problem is that most municipalities do not monitor their portfolio proactively, which disables them to design a good facility planning. Lack of monitoring the portfolio may lead to different problems. In case of Assen, the policy is designed on a small scale level because of the lack of information. For Rotterdam, Molenwaard and Sluis is it impossible to design a good facility planning because they do not have enough information. They first have to map out their portfolio, before they can start realizing their political goals. The lack of information slows down their policy. The second problem is the discrepancy between the real estate policy and the social policy. This problem shows up in Assen and Molenwaard. Both municipalities have described in their social policy that content is leading and real estate only facilitates. However, in their real estate policy they are steering on current supply. This has not yet led to problems, but in the long term this will lead to a real estate portfolio that does not fit with the social ambitions of the municipality. By steering on current supply, buildings with a low occupancy rate are closed, despite of the importance of the buildings for achieving social goals. The third problem is the wrong use of the citizens’ participation. For Rotterdam and Borger-Odoorn, the lack of citizens participation has led to a facility supply that does not meet the citizens demand. The supply does not meet the demand in Rotterdam, and the facilities were offered in the wrong place in Borger-Odoorn. In Sluis they took the opinion of the citizens too serious. Therefore they are carrying out a policy that does not support the political goals and is thereby not efficient. The fourth problem is inefficiency; Molenwaard and Oss face this problem. This problem is caused by the lack of an integral plan. Now they are trying to realise a high facility level per town, but they do not combine these plans with the plans of other towns. This means that it is possible that one town is building a new sport facility, while the neighbour town is closing same facility because of low occupancy. Inequality is also a possible risk of this method, but these municipalities do not consider inequality as a problem. They all get the same chances, this makes a low facility level a choice of the citizens. The last problem is a problem that Rotterdam and Molenwaard face, but that is an issue for all the municipalities. The municipalities forget to determine what their role should be in the facility planning. Molenwaard is therefore unable to steer on demand, although steering on demand is one of their ambitions. Molenwaard forgot to determine which demand they WANT to facilitate and which demand they HAVE to facilitate. Rotterdam does not have enough information to design a facility planning, before they can gather the necessary information they have to decide which information they need. The necessary information depends on the demand they WANT to facilitate.
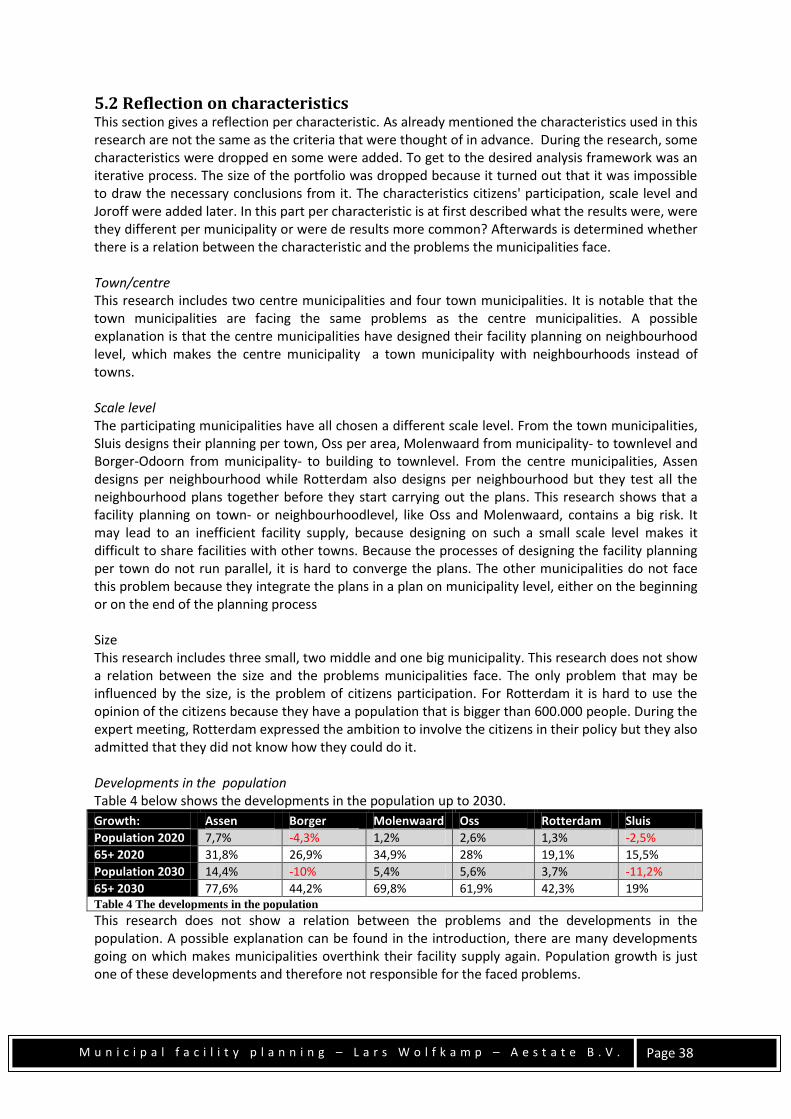
m
M u n i c i p a l f a c i l i t y p l a n n i n g – L a r s W o l f k a m p – A e s t a t e B . V .
Page 38
5.2 Reflection on characteristics This section gives a reflection per characteristic. As already mentioned the characteristics used in this research are not the same as the criteria that were thought of in advance. During the research, some characteristics were dropped en some were added. To get to the desired analysis framework was an iterative process. The size of the portfolio was dropped because it turned out that it was impossible to draw the necessary conclusions from it. The characteristics citizens' participation, scale level and Joroff were added later. In this part per characteristic is at first described what the results were, were they different per municipality or were de results more common? Afterwards is determined whether there is a relation between the characteristic and the problems the municipalities face. Town/centre This research includes two centre municipalities and four town municipalities. It is notable that the town municipalities are facing the same problems as the centre municipalities. A possible explanation is that the centre municipalities have designed their facility planning on neighbourhood level, which makes the centre municipality a town municipality with neighbourhoods instead of towns. Scale level The participating municipalities have all chosen a different scale level. From the town municipalities, Sluis designs their planning per town, Oss per area, Molenwaard from municipality- to townlevel and Borger-Odoorn from municipality- to building to townlevel. From the centre municipalities, Assen designs per neighbourhood while Rotterdam also designs per neighbourhood but they test all the neighbourhood plans together before they start carrying out the plans. This research shows that a facility planning on town- or neighbourhoodlevel, like Oss and Molenwaard, contains a big risk. It may lead to an inefficient facility supply, because designing on such a small scale level makes it difficult to share facilities with other towns. Because the processes of designing the facility planning per town do not run parallel, it is hard to converge the plans. The other municipalities do not face this problem because they integrate the plans in a plan on municipality level, either on the beginning or on the end of the planning process Size This research includes three small, two middle and one big municipality. This research does not show a relation between the size and the problems municipalities face. The only problem that may be influenced by the size, is the problem of citizens participation. For Rotterdam it is hard to use the opinion of the citizens because they have a population that is bigger than 600.000 people. During the expert meeting, Rotterdam expressed the ambition to involve the citizens in their policy but they also admitted that they did not know how they could do it. Developments in the population Table 4 below shows the developments in the population up to 2030.
Growth: Assen Borger Molenwaard Oss Rotterdam Sluis
Population 2020 7,7% -4,3% 1,2% 2,6% 1,3% -2,5%
65+ 2020 31,8% 26,9% 34,9% 28% 19,1% 15,5%
Population 2030 14,4% -10% 5,4% 5,6% 3,7% -11,2%
65+ 2030 77,6% 44,2% 69,8% 61,9% 42,3% 19% Table 4 The developments in the population
This research does not show a relation between the problems and the developments in the population. A possible explanation can be found in the introduction, there are many developments going on which makes municipalities overthink their facility supply again. Population growth is just one of these developments and therefore not responsible for the faced problems.

m
M u n i c i p a l f a c i l i t y p l a n n i n g – L a r s W o l f k a m p – A e s t a t e B . V .
Page 39
Organisational structure From all the participating municipalities, Molenwaard is the only one that does not have a centralized real estate department. This research does not prove that there is a link between the existence of a centralized real estate department and the faced problems. Although Molenwaard faces more problems (four) than the other municipalities (two or three), these problems are the same as the other municipalities face and can therefore not be linked to the existence of a centralized real estate department. Role Four (Sluis, Assen, Molenwaard and Oss) of the municipalities are steering on content, for which only Sluis has a high degree of control. Rotterdam and Borger-Odoorn also have a high degree of control but they are steering on real estate. Assen and Molenwaard are the only municipalities facing problems with their role (see also section 5.1). These problems emerge because the role they want to play is not expressed in the real estate policy. So the role itself is not the problem, the mismatch between the role and the real estate policy is. Citizens’ participation Rotterdam and Borger-Odoorn have only informed the citizens about their facility planning. The citizens of Assen and Molenwaard were consulted. Sluis was advised by their citizens, while Oss designed their policy in coproduction. The municipalities that only informed their citizens, both face the problem that their supply does not meet the demand. The municipalities that are using the opinion of citizens, do not face this problem. Sluis is also facing a problem with their citizens participation. They gave their citizens so much influence, that it negatively influenced the design of the facility planning. Because they were advised by the citizens, they were forced to use the input. DAS-framework All the municipalities have taken different steps from the DAS-framework, de results are shown in table 5. Steps DAS: Assen
Borger Molenwaard Oss Rotterdam Sluis
Current demand
Future demand
Current match
Future match
Weigh alternatives
Current supply
Step by step plan
Future supply Table 5 The steps of the DAS, compared to the steps the municipalities have taken
This table shows that most of the municipalities have at least taken four steps of the DAS-framework; future demand, current supply, step by step plan and future supply. The level of detail and the quality differs per municipality. Some municipalities only count their buildings, while others have mapped out the maintenance costs up to 2040. It is also notable that five municipalities have made the current match, but only one municipality has determined the current demand. The current match is therefore made by looking at the occupancy rate. Although the future demand is determined by five municipalities, only two of them made the future match. The step ‘weigh alternatives and decide’ is only taken by two municipalities. The problems that the municipalities face, cannot be explained by the steps of the DAS-framework. The main reason is that the framework implies a step, which is not shown in the framework. This is the step between the current demand and the future demand. Before the future demand can be determined, the municipality has to decide which demand they WANT to facilitate. To reflect this

m
M u n i c i p a l f a c i l i t y p l a n n i n g – L a r s W o l f k a m p – A e s t a t e B . V .
Page 40
problem, a ninth step should be added to the framework. This step illustrates the moment a municipality decides which demand they WANT to facilitate.
Figure 14 The ninth step of the DAS-framework
When this step is added to the Framework, the problems of Rotterdam and Molenwaard can be explained. Both municipalities have the ambition to steer on demand, but they forgot to determine which demand they want to facilitate. Joroff Three of the municipalities (Assen, Borger-Odoorn and Rotterdam) are a Controller, Molenwaard is a Taskmaster and Sluis and Oss are Business strategists. There is a clear link between the problems municipals face and their position on the scale of Joroff. The municipalities that are positioned low on the scale of Joroff have a policy that is reactive, which means that they do not proactively monitor their portfolio. At the moment they start with their facility planning, the first step is to map out their portfolio, before they can start realizing their political goals. The lack of information slows down their policy. Borger-Odoorn is a Controller like Rotterdam and Assen, but they do not face the same problems as these municipalities. A possible explanation is that Borger-Odoorn started the design of their facility planning already in 2003 and that was however a time consuming process. Because the process was time consuming, there was enough time to gather the right information. Sluis is a Business strategist but also faces the problem that they have not mapped out their portfolio. The explanation is, that Sluis is not a real Business strategist. They have the ambition to be one, but they fail because they do not have enough information. Sluis is actually a combination of an Business strategist and a Controller. Oss is the only municipality that is not facing any information problems. Oss is not only monitoring the short term cost, but also the long term maintenance costs. The strength of Oss is that they continuously monitor the data of their portfolio (size, maintenance planning, maintenance costs, rent etc.). This enables them to react quickly when necessary. Perspective Rotterdam, Assen and Borger-Odoorn are steering on politics and money. Molenwaard and Sluis are mainly steering on politics and partly on money, while Oss is steering on money, real estate and politics. There are two municipalities that face problems that are caused by the perspective, Molenwaard and Assen. However, these problems are not caused by the perspective itself, but because the perspective does not fit with the social policy or because the information about the perspective is unavailable. So it is impossible to say which perspective is better, but it is important that there is linkage between the perspective and the social policy. Demand/supply There are two municipalities with a supply driven policy, Borger-Odoorn and Assen. Molenwaard is making the transition from supply- to demand driven policy and the other municipalities are demand driven. Rotterdam, Assen and Molenwaard are all facing problems. Rotterdam has a demand driven policy, but the citizens are not involved in the policy. This makes it impossible to steer on the real demand. Because they are not steering on the real demand, they face onoccupancy and citizens are unhappy with the supply. The policy of Assen is supply driven, while they determined in their social

m
M u n i c i p a l f a c i l i t y p l a n n i n g – L a r s W o l f k a m p – A e s t a t e B . V .
Page 41
policy that they are steering on content. Steering on demand means steering on occupancy rate, although occupancy rate is not a good indicator to determine whether political goals are achieved. Molenwaard is facing the same problems as Assen. They therefore want to make the transition to a demand driven policy. At the moment it is impossible to make the transition because Molenwaard has not yet decided which demand they want to facilitate.

m
M u n i c i p a l f a c i l i t y p l a n n i n g – L a r s W o l f k a m p – A e s t a t e B . V .
Page 42
6 Conclusions & recommendations This chapter starts with answering the main research question. Then the recommendations for the municipalities are given, followed by recommendations for further research. The chapter ends with a description whether the higher objective is achieved.
6.1 Answer main question The total social real estate portfolio in The Netherlands is 83,5 million square meters, almost 37 percent of the portfolio is owned by the Dutch municipalities. The financial crisis, the decentralization(s) and the changes in the WMO and a few demographic developments have changed the demand for facilities. These developments change the way municipalities are dealing with their social real estate. A facility planning can be a useful tool to reorganise the facility supply. To trace how municipalities respond to these developments, the next research question is formulated.
How do municipalities decide which facilities they should and which they should not facilitate by real estate, and which difficulties are they facing during this process?
The first step in the research was a literature review. The goal of the literature review was to determine some characteristics based on which the policy of the municipalities can be described. The characteristics can be classified in; features municipality (size, town/centre, scale level, developments in the population, ageing and the organisational structure), characteristics of the social policy (role and citizens’ participation) and characteristics of the real estate policy (steps that are taken to design the facility planning, Joroff, demand/supply driven and the perspective). Six municipalities are described on basis of these characteristics; Assen, Borger-Odoorn, Molenwaard, Oss, Rotterdam en Sluis. The analysis to answer the first part of the question showed that every municipality decides in a different way which facilities they want to facilitate, they also use different steering mechanisms. To make the policy of the municipalities comparable, the steps they have taken to reach the policy are compared to the DAS-framework. It turned out that most of the municipalities have at least taken four steps of the DAS-framework; future demand, current supply, step by step plan and future supply. The level of detail and the quality differs per municipality. Some municipalities only count their buildings, while others have mapped out the maintenance costs up to 2040. It is also notable that five municipalities have made the current match, but only one municipality has determined the current demand. The current match is therefore made by looking at the occupancy rate. Although the future demand is determined by five municipalities, only two of them made the future match. The step ‘weigh alternatives and decide’ is only made by two municipalities. This illustrates that most municipalities do not design alternatives. They determine the future demand and try to design the solution without weighing more alternatives or matching it with the current supply. To answer the second part of the question, the cases are analysed and an attempt was made to explain the problems the municipalities face by comparing the characteristics. All the problems the municipalities face can be brought back to five main causes:
- The portfolio is not mapped properly - Lack of alignment between the social policy and the real estate policy - Wrong use of citizens participation - Lack of an integral plan - No clear vision which demand need to be facilitated and which not

m
M u n i c i p a l f a c i l i t y p l a n n i n g – L a r s W o l f k a m p – A e s t a t e B . V .
Page 43
6.2 Recommendations for the municipalities In addition to the main research question, the following objective is formulated:
Provide municipalities insight in the way other municipalities design their facility planning and the difficulties of similar municipalities and thereby provide guidance for designing their facility planning.
In the previous section is described how the municipalities have designed their facility planning, there is also described which problems they have faced. In this section recommendations are given to prevent municipalities from facing the same problems:
- Map the portfolio and monitor proactively, every municipality has to be at least a Dealmaker on the levels of Joroff. Other municipalities should follow the example of Oss, this municipality monitors the short- and the long term costs of the portfolio.
- Citizens’ opinion will add value if taken into account that they argue form their own interest. - Make a master plan instead of designing a facility planning per neighbourhood. - Be consistent in the link between the real estate policy and the social policy. The steering
mechanisms in the real estate policy should be consistent with the social policy goals. The occupancy rate for example, is not a good indicator to check whether political goals are achieved.
- Before starting with facility planning, two question have to be answered: o Which demand do I HAVE to facilitate? o Which demand do I WANT to facilitate?
The answer to the first question is known, the only demand the municipalities have to facilitate by real estate is; Centre for Youth and Family, Sport accommodations (inside and outside), Gymnasiums, Primary education and Secondary education (Van Bunningen & Van dalen, 2013). This does not mean municipalities need to own the required real estate. They only are obligated to provide it! The answer to the second question is the starting point of the design of the facility planning. Without answering this question, it is impossible to design a good facility planning in which supply and demand are aligned. Apart from the specific recommendations, it is generally recommended to use a more specified framework instead of the common DAS-framework. This specified framework, partly based on this research, is designed for the guidebook for social facilities and can be found in on the next page. The new framework compensates the shortcomings of the DAS as described in the section ‘DAS-framework’ in chapter 5.2. The new framework pays attention to the stakeholders and includes the moment of formulating the goals and determining which demand they WANT to facilitate.

m
M u n i c i p a l f a c i l i t y p l a n n i n g – L a r s W o l f k a m p – A e s t a t e B . V .
Page 44
Figure 15 The new, more specified framework (Bouwstenen voor Sociaal, 2013)
6.3 Recommendations for further research This research focuses on the hard elements of the municipalities facility planning. The soft elements like culture are not described in sufficient detail. Further research could focus on the culture of the municipalities organisation and try to find a relation between the culture and the problems they face. It is also possible to carry out a survey on basis of the results of this research. This research focuses on just 6 municipalities. These municipalities became partners with Bouwstenen voor Sociaal because they were facing difficulties with their facility planning and are therefore not representative for all Dutch municipalities. Further research can focus on other municipalities. There might be municipalities that face problems which cannot be explained by the characteristics used in this research. It is also possible to look at municipalities which do not face problems with their facility planning to learn how municipalities can prevent from facing problems.
6.4 Higher objective Besides the research objective, there is also a higher objective, the higher objective of this research is:
Optimizing the process of designing a social facility planning through the guidebook for social facilities
This objective is achieved during the research. The reports of the expert meetings are used as input for the guidebook. I also wrote a few pieces that were published in the book. My whole report was used to write their part of the book. The book is finished and has been handed to the minister of Housing Stef Blok, on the 5th of December.

m
M u n i c i p a l f a c i l i t y p l a n n i n g – L a r s W o l f k a m p – A e s t a t e B . V .
Page 45
Figure 16 The cover of the Guidebook for social facilities (left) and the moment the book was handed over to
Minister Blok (photo: Piet Scheerhoorn)

m
M u n i c i p a l f a c i l i t y p l a n n i n g – L a r s W o l f k a m p – A e s t a t e B . V .
Page 46
7 Discussion This chapter starts with the limitations of the research. It is explained what the limitations are and why the limitations exist. The final section of this research is the reflection, in this section I will gave a reflection about the research process.
7.1 Limitations The first limitation of this research, is that only six municipalities are taken into account. These municipalities have participated in the expert meetings organised by Bouwstenen voor Sociaal because they are facing difficulties with their facility planning. The municipalities are therefore not relevant for all the municipalities in The Netherlands. The municipal culture is not taken into account in this research. The problems are explained from the hard elements of the organization and may therefore overlook explanations that come from the soft elements. The limited time and the scope of this research are the reasons the culture is not taken into account. This research is and empirical case study. Big disadvantage of this research is the possibility that not all the problems are taken into account. It is possible that other municipalities face problems that are totally different from the problems these municipalities face. I also could have carried out a more broad quantitative research like an survey or a qualitative research that evaluates the municipal policy. However I chose to carry out an empirical case study because it gave me the opportunity to cooperate with Bouwstenen voor Sociaal. This gave me the opportunity to look behind the scenes of the municipal facility planning. Without their help, I would not have gathered the information that I got now. In conclusion, a unique opportunity! It might have been possible to make a combination between a qualitative and a quantitative research but it was impossible because of the limited time available.
7.2 Reflection The research process went according to plan. The only problem was the municipal feedback. After I finished my case description, I send my report to the municipalities to check if they agreed with my interpretation of their policy. The feedback took more time than I had expected. Sometimes it took over 6 weeks to get the report back which slowed down the research process.
Another problem during the research was the use of the DAS-framework. In the beginning of the research, it was the plan to explain the problems by comparing the steps of the DAS-framework to the step the municipalities took. In practice it turned out that this method was not applicable because it made not clear to what extent a step was taken. Current supply may mean that just the buildings were counted but it may also mean that the supply was broadly mapped out, including buildings of third parties. How specific a step is taken also depends on the municipal goals, it is not a rule that it is bad to take a step not fully. A municipality that is steering on content should also map out the buildings of third parties because they also locate facilities in their buildings. While a municipality that is steering on real estate does not have to map out the real estate of third parties because it only uses her own real estate.

m
M u n i c i p a l f a c i l i t y p l a n n i n g – L a r s W o l f k a m p – A e s t a t e B . V .
Page 47
Bibliography 7S model. (n.d.). 7s-Model van McKinsey. Retrieved from http://www.7smodel.nl/ afdeling vastgoedbedrijf Gemeente Oss. (2013). uitvoeringsnota maatschappelijk vastgoed.
Gemeente Oss. Arkesteijn, M., De Jonge, H., Den Heijer, A., Vande Putte, H., De Vries, J., & Van der Zwart, J. (2009).
Corporate Real Estate Management - Designing an Accommodation Strategy. Delft: Department of Real Estate & Housing.
Augustinus, H., Veuger, J., & Prins, R. (2013). Strategische beleidskaders gemeentelijk vastgoed gemeente Molenwaard 2013 . Sleen: Corporate Real Estate Management.
Bakker, E., Icking, M., Thönissen, M., Vermeer, M., & Van der Wouw, D. (2011). Masterplan Voorzieningen Zeeuws-Vlaanderen. Amersfoort: Hospitality consultants.
Bank, L., & Den Heijer, A. (2004). Inrichting van de (universitaire) CRE-organisatie: keuzes en overwegingen. Real Estate Magazine, 37.
Bouwstenen voor sociaal. (2012). Positionpaper maatschappelijk vastgoed. De bouwsteen, 1-2. Bouwstenen voor Sociaal. (2013). Reisgids maatschappelijke voorzieningen. Tilburg: Gianotten. businessdictionary.com. (n.d.). McKinsey 7S Model. Retrieved from
http://www.businessdictionary.com/definition/McKinsey-7S-Model.html CBS. (2012, Januari 25). Krimpgemeenten: meer ouderen en westerse allochtonen. Retrieved from
Website van het CBS: http://www.cbs.nl/nl-NL/menu/themas/dossiers/nederland-regionaal/publicaties/artikelen/archief/2012/2012-krimpgemeenten-art.htm
CBS. (n.d.). Regionale prognose bevolkingsopbouw; 2011-2040. Retrieved from Website van Centraal Bureau voor de Statistiek: http://statline.cbs.nl/StatWeb/selection/default.aspx?VW=T&DM=SLNL&PA=81273NED&D1=0&D2=0&D3=0%2c31%2cl&D4=398&D5=0%2cl&HDR=T&STB=G1%2cG2%2cG3%2cG4
De Vries, J. (2007). Presteren door vastgoed. Delft: Eburon. De Waard. (2011). Nota uitgangspunten Accommodatiebeleid. Den Heijer, A. (2011). Managing the university campus. Delft: Eburon Academic Publishers. Gemeente Assen. (2011a). Assenaren voor elkaar. Gemeente Assen. (2011b). Visie op zorg en welzijn 2012-2016. Gemeente Borger-Odoorn. (2003). Kern en kader - nota 1. Gemeente Borger-Odoorn. Gemeente Borger-Odoorn. (2003a). Kern en Kader- nota 1. Gemeente Borger-Odoorn. (2003b). Kern en kader: inventarisatie per kern. Gemeente Borger-Odoorn. (2004). Kern en kader - nota 2. Gemeente Borger-Odoorn. Gemeente Borger-Odoorn. (2004). Kern en kader - nota 2. Gemeente Borger-Odoorn. (2007). Kern en kader - nota 3. Gemeente Borger-Odoorn. (n.d.). De gemeentelijke organisatie. Retrieved from Website van de
gemeente Borger-Odoorn: http://www.borger-odoorn.nl/bestuur-en-organisatie/gemeentelijke-organisatie.html
Gemeente Borger-Odoorn. (n.d.). Nota prioriteitstelling Mfa's primair onderwijs en peuterspeelzalen. Gemeente Molenwaard. (2013). Programmaplan voorzieningen: Vraaggericht organiseren in de
dorpen van Molenwaard. Gemeente Rotterdam. (2009). Statistische gegevens deelgemeente Pernis. Retrieved from Over
Pernis : http://www.rotterdam.nl/over_pernis_ Gemeente Schouwen-Duiveland. (n.d.). Visie Maatschappelijke Voorzieningen Schouwen-Duiveland.
Retrieved from http://www.schouwen-duiveland.nl/Inwoner/Zorg_en_Welzijn/Schouwen_Duiveland_Voor_Elkaar/Nieuws/Visie_Maatschappelijke_Voorzieningen_Schouwen_Duiveland
Gemeente Sluis. (2011a). Structuurvisie: Goed leven. Gemeente Sluis. (2011c). Kadernota samen kiezen 2012-2015. Gemeente Sluis. (2012). Nota Strategisch Eigendommenbeleid.

m
M u n i c i p a l f a c i l i t y p l a n n i n g – L a r s W o l f k a m p – A e s t a t e B . V .
Page 48
Jonge, H. d., Arkesteijn, M., Heijer, A. d., Putte, H. v., & Vries, J. d. (2008). Designing an accommodation strategy. Delft: TU.
Joroff, M., Louargand, M., Lambert, S., & Becker, F. (1993). Strategic Management of the Fifth Resource: Corporate Real Estate. Bingley: Emerald group.
Koot, P. (2013, oktober 31). Voorzieningenplanning gemeente Assen. (L. Wolfkamp, Interviewer) KvK. (n.d.). Rotterdam Prins-Alexander. Retrieved from Wesite van de Kamer van Koophandel :
http://www.kvk.nl/lokale-informatie/rotterdam/informatie-per-gemeente/gemeenten-r/rotterdam-prins-alexander/
Linders, G. (2009, april 23). Hoe plan je maatschappelijke voorzieningen? Retrieved from Wesite van de VNG: http://pdf.swphost.com/logacom/Bredeschool2009/26._Hoe_plan_je_maatschappelijke_voorzieningen.pdf
Mathijsse, A., & Oostmeijer-Oosting, I. (2013, september 25). Brief aan de raad: Toekomstig beheer en exploitatie wijkgebouwen en beëindiging subsidies en bijdragen aan wijkverenigingen en bewonersoverleggen. Assen.
Meulenbroek, D. (2013, november 11). Voorzieningenplanning gemeente Oss. (L. Wolfkamp, Interviewer)
Moerkamp, J. (2012, juli 27). Dorp kan zonder voorzieningen. Binnenlands bestuur, pp. 10-12. Muskee, M. (2013). Maatschappelijk vastgoed in de uitverkoop. VNG Magazine, 15-17. Noten, P. (2009). Integraal Voorzieningenbeleid Oss “Vooruitzien in Voorzieningen”. Gemeente Oss. OBR vastgoed / Maatschappelijk Vastgoed. (2010). Procesaanpak voorzieningenplannnen 2010.
Gemeente Rotterdam. Ontwikkelingsbedrijf Rotterdam. (2009). Vastgoed katalysator voor ontwikkeling: meerjaren
perspectief Rotterdams vastgoed. Sluiter, R. (2009). Maatschappelijk vastgoed verantwoord gepositioneerd! Master thesis
vastgoedkunde Rijksuniversiteit Groningen. Twynstra Gudde. (2009). Onderzoek Professioneel gemeentelijk vastgoed . Twynstra Gudde. Van Bunningen, E. (2013a). Verslag bijeenkomst voorzieningenplanning gemeente Molenwaard.
Amersfoort: Bouwstenen voor Sociaal. Van Bunningen, E. (2013b). Verslag bijeenkomst voorzieningenplanning gemeente Oss. Amersfoort:
Bouwstenen voor Sociaal. Van Bunningen, E., & Van dalen, M. (2013). Takenpakket met betrekking tot maatschappelijke
doelen. Van Hasselt, C., Sikma, E., & Zijlstra, F. (2009a). Contourennota Vastgoed 2009 – 2013. Van Leent, M. (2012). Voorzieningen, plannen of loslaten? Real Estate magazine, 26-29. Van Soest, K., & Van de Loo, H. (2008). Participatieladder gemeente Boxmeer 2008. Van Velzen, D. (2013). Verslag bijeenkomst voorzieningenplanning gemeente Sluis. Amersfoort:
Bouwstenen voor Sociaal. Veuger, J. (2013). Barometer maatschappelijk vastgoed. Visie en ondrzoeken. Hanze Kenniscentra.
University of Applied Sciences. Weber, A., & Doelen, A. (2010). Organiseren & managen: Het 7S-model toegepast.
Groningen/Houten: Noordhoff Uitgevers. Weidum, J. (2012, januari 9). Kans op werk vanuit de bijstand verschilt sterk per gemeente. Retrieved
from website van het Centraal Bureau voor de Statistiek: http://www.cbs.nl/nl-NL/menu/themas/arbeid-sociale-zekerheid/publicaties/artikelen/archief/2012/2012-3540-wm.htm
Wolfkamp, L. (2013a). Verslag bijeenkomst voorzieningenplanning gemeente Assen. Amersfoort: Bouwstenen voor Sociaal.
Wolfkamp, L. (2013b). Verslag bijeenkomst voorzieningenplanning gemeente Borger-Odoorn. Amersfoort: Bouwstenen voor Sociaal.
Wolfkamp, L. (2013c). Verslag bijeenkomst voorzieningenplanning gemeente Rotterdam. Amersfoort: Bouwstenen voor Sociaal.