murray goulburn 2018 half year results goulburn 2018 half year results 7 february 2018 page 2...
TRANSCRIPT

Murray Goulburn 2018 half year results7 February 2018
Page 2
Forward looking statementsThis presentation has been prepared by Murray Goulburn Co-operative Co. Limited (MG). The information contained in this presentation is for informational purposes only and is not investment or financial product advice and is not intended to be used as the basis for making an investment decision. This presentation has been prepared without taking into account the investment objectives, financial situation or particular needs of any particular person.
No representation or warranty, express or implied, is made as to the fairness, accuracy, completeness or correctness of the information, opinions and conclusions contained in this presentation. To the maximum extent permitted by law, none of MG, its controlled entities, their directors, employees or agents, nor any other person accepts any liability, including, without limitation, any liability arising out of fault or negligence, for any loss arising from the use of the information contained in this presentation. In particular, no representation or warranty, express or implied, is given as to the accuracy, completeness or correctness, likelihood of achievement or reasonableness of any forecasts, prospects or returns contained in this presentation. Such forecasts, prospects or returns are by their nature subject to significant uncertainties and contingencies.
Before making an investment decision, you should consider, with or without the assistance of a financial adviser, whether an investment is appropriate in light of your particular investment needs, objectives and financial circumstances. Past performance is no guarantee of future performance.
Non-International Financial Reporting Standards (Non-IFRS) informationThis presentation makes reference to certain non-IFRS financial information. Management uses this information to measure the operating performance of the business and it has been presented as this may be useful for investors. This information has not been reviewed by the MG group’s auditor. Forecast information has been estimated on the same measurement basis as actual results.
Disclaimer
Page 3
1H18 half year in review
1. Normalised result excludes deviations from the Profit Sharing Mechanism. 2. As announced on 27 October 20173. All references to FMP refer to Available weighted average Southern Milk Region Farmgate Milk Price. For the purposes of the Profit Sharing Mechanism the Actual Weighted Average Southern Milk Region FMP for 1H18 of $4.92 per kgms is used.4.As announced on 22 August 2017
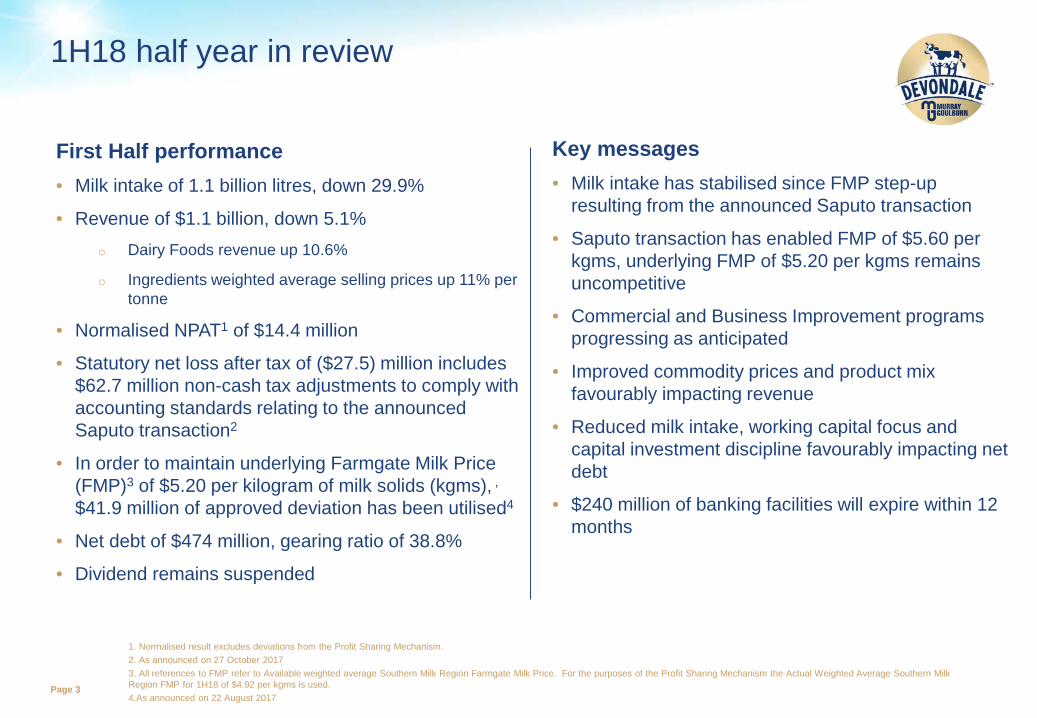
First Half performance• Milk intake of 1.1 billion litres, down 29.9%
• Revenue of $1.1 billion, down 5.1%o Dairy Foods revenue up 10.6%
o Ingredients weighted average selling prices up 11% per tonne
• Normalised NPAT1 of $14.4 million
• Statutory net loss after tax of ($27.5) million includes $62.7 million non-cash tax adjustments to comply with accounting standards relating to the announced Saputo transaction2
• In order to maintain underlying Farmgate Milk Price (FMP)3 of $5.20 per kilogram of milk solids (kgms), ,
$41.9 million of approved deviation has been utilised4
• Net debt of $474 million, gearing ratio of 38.8%
• Dividend remains suspended
Key messages• Milk intake has stabilised since FMP step-up
resulting from the announced Saputo transaction
• Saputo transaction has enabled FMP of $5.60 per kgms, underlying FMP of $5.20 per kgms remains uncompetitive
• Commercial and Business Improvement programs progressing as anticipated
• Improved commodity prices and product mix favourably impacting revenue
• Reduced milk intake, working capital focus and capital investment discipline favourably impacting net debt
• $240 million of banking facilities will expire within 12 months
Page 4
Saputo transaction
1. Subject to completion adjustments including for movements in working capital in the business.2. For an ordinary resolution to be passed, it requires more than 50% of the votes cast to be in favour of the resolution.
Overview Expected timetable
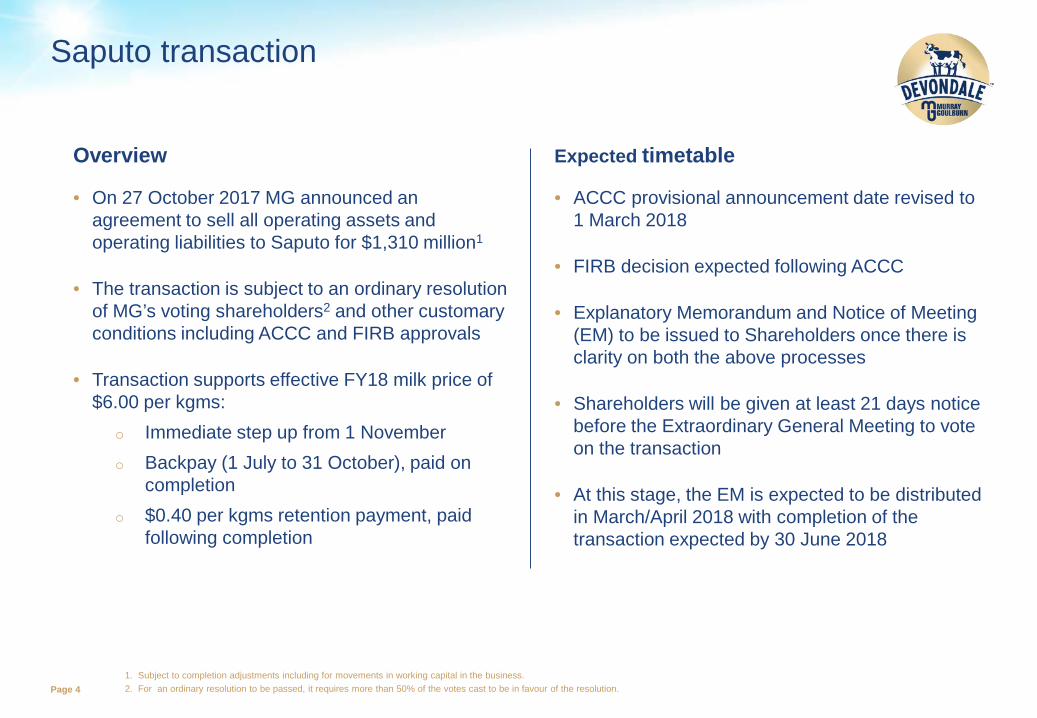
• ACCC provisional announcement date revised to 1 March 2018
• FIRB decision expected following ACCC
• Explanatory Memorandum and Notice of Meeting (EM) to be issued to Shareholders once there is clarity on both the above processes
• Shareholders will be given at least 21 days notice before the Extraordinary General Meeting to vote on the transaction
• At this stage, the EM is expected to be distributed in March/April 2018 with completion of the transaction expected by 30 June 2018
• On 27 October 2017 MG announced an agreement to sell all operating assets and operating liabilities to Saputo for $1,310 million1
• The transaction is subject to an ordinary resolution of MG’s voting shareholders2 and other customary conditions including ACCC and FIRB approvals
• Transaction supports effective FY18 milk price of $6.00 per kgms:
o Immediate step up from 1 Novembero Backpay (1 July to 31 October), paid on
completiono $0.40 per kgms retention payment, paid
following completion
Page 5
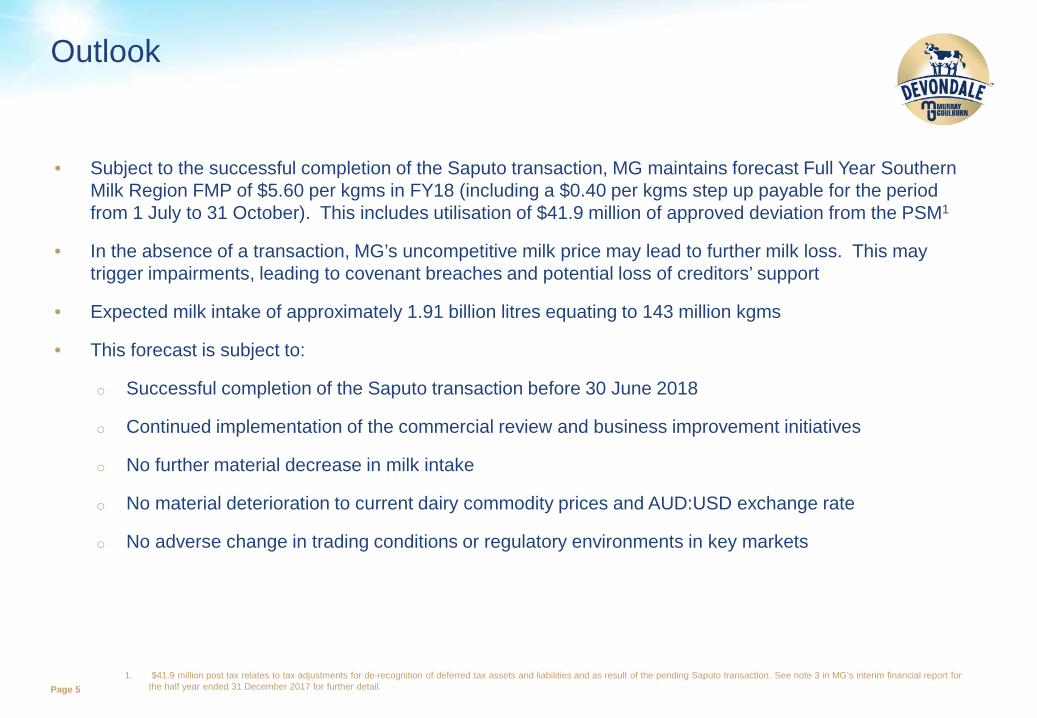
• Subject to the successful completion of the Saputo transaction, MG maintains forecast Full Year Southern Milk Region FMP of $5.60 per kgms in FY18 (including a $0.40 per kgms step up payable for the period from 1 July to 31 October). This includes utilisation of $41.9 million of approved deviation from the PSM1
• In the absence of a transaction, MG’s uncompetitive milk price may lead to further milk loss. This may trigger impairments, leading to covenant breaches and potential loss of creditors’ support
• Expected milk intake of approximately 1.91 billion litres equating to 143 million kgms
• This forecast is subject to:
o Successful completion of the Saputo transaction before 30 June 2018
o Continued implementation of the commercial review and business improvement initiatives
o No further material decrease in milk intake
o No material deterioration to current dairy commodity prices and AUD:USD exchange rate
o No adverse change in trading conditions or regulatory environments in key markets
Outlook
1. $41.9 million post tax relates to tax adjustments for de-recognition of deferred tax assets and liabilities and as result of the pending Saputo transaction. See note 3 in MG’s interim financial report for the half year ended 31 December 2017 for further detail.
Financials
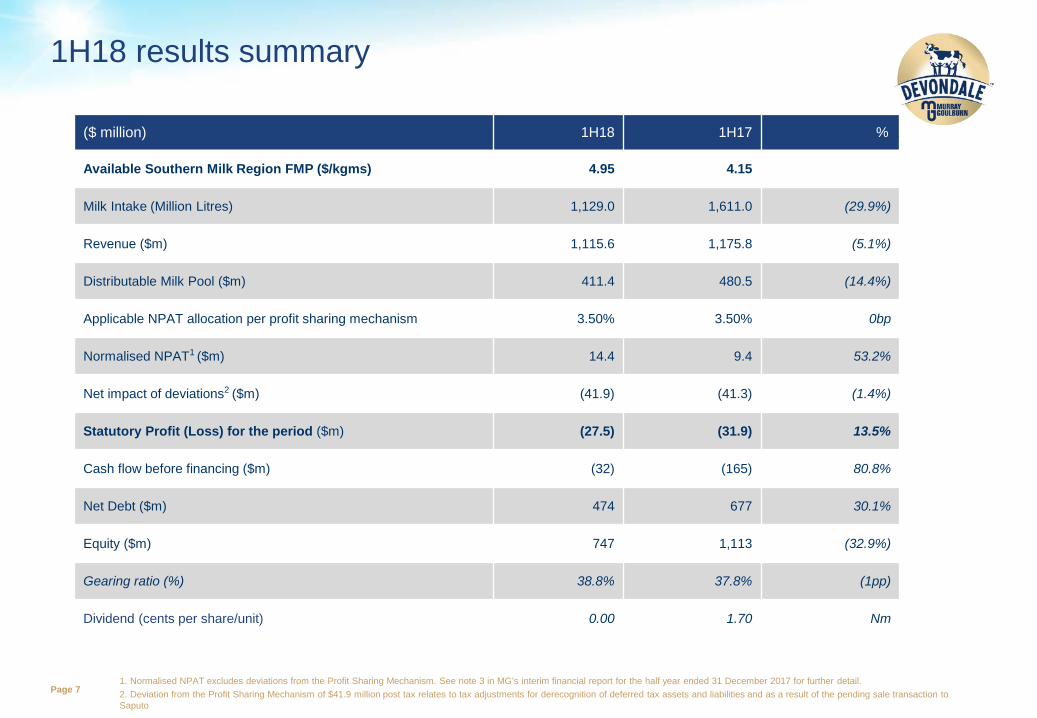
Page 71. Normalised NPAT excludes deviations from the Profit Sharing Mechanism. See note 3 in MG’s interim financial report for the half year ended 31 December 2017 for further detail.2. Deviation from the Profit Sharing Mechanism of $41.9 million post tax relates to tax adjustments for derecognition of deferred tax assets and liabilities and as a result of the pending sale transaction to Saputo
1H18 results summary
($ million) 1H18 1H17 % .
Available Southern Milk Region FMP ($/kgms) 4.95 4.15
Milk Intake (Million Litres) 1,129.0 1,611.0 (29.9%)
Revenue ($m) 1,115.6 1,175.8 (5.1%)
Distributable Milk Pool ($m) 411.4 480.5 (14.4%)
Applicable NPAT allocation per profit sharing mechanism 3.50% 3.50% 0bp
Normalised NPAT1 ($m) 14.4 9.4 53.2%
Net impact of deviations2 ($m) (41.9) (41.3) (1.4%)
Statutory Profit (Loss) for the period ($m) (27.5) (31.9) 13.5%
Cash flow before financing ($m) (32) (165) 80.8%
Net Debt ($m) 474 677 30.1%
Equity ($m) 747 1,113 (32.9%)
Gearing ratio (%) 38.8% 37.8% (1pp)
Dividend (cents per share/unit) 0.00 1.70 Nm
Page 8
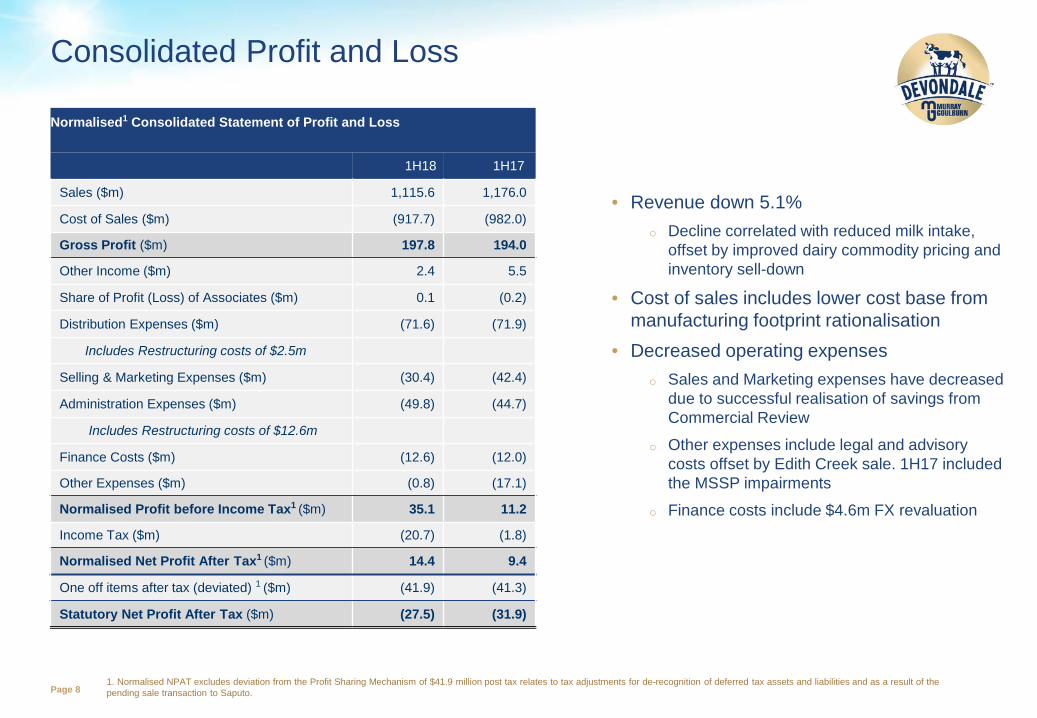
Consolidated Profit and Loss
• Revenue down 5.1%o Decline correlated with reduced milk intake,
offset by improved dairy commodity pricing and inventory sell-down
• Cost of sales includes lower cost base from manufacturing footprint rationalisation
• Decreased operating expenseso Sales and Marketing expenses have decreased
due to successful realisation of savings from Commercial Review
o Other expenses include legal and advisory costs offset by Edith Creek sale. 1H17 included the MSSP impairments
o Finance costs include $4.6m FX revaluation
1. Normalised NPAT excludes deviation from the Profit Sharing Mechanism of $41.9 million post tax relates to tax adjustments for de-recognition of deferred tax assets and liabilities and as a result of the pending sale transaction to Saputo.
Normalised1 Consolidated Statement of Profit and Loss
1H18 . 1H17 .
Sales ($m) 1,115.6 1,176.0
Cost of Sales ($m) (917.7) (982.0)
Gross Profit ($m) 197.8 194.0
Other Income ($m) 2.4 5.5
Share of Profit (Loss) of Associates ($m) 0.1 (0.2)
Distribution Expenses ($m) (71.6) (71.9)
Includes Restructuring costs of $2.5m
Selling & Marketing Expenses ($m) (30.4) (42.4)
Administration Expenses ($m) (49.8) (44.7)
Includes Restructuring costs of $12.6m
Finance Costs ($m) (12.6) (12.0)
Other Expenses ($m) (0.8) (17.1)
Normalised Profit before Income Tax1 ($m) 35.1 11.2
Income Tax ($m) (20.7) (1.8)
Normalised Net Profit After Tax1 ($m) 14.4 9.4
One off items after tax (deviated) 1 ($m) (41.9) (41.3)
Statutory Net Profit After Tax ($m) (27.5) (31.9)

Page 9
Segment contributions
• Dairy Foods contribution of $56.0 milliono Domestic contribution increase attributed
to improved pricing and increase in retail cheese volumes
o International contribution increase attributed to growth in adult milk powder and UHT sales in China
• Ingredients and Nutritionals contribution of $9.8 million
o Significant improvement in contribution from 1H17 as a result of commodity price increases and improved product mix
• Other Segment contribution of $3.3 million
o Improved performance of MG Trading
1. Impairment of the MSSP was treated as an one off item in prior year.
(A$ million) 1H18 . 1H17 . % .Revenue
Dairy Foods 617.0 557.6 10.7%Ingredients and Nutritionals 356.6 481.4 (25.9%)Other 146.9 141.1 4.2%Inter segment revenue (5.0) (4.3) (15.7%)Total Revenue 1,115.6 1,175.8 (5.1%)
Segment ContributionDairy Foods 56.0 40.9 36.8%Ingredients and Nutritionals 9.8 (25.5) nmOther 3.3 2.1 52.8%Total segment contribution 69.1 17.6 292.5%
Corporate costs (21.5) (18.4) (16.8%)Finance costs (12.6) (12.0) (4.4%)Share of profit/(loss) of associates 0.1 (0.2) nmPBT before one off items 35.1 (13.0) nmMSSP Impairment1 - (34.8) nmPBT 35.1 (47.8) nm

Page 10
Balance sheet and cash flow
Balance sheet
• Net $225 million improvement in working capital from 1H17
o Lower inventory holdings in FY18
o Lower receivables driven by strong collections
• Net debt of $474 million ensured gearing remains broadly inline with 1H17
o Gearing at 38.8%, and should reduce in 2H18
• $240 million of banking facilities expire during 2018, of which $181 million is undrawnCash Flow
(A$ million) 1H18 1H17Receivables ($m) 225 337 Inventories ($m) 483 606 Other current assets ($m) 75 70 Non-current assets ($m) 846 1,200 Total assets ($m) 1,628 2,213 Total equity ($m) 747 1,113 Total debt ($m) 509 698 Cash and cash equivalents ($m) 35 21 Net Debt ($m) 474 677 Gearing (debt/(debt+ equity)) 38.8% 37.8%Net Working Capital 412 637
Improvement in operating cash flow performance reflects:
• Improvement in cash flow from working capital driven by lower inventory holdings and a reduction in debtors
• 1H18 capital expenditure $53 million below prior year
• 1H17 Strategic capital expenditure included SAP implementation and new Cobram cheese facility
(A$ million) 1H18 1H17EBITDA 76 (5)Non cash items (39) 14 Net interest paid (11) (11)Cash changes in working capital (40) (94)
Operating cash flow (14) (96)
Capital expenditureStrategic / project capital (3) (45)Other capital expenditure (15) (26)
Other - 2
Investing cash flow (18) (69)
Net cash flow before financing, tax, div (32) (165)
Net cash flow from financing, tax, div 40 158
Net increase (decrease) in cash 8 (8)
Appendix

Page 12
Global dairy commodity price trends
Full cream milk powder1
Average prices across key commodities2
• Full cream milk powder (FCMP) prices falling below 10 year average during 1H18
• Record high butter prices peaked during September 2017 with prices now experiencing a gradual decline
• Skim milk powder prices remain soft and global market remains in oversupply with minimal change in European intervention levels
1. Source: Dairy Australia: FOB USD/MT – 10 years to December 20172. Source: Dairy Australia. Prices are observed, not MG’s achieved prices3. Source: RBA
USD$ AUD$Commodity 1H17 1H18 Variance 1H17 1H18 VarianceFCMP 2,925 3,050 4.3% 3,886 3,917 0.8%SMP 2,358 1,908 -19.1% 3,132 2,450 -21.8%Butter 3,917 5,917 51.1% 5,203 7,599 46.1%Cheddar 3,558 4,092 15.0% 4,725 5,258 11.3%
FX3 0.7236 0.7800 7.8%
$0
$1,000
$2,000
$3,000
$4,000
$5,000
$6,000
2008 2009 2010 2011 2012 2013 2014 2015 2016 2017 2018
Wor
ld m
arke
t pric
es U
SD
/ to
nne
FCMP FCMP 10 year average

Page 13
Key operating and financial metrics
1. Revenue mix excludes adjustment for intersegment revenue
1H18 1H17Total milk intake (million litres) 1,129 1,611 Southern Milk Region milk intake (million litres) 1,033 1,507 Southern Milk Region milk intake (million kgms) 76 111 Available Southern Milk Region FMP (per kgms) 4.95 4.15 Weighted Average Southern Milk Region based on Profit Sharing Mechanism ($/ kgms) 4.92 4.12
Ingredients and Nutritionals sales volume (‘000 metric tonnes) 103 148 Dairy Foods sales volume (‘000 metric tonnes) 298 308 Average revenue per metric tonne - Ingredients and Nutritionals ($) 3,453 3,256 Average revenue per metric tonne - Dairy Foods ($) 2,074 1,808 Revenue mix1 – Ingredients and Nutritionals (%) 32% 41%Revenue mix1 – Dairy Foods (%) 55% 47%Revenue mix1 – Other (%) 13% 12%Total milk payments as a % of revenue 34% 39%Operating expenses as a % of revenue 13% 17%Gross profit margin (%) 18% 14%
Page 14
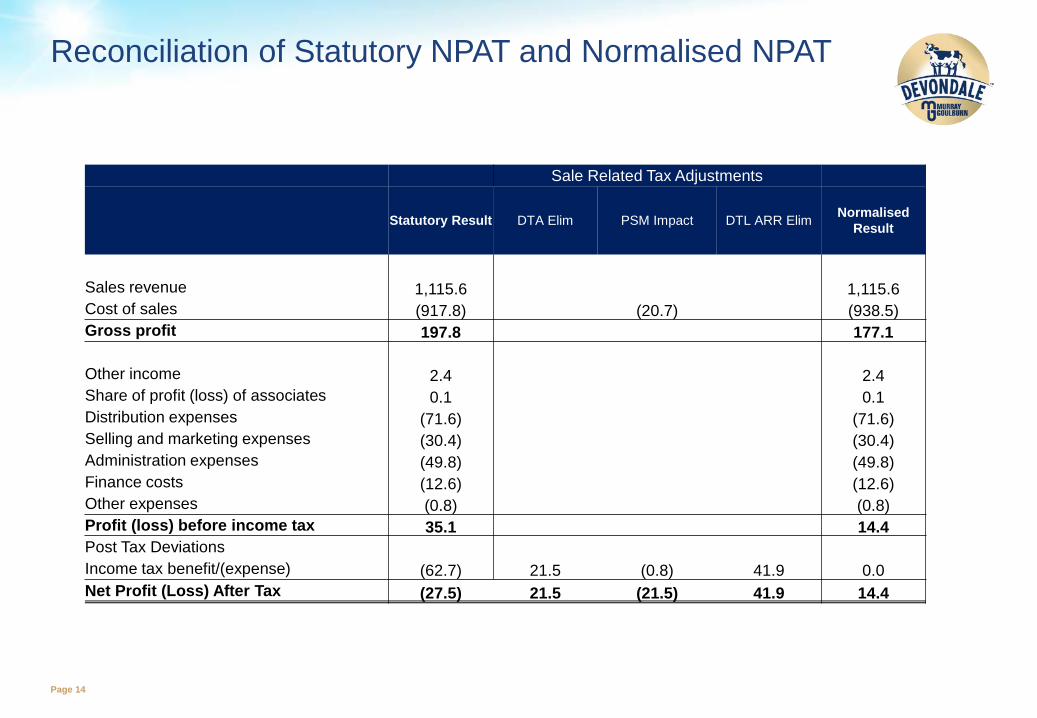
Reconciliation of Statutory NPAT and Normalised NPAT
Sale Related Tax Adjustments
Statutory Result DTA Elim PSM Impact DTL ARR Elim Normalised Result
Sales revenue 1,115.6 1,115.6Cost of sales (917.8) (20.7) (938.5)Gross profit 197.8 177.1
Other income 2.4 2.4Share of profit (loss) of associates 0.1 0.1Distribution expenses (71.6) (71.6)Selling and marketing expenses (30.4) (30.4)Administration expenses (49.8) (49.8)Finance costs (12.6) (12.6)Other expenses (0.8) (0.8)Profit (loss) before income tax 35.1 14.4Post Tax DeviationsIncome tax benefit/(expense) (62.7) 21.5 (0.8) 41.9 0.0Net Profit (Loss) After Tax (27.5) 21.5 (21.5) 41.9 14.4

Page 15
Glossary
Term Definition
Actual Weighted Average Southern Milk Region FMP
total Milk Payments to Suppliers in the Southern Milk Region in a given financial year divided by the Southern Milk Region milk intake (milk solids) for the same period
Available Southern Milk Region FMP
the Actual Weighted Average Southern Milk Region FMP plus the add-back of quality adjustments accrued from the supply of non-premium milk
Dairy Foods an operating segment of MG which manufactures and supplies dairy products such as fresh milk, UHT milk, cheese, butter, creams and milk powders in markets throughout Australia, China, South East Asia, the Middle East and the Pacific
FCMP full cream milk powder
FMP the farmgate milk price paid to a supplier for their raw milk
Ingredients and Nutritionals
an operating segment of MG which manufactures and supplies customised dairy ingredients and nutritional milk powders, primarily to the key markets of North Asia, South East Asia, Australia, Sri Lanka and USA
NPAT Net profit after tax
Other an operating segment of MG which includes various dairy and agricultural businesses
PSM Profit Sharing Mechanism
SMRSouthern Milk Region (SMR) includes the following regions: eastern South Australia and western dairy region in Victoria (West); the Gippsland dairy region in Victoria (Gippsland); and the Murray dairy region in central and northern Victoria and southern NSW (North)