muscle and joint functions during walking in …
TRANSCRIPT

i
MUSCLE AND JOINT FUNCTIONS
DURING WALKING IN INDIVIDUALS
WITH TRANSFEMORAL AMPUTATION
Vahidreza Jafari Harandi
BSc, MSc
Submitted in total fulfilment of the requirements
of the degree of Doctor of Philosophy
June 2020
Department of Biomedical Engineering
Melbourne School of Engineering
The University of Melbourne

ii

iii
I dedicate this work to my most beloved mother, and
to the soul of my dear father.
iv

v
Abstract
Individuals with unilateral transfemoral amputation depend on compensatory muscle and
joint function to generate motion of the lower limbs, which can produce gait asymmetry.
Osseointegration is an alternative technique to socket-based prostheses that is used for reducing
socket-skin contact problems. However, between-limb differences in joint kinematics and net
joint moments may lead to abnormal hip joint contact behavior and muscle function. The aim
of this dissertation is to investigate gait compensatory mechanism in individuals with
transfemoral amputations fitted with socket (TFA) and bone-anchored prostheses using
osseointegrated implants (BAP). In this study, two experimental and computational approaches
were used to quantify the contributions of the intact and residual limb’s contralateral muscles
to body center of mass acceleration and hip joint contact forces during walking. In the first
approach, kinematics and kinetics data were collected from 6 TFAs and 4 BAPs performing
over-ground self-selected walking task. In the second approach, a processing framework was
employed using OpenSim software and MATLAB API scripting for developing three-
dimensional musculoskeletal models and then to predict muscle forces and muscle contribution
to waling and hip joint reaction forces.
It was found that the intact limb hip muscles contributed more to body center of mass
acceleration and hip contact forces than those in the residual limb. The results also suggest that
osseointegrated amputees could quantify to decrease the asymmetries in the biomechanical
measures between the intact and residual limbs than socket-based prosthesis amputees. The
findings of this study would be useful in developing rehabilitation training programs and design
of prostheses to improve gait symmetry and mitigate post-operative musculoskeletal
pathology.

vi

vii
Declaration
This is to certify that:
i. the thesis comprises only my original work towards the PhD,
ii. due acknowledgment has been made in the text to all other material used,
iii. the thesis is less than 80,000 words in length, exclusive of tables, maps,
bibliographies, appendices and footnotes.
Vahidreza Jafari Harandi 1st September 2019

viii
Preface
A number of published and submitted works have resulted from this thesis which are listed
below and noted individually at the beginning of the relevant chapters:
Peer-reviewed journal articles (N = 3)
• Vahidreza Jafari Harandi, David Charles Ackland, Raneem Haddara, L. Eduardo
Cofré Lizama, Mark Graf, Mary Pauline Galea, Peter Vee Sin Lee – Gait compensatory
mechanism in unilateral transfemoral amputees. Medical Engineering and Physics,
Published.
• Vahidreza Jafari Harandi, David Charles Ackland, Raneem Haddara, L. Eduardo
Cofré Lizama, Mark Graf, Mary Pauline Galea, Peter Vee Sin Lee – Muscle
contribution to hip contact forces in osseointegrated transfemoral amputees during
walking. Computer Methods in Biomechanics and Biomedical Engineering, Accepted.
Furthermore, another article has used the results of this study as below:
• Dale Robinson, Lauren Safai, Vahidreza Jafari Harandi, Mark Graf, L. Eduardo
Cofré Lizama, Peter Vee Sin Lee, Mary Pauline Galea, Fary Khan, Kwong Ming Tse,
David Charles Ackland – Load response of an osseointegrated implant used in the
treatment of unilateral transfemoral amputation: An early implant loosening case study.
Clinical Biomechanics, Published.

ix
Conference proceeding. P: Presentation (N=4), PO: Poster (N=1)
• Jafari Harandi V., D. C. Ackland, R. Haddara, P. Lee – Walking mechanics in
osseointegrated transfemoral amputees via a 3D musculoskeletal modeling. ISPO
congress, Kobe, Japan, 2019 [P].
• Jafari Harandi V., D. C. Ackland, R. Haddara, E. C. Lizama, M. P. Galea, M. Graf,
P. Lee – Individual muscle contributions to propulsion in above-knee amputees with
osseointegrated prosthesis during walking. ISB congress, Calgary, Canada, 2019 [P].
• Jafari Harandi V., D. C. Ackland, E. C. Lizama, M. P. Galea, M. Graf, P. Lee – Hip
muscles forces during walking of an above-knee amputee. AOPA congress, Melbourne,
Australia, 2017 [PO].
• Jafari Harandi V., D. C. Ackland, E. C. Lizama, M. P. Galea, M. Graf, P. Lee – A
computer-based model of above-knee amputee to evaluate gait mechanics. 3DMED
symposium, Austin Health, Melbourne, Australia, 2017 [P].
• Jafari Harandi V., D. C. Ackland, E. C. Lizama, M. P. Galea, M. Graf, P. Lee –
Muscle contribution to support during walking in transfemoral amputees. Australian
and New Zealand Orthopedic Research Society (ANZORS) conference, 2017 [P].

x
Awards and recognition
A number of travel grants and scholarships were awarded during my PhD. Travel grants in
addition to supervisors' funds have provided opportunities to attend several national and
international conferences. I would like to acknowledge the fund providers by listing them
below:
• Melbourne Abroad Travelling Scholarships (MATS), July 2019, to attend ISB
congress.
• Graduate Research Students Travel Bursary, The University of Melbourne, December
2017.
• Travel grant Biomedical Engineering symposium, Beihang University, China,
November 2018.
• Graduate Research Students Travel Bursary, The University of Melbourne, December
2017.
• Travel grant Australian and New Zealand Orthopedic Research Society, October
2017.
• Melbourne International Fee Remission Scholarship (MIFRS), 2015-19.
• Melbourne International Research Scholarship (MIRS), 2015.
• Endeavor International Postgraduate Research Scholarship (IPRS), 2016.
• Relocation grant, The University of Melbourne, 2015.

xi
Signed ()
Vahidreza Jafari Harandi
Peter VS. Lee Vijay Rajagopal
David C. Ackland

xii
Acknowledgments
Firstly, I am deeply thankful to my advisors, Prof. Peter Lee and A/Prof. David Ackland
for their support, advice and enthusiasm throughout my entire PhD journey. Peter
kindly introduced me to begin and continue research in a wonderful area of amputees
walking biomechanics. David also has been an encouraging supervisor, who patiently
supported me with constructive and helpful feedback. I also thank Drs. Eduardo Cofre
Lizama and Mark Graf and Prof. Mary Galea from Royal Melbourne Hospital for their
help during data collection and providing subjects for my experimental study.
I sincerely thank my Advisory Committee Chair, Dr. Vijay Rajagopal for his
insightful and inspiring discussion and guidance.
I would like to express my gratitude to all my peers, friends, and colleagues in
the Biomechanical Engineering research group, both past and present. I am especially
indebted to Dr. Yi-Chung Lin, Dr. Fatemeh Malekipour, Dr. Azadeh Kian, Dr. Dale
Robinson and Mrs. Raneem Haddara for their invaluable, knowledgeable, and
encouraging discussion and comments on my work.
On a more personal level and even though far away from me, I profoundly thank
my family. I am eternally indebted to the love and support of my lovely mother which
have always been with me during life. My appreciation is also extended for my late
father who instilled a love of learning in engineering in me from childhood to perform
at the best of my ability.

xiii
xiv
Contents
Introduction .......................................................................................................... 1
1.1 Motivation for studying muscle behavior in individuals with transfemoral
amputation during gait ............................................................................................................... 2
1.2 Rationale for use of computer-based musculoskeletal modeling and simulation ... 3
1.3 Contributions of the dissertation and specific aims ................................................. 4
1.4 Outline of the thesis ................................................................................................. 6
Background and literature .................................................................................... 9
2.1 An overview of transfemoral amputation .............................................................. 10
2.2 Biomechanical parameters in transfemoral amputees during walking .................. 14
Spatiotemporal, kinematics and kinetics ............................................................... 14
2.2.2 EMG and muscle forces in transfemoral amputees ............................................... 15
2.3 Musculoskeletal modeling and challenges ............................................................ 16
2.3.1 Computational frameworks in muscle forces prediction during walking .............. 17
2.3.1.1 Muscle lines of action and moment arms .......................................................... 18
2.3.1.2 Muscle model: Force-generation properties ...................................................... 19
2.3.1.3 Methods of muscle force estimation .................................................................. 20
2.3.2 Challenges in modeling ......................................................................................... 23
2.4 Induced acceleration analysis of human locomotion: state of the art .................... 24
2.5 Muscle contributions to walking ........................................................................... 26
2.6 Muscle contribution to hip contact forces ............................................................. 29

xv
2.7 Summary of the literature review .......................................................................... 30
Experimental and computational methods ......................................................... 33
3.1 An overview of experimental and computational approaches in this study .......... 34
3.2 Experimental data collection ................................................................................. 35
3.2.1 Subject recruitment ................................................................................................ 35
3.2.2 Body measurements ............................................................................................... 36
3.2.3 Marker attachments ............................................................................................... 36
3.2.4 Walking protocol ................................................................................................... 37
3.2.5 Data processing...................................................................................................... 40
3.3 Musculoskeletal modeling ..................................................................................... 43
3.3.1 Healthy subject model ........................................................................................... 46
3.3.2 Model scaling ........................................................................................................ 46
3.3.3 Amputee subject model ......................................................................................... 47
3.3.4 Inverse kinematics ................................................................................................. 49
3.3.5 Inverse dynamics ................................................................................................... 50
3.3.6 Static optimization ................................................................................................. 50
3.3.7 Validation of the musculoskeletal model .............................................................. 53
3.3.8 Induced acceleration analysis ................................................................................ 54
3.3.8 Joint reaction loads and muscle contribution ........................................................ 64
Gait biomechanics in transfemoral amputees during: individual muscle
contribution to COM acceleration ........................................................................................... 67

xvi
4.1 Introduction ........................................................................................................... 68
4.2 Materials and Methods .......................................................................................... 70
4.2.1 Participants ............................................................................................................ 70
4.2.2 Testing protocol ..................................................................................................... 71
4.2.3 Data processing...................................................................................................... 71
4.2.4 Musculoskeletal modelling .................................................................................... 72
4.2.5 Data analysis .......................................................................................................... 74
4.3 Results ................................................................................................................... 74
4.3.1 SP users.................................................................................................................. 74
4.3.2 OI users .................................................................................................................. 90
4.3.3 Sensitivity analysis .............................................................................................. 101
4.4 Discussion ............................................................................................................ 103
Muscle contribution to hip contact forces ........................................................ 114
5.1 Introduction ......................................................................................................... 115
5.2 Materials and Methods ........................................................................................ 117
5.2.1 Subject recruitment .............................................................................................. 118
5.2.2 Testing protocol ................................................................................................... 118
5.2.3 Data processing.................................................................................................... 119
5.2.4 Musculoskeletal modeling ................................................................................... 119
5.3 Results ................................................................................................................. 121
5.3.1 SP users................................................................................................................ 122
xvii
5.3.1.1 Passive knee prosthesis SP users ..................................................................... 122
5.3.1.2 Active knee prosthesis SP users ....................................................................... 128
5.3.2 OI users ................................................................................................................ 134
5.4 Discussion ............................................................................................................ 140
Summary and future work ............................................................................... 145
References ........................................................................................................ 150

xviii
List of Tables
Table 3.1. Subject specification of SP users. The amputation level is medium for all subjects.
.................................................................................................................................................. 35
Table 3.2. Subject specification of OI users. The amputation level is medium for all subjects.
.................................................................................................................................................. 36
Table 3.3. Markers locations used to motion data capture. For the prosthetic leg, it follows the
marker locations of the intact leg. ............................................................................................ 39
Table 3.4. EMG electrode placements used for EMG data capture ......................................... 41
Table 3.5. The intact and residual leg muscles included in the model. * represents EMG data
collected of the intact limb muscles; ¥ represents EMG data collected of the contralateral side
muscles. ɸ represent the muscles not included in the model for the residual limb. ................. 44
Table 3.6. The location of five foot-ground contact points over the sole of feet. The body
coordinates are in anterior, vertical and lateral directions, respectively. ................................. 55
Table 3.7: Constraint weightings 𝑤 for the five foot-ground interaction points. .................... 61
Table 4.1. Mean and standard deviation (SD) of spatiotemporal parameters in SP users (n=6)
between the intact and residual limb. ....................................................................................... 75
Table 4.2. The mean, standard deviation (SD), 95% confidence interval and p-value of the joint
angles of the intact and residual legs during stance phase of SP users (n=6). Hip flexion and
adduction, pelvis tilt and knee extension angles and ankle dorsiflexion are positive. IHS:
ipsilateral heel strike; CTO: contralateral toe-off; CHS: contralateral heel strike; ITO:
ipsilateral toe-off. ..................................................................................................................... 76
xix
Table 4.3. The mean, standard deviation (SD), 95% confidence interval and p-value of the joint
moments of the intact and residual legs during stance phase for SP users (n=6). Hip flexion,
knee extension and ankle dorsiflexion moments are positive. IHS: ipsilateral heel strike; CTO:
contralateral toe-off; CHS: contralateral heel strike; ITO: ipsilateral toe-off. ......................... 79
Table 4.4. Mean, standard deviation (SD), 95% confidence interval and p-value of the muscle
forces of the intact and residual legs during stance phase for SP users (n=6). IHS: ipsilateral
heel strike; CTO: contralateral toe-off; CHS: contralateral heel strike; ITO: ipsilateral toe-off.
.................................................................................................................................................. 82
Table 4.5. The p-value of the muscle contribution to the COM acceleration during stance phase
of SP users (n=6) between the intact and the residual limb at four gait events including IHS:
ipsilateral heel strike; CTO: contralateral toe-off; CHS: contralateral heel strike; ITO:
ipsilateral toe-off. ..................................................................................................................... 87
Table 4.6. Mean and standard deviation (SD) of spatiotemporal parameters in OI users between
the intact and residual limb of OI users (n=4). ........................................................................ 90
Table 4.7. The mean, standard deviation (SD) and 95% confidence interval of the joint angles
of the intact and residual legs during stance phase of OI users (n=4). Hip flexion and adduction,
and knee extension angles and ankle dorsiflexion are positive. IHS: ipsilateral heel strike; CTO:
contralateral toe-off; CHS: contralateral heel strike; ITO: ipsilateral toe-off. ......................... 91
Table 4.8. The mean, standard deviation (SD) and 95% confidence interval of the joint
moments of the intact and residual legs during stance phase of OI users (n=4). Hip flexion,
knee extension and ankle dorsiflexion moments are positive. IHS: ipsilateral heel strike; CTO:
contralateral toe-off; CHS: contralateral heel strike; ITO: ipsilateral toe-off. ......................... 93
xx
Table 4.9. The mean, standard deviation (SD) and 95% confidence interval of the muscle forces
of the intact and residual legs during stance phase of OI users (n=4). IHS: ipsilateral heel strike;
CTO: contralateral toe-off; CHS: contralateral heel strike; ITO: ipsilateral toe-off. .............. 96
Table 5.1. Individual muscle contribution to the peak hip contact forces during CTO for the SP
users with only passive knee prosthesis (n=3). ...................................................................... 124
Table 5.2. Individual muscle contribution to the peak hip contact forces during CHS for the SP
users with only passive knee prosthesis (n=3). ...................................................................... 125
Table 5.3. Individual muscle contribution to the peak hip contact forces during CTO for the SP
users with only active knee prosthesis (n=3). ........................................................................ 130
Table 5.4. Individual muscle contribution to the peak hip contact forces during CHS for the SP
users with only active knee prosthesis (n=3). ........................................................................ 131
Table 5.5. Individual muscle contribution to the peak hip contact forces during CTO for the OI
users (n=4). ............................................................................................................................ 136
Table 5.6. Individual muscle contribution to the peak hip contact forces during CHS for the OI
users (n=4). ............................................................................................................................ 137

xxi
List of Figures
Figure 2.1- An individual with unilateral transfemoral amputee (Ottobock). ......................... 10
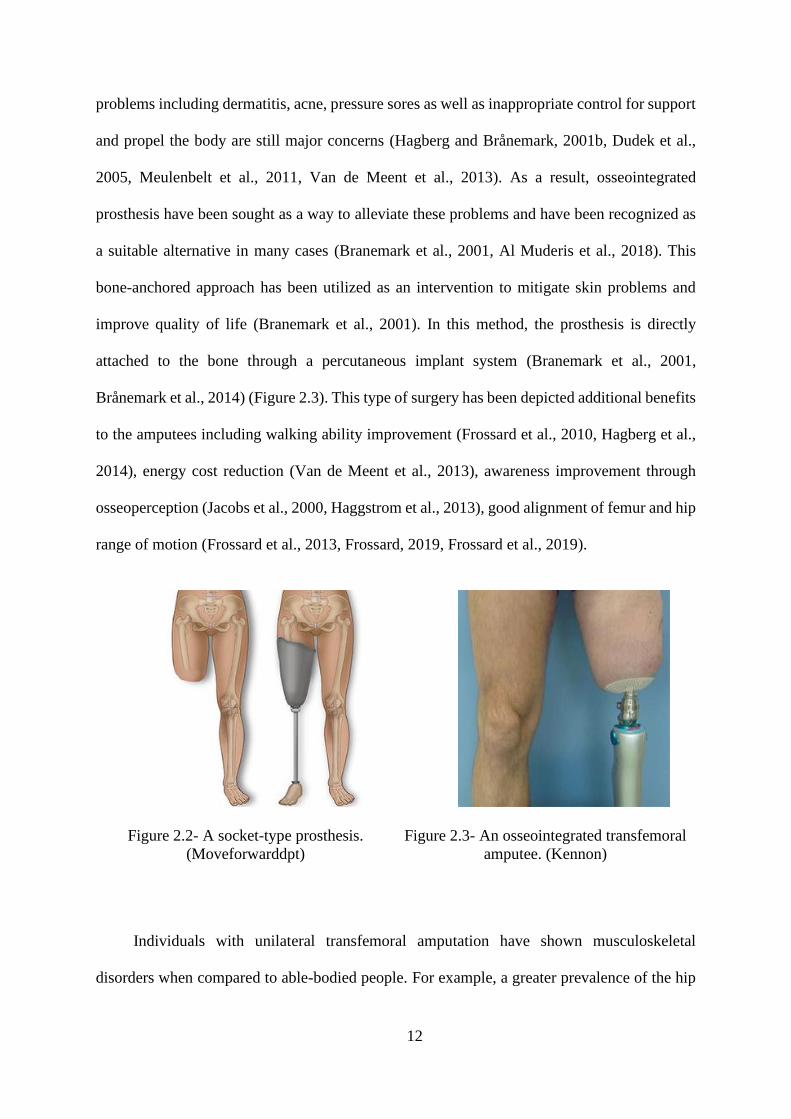
Figure 2.2- A socket-type prosthesis. (Moveforwarddpt) ........................................................ 12
Figure 2.3- An osseointegrated transfemoral amputee. (Kennon) ........................................... 12
Figure 2.4. The maximum isometric force (𝐹𝑜𝑚 ) describes the force in the muscle under
maximum (100%) isometric contraction. As seen in the active force-length curve (left), peak
force is produced when the muscle is at its resting length (𝑙𝑜𝑚). When a muscle is shortened
below or above its resting length (i.e. a muscle operating on the ascending or descending region,
respectively), it produces less force output. Passive force is produced when the muscle is
lengthening but not active. The force-velocity curve (right) shows that under isometric
conditions, the muscle is neither shortening or lengthening. A muscle produces no force when
it reaches its maximum shortening velocity (𝑉𝑚𝑎𝑥). .............................................................. 19
Figure 3.1- Marker set used in this study. The numbers are described in Table 3.3. .............. 38
Figure 3.2. Schematics of healthy and amputee models developed in OpenSim. ................... 49
Figure 3.3. A five-point model of contact between the foot and the ground. The labels of
markers are described in Table 3.6. ......................................................................................... 55
Figure 3.4. Foot-ground contact constraints during stance phase at heel-strike (phase 1), foot-
flat (phase 2,3) and toe-off (phase 4). ...................................................................................... 59
Figure 4.1. Joint angles in the intact and residual limb of transfemoral amputees (n=6). The
gray shaded areas represent ±1 standard deviation from the mean. The vertical dashed line
represents contralateral toe-off (CTO); the vertical solid line represents contralateral heel strike

xxii
(CHS). Statistical analyses obtained between the two legs are demonstrated by h = 1 in the h-
value plots. ............................................................................................................................... 77
Figure 4.2. Joint moments in the intact and residual limb of transfemoral amputees (n=6). The
gray shaded areas represent ±1 standard deviation from the mean. The vertical dashed line
represents contralateral toe-off (CTO); the vertical solid line represents contralateral heel strike
(CHS). Statistical analyses obtained between the two legs are demonstrated by h = 1 in the h-
value plots. ............................................................................................................................... 80
Figure 4.3. Forces of muscles in the intact and residual limb of transfemoral amputees (n=6).
The gray shaded areas represent ±1 standard deviation from the mean. The vertical dashed line
represents contralateral toe-off (CTO); the vertical solid line represents contralateral heel strike
(CHS). The horizontal solid line indicates the period of EMG activity recorded for muscles.
Statistical analyses obtained between the two legs are demonstrated by h = 1 in the h-value
plots. ......................................................................................................................................... 83
Figure 4.4. Forces of muscles in the below-knee of the intact of SP users (n=6). The gray shaded
areas represent ±1 standard deviation from the mean. The horizontal black line indicates the
activity time of the muscles. The vertical dashed line represents contralateral toe-off (CTO);
The vertical solid line represents contralateral heel strike (CHS). The horizontal solid line
indicates the period of EMG activity recorded for muscles. ................................................... 84
Figure 4.5. Individual muscle and prosthesis contribution to anterior-posterior and vertical
COM acceleration in transfemoral amputees (n=6). The shaded area represents the summed
contribution from all actuators. The vertical dashed line represents contralateral toe-off (CTO);
the vertical solid line represents contralateral heel strike (CHS). Statistical analyses obtained
between the two legs are demonstrated by h = 1 in the h-value plots. .................................... 88
xxiii
Figure 4.6. Individual muscle and prosthesis contribution to mediolateral COM acceleration in
transfemoral amputees (n=6). The shaded area represents the summed contribution from all
actuators. The vertical dashed line represents contralateral toe-off (CTO); the vertical solid line
represents contralateral heel strike (CHS). Statistical analyses obtained between the two legs
are demonstrated by h = 1 in the h-value plots. ....................................................................... 89
Figure 4.7. Joint angles and moments of the intact (solid line) and residual (dashed line) limbs
of OI users (n=4). The gray shaded areas represent ±1 standard deviation from the mean. The
vertical dashed line represents contralateral toe-off (CTO); the vertical solid line represents
contralateral heel strike (CHS)................................................................................................. 94
Figure 4.8. Hip muscle forces of the intact (solid line) and residual (dashed line) limbs during
stance of OI users (n=4). The gray shaded areas represent ±1 standard deviation from the mean.
The horizontal line for GMAX and GMED indicates the EMG activity period. The vertical
dashed line represents contralateral toe-off (CTO); the vertical solid line represents
contralateral heel strike (CHS)................................................................................................. 97
Figure 4.9. Muscle forces of the intact limb’s VAS, GAS and SOL during stance of OI users
(n=4). The gray shaded areas represent ±1 standard deviation from the mean. The horizontal
lines indicate the EMG activity period. The vertical dashed line represents contralateral toe-off
(CTO); the vertical solid line represents contralateral heel strike (CHS). ............................... 98
Figure 4.10. Individual muscle and prosthesis contribution to anterior-posterior, vertical and
mediolateral COM acceleration of OI users (n=4). The shaded area represents the summed
contribution from all actuators. The vertical dashed line represents contralateral toe-off (CTO);
the vertical solid line represents contralateral heel strike (CHS). .......................................... 100

xxiv
Figure 4.11. Knee moment of intact limb and residual limb for one amputee. ±50 (25) % MOI
represents when MOI increased or decreased by 50(25) %; ±50(25) % COM represents when
COM increased (decreased) by 50(25) %. ............................................................................. 102
Figure 4.12. The intact and residual limb’s joints angles of the amputees with passive (solid
line, n=3) and active (dashed line, n=3) prosthesis. The vertical dashed line represents
contralateral toe-off (CTO); the vertical solid line represents contralateral heel strike (CHS).
................................................................................................................................................ 108
Figure 4.13. The intact and residual limb’s joints moments of the amputees with passive (solid
line, n=3) and active (dashed line, n=3) knee prosthesis. The vertical dashed line represents
contralateral toe-off (CTO); the vertical solid line represents contralateral heel strike (CHS).
................................................................................................................................................ 108
Figure 4.14. The intact limb muscle contribution to COM acceleration for amputees with
passive (mechanical) knee joint (top, n=3) and active (microprocessor) knee joint (bottom,
n=3). The shaded area represents the summed contribution from all actuators..................... 109
Figure 4.15. The residual limb muscle contribution to COM acceleration for amputees with
passive (mechanical) knee joint (top, n=3) and active (microprocessor) knee joint (bottom,
n=3). The shaded area represents the summed contribution from all actuators..................... 110
Figure 4.16. Residual limb muscle forces calculated based on myodesis and myoplasty
techniques. ............................................................................................................................. 111
Figure 5.1. Total hip contact forces for the intact and residual limb of the SP users with only
passive knee prosthesis (n=3). The vertical solid lines indicate the intact limb and the vertical
dashed lines indicate the residual limb. ................................................................................. 123
Figure 5.2. Individual hip-spanning muscles to the three components of the hip contact forces
for the SP users with only passive knee prosthesis (n=3). The vertical dashed and solid lines

xxv
indicate contralateral toe-off and contralateral heel-strike, respectively. The shaded area
represents the total hip contact forces acting along the three coordinate directions. ............. 126
Figure 5.3. Individual non-hip-spanning muscles to the three components of the hip contact
forces for the SP users with only passive knee prosthesis (n=3). The vertical dashed and solid
lines indicate contralateral toe-off and contralateral heel-strike, respectively. The shaded area
represents the total hip contact forces acting along the three coordinate directions. ............. 127
Figure 5.4. Total hip contact forces for the intact and residual limb of the SP users with only
active knee prosthesis (n=3). The vertical solid lines indicate the intact limb and the vertical
dashed lines indicate the residual limb. ................................................................................. 129
Figure 5.5. Individual hip-spanning muscles to the three components of the hip contact forces
for the SP users with only active knee prosthesis (n=3). The vertical dashed and solid lines
indicate contralateral toe-off and contralateral heel-strike, respectively. The shaded area
represents the total hip contact forces acting along the three coordinate directions. ............. 132
Figure 5.6. Individual non-hip-spanning muscles to the three components of the hip contact
forces for the SP users with only active knee prosthesis (n=3). The vertical dashed and solid
lines indicate contralateral toe-off and contralateral heel-strike, respectively. The shaded area
represents the total hip contact forces acting along the three coordinate directions. ............. 133
Figure 5.7. Total hip contact forces for the intact and residual limb of the OI users (n=4). The
vertical solid lines indicate the intact limb and the vertical dashed lines indicate the residual
limb. ....................................................................................................................................... 135
Figure 5.8. Individual hip-spanning muscles to the three components of the hip contact forces
for the OI users (n=4). The vertical dashed and solid lines indicate contralateral toe-off and
contralateral heel-strike, respectively. The shaded area represents the total hip contact forces
acting along the three coordinate directions. ......................................................................... 138

xxvi
Figure 5.9. Individual non-hip-spanning muscles to the three components of the hip contact
forces for the OI (n=4). The vertical dashed and solid lines indicate contralateral toe-off and
contralateral heel-strike, respectively. The shaded area represents the total hip contact forces
acting along the three coordinate directions. ......................................................................... 139
Figure 5.10. Hip contact impulse between the intact and residual limb for SP and OI user . 144

1
Introduction

2
1.1 Motivation for studying muscle behavior in
individuals with transfemoral amputation during
gait
Transfemoral amputation is associated with substantial functional limitations, which
affect daily activities and social life (Hammarlund et al., 2011, MPhty, 2012). Secondary
diseases, which involve musculoskeletal disorders such as the intact limb hip and knee joints
osteoarthritis (OA) and low back pain, often occur over time in transfemoral amputees (Struyf
et al., 2009, Morgenroth et al., 2012). Thus, understanding muscle function to help avoid OA
and low back pain is important.
Previous gait analyses in patients with transfemoral amputation have focused on
spatiotemporal parameters, joint kinematics and kinetics, muscle electromyography (EMG)
and consequently asymmetry and changes to the amputee’s walking patterns compared to non-
amputees (Jaegers et al., 1995b, Jaegers et al., 1995a, Jaegers et al., 1996, Kaufman et al., 2007,
Kaufman et al., 2012). Although new socket designs have improved walking, skin problems
are still a major concern (Van de Meent et al., 2013). As a result, osseointegrated prosthesis
have been sought as a way to combat these problems and have been recognized as the better
alternative in some cases (Branemark et al., 2001, Al Muderis et al., 2018). On the other hand,
more recent studies have shown that lower extremity muscles such as ankle plantarflexors and
knee extensors are responsible to generate motion in non-amputees (Liu et al., 2006, Pandy and
Andriacchi, 2010, Lin et al., 2015). In transfemoral amputees with socket and osseointegrated
implants, these muscles are absent and thus other intact and residual limb muscles must
compensate the lost muscles role to perform a movement. Investigation of muscle forces is
required for understanding the compensatory mechanism employed by amputees.
3
An overarching aim of this dissertation is to investigate the individual lower limb muscle
function during walking in transfemoral amputees. Post-amputation rehabilitation is a
prominent procedure trying to maximize the amputee’s capabilities to walking and prevent
injuries. While transfemoral amputees use compensatory mechanism to generate a movement,
they may confront musculoskeletal disorders due to amputation more than non-amputees
(Struyf et al., 2009, Morgenroth et al., 2012). Understanding the walking strategies among both
TFAs and BAPs is also crucial to devise new training programs and improve prosthesis designs
with the aim of increase in activities performance and prevention or postponement the
subsequent musculoskeletal diseases.
1.2 Rationale for use of computer-based
musculoskeletal modeling and simulation
The intact limb lower-extremity joint injuries in unilateral transfemoral amputees occur
when large mechanical loads are applied to the joint. Thus, knowledge of the forces that joint
sustains is of importance for understanding the criteria that affect joint loadings. Also, the most
fundamental way to explain muscle recruitment strategies during walking in transfemoral
amputees is understood by how much force each muscle generates to move body center of mass
forward, upward and sideway. Direct measurement of muscle forces in vivo through non-
invasive way is not feasible. However, some studies have reported muscle forces in human
using invasive methods such as strain-gauge transducers for a limited number of muscles
(Komi et al., 1987, Fukashiro et al., 1995). In other words, such methods are not able to
calculate the forces of multiple muscles at time (Komi et al., 1987).

4
In a computer-based simulation, a number of muscle significant parameters such as a
time history of musculotendon length during movements can be estimated using computer
models. The time history is of particular relevance in the scope of injuries related to muscle
strain. Years of using musculoskeletal models have shown development in the accuracy of
anatomy and anthropometry of the individual during dynamics locomotion in non-amputees
(Delp and Loan, 1995, Anderson and Pandy, 1999, Liu et al., 2006, Chumanov et al., 2011).
Thus, understanding human movement biomechanics and motor control have been achieved
using musculoskeletal simulations. Musculoskeletal models provide a quantitative prediction
of the loads produced by individual muscles. Computational musculoskeletal simulations have
enabled researchers to investigate the role of muscles in walking in healthy and amputee groups
(Liu et al., 2008, Pandy and Andriacchi, 2010, Silverman and Neptune, 2010, Dorn et al.,
2012b, Silverman and Neptune, 2012).
OpenSim, an open-source musculoskeletal modeling platform (Delp et al., 2007) and
MATLAB API scripting were used as primary computational tools in this dissertation. The
OpenSim models are comprised of solid segments, joints, muscle model, musculotendon
parameters and physiological force-length-velocity properties of muscle, which all are
integrated to create musculoskeletal models. The OpenSim community has developed different
models for non-amputees; however, creating and developing musculoskeletal models for
transfemoral amputees is required to analyze and investigate the role of lower limb muscles
during daily activities.
1.3 Contributions of the dissertation and specific
aims

5
The overall aims of this dissertation were to provide a better comprehension of the
mechanism that transfemoral amputees employ during walking. This was achieved using
experimental data recorded from transfemoral amputees walking at their self-selected speed
and computational musculoskeletal modeling to simulate and analyze walking. The findings of
this dissertation will not only contribute to areas such as biomechanical engineering and
rehabilitation engineering but also advance the use of human-motion computer-based
modeling. Thereafter, the key contributions of this dissertation are as follows:
1. Developed a 3D musculoskeletal model for transfemoral amputees fitted with
socket and osseointegrated prosthesis.
Decades of laboratory-based studies have shed light on differences in
biomechanical criteria during walking in transfemoral amputees. Spatiotemporal
parameters, joints kinematics, kinetics, and EMG-based studies were reviewed and
summarized to depict the asymmetries associated with transfemoral amputees fitted
with socket and osseointegration prosthesis. Although these studies provide valuable
information on walking strategies, the perception of the dynamical role of muscles to
generate motion is vital to understand how transfemoral amputees employ
compensatory mechanisms. In chapter 3, experimental and computational approaches
including data collection protocol, musculoskeletal model development, and
mathematical procedures were presented to represent transfemoral amputee.
2. Evaluated the functional behavior of lower extremity muscles during self-selected
over-ground walking of transfemoral amputee groups with socket and
osseointegrated implants.
Previous studies have mostly used EMG to study the role of lower-extremity
muscles, in particular, proprioception and muscle activation, during walking in

6
transfemoral amputees. However, these parameters do not illustrate the forces produced
by muscles. Given that the muscles play a critical role in propel, support and control of
the body, quantifying lower limb muscle function may extend the current knowledge
about walking mechanisms in both amputees with socket and osseointegration
prosthesis. Since osseointegration has introduced new way to combat socket-skin
difficulties, it is more important to investigate its effect on walking mechanism. In
chapter 4, the muscle forces and muscle contribution to walking were calculated using
experimental data and developed computational musculoskeletal models.
3. Quantified the intact and residual limb hip joint contact forces and then identified
and determined major muscle groups that contribute to the hip contact forces.
Walking asymmetries have been illustrated to increase the risk of hip OA in
transfemoral amputees. To numerically assess hip joint forces, chapter 5 quantified the
resultant hip contact forces in the intact and residual limb of amputees. Using
experimental data and musculoskeletal model as well as the results of muscle
contribution to walking calculated in chapter 4, the muscle contribution to hip contact
forces were computed for both amputees wearing socket and osseointegration
prosthesis to evaluate how muscles generate hip forces during walking.
1.4 Outline of the thesis
• Chapter 2 describes the comprehensive literature review relevant to the objectives
of this dissertation. The following topics will be discussed in this chapter:
Biomechanical parameters in transfemoral amputees walking, Muscle behavior in
walking of transfemoral amputees, Muscle contribution to walking, Muscle

7
contribution to hip contact force during walking, Musculoskeletal modeling and
challenges.
• Chapter 3 presents a detailed overview of musculoskeletal modeling development
for transfemoral amputees.
• Chapter 4 focuses on individual muscle behavior in walking of transfemoral
amputees with socket and osseointegration prosthesis.
• Chapter 5 investigates individual muscle contribution to joint contact forces during
walking of transfemoral amputees.
• Chapter 6 presents a conclusion and future work associated with the discussion and
limitations of this dissertation.
8

9
This chapter provides a comprehensive review of the walking biomechanics literature in
people with unilateral transfemoral amputation. It begins with a definition of transfemoral
amputation, after which a literature review of the gait parameters associated with unilateral
transfemoral amputee walking is described, discussing kinematics, kinetics, muscle
electromyography (EMG) and muscle forces. Thereafter, a computational perspective is taken,
discussing the outcome delivered by simulation and modeling is emphasized. The chapter
concludes with the specific questions addressed by this thesis.
Background and literature

10
2.1 An overview of transfemoral amputation
Transfemoral or above-knee amputation is a surgical procedure that removes a lower
extremity from the body at or above the knee joint (Berke et al., 2008), to remain as many
healthy bones, muscles, and vessels (Figure 2.1). Amputations are notably caused by peripheral
vascular disease, diabetes, infection, trauma, and cancer. However, the leading cause of
amputation has been reported to be due to severe vascular and diabetic disease (Gottschalk,
1999). The risk of lower extremity amputation has been estimated to increase up to fifteen
times in diabetic people (Nelson et al., 1988). In addition, the annual financial burden of the
lower limb amputation had been reported to be between £50 and £75 million in the UK at the
period of 2003-2008 (Moxey et al., 2010).
Figure 2.1- An individual with unilateral transfemoral amputee (Ottobock).
In total, each year over 150,000 people undergo amputation surgery due to vascular
disease or diabetes around the world (Dillingham et al., 2005). The number of individuals with

11
lower limb amputation has increased over the past decade in Australia (Dillon et al., 2017). In
Australia, the most common reason for lower limb is diabetes, which accounts for 85% of cases
(AIHWb, 2014). Approximately, 222,000 transfemoral amputees were living in the US by the
year 2008, which is 20% of the total amputees' population (Berke et al., 2008). It is also
predicted that the number of lower extremity amputees will double by 2050 (Ziegler-Graham
et al., 2008).
Based on the level of amputation, some muscles, which mostly span the knee joint, will
be removed and some bi-articular muscles spanning the hip and knee joints will be re-anchored.
The re-anchorage strategy usually depends on what muscle stabilization technique is used,
myoplasty or myodesis. In the traditional method, myoplasty, both agonist and antagonist
muscles such as hamstrings, rectus femoris, and adductor magnus will be sutured over the end
of stump without preserving muscle tension (Gottschalk, 2004). The muscle tension is not
preserved through myoplasty. Thus, another surgical procedure which is known myodesis have
been recommended for the hip adductors and medial hamstring to be directly re-inserted to the
end of femur under tension (Gottschalk, 2004, Tintle et al., 2010). As a result, the capacity of
these muscles to generate forces and moments about the hip has been improved (Ranz et al.,
2017).
Transfemoral amputees replace a part of the leg, which is lost because of amputation,
with prosthesis enabling most of them to perform daily activities. One conventional method to
fix the prosthesis to the body is by employing a custom-designed socket (Figure 2.2). Of those
conventional socket transfemoral amputees, one third experiences severe skin pain and
discomforts related to the socket-skin interface (Rommers et al., 1996, Hagberg and
Brånemark, 2001b, Meulenbelt et al., 2009, Butler et al., 2014), which has resulted in low
quality of life and doing daily activities (Pezzin et al., 2000, Demet et al., 2003, Pezzin et al.,
2004a). Although new socket designs have improved walking, socket-stump interface
12
problems including dermatitis, acne, pressure sores as well as inappropriate control for support
and propel the body are still major concerns (Hagberg and Brånemark, 2001b, Dudek et al.,
2005, Meulenbelt et al., 2011, Van de Meent et al., 2013). As a result, osseointegrated
prosthesis have been sought as a way to alleviate these problems and have been recognized as
a suitable alternative in many cases (Branemark et al., 2001, Al Muderis et al., 2018). This
bone-anchored approach has been utilized as an intervention to mitigate skin problems and
improve quality of life (Branemark et al., 2001). In this method, the prosthesis is directly
attached to the bone through a percutaneous implant system (Branemark et al., 2001,
Brånemark et al., 2014) (Figure 2.3). This type of surgery has been depicted additional benefits
to the amputees including walking ability improvement (Frossard et al., 2010, Hagberg et al.,
2014), energy cost reduction (Van de Meent et al., 2013), awareness improvement through
osseoperception (Jacobs et al., 2000, Haggstrom et al., 2013), good alignment of femur and hip
range of motion (Frossard et al., 2013, Frossard, 2019, Frossard et al., 2019).
Figure 2.2- A socket-type prosthesis.
(Moveforwarddpt)
Figure 2.3- An osseointegrated transfemoral
amputee. (Kennon)
Individuals with unilateral transfemoral amputation have shown musculoskeletal
disorders when compared to able-bodied people. For example, a greater prevalence of the hip

13
and knee osteoarthritis (OA) in the intact limb with 14% than non-amputees, has been
evidenced in their population (Morgenroth et al., 2012, Welke et al., 2019). The greater risk of
developing the knee OA of the intact limb in transfemoral amputees than non-amputees has
been depicted in previous studies (Hungerford and Cockin, 1975, Kulkarni et al., 1998, Melzer
et al., 2001). For instance, approximately two-third of transfemoral amputees fitted with socket
have exhibited knee degeneration in the intact limb, compared with one-fifth of a matched
control group (Hungerford and Cockin, 1975). Norvell et al have indicated that the
symptomatic knee OA in the intact limb of lower limb amputees was greater than the non-
amputees, even when the subjects with a knee trauma history were excluded from the study
(Norvell et al., 2005). In another study, 27% of individuals with lower extremity amputation
has been reported to be indicative of the intact limb knee OA in comparison with 2% of non-
amputees (Struyf et al., 2009).
There is a strong relation between joint conditions and mechanical loading and joint OA
development. The loading abnormality of the articular cartilage lends evidence to the incident
of OA (Radin et al., 1991, Felson et al., 1992). The body weight effect on joint degeneration is
an important factor in the OA pathogenesis (Felson et al., 1992, Messier et al., 2005). It also
has been confirmed that an increase in GRFs may be directly associated to a high possibility
of lower limb joints OA in healthy subjects (Lemaire and Fisher, 1994, Robbins et al., 2001).
Hence, greater GRFs in the intact limb than that of the residual limb of transfemoral amputees
may contribute to joint loading abnormalities and degeneration.
Transfemoral amputees also have been reported to exhibit a higher risk of low back pain
(Kulkarni et al., 2005, Morgenroth et al., 2009, Morgenroth et al., 2010, Matsumoto et al.,
2018). These secondary musculoskeletal disorders have mostly resulted from disability in
mobility, which affect their quality of life and physical activity such as walking and running
(Hagberg and Brånemark, 2001b, Hagberg et al., 2004, Van de Meent et al., 2013).

14
2.2 Biomechanical parameters in transfemoral
amputees during walking
This section reviews previous studies on spatiotemporal parameters, kinematics, kinetics,
EMG and muscle forces in transfemoral amputees.
Spatiotemporal, kinematics and kinetics
Gait deviations in transfemoral amputees fitted with socket prosthesis have been
extensively investigated in previous studies, including reduction in walking speed and increase
in metabolic cost of energy compared to able-bodied people (Vaughan et al., 1992, Jaegers et
al., 1995b, Boonstra et al., 1996, Genin et al., 2008). Transfemoral amputees have shown longer
stance phase and stride length as well as wider stride width in the intact limb in comparison
with their residual limb and non-amputees (Jaegers et al., 1995b, Mattes et al., 2000, Segal et
al., 2006, Hof et al., 2007, Goujon-Pillet et al., 2008, Highsmith et al., 2010, Pinard and
Frossard, 2012, Wentink et al., 2013). Furthermore, the higher hip joint range of motion and
ground reaction forces (GRFs) in the intact limb than those of the residual limb have been
found in previous experimental studies (Sjödahl et al., 2002, Sjödahl et al., 2003, Goujon-Pillet
et al., 2008, Schaarschmidt et al., 2012, de Cerqueira et al., 2013). Reduced hip, knee and ankle
moments, works and powers have been observed in the residual limb relative to those of the
intact limb during walking (Seroussi et al., 1996, Segal et al., 2006, Prinsen et al., 2011, Okita
et al., 2018).
However, a few studies have considered biomechanical parameters in individuals with
osseointegrated prosthesis during gait. Previous studies have observed increased self-selected

15
walking speed, shorter walking time and quicker cadence in the osseointegrated amputees in
comparison to socket amputees as well as slower cadence and larger walking duration
compared to non-amputees (Hagberg et al., 2005, Frossard et al., 2010, Tranberg et al., 2011,
Pinard and Frossard, 2012, Van de Meent et al., 2013, Leijendekkers et al., 2017, Robinson et
al., 2020).
2.2.2 EMG and muscle forces in transfemoral amputees
Muscle behaviors in transfemoral socket amputees have primarily been focused on
studies associated with EMG. A greater level of muscle activation and longer duration have
been observed in transfemoral amputees compared to non-amputees (Jaegers et al., 1996, Bae
et al., 2009, de Cerqueira et al., 2013, Wentink et al., 2013). Wentink showed longer activity
in most of the upper leg muscles of the residual limb in late-stance in contrast to non-amputees,
which may be due to increase in socket fitting by lifting the prosthesis in the swing phase (Hong
and Mun, 2005, Wentink et al., 2013). In addition, the prolonged activity of the lower limb in
the intact limb (Wentink et al., 2013), including soleus and tibialis anterior, may be related to
an increase in ankle plantarflexors’ work in pre-swing to push the body forward and also assist
foot clearance (Seroussi et al., 1996, Nolan and Lees, 2000). In another study, the activation of
gastrocnemius and the coactivation of the upper leg intact limb's muscles were shown to be
greater in amputees than a control group, which may correspond to excessive ankle power of
the intact limb relative to the residual limb (Bae et al., 2009). In osseointegrated transfemoral
amputees, the similarity was found in the function of the residual limb's hip muscles activities
compared to those in able-bodied people (Pantall and Ewins, 2013).

16
2.3 Musculoskeletal modeling and challenges
This section explains challenges in human locomotion modeling and muscle force
prediction. These challenges are resulted from the experimental data collection process.
Therefore, the limitations of the results of muscle forces must be taken into account. Besides
the simulation' challenges, the merits of computational and simulation-based approaches are
discussed. Finally, the muscle forces' validation during walking will briefly be reviewed, which
can be evidence to justify some of the challenges.
Only few studies have used simulation and modeling to investigate gait in transfemoral
amputees. Burkett et al. developed a simple two-dimensional model, using a forward dynamics
approach, to simulate the swing phase of the residual limb to optimize knee position (Burkett
et al., 2004). In other simulation studies, 2D dynamic models of the residual limb were
developed to optimize knee motion controller with the focus on gait biomechanical measures,
including spatiotemporal parameters, joint kinematics, and kinetics (Pejhan et al., 2008,
Shandiz et al., 2013). Also, a 2D musculoskeletal model was constructed to minimize muscles
metabolic cost of energy with the purpose of optimizing knee joint friction of the residual limb
(Suzuki, 2010). Collectively, a comprehensive three-dimensional musculoskeletal simulation
should be utilized to indicate well the role of muscles and act more realistic to human walking.
Bae et al. calculated muscles forces using dynamic simulation and found that the forces
generated by the hip abductors and extensors and knee extensors of the intact leg were greater
than those in the residual limb, which is because of inadequate hip joint torque in the residual
limb relative to the intact limb (Bae et al., 2007). A muscle-driven simulation technique was
utilized to examine differences in muscle forces to minimize the period of swing phase (Suzuki,
2010). Furthermore, Ranz et al. investigated the effect of amputation techniques on muscle
load during walking. The musculoskeletal model results showed that the balance and capacity

17
of muscles were greater when myodesis stabilization was considered (Ranz et al., 2017).
However, the latter observation concluded hip adduction moment and moment arm, the lack of
reporting individual muscles forces still exists. Thus, variations in muscles forces in
transfemoral amputees should be well illuminated to distinguish the role of muscles in walking.
Ranz' model also used data from one non-amputee which does not reflect the real behavior of
amputees. Also, Ranz' study did not consider prosthesis properties such as mass, center of mass
and moment of inertia.
2.3.1Computational frameworks in muscle forces
prediction during walking
The method of muscle forces and activations’ calculation has been a debatable topic. It
is impossible to directly and non-invasively measure muscle forces. Nonetheless, some
invasive techniques such as strain-gauge transducers have been applied to measure muscle
forces (Komi et al., 1987, Fukashiro et al., 1995, Komi et al., 1996, Komi, 2000). Ethical
considerations do not encourage the in vivo regular use due to many known disadvantages such
as indistinguishable between muscles and between muscle and tendon components. In addition,
such methods are capable of measuring a single muscle force and then cannot be included the
coordination of multiple muscles at a time.
Musculoskeletal models and simulation frameworks have widely been used to
understanding muscle behaviors during daily activities due to unfeasibility of invasive
measurements of the biomechanical parameters such as muscle forces (Zajac et al., 2002, Zajac
et al., 2003). These frameworks mathematically represent human body and include skeleton,
which is a series of rigid bodies, that connects by varying degrees of freedom of joints. The

18
skeleton joints are then actuated by muscles (Delp et al., 1990, Ward et al., 2009). A human
body, which uses the same principles of a multi-body dynamics to simulate robots and
machines, is actuated by the muscles and GRFs to produce locomotion (Erdemir et al., 2007).
On the other hand, the lack of suitable muscle model and geometry, then physical muscle
properties as well as a large number of muscles have been recognized as major challenges in
human motion simulation (Erdemir et al., 2007, Fregly et al., 2012). For instance, opposed to
large number of muscles, limited number of equilibrium equations exist to predict the muscle
forces. Thus, this inherent property ideally propelled researchers in using optimization-based
approaches. To calculate muscle forces, a musculoskeletal model needs to consider the muscle
lines of action and moment arms, the force-generation muscle properties and an optimization
technique. Each of these features will be discussed below.
2.3.1.1 Muscle lines of action and moment arms
Each muscle crossing the joints is determined by unique origin and insertion points. The
muscle paths, however, are often represented as curves around joints. A muscle line of action
is defined as the direction of the resultant generated force at each point of attachment. The
moment arm is referred to the perpendicular distance between the joint center of rotation and
the muscles line of action. The joint torque is estimated as a product of the muscle force and
the moment arm. A biarticular muscle spanning two joints produces different torques of joint.
The greater joint torque occurs at the joint with a larger moment arm. A muscle moment arm
needs an accurate estimation for the calculation of the joint torque to drive human motion (Delp
and Loan, 1995).

19
2.3.1.2 Muscle model: Force-generation properties
A muscle, which is responsible for body posture and locomotion, is excited and activated
by a neural signal and then produces force and power. Muscles are connected to the skeleton’s
bones through tendons. The properties of muscle force generation configure the principles of
producing force and movement. The magnitude of a muscle force depends on the length-
velocity relationship of the muscle fibers (Hill, 1953, Bahler, 1968). As shown in Figure 2.4,
the relationship between the force and the length of a muscle describes the amount of force
generated at different muscle lengths. The percentage of muscle excitation is determined by
the shape of the force-length graph. Also, the force-velocity curve depicts that increasing
velocity of concentric (shortening) contractions will rapidly generates less force and greater
force will be because of increasing velocity of eccentric (lengthening) contractions.
Figure 2.4. The maximum isometric force (𝐹𝑜𝑚 ) describes the force in the muscle under
maximum (100%) isometric contraction. As seen in the active force-length curve (left), peak
force is produced when the muscle is at its resting length (𝑙𝑜𝑚). When a muscle is shortened
below or above its resting length (i.e. a muscle operating on the ascending or descending
region, respectively), it produces less force output. Passive force is produced when the
muscle is lengthening but not active. The force-velocity curve (right) shows that under
isometric conditions, the muscle is neither shortening or lengthening. A muscle produces no
force when it reaches its maximum shortening velocity (𝑉𝑚𝑎𝑥).

20
Hill-type muscle-tendon actuator is mostly used to model a muscle which is connected
in series with an elastic tendon (Hill, 1938, Zajac and Gordon, 1989). Based on this model, a
muscle comprises active and passive elements acting in parallel. The inherent parameters of
the Hill-type model, which are due to a great number of cadaver studies (Delp et al., 1990,
Ward et al., 2009), are a maximum isometric force, pennation angle, muscle fiber length and
tendon slack length (Thelen et al., 2003).
2.3.1.3 Methods of muscle force estimation
To estimate muscle forces, various optimization means as described in this subsection
may be used.
Inverse dynamics methods only require the joints position and GRFs as external forces to
calculate the forces of muscles spanning the joints. Forward dynamics techniques try to use
muscle excitation/activation to generate the desired motion. These two methods are based on
optimization; however, forward dynamics uses one optimization problem during a complete
gait cycle and is a more computationally expensive approach. In inverse dynamics-based
methods such as static optimization, an objective function is applied to iteratively compute and
update muscle forces at each time step. In forward dynamics, the tracking error between
experimental data and kinematics predicted by the model is minimized to iteratively estimate
muscle excitations.
Static optimization strategies have been applied to various daily activities of healthy and
pathological subjects such as walking (Anderson and Pandy, 2001b, Pandy and Andriacchi,
2010, Lim et al., 2013), running (Edwards et al., 2010, Dorn et al., 2012b) and landing
(Mokhtarzadeh et al., 2013, Ewing et al., 2016). This approach is sensitive to the selected

21
objective functions including the sum of squared muscle stress, instantaneous muscle power,
and minimizing total muscle activations (Crowninshield and Brand, 1981, Collins, 1995,
Rasmussen et al., 2001, Cleather and Bull, 2011). A major limitation associated with static
optimization theory is its inability to accurately predict co-activation of agonist-antagonist
muscles (Lin et al., 2011). In a mathematical model, the two-joint antagonistic muscles such
as the contraction of rectus femoris and hamstrings during cycling have been demonstrated to
be simultaneously activated as they are shortening (Ait-Haddou et al., 2000). Multiple degrees-
of-freedom (DOF) systems have been shown to produce incompatible forces when considered
with fewer DOFs (Jinha et al., 2006). However, static optimization approach has been proven
to predict muscle contraction in a system with one and three DOF knee joint during a landing
motion (Mokhtarzadeh et al., 2014).
Forward dynamics method includes excitation-contraction dynamics which acts
differently than static optimization. An objective function along with a constraint that limits
excitation between 0 and 1 is utilized. Regarding the time limitations of numerous integrations
of the model state equations performance, simplifications such as the reduction in the number
of muscles (Davy and Audu, 1987) and grouping excitation patterns (Neptune and Hull, 1998)
are applied. In 2003, computed muscle control algorithm (CMC) was introduced which
requires one integration of the state equations and includes many muscles to produce a muscle-
actuated forward simulation (Thelen et al., 2003). CMC thrived to diminish the computational
cost evolved from dynamic optimization by including both static optimization and feedback
control theory. Notably, CMC has been used to predict muscle forces during walking
(Anderson and Pandy, 2003), running (Lin et al., 2012) and landing (Mokhtarzadeh et al.,
2014).
In addition to the optimization techniques explained above, a neuromusculoskeletal
tracking (NMT) can be applied to dynamically resolve muscle redundancy problem (Seth and

22
Pandy, 2007). NMT considers forward dynamics and an additional time-dependent objective
function. In all optimization techniques, the selection of objective function is controvertible.
Although Pandy has shown that different objective function would result in similar muscle
forces (Pandy et al., 1995), it has been found producing realistic gait requires fatigue-like cost
functions (Ackermann and Van den Bogert, 2010).
EMG-driven forward dynamics model is another technique to predict muscle forces. The
EMG data is used to prescribe muscle activations into the model (Hof and Van den Berg, 1981).
The requirement of this method is the isometric EMG and joint torque relationship obtained
through maximal isometric trials to measure maximum voluntary contractions (MVCs). An
EMG-to-activation model was utilized in a broad range of tasks to represent muscle activation
to estimate the joint moments calculated by inverse dynamics (Lloyd and Besier, 2003, Shao
et al., 2009, Sartori et al., 2012). To represent physiological parameters, EMG-driven models
need a time-consuming calibration process. Furthermore, muscle forces are calculated by
multiplying maximum isometric force and EMG activation normalized by MVC in EMG-to-
force models. The predicted muscle forces of ankle plantarflexors have been depicted good
correlation to those estimated using static optimization, however, the forces generated by knee
muscles have shown less correlation (Bogey et al., 2005, Heintz and Gutierrez-Farewik, 2007).
Finally, a measured MVC is mostly subjective and depends on the subject motivation to
contract a muscle to a maximum level.
In general, measuring EMG signals depends on many factors (De Luca, 1997); some
controllable factors are called extrinsic factors such as electrode placement and type of signal
measurement device, while some intrinsic factors related to the inherent properties of the
muscle such as fiber density, diameter, and depth. The EMG signals can also be contaminated
by noises caused by skin artefact and cross-talk from nearby muscles. Thus, the measured
signals of reliability are influenced. Moreover, suitable signal processing methods should be

23
selected. Regarding the limitations of EMG data recording and interpreting, these models must
be used carefully.
2.3.2 Challenges in modeling
Experimental measurements must be used to validate musculoskeletal modeling (Zajac
et al., 2002). One potential challenge relates to experimental errors (e.g. GRF, EMG and
kinematics) and model errors when joint kinematics and marker trajectories and inertial
characteristics of prosthesis are computed (Dumas et al., 2016). These unavoidable and
common errors in biomechanics, which affect the accuracy of the muscle forces, could be
reduced through filtration of data (Kristianslund et al., 2012, Kristianslund et al., 2013).
Another inherent challenge in human locomotion simulation and muscle force estimation is the
effect of changes in the musculotendon properties. Although the Hill-type model is one of the
widely-used muscle models in computer-based simulations, some of its parameters (e.g. fiber
and tendon slack length) may have intrinsic errors evolved from medical images during
determining some anatomical variables (Wretenberg et al., 1996, Tsaopoulos et al., 2007).
Moreover, maximum isometric forces measurements obtained from cadavers may be
controversial, in which they may not represent the exact behavior of muscles during daily
activities of humans. However, experimental measures only in gait are standardized. The
maximum isometric force must be varied for each muscle to ensure the generated muscle forces
are enough to balance the forces and moments around joints with the net joint torques (Dorn et
al., 2012b).
Another issue concerning simulation is that major lower extremity muscles are more
sensitive in the prediction of muscle forces through changes in the muscle moment arm and
tendon slack length (Ackland et al., 2012). However, the sensitivity of muscle-tendon slack

24
length to muscle function has been indicated to be greater than that of muscle moment arm
(Ackland et al., 2012). Although the above-mentioned challenges in the simulation may affect
the accuracy of the results, the biomechanical areas take advantage of musculoskeletal
modeling due to its superior to invasive procedures (Fregly et al., 2012).
2.4 Induced acceleration analysis of human
locomotion: state of the art
In a dynamic system, the effects of individual forces to generate coordinated motion are
identified using induced acceleration analyses. In fact, accelerations caused or induced by
individual forces are computed using this method. For instance, individual actuators (e.g.
muscles and devices) function in producing human motion are often determined by these
analyses (Zajac et al., 2002, Zajac et al., 2003). Induced acceleration analyses have been shown
as powerful techniques to identify targeted muscles for surgical procedures such as muscle
lengthening and tendon transfer or exercise training and rehabilitation programs. The
development and design of prostheses, orthoses, and exoskeletons can also be influenced by
identifying muscle behaviors.
As described in section 2.3, muscle forces can be calculated using musculoskeletal
modeling. Thereafter, induced acceleration analyses are capable to interpret how each force
contribute to generating the simulated movement, which cannot be achieved by another
method. These state-of-the-art analyses, particularly, determine the role of individual muscles
to either accelerate or decelerate body center of mass and joint. In the application to human
movements, these techniques have been used to identify muscles adaptation to walking
(Neptune et al., 2001, Anderson and Pandy, 2003, Neptune et al., 2004, Liu et al., 2006, Lim

25
et al., 2013, Lin et al., 2015), running (Dorn et al., 2012b, Hamner and Delp, 2013, Debaere et
al., 2015), turning (Ventura et al., 2015), pathologic gait (Peterson et al., 2010, Steele et al.,
2010, Silverman and Neptune, 2012), stair walking (Lin et al., 2015), upslope/ downslope
walking (Pickle et al., 2016), and other tasks.
Induced acceleration analyses have been assessed pathological gait to explain that how
altered movement patterns may be evolved from differences in individual muscles functions.
For example, crouch gait in children with cerebral palsy is characterized by excessive hip and
knee flexion. This analytical method has revealed that greater crouched postures are provided
by an increase in the uniarticular knee extensor demand. Because, a reduction in the efficacy
of body support from a straighter leg posture increases the contribution of muscles to skeletal
support (Steele et al., 2010). In people with stroke, the higher functional walking status has
been depicted to associate with the hip abductors and ankle plantarflexors’ contributions to
body propulsion (Hall et al., 2011).
In below-knee amputees, the residual limb’s body propulsion is reduced due to the lack
of ankle plantarflexor muscles function. This reduction is correlated with a decrease in the
ipsilateral knee extensors forces to maintain constant walking speed by slowing down of the
body center of mass (Silverman and Neptune, 2012). The approach of induced acceleration
methods has demonstrated that the reduced knee extensors’ contributions to body support and
backward propulsion (breaking) in patients with total knee arthroplasty may be related to the
movement patterns of quadriceps avoidance. As an adaptation strategy, trunk muscles provided
greater contributions to supporting and breaking the body by forward leaning of the trunk (Li
et al., 2013).
Induced acceleration analysis approaches can also be applied to determine how muscles
contribute to joint contact forces. In people with transfemoral amputation, the intact limb hip

26
and knee joint has been proven to be in a high risk of OA (Struyf et al., 2009, Morgenroth et
al., 2012). Similarly, identifying muscle behaviors in joint loads are of importance in
rehabilitation training to prevent osteoarthritis progression and joint pain. Obviously, the
results of induced acceleration analyses have delivered valuable information in understanding
pathological gait patterns with many potential applications for clinical translation.
2.5 Muscle contributions to walking
The muscles’ coordination act as actuators to enable the body operating over ground
walking, running and up-down stairs walking (Zajac, 2002, Zajac et al., 2002, Pandy and
Andriacchi, 2010). Each muscle accelerates joints via generating a torque about that joint,
which is defined by multiplying muscle moment arm (i.e. the distance from the joint center)
and muscle force, to initiate movement (Zajac et al., 2002). In addition, non-crossing joint
muscles have been shown to accelerate that joint via the dynamic coupling mechanism. In this
regard, an individual muscle contribution to center of mass (COM) acceleration is calculated,
consequently using Newton’s Third Law, its contribution to the forces and moments generated
by the foot-ground interaction is computed (Pandy et al., 2010, Dorn et al., 2012a, Lim et al.,
2013, Lin et al., 2015). The individual muscle contribution to the gravity, inertia and foot-
ground interaction is in good agreement with the laboratory-collected GRF patterns (Anderson
and Pandy, 2003). As the GRF is the main external force acting on the foot, in which by
applying the Newton's Second Law, necessitates behaving as the primary responsible for the
body COM acceleration (Winter, 2009). In addition, transfemoral amputees are unique
population because inverse dynamics can be validated with direct measurements (Dumas et al.,
2016).

27
Previous studies on able-bodied subjects have extensively investigated the role of lower
limb muscles in the fore-aft, vertical and mediolateral COM acceleration which represent
forward progression (accelerate or decelerate the body), body support against gravity and
mediolateral balance, respectively (Neptune et al., 2001, Anderson and Pandy, 2003, Neptune
et al., 2004, Liu et al., 2006, McGowan et al., 2009, Pandy et al., 2010). These studies have
mentioned that the vasti and gluteus maximus contributed to braking in early stance, while
soleus and gastrocnemius were the major contributors in the late stance (Zajac et al., 2003,
Neptune et al., 2004, Lim et al., 2013, Lin et al., 2015). Body support was mostly provided by
the vasti, gluteus maximus and gluteus medius in the first half of stance and the ankle
plantarflexors contributed to vertical COM acceleration in the second half of stance (Liu et al.,
2006, Pandy and Andriacchi, 2010, Lim et al., 2013). Individual muscle contribution to
mediolateral COM acceleration has also been considered during walking. The hip adductors
and hamstrings have been shown to be important contributors to lateral COM acceleration
during early stance to maintain body balance (Pandy et al., 2010, Silverman and Neptune,
2012). Soleus and gastrocnemius were responsible for providing lateral acceleration during late
stance (Allen and Neptune, 2012, Silverman and Neptune, 2012). The medial balance was
notably provided by gluteus medius throughout stance (Pandy et al., 2010, Lim et al., 2013),
whereas tensor fascia latae contributed medially in mid-stance (Allen and Neptune, 2012,
Silverman and Neptune, 2012). The vasti acted to accelerate the body laterally in early stance
(Pandy et al., 2010, Lim et al., 2013). However, one study has found the medial contribution
of the vasti to COM acceleration (Allen and Neptune, 2012).
In lower limb amputees, either the role of some missed muscles such as soleus,
gastrocnemius and the vasti or the re-anchored muscles of the residual limb such as hamstrings
may influence ambulation and result in gait compensatory mechanism. There is only one study
investigated muscle contribution to GRF impulse in transfemoral amputees using optimization

28
through a forward dynamics technique (Ranz, 2016). Ranz found that intact limb's body
support was primarily provided by tibialis anterior, gluteus maximus, gluteus medius, and
hamstrings in the first half of stance. The major contributors to support during the second half
of stance of the intact limb were soleus and gastrocnemius, followed by tibialis anterior, the
vasti and iliacus and psoas. Hamstrings and gluteal muscles of the residual limb were the great
contributors to support during the first half of stance, while gluteus medius produced a major
contribution to vertical GRF impulse in the second half of stance. Furthermore, the intact limb
hamstrings contributed more to forward propulsion in the first half of stance, whereas tibialis
anterior and iliacus and psoas were the important contributors to braking. During the second
half of stance, soleus and gastrocnemius contributed anteriorly, while iliacus and psoas
contributed posteriorly. Of the residual limb, hamstrings and both iliacus and psoas contributed
more to the fore-aft GRF impulse, respectively. Moreover, the intact limb balance was mostly
provided by the contribution of the gluteal muscles to lateral GRF impulse. In the residual limb,
gluteal muscles were the major contributors to medial GRF impulse, followed by hamstrings.
Also, the prosthesis was found to functioning similar to the vasti and ankle plantarflexors of
the intact limb (Ranz, 2016).
Although this study has depicted muscle contribution to walking, it has not shown the
muscle behavior throughout the whole stance, specifically in major gait events such as heel-
strike and toe-off in both intact and residual limbs. Ranz' study has not investigated muscle
behavior in transfemoral amputees with the osseointegrated prosthesis or active knee socket
prosthesis. In addition, the kinematic data applied in Ranz' study was from an able-bodied
person, not an amputee. Another limitation of that study was lack of the inertial properties of
the prosthesis (e.g. mass, center of mass and moment of inertia) in the musculoskeletal
modeling. That study has also used a muscle-driven method to obtain muscle forces. The results
of forward dynamics algorithms have been depicted to be less robust and efficient than those

29
which are calculated based on the static optimization method (Lin et al., 2012). Since some
muscles are absent in amputees, the functional behavior of other muscles and prosthesis would
be different from non-amputees which needs to be considered.
2.6 Muscle contribution to hip contact forces
The lower extremity joints are susceptible to structural degeneration and injury over time
due to their functional roles to withstand high contact forces during daily activities. For
instance, an increase in joint loadings has been associated with the progression of OA (Felson,
2004, Lafeber et al., 2006). Previous in vivo studies have reported hip contact force during
walking using instrumented implants in non-amputees (Rydell, 1966, Davy et al., 1988, Kotzar
et al., 1991, Bergmann et al., 1993, Read and Nigg, 1999, Bergmann et al., 2001, Damm et al.,
2013). This costly and invasive approach, however, is restricted to patients who mostly have
undergone hip joint replacement surgery and cannot be applied for healthy able-bodied people
and amputees (Read and Nigg, 1999). Computer-based simulation frameworks have been
demonstrated as an alternative approach for obtaining reasonable estimates of hip contact
forces during walking in non-amputees (Brand et al., 1994, Heller et al., 2001, Stansfield et al.,
2003). The results of simulation have been compared, then validated and concluded to be in
good agreement with the in vivo experiments (Heller et al., 2001).
Lower limb muscles act as primary contributors to the joints’ mechanical loading
(Herzog et al., 2003). One study has found a correlation between the atrophy of hip muscles,
as a reduction in muscles strength (Gottschalk, 1999), and hip OA (Amaro et al., 2007). The
role of hip abductors is related to maintain joint stability and prevent overloading in the
musculoskeletal system during walking (Amaro et al., 2007). The weakness in gluteus medius
in the stance limb will unstable pelvis with an excessive drop towards the swinging limb, which
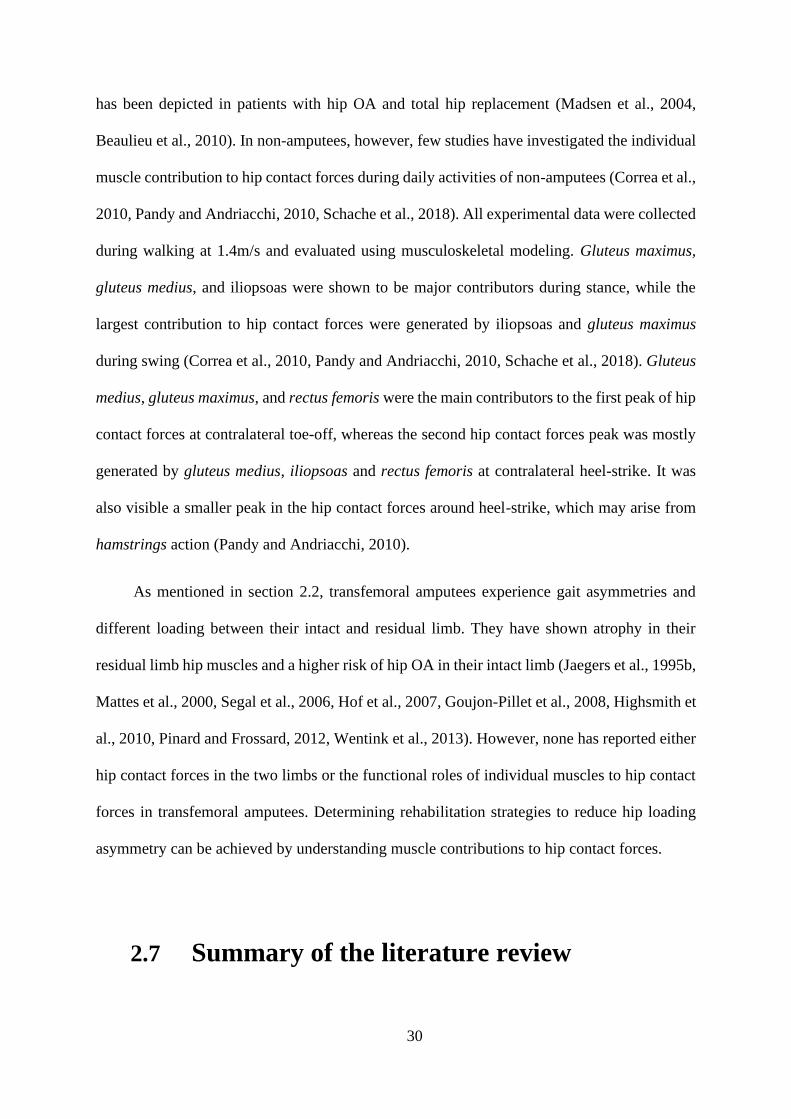
30
has been depicted in patients with hip OA and total hip replacement (Madsen et al., 2004,
Beaulieu et al., 2010). In non-amputees, however, few studies have investigated the individual
muscle contribution to hip contact forces during daily activities of non-amputees (Correa et al.,
2010, Pandy and Andriacchi, 2010, Schache et al., 2018). All experimental data were collected
during walking at 1.4m/s and evaluated using musculoskeletal modeling. Gluteus maximus,
gluteus medius, and iliopsoas were shown to be major contributors during stance, while the
largest contribution to hip contact forces were generated by iliopsoas and gluteus maximus
during swing (Correa et al., 2010, Pandy and Andriacchi, 2010, Schache et al., 2018). Gluteus
medius, gluteus maximus, and rectus femoris were the main contributors to the first peak of hip
contact forces at contralateral toe-off, whereas the second hip contact forces peak was mostly
generated by gluteus medius, iliopsoas and rectus femoris at contralateral heel-strike. It was
also visible a smaller peak in the hip contact forces around heel-strike, which may arise from
hamstrings action (Pandy and Andriacchi, 2010).
As mentioned in section 2.2, transfemoral amputees experience gait asymmetries and
different loading between their intact and residual limb. They have shown atrophy in their
residual limb hip muscles and a higher risk of hip OA in their intact limb (Jaegers et al., 1995b,
Mattes et al., 2000, Segal et al., 2006, Hof et al., 2007, Goujon-Pillet et al., 2008, Highsmith et
al., 2010, Pinard and Frossard, 2012, Wentink et al., 2013). However, none has reported either
hip contact forces in the two limbs or the functional roles of individual muscles to hip contact
forces in transfemoral amputees. Determining rehabilitation strategies to reduce hip loading
asymmetry can be achieved by understanding muscle contributions to hip contact forces.
2.7 Summary of the literature review

31
This review summarized the biomechanical behavior of transfemoral amputees during
walking. First, a definition of transfemoral amputation was presented. Then, spatiotemporal,
kinematics and kinetics parameters, as well as muscle EMG during walking of transfemoral
amputees, were reviewed. Much of the current literature paid particular attention to two issues:
i) musculoskeletal modeling to explain the need for using simulation to understand walking
mechanism in transfemoral amputees and ii) induced acceleration analysis method to
investigate individual muscle contribution to forward progression, body support, and
mediolateral balance during walking as well as contribution to hip contact forces. In view of
all that has been mentioned so far, too little attention has been paid to using musculoskeletal
modeling for analyzing compensatory mechanism in transfemoral amputees. Thus, chapter 3
will focus on developing a musculoskeletal model to represent transfemoral amputee. Chapters
4 and 5 will comprehensively elaborate the muscles behavior amongst amputees with socket
(passive and active knee joint) and amputees with osseointegration prosthesis.

32

33
The methodology used in this chapter is based on the two published and submitted papers
mentioned at the beginning of chapters 4 and 5.
Experimental and
computational methods

34
3.1 An overview of experimental and computational
approaches in this study
Two major steps including human motion experiments and computational modeling were
conducted in this study. The accurate recording of motion data is crucial for developing three-
dimensional musculoskeletal modeling and computational analyses. In turn, the realistic
predictions of muscle forces, as well as muscle contribution to COM acceleration and joint
contact forces, depending on the quality of motion data and educated assumptions. A total of
ten participants with transfemoral amputation were recruited for motion data collection at the
MOVE lab of the Royal Melbourne's Hospital, Australia.
This chapter describes in detail the experimental and musculoskeletal modeling
development and computational methods used to collect and analyze the walking data for
investigating gait asymmetry in amputees. This includes subject recruitment, muscle
contribution and loading on the lower limb joints. For clarity, the methodology explained in
this chapter will also be stated briefly in the methods section of the studies of Chapters 4 and
5.

35
3.2 Experimental data collection
3.2.1 Subject recruitment
Six transfemoral amputee wearing a conventional socket prosthesis (herein referred to
SP users), with a mean ± standard deviation (SD) age, 48.83 ± 18.71 yr.; mass, 71.33 ± 8.57
kg; height, 1.77 ± 0.15 m (Table 3.1), and four osseointegrated transfemoral amputees (herein
referred to OI users) with age, 56 ± 3.46 yr.; mass: 80.38 ± 12.45 kg; height:1.80 ± 0.13 m
(Table 3.2), participated in this study. The inclusion criterion for this study was a unilateral
amputation of participants who were able to walk without assistive devices such as crutch.
Eligible subjects had their own prosthesis during experiments. Ethical approval was obtained
by the Melbourne Health Human Research Ethics Committee with the number HREC
2015.148, and each participant provided written informed consent. This study was performed
at the MOVE Lab of The Royal Melbourne’s Hospital, Melbourne, Australia.
Table 3.1. Subject specification of SP users. The amputation level is medium for all subjects.
Subject Sex Cause of
amputation
Prosthetic
Socket Type Knee Joint Foot
Residuum
length
S1 Male trauma quadrilateral 3R92 1C30 22
S2 Male osteosarcoma ischial
containment GENIUM 1C60 19
S3 Male trauma quadrilateral SPECTRUM TRUESTEP 25
S4 Male trauma ischial
containment GENIUM 1C61 27
S5 Male trauma quadrilateral 3R49 MULTIFLEX 18
S6 Male trauma ischial
containment GENIUM 1C61 20
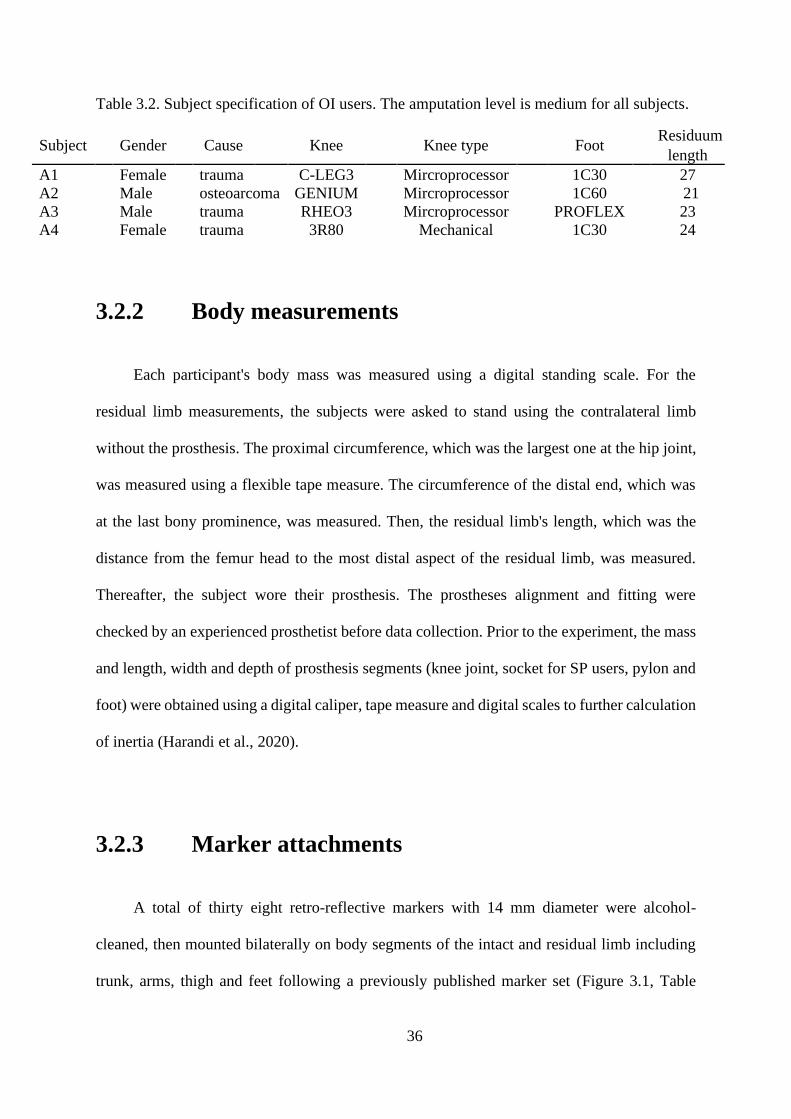
36
Table 3.2. Subject specification of OI users. The amputation level is medium for all subjects.
Subject
Gender
Cause
Knee
Knee type
Foot Residuum
length
A1 Female trauma C-LEG3 Mircroprocessor 1C30 27
A2 Male osteoarcoma GENIUM Mircroprocessor 1C60 21
A3 Male trauma RHEO3 Mircroprocessor PROFLEX 23
A4 Female trauma 3R80 Mechanical 1C30 24
3.2.2 Body measurements
Each participant's body mass was measured using a digital standing scale. For the
residual limb measurements, the subjects were asked to stand using the contralateral limb
without the prosthesis. The proximal circumference, which was the largest one at the hip joint,
was measured using a flexible tape measure. The circumference of the distal end, which was
at the last bony prominence, was measured. Then, the residual limb's length, which was the
distance from the femur head to the most distal aspect of the residual limb, was measured.
Thereafter, the subject wore their prosthesis. The prostheses alignment and fitting were
checked by an experienced prosthetist before data collection. Prior to the experiment, the mass
and length, width and depth of prosthesis segments (knee joint, socket for SP users, pylon and
foot) were obtained using a digital caliper, tape measure and digital scales to further calculation
of inertia (Harandi et al., 2020).
3.2.3 Marker attachments
A total of thirty eight retro-reflective markers with 14 mm diameter were alcohol-
cleaned, then mounted bilaterally on body segments of the intact and residual limb including
trunk, arms, thigh and feet following a previously published marker set (Figure 3.1, Table
37
3.3)(Schache et al., 2011, Dorn et al., 2012b). On the prosthesis, the markers were attached
over anatomical landmarks based on the intact limb (Harandi et al., 2020).
3.2.4 Walking protocol
Each subject performed several walking trials and three successful trials of over-ground
walking were chosen at their self-selected speed. The speed for each trial was measured using
two infrared timing gates located in a 4-meter walking way. A successful trial was defined in
which the participants stepped firmly with their feet within the boundaries of the force plates,
starting from heel-strike and ending at toe-off. This part of the gait cycle is defined as the stance
phase.

38
Figure 3.1- Marker set used in this study (Left). The numbers are described in Table 3.3. An
illustration of an individual with markerset.

39
Table 3.3. Markers locations used to motion data capture. For the prosthetic leg, it follows the
marker locations of the intact leg.
Marker Trunk
1 C7 14mm marker over spinous process of 7th cervical vertebra
Pelvis
2 RASI 14mm marker placed over right anterior superior iliac spine (ASIS)
3 LASI 14mm marker placed over left anterior superior iliac spine (ASIS)
4 SACR
14mm marker placed over midpoint between left and right posterior superior iliac
spines
Intact Limb Thigh
5 RTHAP 14mm marker located at the proximal anterior aspect of the right thigh
6 RTHAD 14mm marker located at the distal anterior aspect of the right thigh
7 RTHLP 14mm marker located at the proximal lateral aspect of the right thigh
8 RTHLD 14mm marker located at the distal lateral aspect of the right thigh
9 RLEPI 14mm marker over lateral epicondyle of right femur
10 RMEPI 14mm marker over medial epicondyle of right femur
Intact Limb Shank
11 RTIAP 14mm marker located on the proximal 1/3 of the anterior shaft of the right tibia
12 RTIAD
14mm marker located on the distal 1/3 of the anterior shaft of the right
tibia
13 RTILAT 14mm marker located on the mid lateral aspect of the right tibia
14 RLMAL
14mm marker located over the right lateral
malleolus
15 RMMAL
14mm marker located over the right medial
malleolus
Intact Limb Foot
16 RHEEL 14mm marker on distal aspect of bisection of right posterior calcaneum
17 RMFS 14mm marker on medial right midfoot
18 RMFL 14mm marker on lateral right midfoot
19 RP1MT
14mm marker on medial aspect of right 1st MTP
joint
20 RP5MT
14mm marker on lateral aspect of right 5th MTP
joint
21 RTOE 14mm marker on nail of 1st toe of right foot
Residual Limb
On the soft tissue of the residual limb, the markers followed the intact limb marker set
On the prosthesis, the markers were mounted over anatomical landmarks based on the intact limb
in medial and lateral knee and ankle, heel and toe

40
3.2.5 Data processing
Lower limb and upper body COM kinematics were derived by tracking three-
dimensional positions of the reflective markers using an eight-camera motion capture system
(Vicon, Oxford Metrics) sampling at 120 Hz. Marker trajectories and GRF were low-pass
filtered with a cut-off frequency of 4 and 60 Hz, respectively using a 4th order Butterworth
filter (Lin et al., 2015). Surface electromyography (EMG) data were recorded at 1000 Hz using
pairs of surface electrodes and Cometa system with 16 channels (Cometa, Milan, Italy). Each
amputee's skin was shaved with a disposable feather razor and cleaned with alcohol before
electrode placement. EMG electrode placement followed a previously described guidelines
(Hermens et al., 2000), and EMG data were checked prior to testing to ensure suitable electrode
placement and output (Hermens et al., 1999). Pairs of pre-gelled Ag/ AgCl bipolar electrodes
were placed on the intact limb’s muscles including gluteus maximus, gluteus medius, soleus,
medial and lateral gastrocnemius, and vastus medialis and lateralis and residual limb’s muscles
including gluteus maximus and gluteus medius (Table 3.4). During walking trials, GRFs were
simultaneously measured using three AMTI force platforms embedded in the floor
(Watertown, USA) at a sample rate of 1000 Hz (Harandi et al., 2020). Vicon cameras , force
plates and EMGs were automatically synced to each other.

41
Table 3.4. EMG electrode placements used for EMG data capture
Muscle Location Subject pose
Gluteus
maximus
Over greatest prominence of the middle of the buttocks.
Electrodes positioned 50% along a line connecting middle of
sacrum and GT. Line connecting electrodes is parallel
to line connecting PSIS and mid posterior thigh
Prone
Gluteus medius Electrodes positioned 50% along a line connecting iliac
crest and GT (or 3cm inferior to ASIS-PSIS, on a line with
(GT). Line connecting electrodes is parallel to iliac
crest-GT line
Side lying
Vastus lateralis Over area of greatest muscle bulk. Electrodes placed
approx 33%) up from patella along a line connecting ASIS
to lateral margin of patella. Line connecting electrodes is
parallel to muscle fibers
Supine, quads over
Fulcrum
Vastus medialis Over area of greatest muscle bulk. Electrodes placed
approx 20% up from MFC along a line connecting ASIS
and MFC. Line connecting electrodes is perpendicular to
the ASIS-MFC line
Supine, quads over
Fulcrum
Gastrocnemius Prone, fulcrum under
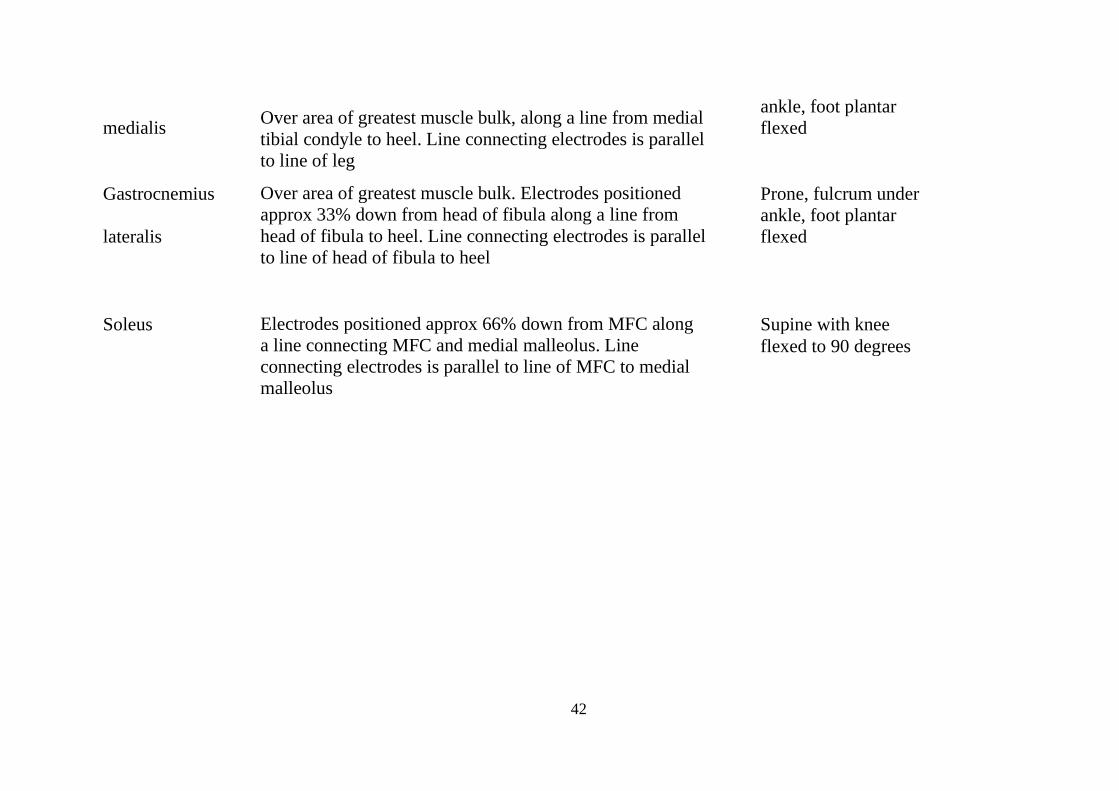
42
medialis Over area of greatest muscle bulk, along a line from medial
tibial condyle to heel. Line connecting electrodes is parallel
to line of leg
ankle, foot plantar
flexed
Gastrocnemius Over area of greatest muscle bulk. Electrodes positioned
approx 33% down from head of fibula along a line from
head of fibula to heel. Line connecting electrodes is parallel
to line of head of fibula to heel
Prone, fulcrum under
lateralis
ankle, foot plantar
flexed
Soleus Electrodes positioned approx 66% down from MFC along
a line connecting MFC and medial malleolus. Line
connecting electrodes is parallel to line of MFC to medial
malleolus
Supine with knee
flexed to 90 degrees

43
3.3 Musculoskeletal modeling
In this section, musculoskeletal modeling development will be explained in detail. The
marker trajectories, GRFs, and EMG data were extracted from C3D format and transformed
into a suitable format as input to OpenSim model using a freely available Gait-Extract toolbox
(https://simtk.org/home/c3dtoolbox) developed in MATLAB (The MathWorks, Inc., MA,
USA).

44
Table 3.5. The intact and residual leg muscles included in the model. * represents EMG data
collected of the intact limb muscles; ¥ represents EMG data collected of the contralateral side
muscles. ɸ represent the muscles not included in the model for the residual limb.
Muscle
Muscle
group
Gluteus medius *¥ (anterior, posterior and middle compartments) GMED Gluteus minimus (anterior, posterior and middle compartments)
Gluteus maximus *¥ (anterior, posterior and inferior compartments) GMAX
Hamstrings (Semimembranosus, Semitendinosus, Gracilis, Biceps femoris long
head) HAM
Biceps femoris short head ɸ BFSH
Adductor longus, Adductor brevis, Pectineus, Quadratus femoris, ALAM
Adductor magnus (superior, middle and inferior compartments)
Iliacus, Psoas IL
Gemellus GEM
Piriformis PIRI
Peroneus brevis PERBREV
Proneus longus PERLONG
Rectus femoris * RF
Sartorius SAR
Vasti *ɸ (medialis, intermedius and lateralis compartments) VAS
Gastrocnemius *ɸ (lateral and medial compartments) GAS
Soleus *ɸ SOL
Tibialis posterior ɸ TP
Tibialis anterior *ɸ TA
Flexor digitorum longus ɸ FDL

45
Extensor digitorum longus ɸ EDL
Flexor hallucis longus ɸ FHL
Extensor hallucis longus ɸ EHL
Tensor fascia late ɸ TFL
Erector spinae ERCSPN
Internal oblique INTOBL
External oblique EXTOBL

46
3.3.1 Healthy subject model
A generic three-dimensional musculoskeletal model was developed in OpenSim 3.2
(Delp et al., 2007). Each 23-degrees-of-freedom model comprised lower limb and trunk
segments actuated by 76 muscle-tendon units (Table 3.5). The Hill-type model in series with
an elastic tendon of the musculotendon unit was used to reflect muscle mechanics (Thelen,
2003). Physiological musculotendon parameters including muscle architecture, muscle
physiological cross-sectional area (PCSA), optimal fiber length, pennation angle, maximum
isometric force, and tendon slack length were derived from previous cadaver studies
(Wickiewicz et al., 1983, Delp et al., 1990, Friederich and Brand, 1990). The maximum
isometric force of each muscle is defined by multiplying the muscle PCSA and muscle tension.
The inertial properties (mass, center of mass and moment of inertia) of the twelve body
segments (torso, pelvis, femur, tibia, calcaneus, talus and toes) were derived from (Anderson
and Pandy, 2001a) study. The joints frame coordinates were defined based on Delp et al (Delp
et al., 1990). A single rigid body including the combined head, arm and torso was considered
to articulate with pelvis via a ball-and-socket back joint. The hip joints, the knee and metatarsal
joints, and each ankle-subtalar complex joint were modeled as ball-and-socket joints, hinge
joints, and a universal joint, respectively.
3.3.2 Model scaling
To accurately calculate lower limb joints moments and muscle forces, a generic
musculoskeletal model must be scaled for each participant. OpenSim scaling tool adjusts mass,
segment length and muscle parameters based on the individual's mass, length and diameter of
segments. A static standing trial was used to calculate the scaling factors for each segment, as

47
defined by the relative distances between pairs of markers (Delp et al., 2007). This participant-
specific scaled model was then modified to develop unilateral transfemoral amputee model.
3.3.3 Amputee subject model
The residual limb of the amputated leg was modeled as a frustum of a circular cone
(Mattes et al., 2000), and its measurements was described in section 3.2.1. The residual limb
tissue was assumed to be homogenous with a density of 1.1 g/cm3, in order to estimate mass,
the moment of inertia and COM position (Mungiole and Martin, 1990, Smith et al., 2014).
Subsequently, all musculoskeletal structures below the knee were removed from the non-
amputee scaled model described above. The hip adductors and hip flexors, which were known
as bi-articular muscles spanning the hip and knee joints, were re-attached in the model. These
re-anchored muscles were adductor magnus, semimembranosus, semitendinosus, biceps
femoris long head, rectus femoris, gracilis, sartorius and tensor fascia latae. Other uni-
articular muscles crossing the knee joint and those ankle-joint spanning muscles were removed
from the model (Table 3.5). The re-anchored muscles’ attachment points were positioned to
the distal end of the amputated femur (Harandi et al., 2020).
For the physiological properties of the re-anchored muscles, the surgical procedure of
muscle stabilization must be considered. In the traditional procedure, myoplasty, both agonist
and antagonist muscles are sutured over the femur. However, the muscle tension is not
preserved based on this method (Gottschalk, 2004), and muscle stabilization is modeled while
the tendon slack length is maintained. The matter of not keeping muscle tension has led to the
use of myodesis technique specifically for the medial hamstring and the adductor magnus
(Gottschalk, 2004, Tintle et al., 2010). A myodesis stabilization method has been demonstrated
to preserve those muscles directly reattached to the end of femur under tension. In addition, the
deep soft tissue padding is secured, and the stability of muscle is preserved (Tintle et al., 2010).

48
This approach tends to preserve the muscle tension of the reattached muscle relative to the
corresponding muscle in the intact limb during neutral position, by modifying the muscle-
tendon slack length (Ranz et al., 2017). Optimal fiber length value for each re-anchored muscle-
tendon unit was then calculated in equal proportion with the sum of tendon slack length and
fiber length of the intact limb's muscles in neutral position (Ranz et al., 2017). In this study,
the myodesis stabilization technique was used for modeling and analyses. However, the
myoplasty-based modeling result will be explained further in section 4.4. The reattached
muscles in this study were the adductor magnus, semimembranosus, semitendinosus, biceps
femoris long head, and gracilis, which were inserted posteriorly to the medial ridge of linea
aspera; rectus femoris and sartorius were inserted anteriorly to the distal part of an
intertrochanteric line and medial ridge of linea aspera; tensor fascia latae was inserted laterally
to lateral ridge of the linea aspera (Harandi et al., 2020).
The prosthesis segments were reverse-engineered in SolidWorks (SolidWorks, Dassault
Systems Massachusetts, USA) in accordance with the measurements described in subsection
3.2.1. The moment of inertia and COM positions of each lower-limb prosthesis were calculated
from the CAD model assuming homogenous material properties and virtually placed in the
individualized scaled model. The knee and ankle of the prosthetic leg were modeled as hinge
joint (Harandi et al., 2020). Figure 3.2 shows a healthy model, amputee model without
prosthesis and amputee model with a prosthesis attached.

49
Figure 3.2. Schematics of healthy and amputee models developed in OpenSim (Harandi et al.,
2020, Robinson et al., 2020).
3.3.4 Inverse kinematics
The scaled transfemoral amputee-specific model was then used to find the optimum
generalized coordinates of joint motion in a multibody chain using inverse kinematics tool.
This tool intends to minimize the sum of the squared differences between experimental data
and virtual markers on the model (Lu and O’connor, 1999).
50
3.3.5 Inverse dynamics
Inverse dynamics was then used for all amputee data sets to calculate the net forces and
moments of the joints of the multibody system (Remy and Thelen, 2009). This bottom-up
method determined the joints moments and forces to generate the given joints movement. The
GRFs applied to the distal segments of the body, the feet, were the additional information used
to solve for the net moments of the ankle. This iterative upward process was used to compute
all lower limb joints, from ankle to hip.
The scaled model may include kinematics and dynamics errors. Due to kinematic errors
of the scaled model, large residuals are resulted between the proximal segment (pelvis) and
ground to compensate for the errors. Also, incorporating GRFs in the inverse dynamics
problem generates an over-determined system (Kuo, 1998). In addition, errors in inverse
dynamics depend on prosthetic design (Dumas et al., 2009, Frossard et al., 2011). Therefore,
the measured GRFs and kinematics may not be dynamically consistent with the skeletal model.
Thus, to minimize these residual forces and moments, which will lead to experimental data and
skeleton model's error, a Residual Reduction Algorithm (RRA) was used in this study. This
algorithm allows the joints kinematics of the skeleton model to alter by varying the center of
mass of torso with the approach of more dynamic consistency with the GRFs (Steele et al.,
2012b, Dumas et al., 2016).
3.3.6 Static optimization
Since more muscles exist than joints in the lower extremity, the redundancy of the
musculoskeletal system will happen. Thus, an infinite number of musculotendon force

51
amalgamations being potentially able to generate the net joint moment is needed to reproduce
the joint kinematics.
Muscle forces were computed using static optimization by decomposing the net joint
moments calculated from inverse dynamics into discrete muscle actuator loads at each time
instant. Static optimization used a cost function with the approach of minimizing the sum of
the squared of all individual muscle activations, which is equivalent to minimizing the
simultaneous mechanical stress across all muscles (Crowninshield and Brand, 1981). The
predicted muscle forces by optimization were further constrained in accordance with the force-
length-velocity properties of each muscle’s physiological bounds.
The combination of the lower limb muscles of the musculoskeletal model, even they are
fully activated, could not provide the required joint moments. For instance, when the desired
knee extensor moment cannot be satisfied with the fully activated knee extensor muscles, a
knee extensor strength deficiency will happen because the knee reserve actuator will generate
the difference. Hence, ideal reserve torque actuators must be applied to the model. The role of
these reserve actuators is to permit optimization to numerically converge; however, their
contribution to the joint moments of the model during static optimization should be ideally
zero. The static optimization problem is stated as follows:
calculate: 𝑎 = [𝑎𝑀
𝑎𝑅
𝑎𝑟
]
by minimizing: 𝐽(𝑎) = ∑ 𝜔𝑖(𝑎𝑖𝑀)2 +𝑛𝑚
𝑖=1 ∑ 𝜔𝑗(𝑎𝑗𝑅)
2+ ∑ 𝜔𝑘(𝑎𝑘
𝑟)2𝑛𝑞𝑘=1
6𝑗=1
muscle residual reserve

52
subject to:
∑ [𝑎𝑖𝑀. 𝑓𝑖(𝐹0
𝑀, 𝑙𝑀, 𝑣𝑀)]. 𝑠𝑖,𝑛 + ∑ [𝑎𝑗𝑅 . 𝐹𝑗
𝑅] + ∑ [𝑎𝑘𝑟 . 𝐹𝑘
𝑟] = 𝜏𝑛𝑛𝑞𝑘=1
6𝑗=1
𝑛𝑚𝑖=1 3.1
0 < aM < 1
where the variables of the equation are defined as follows: muscles 𝑎𝑀, residuals 𝑎𝑅 and
reserve actuator activation 𝑎𝑟. nm and nq: the number of muscles and kinematic degree of
freedom in the model; the following weights were given to muscles, residual and reserve
actuators to penalize the muscles’ capacity to generate force respectively, 𝜔𝑖, 𝜔𝑗 and 𝜔𝑘; the
force-length-velocity surface of muscle i is shown by 𝑓𝑖(𝐹0𝑀, 𝑙𝑀, 𝑣𝑀); the peak strength of the
residual actuator j is 𝐹𝑗𝑅, the peak strength of the reserve actuator j is 𝐹𝑗
𝑟; the moment arm of
muscle i about coordinate n is 𝑠𝑖,𝑛; the net joint moment of generalized coordinate n, as derived
from RRA or inverse dynamics is 𝜏𝑛.
Static optimization method cannot consider the time-dependent activation dynamics of
muscle because this technique solves muscle forces at each time instant. The contribution of
muscles is calculated in static optimization incorporating GRF and joint movements. Most of
the time, the ideal reserve torques must be applied due to the lack of actuator force in the model.
The reserve torques will equilibrate between actuator forces and joint moments. Static
optimization problem aims to converge optimization problem by minimizing the effect of
residuals and reserve torques; ideally should be zero.
muscle residual reserve

53
3.3.7 Validation of the musculoskeletal model
Non-invasive measuring methods of muscle forces during walking maneuver are
impossible. Therefore, the accurate evaluation of muscle forces prediction techniques has
remained limited. One of the common methods to temporally validate muscle forces of the
computer-based musculoskeletal models is to use EMG signals (Erdemir et al., 2007, Pantall
and Ewins, 2013). EMG measures the electrical activity across a muscle, which leads to its
activation and force generation. However, this is not very empirical method since during
amputee’s walking one may not be able to measure the EMG signals of the deep muscles.
Although well correlated with the timing of muscle force prediction by the model and the
timing of EMG signals (Anderson and Pandy, 2001b, Liu et al., 2008, Hamner et al., 2010),
the validation process of the EMG magnitudes is difficult due to the non-linear relationship
between the magnitudes of muscle force and EMG (Lloyd and Besier, 2003, Buchanan et al.,
2004, Buchanan et al., 2005). For instance, if a muscle, which can be fully activated, does not
operate inside its force-length-velocity properties, the generated force will be very minimal.
In this dissertation, EMGs of gluteal muscles in the intact and residual limb, and EMGs
of soleus, gastrocnemius and vasti of the intact limb were recorded. The residual limb muscles
have been shown to produce a non-stationary random signal, which is due to intensity and
duration fluctuation of the muscle contraction (Bonato et al., 2001, Pantall and Ewins, 2013).
Thus, only EMG of gluteal muscles was successfully employed from the residual limb. The
timing of muscle force computed by the model was further evaluated using EMG signals. EMG
offset signals were removed and the waveforms rectified and low-pass filtered at 10 Hz using
a 2nd order Butterworth filter to create linear envelopes (Lin et al., 2015).

54
3.3.8 Induced acceleration analysis
The purpose of induced acceleration analyses is quantifying the constitution of each force
to the total GRFs and the net joint acceleration. In this analytical technique, the superposition
principles should be satisfied. This means that differences between the sum of all action forces
to the GRFs or joint acceleration and the total GRFs measured experimentally must be zero
(Anderson and Pandy, 2003). In this section, the term action force represents the forces of the
musculoskeletal model and the term actuator represents all model actuators, which are residual
loads, reserve torques, arm torques, and musculotendon forces.
To implement induced acceleration analysis, mechanical constraints are required to act
between the foot and ground. The GRFs’ generation in the computational musculoskeletal
model will be facilitated using the mechanical constraints known as a ground contact model,
which was adapted from Lin’s study (Lin et al., 2012) and the OpenSim plug-in.
A five-point model was assumed as a contact between the foot and the ground (Anderson
and Pandy, 2003, Liu et al., 2006). These five points attached to the OpenSim musculoskeletal
model consisted of two heel markers (H) located on medial and lateral sides of the mid
calcaneus, two metatarsal markers (M) located at the first and fifth metatarsal junctions, a toe
marker (T) located at the anterior boundary of the foot, the line between the heel markers
representing an approximate heel hinge axis, and the line between the metatarsal markers
forming an approximate metatarsal axis (Figure 3.3).

55
Figure 3.3. A five-point model of contact between the foot and the ground. T, M and H
are representatives of toe marker, metatarsal marker and heel marker, respectively. The labels
of markers are described in Table 3.6.
The location of these five points were defined by a set of five markers attached to the
coordinate frame of foot (Table 3.6)
Table 3.6. The location of five foot-ground contact points over the sole of feet. The body
coordinates (x, y, z) are in (anterior, vertical, lateral) directions, respectively.
T calcn_r
M1 calcn_r
M2 calcn_r
H1 calcn_r
H2 calcn_r
T calcn_l
M1 calcn_l
M2 calcn_l
H1 calcn_l
H2 calcn_l
Lef
t
(0.275, 0.00, -0.02)
(0.135, 0.00, -0.07)
(0.205, 0.00, 0.05)
(0.00, 0.00, -0.03)
(0.01, 0.00, 0.05)
(0.01, 0.00, -0.05)
Marker Location (m)
in Body coordinates
Rig
ht
Leg Marker Name Marker Body
(0.275, 0.00, 0.02)
(0.135, 0.00, 0.07)
(0.205, 0.00, -0.05)
(0.00, 0.00, 0.03)

56
The dynamic equation of motion for the n degree-of-freedom skeleton model with k
musculotendon unit is stated as follows:
𝑀(𝑞)�̈� = 𝐶(𝑞, �̇�) + 𝐺(𝑞) + [06×1
𝑆(𝑞)𝐹𝑀] + [𝑅6×1
𝑟𝑛𝜏×1] + 𝐸(𝑞)𝐹𝑒𝑥𝑡 3.2
where 𝑞, �̇�, and �̈� are the 𝑛 × 1 generalized positions, velocities, and accelerations vectors,
respectively, which include both translational (e.g. pelvis location relative to the ground) and
rotational (e.g. joint angles) degrees of freedom; 𝐌(𝑞) is the 𝑛 × 𝑛 model mass matrix or
inertia matrix to describe the mass and inertial properties of the body segments; 𝐶(𝑞, �̇�) is the
𝑛 × 1 vector to specify generalized force vector due to Coriolis or centripetal forces; 𝐆(q) is
an 𝑛 × 1 generalized gravity force vector; 𝐒(𝑞) is an 𝑛 × 𝑘 muscular moment arms matrix; 𝐅𝑀
is a 𝑘 × 1 muscle forces vector; 𝐅𝑒𝑥𝑡 is a 3𝑓 × 1 external reaction forces vector applying
between the foot and ground by the 𝑓 contact points; 𝐄(𝑞) is an 𝑛 × 3𝑓 matrix of linear
generalized Jacobian which defines the relationship between the generalized velocity vector �̇�
and the linear velocity vector of the foot-ground contact points �̇�. This Jacobian matrix is
defined as follows:
𝐸(𝑞) =𝜕�̇�
𝜕�̇�(𝑞) =
𝜕�̈�
𝜕�̈�(𝑞)
=
[ 𝜕�̇�1𝑋
𝜕�̇�1
𝜕�̇�1𝑌
𝜕�̇�1
𝜕�̇�1𝑍
𝜕�̇�1⋯
𝜕�̇�1𝑋
𝜕�̇�2
⋮
𝜕�̇�1𝑌
𝜕�̇�2
⋮
𝜕�̇�1𝑍
𝜕�̇�2
⋮
⋯⋱
𝜕�̇�1𝑋
𝜕�̇�𝑛
𝜕�̇�1𝑌
𝜕�̇�𝑛
𝜕�̇�1𝑍
𝜕�̇�𝑛⋯
|
|
𝜕�̇�𝑓𝑋
𝜕�̇�1
𝜕�̇�𝑓𝑌
𝜕�̇�1
𝜕�̇�𝑓𝑍
𝜕�̇�1
𝜕�̇�𝑓𝑋
𝜕�̇�2
⋮
𝜕�̇�𝑓𝑌
𝜕�̇�2
⋮
𝜕�̇�𝑓𝑍
𝜕�̇�2
⋮𝜕�̇�𝑓𝑋
𝜕�̇�𝑛
𝜕�̇�𝑓𝑌
𝜕�̇�𝑛
𝜕�̇�𝑓𝑍
𝜕�̇�𝑛 ]
3.3
where X, �̇�, and �̈� represent the linear positions, velocities, and accelerations of all f foot-
ground contact points. All internal generalized force contributions such as muscle forces,

57
reserve forces/torques, residual forces/torques, gravity forces, and Coriolis/centripetal forces
are grouped as 𝐅𝑖𝑛𝑡. So, equation 3.2 is rewritten as:
𝑀. �̈� = 𝐹𝑖𝑛𝑡 + 𝐸. 𝐹𝑒𝑥𝑡 3.4
The linear velocity of the ith foot point can also be calculated using a Jacobian matrix:
�̇�𝑖 = 𝐸𝑖𝑇�̇� 𝑖 = 1,2, … , 𝑓 3.5
The linear acceleration of the ith foot point will be the time derivative of equation 3.5 as:
�̈�𝑖 = 𝐸𝑖𝑇�̈� + �̇�𝑖
𝑇�̇� 𝑖 = 1,2, … , 𝑓 3.6
When foot point i is in contact with the ground, the linear acceleration of point i is equal
to zero in all directions due to the rigid contact principles assumption. Considering 𝐾𝑖 = �̇�𝑖𝑇�̇�,
so:
𝐸𝑖𝑇�̈� + 𝐾𝑖 = 0 𝑖 = 1,2, … , 𝑓 3.7
Prompt and quick touching on and off between each foot point and ground would result
in discontinuities in the constraint set of equations and then induced acceleration results.
Therefore, a diagonal weighting matrix W is defined to smooth transitions between constrain
the contact points and contact phases to remain consistent with the actual foot motion during
stance phase:
𝑊𝑓×𝑓{𝐾 + 𝐸𝑇�̈�}3𝑓×1 = 03𝑓×1 3.8
where W elements were themselves a 3×3 diagonal matrix that weighted the X, Y and Z
components of the linear acceleration constraint equally:

58
𝑊(𝑖, 𝑖) = [𝑤
𝑤𝑤
] 𝑖 = 1,2, … , 𝑓 3.9
where 𝑤 is a weighting factor which is between zero and one. This factor indicates the
magnitude of the foot point constraint. Thus, 𝐖(i) = 0 implies no contact force for the point i
and 𝐖(i) = 1 imply when the ith point is fully constrained. 0 < 𝐖(i) < 1 implies a partially
constrained contact point i.
These weightings were determined by examining the experimental data of the trial's
kinetics. The weightings estimation was based on the study done by Dorn et al. (Dorn et al.,
2012a). In this regard, all foot contact points would set to zero if the Euclidean norm of the
ground reaction force was below a user defined threshold. It means that the foot was accounted
to be off. For other conditions, at least one point of the foot was in contact with the ground, so
the weightings for the foot point constraint must be specified. As shown in Figure 3.4, four
locomotion phased were defined. The experimental center of pressure (CoP) position was used
to determine the foot contact point weightings.

59
Figure 3.4. Foot-ground contact constraints during stance phase at heel-strike started
from right (phase 1), foot-flat (phase 2,3) and toe-off (phase 4).
Phase 1 was defined at heel-strike when the CoP lies posteriorly relative to the heel axis,
both heel markers were fully constrained while the other three were free. The foot-ground
interaction at this phase was approximated as a hinge constraint in which a rotation of the foot
about the heel axis can occur.
Phase 2 was defined between heel-strike and foot flat when the CoP lies posteriorly
relative to half of the hind-foot boundary of the quadrilateral consisted of H and M markers. A
weighting function ϕ was introduced to implement transition between phase 1 and phase 2 as:
∅(𝑑ℎ, 𝑑𝑚) =𝑑ℎ
𝑑ℎ + 𝑑𝑚 3.10

60
where 𝑑ℎ and 𝑑𝑚 are the shortest distance from the CoP to both heel and metatarsal axes,
respectively. In this phase, the heel markers remained fully constrained, while the metatarsal
points weightings were equal to 2ϕ as they remained partially constrained. Thus, as the CoP
moved towards the metatarsal axis, the metatarsal points weightings increased from 0 to 1. At
this stage, the interaction between the foot and ground was transformed from a hinge constraint
about the heel axis to a weld constraint.
Phase 3 was defined when the CoP crosses the anterior half of the hind-foot boundary of
the quadrilateral (ϕ = 0.5). At this stage, metatarsal points remained fully constrained, while
the weightings of the heel markers decreased to zero according to 2(1 – ϕ). Therefore, the foot-
ground constraint was transformed from a weld constraint to a hinge constraint about the
metatarsal axis. At the time when the heel and metatarsal points were fully constrained, the
CoP lies exactly half way between the heel and metatarsal axes. Hence, a weld constraint was
considered during the foot-flat pose. Phase 4 was defined when the CoP lies inside the boundary of the triangle consisting of
the metatarsal and toe points. A weighting function 𝛾 was introduced to implement a transition
from phase 3 to phase 4 as:
𝛾(𝑑𝑚, 𝑑𝑡) =𝑑𝑚
𝑑𝑡 3.11
where 𝑑𝑡 is the shortest distance from toe point to the metatarsal axis. When reaching this stage:
heel points are free; metatarsal points weightings begin to decrease according to 1- 𝛾; the toe
point weighting begins to increase according to 𝛾. Thus, the foot-ground interaction’s
constraint was transformed from a hinge constraint about the metatarsal axis to a ball constraint
about toe point. Table 3.7 is the summary of the kinematic constraint weightings.

61
Table 3.7: Constraint weightings 𝑤 for the five foot-ground interaction points. 𝑑ℎ and 𝑑𝑚 are
the shortest distance from the CoP to both heel and metatarsal axes, respectively. 𝑑𝑡 is the
shortest distance from toe point to the metatarsal axis.
The contribution of each action force α (e.g. individual muscles, gravity and Coriolis
forces) to the net GRFs and acceleration at each joint was calculated when the action force is
applied in isolation to the model. Regarding equations 3.4 and 3.8, the equation 3.12 was
generated as follows:
{𝑀. �̈�𝛼 = 𝐹𝑖𝑛𝑡
𝛼 + 𝐸. 𝐹𝑒𝑥𝑡𝛼
𝑊{𝐾𝛼 + 𝐸𝑇�̈�𝛼} = 0 3.12
At a specific time, M, E and W are constant for all “action forces”; so, these values were
computed outside the “action force” loop. The vectors of 𝐅𝑖𝑛𝑡𝛼 , which is the generalized force
resulting from the isolated application of the action force, and 𝐊𝛼, which forms part of the
zero-acceleration foot point constraint, must be uniquely calculated for each “action force” α.
Foot-ground
interaction points Phase 1 Phase 2 Phase 3 Phase 4
H1 1 1 2(1 −𝑑ℎ
𝑑ℎ + 𝑑𝑚) 0
H2 1 1 2(1 −𝑑ℎ
𝑑ℎ + 𝑑𝑚) 0
M1 0 2(𝑑ℎ
𝑑ℎ + 𝑑𝑚) 1 1 −
𝑑𝑚
𝑑𝑡
M2 0 2(𝑑ℎ
𝑑ℎ + 𝑑𝑚) 1 1 −
𝑑𝑚
𝑑𝑡
T 0 0 0 𝑑𝑚
𝑑𝑡
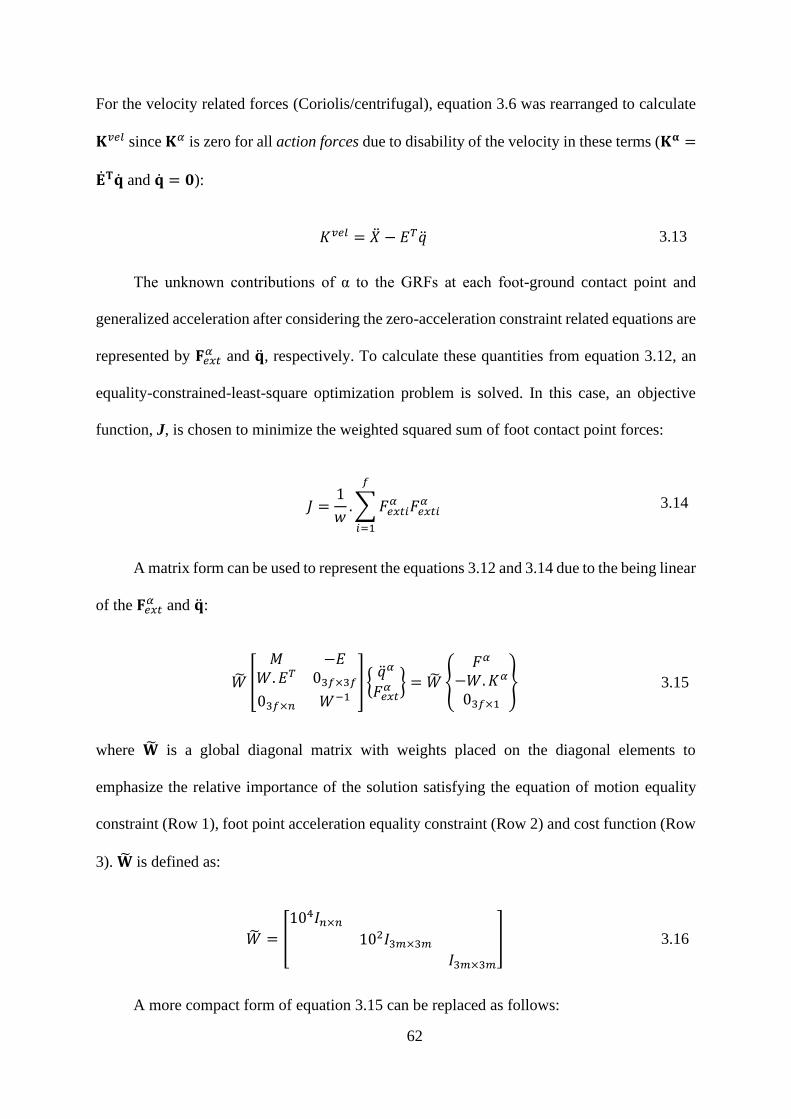
62
For the velocity related forces (Coriolis/centrifugal), equation 3.6 was rearranged to calculate
𝐊𝑣𝑒𝑙 since 𝐊𝛼 is zero for all action forces due to disability of the velocity in these terms (𝐊𝛂 =
�̇�𝐓�̇� and �̇� = 𝟎):
𝐾𝑣𝑒𝑙 = �̈� − 𝐸𝑇�̈� 3.13
The unknown contributions of α to the GRFs at each foot-ground contact point and
generalized acceleration after considering the zero-acceleration constraint related equations are
represented by 𝐅𝑒𝑥𝑡𝛼 and �̈�, respectively. To calculate these quantities from equation 3.12, an
equality-constrained-least-square optimization problem is solved. In this case, an objective
function, J, is chosen to minimize the weighted squared sum of foot contact point forces:
𝐽 =1
𝑤.∑ 𝐹𝑒𝑥𝑡𝑖
𝛼 𝐹𝑒𝑥𝑡𝑖𝛼
𝑓
𝑖=1
3.14
A matrix form can be used to represent the equations 3.12 and 3.14 due to the being linear
of the 𝐅𝑒𝑥𝑡𝛼 and �̈�:
�̃� [
𝑀 −𝐸𝑊.𝐸𝑇 03𝑓×3𝑓
03𝑓×𝑛 𝑊−1] {
�̈�𝛼
𝐹𝑒𝑥𝑡𝛼 } = �̃� {
𝐹𝛼
−𝑊.𝐾𝛼
03𝑓×1
} 3.15
where �̃� is a global diagonal matrix with weights placed on the diagonal elements to
emphasize the relative importance of the solution satisfying the equation of motion equality
constraint (Row 1), foot point acceleration equality constraint (Row 2) and cost function (Row
3). �̃� is defined as:
�̃� = [
104𝐼𝑛×𝑛
102𝐼3𝑚×3𝑚
𝐼3𝑚×3𝑚
] 3.16
A more compact form of equation 3.15 can be replaced as follows:

63
𝐴 {�̈�𝛼
𝐹𝑒𝑥𝑡𝛼 } = 𝑏 3.17
where A is an (𝑛 + 6𝑓) × (𝑛 + 3𝑓) matrix and b is an (𝑛 + 6𝑓) × 1 vector. The A matrix is
constant for all action forces and the b vector is unique for each individual action force at a
given time instant. Therefore, the superposition principles will be satisfied:
𝐴𝑋1 = 𝑏1
⋮𝐴𝑋𝑚 = 𝑏𝑚
𝐴(𝑋1 + ⋯+ 𝑋𝑚) = 𝑏1 + ⋯+ 𝑏𝑚
3.18
An optimal analytical solution to the over-determined problem of equation 3.17 is
provided using a least-square pseudo-inverse operator with no numerical iterations:
{�̈�𝛼
𝐹𝑒𝑥𝑡𝛼 } = 𝐴+𝑏 3.19
where 𝐀+ is the Moore-Penrose pseudo-inverse of the matrix A. The least square error of the
solution, which represents how well the solution matched the constraints, is computed as:
{
𝑒𝑟𝑟_𝑒𝑜𝑚𝑛×1
𝑒𝑟𝑟_𝑓𝑜𝑜𝑡𝑐𝑜𝑛𝑠𝑡𝑟𝑎𝑖𝑛𝑡3𝑓×1
𝑒𝑟𝑟_𝑐𝑜𝑠𝑡𝑓𝑢𝑛𝑐𝑡𝑖𝑜𝑛3𝑓×1
} = 𝐴+ {�̈�𝛼
𝐹𝑒𝑥𝑡𝛼 } − 𝑏 3.20
Equation 3.19 was repeatedly solved for each action force α at each time instant. Finally,
the individual contributions of α on each foot point, each foot and each direction were summed
to determine the contribution of α to the net GRFs. The sum of all action forces contributions
may not be equal to the experimental GRFs, which leads to lack of satisfaction of the
superposition principle. Anderson and Pandy mentioned that such superposition errors appear
due to the rigid foot-ground contact assumption which is not quite accurate (Anderson and
Pandy, 2003). Hence, to consider these inaccuracies, an inertial force (i.e. a fictitious force)
was defined. This inertia force is required to satisfy the superposition principle by equating the

64
model results and experimental data. To compute the inertial force’s contribution to the joint
acceleration and GRFs, equation 3.15 was modified as stated:
[𝑀 −𝐸
𝐼𝑛×𝑛 03𝑓×3𝑓] {
�̈�𝐼
𝐹𝑒𝑥𝑡𝐼 } = {
0𝑛×1
(�̈�𝐸𝑥𝑝 − �̈�𝑀𝑜𝑑𝑒𝑙)} 3.21
where �̈�𝐸𝑥𝑝 is the experimental generalized joint acceleration vector and �̈�𝑀𝑜𝑑𝑒𝑙 is the sum of
all induced accelerations of all action forces:
�̈�𝑀𝑜𝑑𝑒𝑙 = ∑ �̈�𝛼𝑛𝑢𝑚𝐴𝑐𝑡𝑖𝑜𝑛𝐹𝑜𝑟𝑐𝑒𝑠𝛼=1 3.22
Regarding equation 3.21, the cost function related row (the third row in equation 3.15)
does not exist. Therefore, it reduces to a discriminative problem and �̈�𝐈 and 𝐅ext 𝐈 were uniquely
solved:
�̈�𝐼 = �̈�𝐸𝑥𝑝 − �̈�𝑀𝑜𝑑𝑒𝑙 3.23
𝐹𝑒𝑥𝑡𝐼 = 𝐸+(𝑀. �̈�𝐼) 3.24
3.3.8 Joint reaction loads and muscle contribution
Resultant forces and moments at joints were calculated in OpenSim based on the
predicted muscle forces. Joint reaction analysis aims to calculate all loads acting on the model
between consecutive bodies. Joint structure carries the internal loads, which are representative
of the un-modeled joint structure generating the desired joint movement. The resultant loads at
the joint are applied at the mobilizer frame/joint center of the two successive bodies.
To calculate joint reaction forces, a recursive bottom-up procedure beginning from distal
bodies and progressing to the proximal bodies was used at each time instant during walking
(Steele et al., 2012a). The recursive algorithm was based on resolving the applied point at the
joint to stabilize the forces and motions using a free body diagram principle for every single

65
rigid body. The desired joint resultant forces were calculated using the known generalized
coordinates, GRFs and muscle forces as stated below:
�⃗� 𝑜 = [𝜏 𝑜
𝐹 𝑜] = 𝑀𝑖(𝑞 )𝑎 𝑖 + 𝐹 𝑐𝑜𝑛𝑠𝑡𝑟𝑎𝑖𝑛𝑡 − (∑𝐹 𝑒𝑥𝑡𝑒𝑟𝑛𝑎𝑙 +∑𝐹 𝑚𝑢𝑠𝑐𝑙𝑒𝑠 + �⃗� 𝑖+1) 3.25
where �⃗⃗� o represents the joint forces and moments at the origin of body; 𝐌𝑖(𝑞 ) represents
the six-by-six mass matrix for body segment i; �⃗� 𝑖 is the six-dimensional vector of known linear
and angular acceleration of the body distal to joint i. 𝐅 𝑐𝑜𝑛𝑠𝑡𝑟𝑎𝑖𝑛𝑡 expresses constraint forces
applied to the body; 𝐅 𝑒𝑥𝑡𝑒𝑟𝑛𝑎𝑙 and 𝐅 𝑚𝑢𝑠𝑐𝑙𝑒𝑠 are the previously calculated forces and moments
applied by external loads and musculotendon actuators, respectively; �⃗⃗� 𝑖+1 is the joint reaction
force applied at the distal joint; �⃗� 𝑜 and 𝐅 𝑜 are the moment and force to balance the equation.
Finally, the joint reaction forces and moments at the joint center were calculated by a shifting
vector from body origin to center joint:
�⃗� 𝑖 = [𝜏 𝑖
𝐹 𝑖] ∶= [
𝜏 𝑜
𝐹 𝑜] − [𝑟 × 𝐹 𝑜
𝑜 ] 3.26
where 𝐫 represents the vector from the body origin to the joint center.
The induced acceleration analysis approaches described in section 3.3.8 can also provide
the calculation of the individual muscle contributions to joint contact forces. At each time step,
muscle contributions to joint contact forces were obtained by i) using the results of muscle
contribution to GRFs or acceleration; ii) remaining only the muscle interest and the
corresponding muscle force and ground reaction forces in the model; and iii) solving joint
contact force calculation described above. This procedure was repeated for each muscle
throughout gait cycle (Sasaki and Neptune, 2010).

66

67
This chapter is based on the following published work:
• Vahidreza Jafari Harandi, David Charles Ackland, Raneem Haddara, L. Eduardo
Cofré Lizama, Mark Graf, Mary Pauline Galea, Peter Vee Sin Lee – Gait compensatory
mechanism in unilateral transfemoral amputees. Medical Engineering and Physics,
Published.
Gait biomechanics in
transfemoral amputees during:
individual muscle contribution to
COM acceleration

68
4.1 Introduction
Transfemoral amputees have been shown to walk with 30% reduced speed and between
30 and 60% higher energy consumption than those of able-bodied individuals (Vaughan et al.,
1992, Jaegers et al., 1995b, Boonstra et al., 1996, Genin et al., 2008). Increased hip joint range
of motion and larger ground reaction forces (GRFs) during single-leg stance of the intact limb
during walking have been observed relative to those of the residual limb (Sjödahl et al., 2002,
Sjödahl et al., 2003, Goujon-Pillet et al., 2008, Schaarschmidt et al., 2012, de Cerqueira et al.,
2013). The intact limb has also been shown to exhibit larger hip, knee and ankle joint moments
and powers compared to those in the residual limb (Seroussi et al., 1996, Segal et al., 2006,
Prinsen et al., 2011, Okita et al., 2018, Harandi et al., 2020, Robinson et al., 2020). These
asymmetric gait patterns in transfemoral amputees have the potential to lead to an increased
risk of lower back pain and hip osteoarthritis of the intact limb (Morgenroth et al., 2010, MPhty,
2012, Devan et al., 2014, Matsumoto et al., 2018).
In addition, about 30% of transfemoral amputees fitted with socket prosthesis experience
severe socket related problems such as chronic skin pain (Rommers et al., 1996, Hagberg and
Brånemark, 2001a, Meulenbelt et al., 2009, Butler et al., 2014), which leads to problems with
mobility and a low quality of life (Pezzin et al., 2000, Demet et al., 2003, Pezzin et al., 2004b).
Although new socket designs have improved walking, skin problems are still a major concern
(Van de Meent et al., 2013). As a result, osseointegrated prosthesis have been sought as a way
to combat these problems and have been recognized as the better alternative in some cases
(Haggstrom et al., 2013, Pantall and Ewins, 2013, Van de Meent et al., 2013, Brånemark et al.,
2014, Al Muderis et al., 2018, Frossard, 2019, Robinson et al., 2020). In contrast to SP users,
there have only been a few studies that have investigated gait biomechanics in bone-anchored
prostheses. Osseointegrated transfemoral amputees have shown greater hip range of motion,

69
better walking ability, quicker cadence, shorter gait duration and increase in walking speed
than SP users as well as slower cadence and larger gait period compared to non-amputees
(Hagberg et al., 2005, Frossard et al., 2010, Tranberg et al., 2011, Van de Meent et al., 2013,
Leijendekkers et al., 2017, Robinson et al., 2020). In addition, one study found that the function
of the hip residual limb muscles was similar to those in non-disabled individuals (Pantall and
Ewins, 2013).
Lower extremity muscles generate propulsion, support, and balance of the body during
walking. Several studies investigating individual muscle contribution to the anterior-posterior,
vertical and mediolateral acceleration of the body center of mass (COM) in able-bodied
individuals (Neptune et al., 2001, Neptune et al., 2004, Liu et al., 2006, Pandy et al., 2010). In
transfemoral amputees, a number of lower limb muscles required during ambulation may be
missing in the residual limb, affecting the overall motor control strategy. Most notably, vasti
(VAS), soleus (SOL) and gastrocnemius (GAS) are typically absent. In healthy individuals,
VAS contributes to braking, while GAS and SOL generate forward propulsion (Lim et al.,
2013, Lin et al., 2015). SOL and GAS contribute substantially to the vertical COM acceleration
in the second half of stance, while VAS and the gluteus muscles generate body support in the
first half of stance (Lim et al., 2013, Lin et al., 2015). Other muscles such as hamstrings (HAM)
and the inferior compartment of adductor magnus may be re-anchored to the end of the residual
limb, affecting their force-length properties. At present, the way in which muscles in the intact
and residual limbs, and the transfemoral prosthesis, generate forward propulsion, vertical
support, and mediolateral balance is not well understood.
The present study aimed to use three-dimensional personalized musculoskeletal
modeling to quantify lower limb joint kinematics and kinetics as well as muscle and prosthesis
contributions to body COM acceleration in the socket and osseointegrated fitted transfemoral
amputees during walking. Previous studies have shown significant differences in

70
spatiotemporal parameters, joint kinematics, and kinetics between the intact limb relative to
that of the residual limb (Dumas et al., 2016, Ranz et al., 2017, Okita et al., 2018, Frossard,
2019). We, therefore, hypothesized that the contributions of the hip muscles in the intact limb
to the fore-aft, vertical and mediolateral COM acceleration would be significantly different
from that of the residual limb. The results of this study will provide new information about the
gait compensatory mechanisms adopted by transfemoral amputees, which may assist in
prescribing rehabilitation post-amputation.
4.2 Materials and Methods
The detail of materials and methods used in this study has been comprehensively
discussed in Chapter 3. In this section, a brief explanation of the methods is presented.
However, the relevant section in the methods chapter is mentioned to avoid repetition.
4.2.1 Participants
Gait experiments were performed on six individuals with unilateral transfemoral
amputation wearing socket and four osseointegrated unilateral transfemoral amputees. All
subjects wore their own prosthesis and were able to walk without assistive devices (Table 3.1,
Table 3.2). The prostheses alignment and fitting were checked by an experienced prosthetist
prior to data collection. Ethical approval was obtained by the Melbourne Health Human
Research Ethics Committee with the number HREC 2015.148, and each participant provided
written informed consent.

71
4.2.2 Testing protocol
Each subject performed three successful trials of over-ground walking at their preferred
speed (1.16m/s±0.23 for SP users and 1.29m/s±0.10 for OI users). Lower limb and body COM
kinematics were derived by tracking three-dimensional positions of reflective markers using
an eight-camera motion capture system (Vicon, Oxford Metrics) sampling at 120 Hz. Retro-
reflective markers were mounted bilaterally on body segments of the intact and residual limb
following a previously published marker set (Dorn, 2011). On the prosthesis, the markers were
mounted over anatomical landmarks based on the intact limb in the medial and lateral knee and
ankle, heel, and toe. During walking trials, GRFs were measured using three AMTI force
platforms embedded in the floor (Watertown, USA) at a sample rate of 1000 Hz. EMG data
were simultaneously recorded at 1000 Hz using pairs of surface electrodes placed on the intact
muscles including GMAX, GMED, SOL, GAS and VAS and residual limb muscles including
GMAX and GMED (Cometa, Milan, Italy) (Table 3.5). EMG electrode placement followed a
previously described procedure (Hermens et al., 2000), and EMG data were checked prior to
testing to ensure suitable electrode placement and output (Hermens et al., 1999).
4.2.3 Data processing
Marker trajectories and GRF were low-pass filtered with a cut-off frequency of 4 and 60
Hz, respectively using a 4th order Butterworth filter (Lin et al., 2015). EMG offset signals were
removed and the waveforms rectified and low-pass filtered at 10 Hz using a 2nd order
Butterworth filter to create linear envelopes (Lin et al., 2015). Three successful gait cycles of
each subject were selected and averaged for analyses.

72
4.2.4 Musculoskeletal modelling
Subject-specific three-dimensional musculoskeletal models of each subject were
developed in OpenSim 3.2 (Delp et al., 2007). Each model comprised 10 lower limb and trunk
segments actuated by 76 Hill-type muscle-tendon units. The head, arm, and torso were
combined as a single rigid body that articulated with the pelvis via a ball-and-socket back joint.
The hip joints were modeled as ball-and-socket joints, the knee and metatarsal joints as hinge
joints, and each ankle-subtalar complex as a universal joint. All segment lengths and muscle-
tendon parameters were scaled from a generic musculoskeletal model to the subject’s mass and
anthropometry. A static standing trial was used to calculate the scaling factors for each
segment, as defined by the relative distances between pairs of markers (Delp et al., 2007).
For the prosthetic leg, all musculoskeletal structures below the knee were removed from
the scaled model. A myodesis stabilization technique was employed in modeling muscle
architecture, including re-anchoring of the amputated muscles in the residual limb (Ranz et al.,
2017). The myodesis stabilization technique re-attaches muscles that were detached in the
amputation process directly to the distal end of the residual femur (Ranz et al., 2017).
Specifically, the adductor magnus, semimembranosus, semitendinosus, biceps femoris long
head, and gracilis were inserted posteriorly to the medial ridge of linea aspera; rectus femoris
and sartorius were inserted anteriorly to the distal part of an intertrochanteric line and medial
ridge of linea aspera; tensor fascia latae was inserted laterally to lateral ridge of the linea
aspera. In the model of the amputee, the tendon slack length of each reattached muscle in the
residual limb was modified to ensure that the muscle-tendon unit tension in the neutral position
was equivalent to that of the same muscle in the intact limb (Ranz et al., 2017, Harandi et al.,
2020). Optimal fiber length value for each re-anchored muscle-tendon unit was varied in equal
proportion to match the pre-operative muscle-tendon length of the intact in the neutral position

73
(Ranz et al., 2017, Harandi et al., 2020). The mass and dimensions (length, width, height) of
the prosthesis knee joint, socket, pylon and foot segments were measured using digital calipers,
tape measure and digital scales, and the prosthesis reverse-engineered in SolidWorks
(SolidWorks, Dassault Systems Massachusetts, USA). Homogenous, isotropic material
properties were assumed, and a residual limb density of 1.1 g/cm3 was assumed (Mungiole and
Martin, 1990, Ferris et al., 2017). The moment of inertia and COM positions of each lower-
limb prosthesis were calculated from the CAD model and integrated into the musculoskeletal
model (Harandi et al., 2020).
Joint angles were calculated using inverse kinematics, and joint moments computed from
inverse dynamics using the joint kinematics and measured GRFs (Lu and O’connor, 1999).
Residual Reduction Analysis was performed to vary the model’s torso COM position and
minimize dynamic inconsistency between the collected GRFs and the measured kinematics
(Thelen and Anderson, 2006, Delp et al., 2007). Muscle forces were computed using static
optimization by decomposing the net joint moments calculated from inverse dynamics into
discrete muscle actuator loads (Anderson and Pandy, 2001b). The optimization problem
minimized the sum of squares of all muscle activations and was constrained by each muscle’s
force-length and force-velocity relations. Contributions of muscle forces, gravity, inertia, and
other external forces to the fore-aft, vertical and mediolateral COM acceleration represent the
contribution to body propulsion, support and balance, respectively. Pseudo-inverse GRF
decomposition method employing a five foot-ground contact point model for the stance limb
was used to quantify the contributions to walking (Dorn et al., 2012a). The foot-ground contact
model of the residual limb was assumed the same as that of the intact limb. In this thesis, N/BW
and Nm/kg stand for “Newton per Body Weight” and “Newton-meter per kilogram”,
respectively.
74
4.2.5 Data analysis
Spatiotemporal parameters, kinematics, kinetics, muscle forces and muscle contributions
to whole-body COM acceleration were evaluated during the stance phase of walking at four
gait events which included ipsilateral heel-strike (IHS), contralateral toe-off (CTO),
contralateral heel-strike (CHS) and ipsilateral toe-off (ITO). A non-parametric Wilcoxon
signed-rank test was used to analyze non-normally distributed data. Comparisons of each
dependent variable (i.e. joint angles and moments, muscle forces and muscle contribution)
between the intact and residual limbs, were analyzed at each gait event and also during the
whole stance phase. The results of the Wilcoxon were quantified by h-values, in which h=1
rejects the null hypothesis of no difference between the two legs, while h=0 accepts the null
hypothesis. Significance level was set at p<0.05. All statistical analyses were performed using
IBM-SPSS 24 (IBM Corp., USA).
4.3 Results
In this section, the results of both SP and OI users are separately presented. Then, a
sensitivity analysis on alterations in inertial properties of prosthesis for one amputee is
presented.
4.3.1 SP users
Significantly different spatiotemporal parameters were observed between the intact leg
and the residual leg (p<0.05) (Table 4.1). Step length was significantly smaller in the intact
limb compared to that of the residual limb (mean difference: 0.08±0.02 m, p=0.03). The step
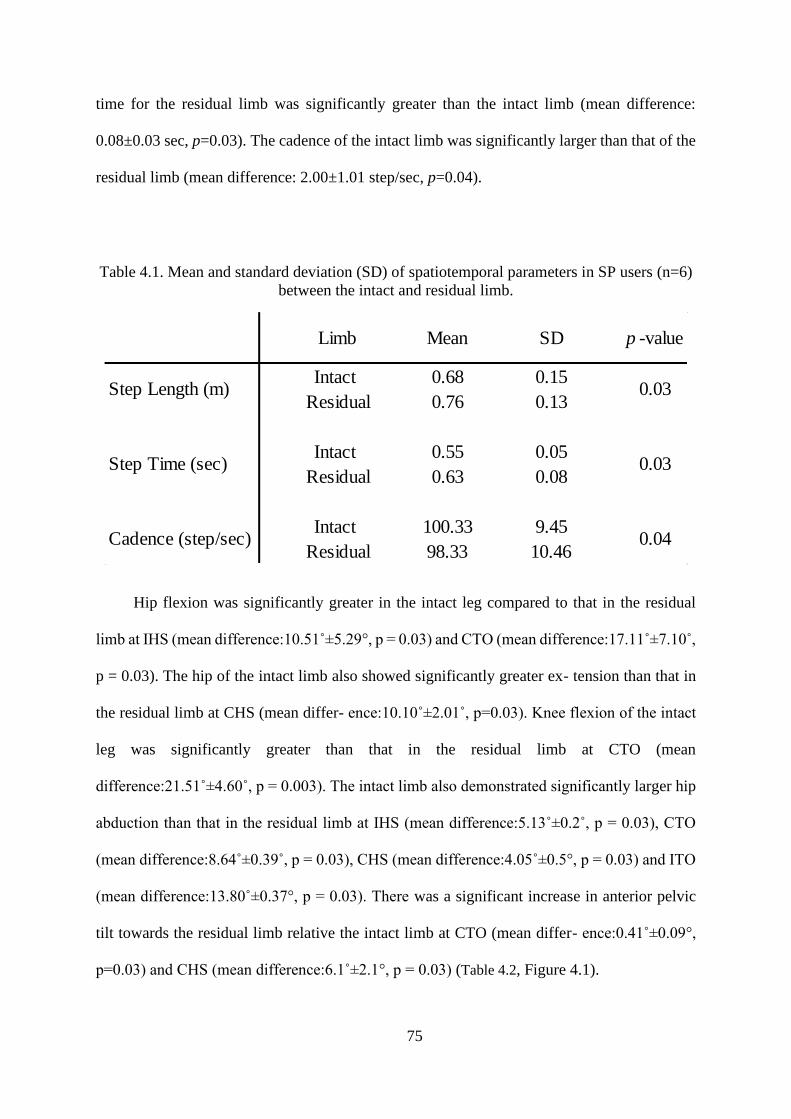
75
time for the residual limb was significantly greater than the intact limb (mean difference:
0.08±0.03 sec, p=0.03). The cadence of the intact limb was significantly larger than that of the
residual limb (mean difference: 2.00±1.01 step/sec, p=0.04).
Table 4.1. Mean and standard deviation (SD) of spatiotemporal parameters in SP users (n=6)
between the intact and residual limb.
Hip flexion was significantly greater in the intact leg compared to that in the residual
limb at IHS (mean difference:10.51˚±5.29°, p = 0.03) and CTO (mean difference:17.11˚±7.10˚,
p = 0.03). The hip of the intact limb also showed significantly greater ex- tension than that in
the residual limb at CHS (mean differ- ence:10.10˚±2.01˚, p=0.03). Knee flexion of the intact
leg was significantly greater than that in the residual limb at CTO (mean
difference:21.51˚±4.60˚, p = 0.003). The intact limb also demonstrated significantly larger hip
abduction than that in the residual limb at IHS (mean difference:5.13˚±0.2˚, p = 0.03), CTO
(mean difference:8.64˚±0.39˚, p = 0.03), CHS (mean difference:4.05˚±0.5°, p = 0.03) and ITO
(mean difference:13.80˚±0.37°, p = 0.03). There was a significant increase in anterior pelvic
tilt towards the residual limb relative the intact limb at CTO (mean differ- ence:0.41˚±0.09°,
p=0.03) and CHS (mean difference:6.1˚±2.1°, p = 0.03) (Table 4.2, Figure 4.1).
Intact 0.68 0.15
Residual 0.76 0.13
Intact 0.55 0.05
Residual 0.63 0.08
Intact 100.33 9.45
Residual 98.33 10.46
Limb Mean SD p -value
Step Length (m)
Step Time (sec)
Cadence (step/sec)
0.03
0.03
0.04

76
Table 4.2. The mean, standard deviation (SD), 95% confidence interval and p-value of the joint angles
of the intact and residual legs during stance phase of SP users (n=6). Hip flexion and adduction, pelvis
tilt and knee extension angles and ankle dorsiflexion are positive. IHS: ipsilateral heel strike; CTO:
contralateral toe-off; CHS: contralateral heel strike; ITO: ipsilateral toe-off.
Joint angles (°)Gait
eventLimb Mean SD
95% Confidence
Intervalp-Value
Intact 29.41 8.06 17.74 to 36.46
Residual 18.9 10.08 4.36 to 27.67
Intact 30.86 12.55 14.58 to 42.86
Residual 13.73 12.08 -0.87 to 30.47
Intact -20.38 3.82 -24.24 to -16.83
Residual -10.26 3.18 -13.90 to -5.86
Intact -5.78 8.82 -14.74 to 8.25
Residual -10.31 6.24 -16.27 to 0.68
Intact -8.2 0.45 -8.67 to -7.74
Residual -3.07 0.1 -3.18 to -2.97
Intact -7.3 0.72 -8.06 to -6.54
Residual 1.34 0.63 0.67 to 2.01
Intact 3.74 0.87 2.82 to 4.66
Residual -0.31 0.84 -1.19 to 0.57
Intact -11.04 0.9 -11.98 to -10.09
Residual -2.75 0.06 -2.81 to -2.68
Intact -7.28 3.89 -10.27 to -0.90
Residual -4.5 4.52 -9.10 to 3.11
Intact -28.26 10.01 -39.67 to -12.97
Residual -6.71 5.31 -11.96 to 2.23
Intact -15.39 4.39 -22.90 to -11.05
Residual -8.14 3.4 -11.70 to -2.55
Intact -44.16 5.86 -53.97 to -35.89
Residual -34.4 4.5 -41.36 to -27.86
Intact -1.47 3.15 -5.84 to 2.90
Residual -0.044 2.17 -3.21 to 2.26
Intact 0.29 2.8 -3.67 to 4.24
Residual 0.71 1.72 -1.20 to 3.60
Intact -1.57 2.71 -5.43 to 2.29
Residual 4.54 3.01 -0.87 to 7.87
Intact -0.94 3.21 -5.37 to 3.50
Residual 1.42 5.57 -6.18 to 7.81
Intact -2.7 12.16 -21.39 to 12.76
Residual -6.1 8.51 -18.40 to 5.65
Intact -10.93 13.9 -32.83 to 5.95
Residual -11.93 8 -24.50 to -2.18
Intact -1.96 16.13 -22.21 to 23.03
Residual 4.3 6.2 -3.56 to 13.83
Intact -29.44 15.5 -51.01 to -7.15
Residual -6.95 7.73 -18.65 to 3.13
Hip flexion/ extension
IHS 0.03 *
CTO 0.03 *
CHS 0.03 *
ITO 0.06
Hip abduction/ adduction
IHS 0.03 *
CTO 0.03 *
CHS 0.03 *
ITO 0.03 *
Knee flexion/ extension
IHS 0.31
CTO 0.03 *
CHS 0.06
ITO 0.09
Pelvis tilt
IHS 0.65
CTO 0.03 *
CHS 0.03 *
ITO 0.12
Ankle dorsiflexion
IHS 0.09
CTO 0.81
CHS 0.31
ITO 0.03 *

77
Figure 4.1. Joint angles in the intact and residual limb of transfemoral amputees (n=6). The gray shaded areas represent ±1 standard deviation from
the mean. The vertical dashed line represents contralateral toe-off (CTO); the vertical solid line represents contralateral heel strike (CHS). Statistical
analyses obtained between the two legs are demonstrated by h = 1 in the h-value plots.

78
There were significant differences in the joint moments at hip, knee, and ankle joints
between the residual and intact limbs (Table 4.3, Figure 4.2) (p<0.05). The hip flexion moment
of the residual limb was significantly smaller compared to that in the intact leg at IHS (mean
difference:0.41 ±0.05Nm/kg, p = 0.03) and CHS (mean difference:0.39 ±0.09Nm/kg, p = 0.03).
Further- more, significantly different hip muscle forces were found be- tween the two legs
(Table 4.4, Figure 4.3). For instance, GMED in the intact limb exhibited larger force than
GMED in the residual limb at IHS (mean difference:1.14 ±0.72 N/kg, p = 0.03), CTO (mean
difference:18.45 ±2.58 N/kg, p = 0.03) and CHS (mean difference:13.83 ±1.16 N/kg, p = 0.03).
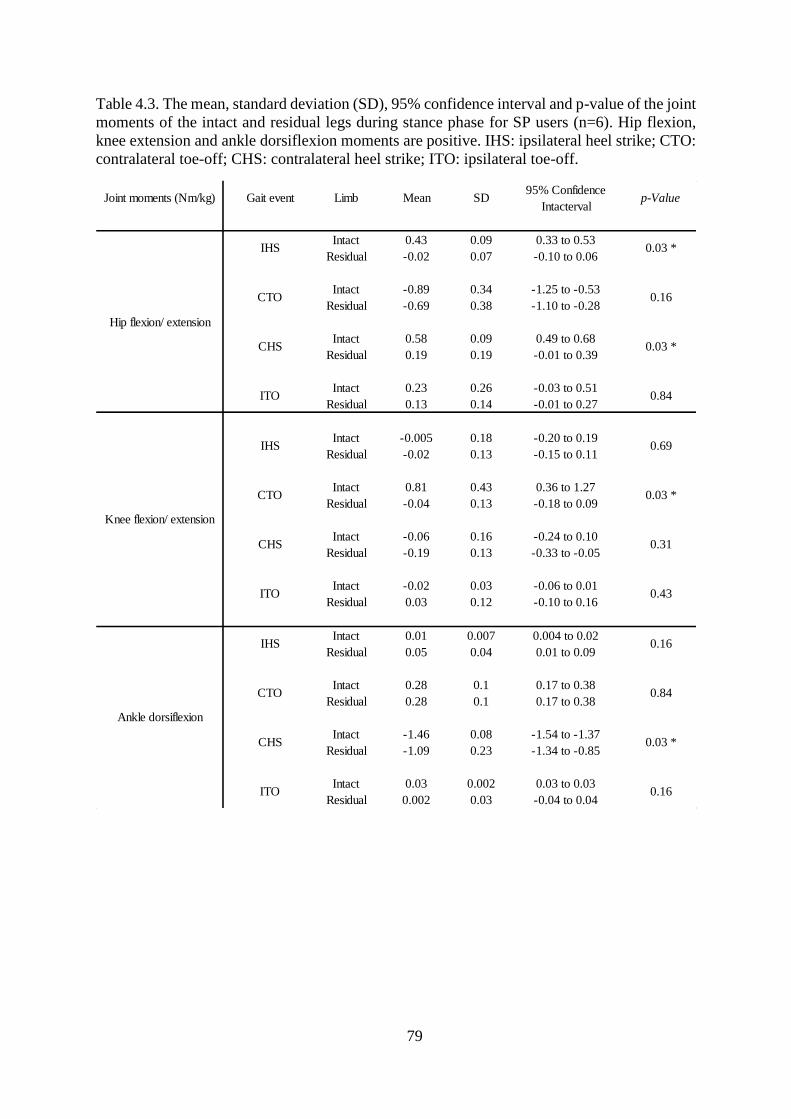
79
Table 4.3. The mean, standard deviation (SD), 95% confidence interval and p-value of the joint
moments of the intact and residual legs during stance phase for SP users (n=6). Hip flexion,
knee extension and ankle dorsiflexion moments are positive. IHS: ipsilateral heel strike; CTO:
contralateral toe-off; CHS: contralateral heel strike; ITO: ipsilateral toe-off.
Joint moments (Nm/kg) Gait event Limb Mean SD95% Confidence
Intactervalp-Value
Intact 0.43 0.09 0.33 to 0.53
Residual -0.02 0.07 -0.10 to 0.06
Intact -0.89 0.34 -1.25 to -0.53
Residual -0.69 0.38 -1.10 to -0.28
Intact 0.58 0.09 0.49 to 0.68
Residual 0.19 0.19 -0.01 to 0.39
Intact 0.23 0.26 -0.03 to 0.51
Residual 0.13 0.14 -0.01 to 0.27
Intact -0.005 0.18 -0.20 to 0.19
Residual -0.02 0.13 -0.15 to 0.11
Intact 0.81 0.43 0.36 to 1.27
Residual -0.04 0.13 -0.18 to 0.09
Intact -0.06 0.16 -0.24 to 0.10
Residual -0.19 0.13 -0.33 to -0.05
Intact -0.02 0.03 -0.06 to 0.01
Residual 0.03 0.12 -0.10 to 0.16
Intact 0.01 0.007 0.004 to 0.02
Residual 0.05 0.04 0.01 to 0.09
Intact 0.28 0.1 0.17 to 0.38
Residual 0.28 0.1 0.17 to 0.38
Intact -1.46 0.08 -1.54 to -1.37
Residual -1.09 0.23 -1.34 to -0.85
Intact 0.03 0.002 0.03 to 0.03
Residual 0.002 0.03 -0.04 to 0.04
Ankle dorsiflexion
IHS 0.16
CTO 0.84
CHS 0.03 *
ITO 0.16
Knee flexion/ extension
IHS 0.69
CTO 0.03 *
CHS 0.31
ITO 0.43
Hip flexion/ extension
IHS 0.03 *
CTO 0.16
CHS 0.03 *
ITO 0.84

80
Figure 4.2. Joint moments in the intact and residual limb of transfemoral amputees (n=6). The gray shaded areas represent ±1 standard deviation
from the mean. The vertical dashed line represents contralateral toe-off (CTO); the vertical solid line represents contralateral heel strike (CHS).
Statistical analyses obtained between the two legs are demonstrated by h = 1 in the h-value plots.

81
As described in section 3.3.7, we used EMG signals to evaluate the onset and offset of
the subject-specific model-predicted muscle forces. The timing of muscle contractions
predicted by the model was correlated well with the EMG signals (Figure 4.3, Figure 4.4).
The results showed that in general, the intact limb hip muscles generated more forces
during the whole stance than the residual limb (Table 4.4, Figure 4.3). GMAX force was
significantly greater in the intact limb than the residual limb at CTO (mean difference: 1.74
N/kg, p=0.03). GMED of the intact limb was significantly greater at IHS, CTO and CHS than
the residual limb (mean difference: 0.14, 18.45 and 13.83 N/kg, respectively, p=0.03). The
intact limb IL had also significantly greater forces in the intact limb than the residual limb at
IHS and CHS (mean difference: 2.83 and 9.33 N/kg, respectively, p=0.03). HAM demonstrated
greater forces at ITO of the intact limb than the residual limb (mean difference: 2.83 N/kg,
p=0.03) (Table 4.4, Figure 4.3). Figure 4.4 shows muscle forces of the intact limb for SOL,
GAS, and VAS with the period of EMG activity recorded for the specific muscles.

82
Table 4.4. Mean, standard deviation (SD), 95% confidence interval and p-value of the muscle
forces of the intact and residual legs during stance phase for SP users (n=6). IHS: ipsilateral
heel strike; CTO: contralateral toe-off; CHS: contralateral heel strike; ITO: ipsilateral toe-off.
Muscle forces
(N/kg)Gait event Limb Mean SD
95% Confidence
Intactervalp-Value
Intact 0.52 0.36 0.14 to 0.90
Residual 1.2 0.61 0.56 to 1.84
Intact 6.91 1.83 5.00 to 8.83
Residual 4.17 1.33 2.77 to 5.57
Intact 0.04 0.04 0.01 to 0.08
Residual 0.41 0.13 0.27 to 0.55
Intact 0.17 0.22 0.07 to 0.41
Residual 0.2 0.12 0.07 to 0.32
Intact 2.81 1.75 0.97 to 4.65
Residual 1.67 0.30 1.36 to 1.98
Intact 22.72 6.07 16.34 to 29.09
Residual 4.27 1.79 2.39 to 6.16
Intact 17.22 2.83 14.25 to 20.19
Residual 3.39 0.25 3.13 to 3.65
Intact 0.71 0.65 0.03 to 1.39
Residual 0.44 0.38 0.03 to 0.84
Intact 2.89 0.77 2.07 to 3.69
Residual 0.06 0.068 0.00 to 0.13
Intact 0.001 0.001 0.00 to 0.002
Residual 0.19 0.22 0.00 to 0.42
Intact 14.61 1.30 13.24 to 15.97
Residual 5.28 3.66 1.44 to 9.11
Intact 3.14 1.46 1.60 to 4.68
Residual 1.67 1.91 0.00 to 3.84
Intact 0.69 0.85 0.00 to 2.09
Residual 0.08 0.12 0.00 to 0.27
Intact 0.001 0.05 0.00 to 0.01
Residual 0.53 0.37 0.14 to 0.91
Intact 6.96 2.61 4.22 to 9.71
Residual 4.14 1.50 2.56 to 5.70
Intact 1.83 1.30 0.47 to 3.19
Residual 0.61 0.29 0.31 to 0.91
Intact 0.02 0.01 0.00 to 0.06
Residual 2.01 0.28 1.28 to 2.72
Intact 3.21 0.23 2.61 to 3.82
Residual 2.65 0.74 0.76 to 4.54
Intact 0.02 0.01 0.00 to 0.06
Residual 0.004 0.001 0.001 to 0.006
Intact 0.52 0.04 0.40 to 0.63
Residual 0.01 0.001 0.005 to 0.01ITO 0.03 *
IHS 0.03 *
CTO 0.6
CHS 0.9
HAM
RF
IHS 0.31
CTO 0.06
CHS 0.06
ITO 0.09
IL
IHS 0.03 *
CTO 0.03 *
CHS 0.03 *
ITO 0.09
GMED
IHS 0.03 *
CTO 0.03 *
CHS 0.03 *
ITO 0.17
GMAX
IHS 0.03 *
CTO 0.03 *
CHS 0.03 *
ITO 0.87

83
Figure 4.3. Forces of muscles in the intact and residual limb of transfemoral amputees (n=6). The gray shaded areas represent ±1 standard deviation
from the mean. The vertical dashed line represents contralateral toe-off (CTO); the vertical solid line represents contralateral heel strike (CHS).
The horizontal solid line indicates the period of EMG activity recorded for muscles. Statistical analyses obtained between the two legs are
demonstrated by h = 1 in the h-value plots.

84
Figure 4.4. Forces of muscles in the below-knee of the intact of SP users (n=6). The gray shaded areas represent ±1 standard deviation from the
mean. The horizontal black line indicates the activity time of the muscles. The vertical dashed line represents contralateral toe-off (CTO); The
vertical solid line represents contralateral heel strike (CHS). The horizontal solid line indicates the period of EMG activity recorded for muscles.

85
RF showed larger contribution to the fore-aft body COM acceleration in the intact limb
than that in the residual limb at CTO (mean difference: -0.02 m/s2, p=0.04) and CHS (mean
difference: -0.38 m/s2, p=0.03), while the contribution of the intact limb GMAX was larger at
IHS (mean difference: -0.07 m/s2, p=0.03) and during mid-stance when compared to the
residual limb. In addition, HAM generated higher contribution at IHS (mean difference: 0.07
m/s2, p=0.04), CHS (mean difference: 0.16 m/s2, p=0.04) and ITO (mean difference: 0.15 m/s2,
p=0.03) in the intact leg than the residual limb (Table 4.5, Figure 4.5). In early to mid-stance,
VAS in the intact limb contributed substantially to breaking, while SOL and GAS contributed
to both breaking and propulsion during the second half of stance. In the residual limb, the
prosthesis contributed primarily to braking and propulsion in the first and second half of stance,
respectively (Figure 4.5).
The prosthesis generated the greatest amount of support throughout stance compared to
any residual limb muscle, while the intact leg's SOL, GAS and VAS provided most of the
contribution to support than other intact limb’s muscles (Figure 4.5). In early to mid-stance
and pre-swing, GMED produced a greater contribution to the vertical COM acceleration in the
intact leg than the residual leg at CTO (mean difference: 0.70 m/s2, p=0.02) and ITO (mean
difference: 0.05 m/s2, p=0.02). GMAX showed higher contribution to the vertical acceleration
of the COM than that of the residual limb at IHS (mean difference: 0.25 m/s2, p=0.02) and CTO
(mean difference: 0.64 m/s2, p=0.04) (Table 4.5, Figure 4.5).
GMED was the largest contributor to mediolateral COM acceleration and it also
contributed to medial COM acceleration during the whole of stance. The peak contribution of
GMED to mediolateral COM acceleration was significantly higher in the intact leg than the
residual leg at IHS (mean difference: 0.10 m/s2, p=0.04), CTO (mean difference: 1.00 m/s2,
p=0.02), CHS (mean difference: 0.30 m/s2, p=0.02) and ITO (mean difference: 0.02 m/s2,
p=0.04). GMAX in the residual leg contributed to medial COM acceleration, whereas GMAX

86
in the intact limb generated lateral COM acceleration, with significant differences at IHS (mean
difference: 0.01 m/s2, p=0.03), CTO (mean difference: 0.15 m/s2, p=0.03), CHS (mean
difference: 0.02 m/s2, p=0.03) and ITO (mean difference: 0.02 m/s2, p=0.03). VAS, SOL and
GAS of the intact limb contributed to medial acceleration of the COM. Conversely, the
prosthesis contributed to lateral body COM acceleration during stance (Table 4.5, Figure 4.6).

87
Table 4.5. The p-value of the muscle contribution to the COM acceleration during stance phase
of SP users (n=6) between the intact and the residual limb at four gait events including IHS:
ipsilateral heel strike; CTO: contralateral toe-off; CHS: contralateral heel strike; ITO:
ipsilateral toe-off.
ALAM 0.69 0.03 * 0.03 * 0.09
GMAX 0.03 * 0.09 0.31 0.84
GMED 0.09 0.69 0.84 0.69
HAM 0.22 0.92 0.03 * 0.06
IL 0.03 * 0.09 0.03 * 0.09
RF 0.22 0.06 0.03 * 0.31
ALAM 0.91 0.03 * 0.03 * 0.84
GMAX 0.03 * 0.06 0.06 0.09
GMED 0.69 0.03 * 0.69 0.03 *
HAM 0.31 0.84 0.09 0.03 *
IL 0.03 * 0.92 0.03 * 0.09
RF 0.31 0.09 0.03 * 0.06
ALAM 0.06 0.03 * 0.03 * 0.03 *
GMAX 0.06 0.03 * 0.03 * 0.03 *
GMED 0.06 0.03 * 0.03 * 0.06
HAM 0.06 0.22 0.06 0.93
IL 0.03 * 0.03 * 0.03 * 0.03 *
RF 0.03 * 0.43 0.31 0.84
IHS CTO CHS ITO
Mu
scle
co
ntr
ibu
tio
n to
fo
re-a
ft
CO
M a
ccel
erat
ion
Mu
scle
co
ntr
ibu
tio
n to
ver
tica
l
CO
M a
ccel
erat
ion
Mu
scle
co
ntr
ibu
tio
n to
med
iola
tera
l
CO
M a
ccel
erat
ion
Muscle

88
Figure 4.5. Individual muscle and prosthesis contribution to anterior-posterior and vertical COM acceleration in transfemoral amputees (n=6). The
shaded area represents the summed contribution from all actuators. The vertical dashed line represents contralateral toe-off (CTO); the vertical
solid line represents contralateral heel strike (CHS). Statistical analyses obtained between the two legs are demonstrated by h = 1 in the h-value
plots.

89
Figure 4.6. Individual muscle and prosthesis contribution to mediolateral COM acceleration in transfemoral amputees (n=6). The shaded area
represents the summed contribution from all actuators. The vertical dashed line represents contralateral toe-off (CTO); the vertical solid line
represents contralateral heel strike (CHS). Statistical analyses obtained between the two legs are demonstrated by h = 1 in the h-value plots.
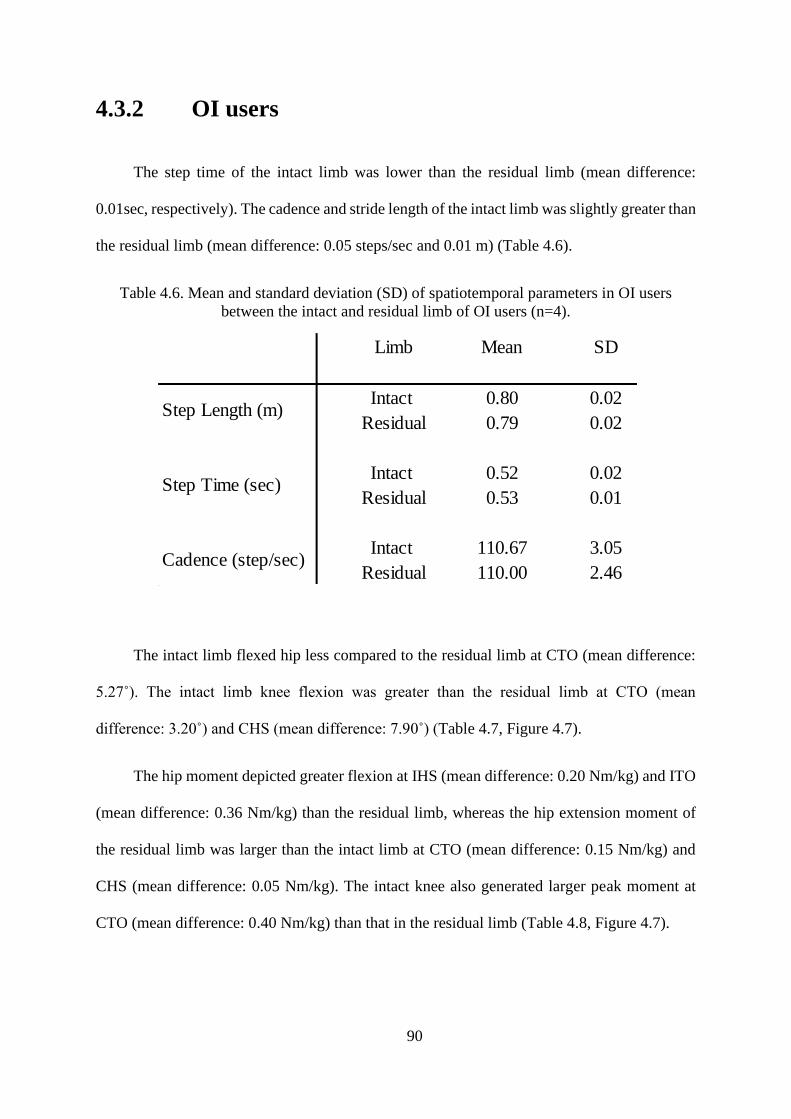
90
4.3.2 OI users
The step time of the intact limb was lower than the residual limb (mean difference:
0.01sec, respectively). The cadence and stride length of the intact limb was slightly greater than
the residual limb (mean difference: 0.05 steps/sec and 0.01 m) (Table 4.6).
Table 4.6. Mean and standard deviation (SD) of spatiotemporal parameters in OI users
between the intact and residual limb of OI users (n=4).
The intact limb flexed hip less compared to the residual limb at CTO (mean difference:
5.27˚). The intact limb knee flexion was greater than the residual limb at CTO (mean
difference: 3.20˚) and CHS (mean difference: 7.90˚) (Table 4.7, Figure 4.7).
The hip moment depicted greater flexion at IHS (mean difference: 0.20 Nm/kg) and ITO
(mean difference: 0.36 Nm/kg) than the residual limb, whereas the hip extension moment of
the residual limb was larger than the intact limb at CTO (mean difference: 0.15 Nm/kg) and
CHS (mean difference: 0.05 Nm/kg). The intact knee also generated larger peak moment at
CTO (mean difference: 0.40 Nm/kg) than that in the residual limb (Table 4.8, Figure 4.7).
Limb Mean SD
Intact 0.80 0.02
Residual 0.79 0.02
Intact 0.52 0.02
Residual 0.53 0.01
Intact 110.67 3.05
Residual 110.00 2.46
Step Length (m)
Step Time (sec)
Cadence (step/sec)

91
Table 4.7. The mean, standard deviation (SD) and 95% confidence interval of the joint angles
of the intact and residual legs during stance phase of OI users (n=4). Hip flexion and adduction,
and knee extension angles and ankle dorsiflexion are positive. IHS: ipsilateral heel strike; CTO:
contralateral toe-off; CHS: contralateral heel strike; ITO: ipsilateral toe-off.
95% Confidence Interval
Intact 25.11 2.65 23.13 to 27.08
Residual 29.37 3.85 26.48 to 32.26
Intact 22.22 2.73 19.89 to 24.52
Residual 27.49 4.69 22.90 to 30.07
Intact -19.51 3.43 -21.33 to -16.22
Residual -16.79 3.65 -21.10 to -14.30
Intact -1.89 2.01 -4.23 to 1.65
Residual -1.83 3.62 -1.97 to 2.20
Intact 3.25 0.11 3.01 to 3.65
Residual 2.63 0.15 2.18 to 3.08
Intact 10.06 1.23 9.21 to 11.14
Residual 7.26 1.27 6.39 to 8.14
Intact 9.42 1.11 8.02 to 10.82
Residual 6.96 0.46 6.11 to 7.42
Intact 1.97 0.65 1.22 to 2.45
Residual 1.65 0.23 1.51 to 1.83
Intact -9.81 2.65 -11.79 to -7.85
Residual -8.89 2.47 -9.97 to -6.78
Intact -20.24 4.25 -23.43 to -18.72
Residual -17.04 3.45 -21.22 to -15.25
Intact -11.03 2.66 -13.19 to -9.29
Residual -4.18 0.85 -4.64 to -3.23
Intact -41.67 4.45 -45.27 to -38.05
Residual -39.89 1.03 -40.44 to -38.09
Intact 8.39 1.67 6.28 to 10.49
Residual -1.27 0.12 -1.78 to -1.02
Intact -1.57 2.66 -3.87 to 0.07
Residual -0.25 2.03 -2.10 to 1.43
Intact 8.79 1.45 7.34 to 10.23
Residual 9.11 1.14 7.53 to 9.98
Intact -21.05 3.59 -25.12 to -18.97
Residual -0.51 0.91 -1.62 to 0.36
Limb Mean SD
CTO
CHS
ITO
Joint angles (°) Gait event
Ankle dorsiflexion
IHS
CTO
CHS
ITO
Knee flexion/ extension
IHS
CTO
CHS
ITO
IHS
CTO
CHS
ITO
Hip flexion/ extension
Hip abduction/ adduction
IHS

92

93
Table 4.8. The mean, standard deviation (SD) and 95% confidence interval of the joint
moments of the intact and residual legs during stance phase of OI users (n=4). Hip flexion,
knee extension and ankle dorsiflexion moments are positive. IHS: ipsilateral heel strike; CTO:
contralateral toe-off; CHS: contralateral heel strike; ITO: ipsilateral toe-off.
95% Confidence
Interval
Intact 0.22 0.19 -0.41 to 0.83
Residual 0.02 0.09 -0.27 to 0.27
Intact -1.01 0.08 -1.27 to -0.75
Residual -1.16 0.07 -1.37 to -0.96
Intact 0.46 0.08 0.18 to 0.69
Residual 0.51 0.04 0.37 to 0.65
Intact 0.39 0.08 0.14 to 0.65
Residual 0.03 0.06 -0.17 to 0.23
Intact 0.01 0.05 -0.15 to 0.16
Residual -0.05 0.03 -0.15 to 0.04
Intact 0.44 0.03 0.33 to 0.55
Residual 0.01 0.03 -0.10 to 0.09
Intact -0.24 0.04 -0.36 to -0.12
Residual -0.25 0.03 -0.35 to -0.15
Intact 0.17 0.02 0.01 to 0.08
Residual 0.05 0.03 0.01 to 0.07
Intact 0.04 0.01 0.02 to 0.06
Residual 0.01 0.01 -0.01 to 0.02
Intact 0.14 0.05 -0.03 to 0.31
Residual -0.13 0.02 -0.21 to -0.06
Intact -1.34 0.02 -1.40 to -1.27
Residual -1.39 0.02 -1.45 to -1.30
Intact 0.04 0.01 0.02 to 0.05
Residual -0.06 0.04 -0.18 to 0.05
Ankle dorsiflexion
IHS
CTO
CHS
ITO
Knee flexion/ extension
IHS
CTO
CHS
ITO
Joint moment (Nm/kg) Gait event Limb Mean SD
Hip flexion/ extension
IHS
CTO
CHS
ITO

94
Figure 4.7. Joint angles and moments of the intact (solid line) and residual (dashed line) limbs of OI users (n=4). The gray shaded areas represent
±1 standard deviation from the mean. The vertical dashed line represents contralateral toe-off (CTO); the vertical solid line represents contralateral
heel strike (CHS).

95
Similar to SP users model validation, the timing of muscle contractions predicted by the
model for OI users was similar to those exhibited by EMG signals (Figure 4.8, Figure 4.9).
Peak muscle forces of the intact limb were greater than those in the residual limb for
GMED (mean difference: 5.53 N/kg), IL (mean difference: 1.0 N/kg) and HAM (mean
difference: 2.09 N/kg). The intact limb’s peak force of GMAX (mean difference: 0.30 N/kg)
was smaller than the residual limb, while the peak of RF forces of the intact limb was greater
compared to the residual limb during the first and the second half of stance (mean difference:
9.52 and 0.37 N/kg, respectively) (Table 4.9, Figure 4.8).

96
Table 4.9. The mean, standard deviation (SD) and 95% confidence interval of the muscle forces
of the intact and residual legs during stance phase of OI users (n=4). IHS: ipsilateral heel strike;
CTO: contralateral toe-off; CHS: contralateral heel strike; ITO: ipsilateral toe-off.
Muscle forces 95% Confidence
(N/kg) Interval
Intact 0.29 0.12 0.09 to 0.67
Residual 1.11 0.33 0.07 to 2.15
Intact 8.53 0.46 7.05 to 10.02
Residual 8.59 0.13 8.19 to 9.01
Intact 0.02 0.15 0.00 to 0.07
Residual 0.07 0.03 0.00 to 0.16
Intact 0.01 0.01 0.00 to 0.01
Residual 0.73 0.29 0.00 to 1.67
Intact 3.46 0.54 1.74 to 5.20
Residual 3.11 0.51 1.51 to 4.69
Intact 20.67 2.44 17.10 to 25.25
Residual 17.89 0.33 16.85 to 18.92
Intact 8.89 2.77 0.08 to 17.69
Residual 5.52 0.09 5.22 to 5.82
Intact 1.01 0.45 0.09 to 1.90
Residual 0.27 0.15 0.11 to 0.44
Intact 2.19 0.91 0.00 to 5.05
Residual 0.17 0.12 0.00 to 0.55
Intact <0.01 <0.01 <0.01
Residual <0.01 <0.01 <0.01
Intact 14.51 1.86 8.59 to 20.41
Residual 10.66 0.43 9.38 to 11.95
Intact 1.95 0.71 0.00 to 3.21
Residual 0.62 0.51 0.00 to 1.25
Intact <0.01 <0.01 <0.01
Residual 0.04 0.02 0.00 to 0.06
Intact 2.86 0.12 2.48 to 3.23
Residual <0.01 <0.01 <0.01
Intact 9.17 0.41 7.87 to 10.47
Residual 8.84 0.21 8.19 to 9.51
Intact 4.01 0.23 3.28 to 4.71
Residual 1.05 0.14 1.25 to 0.89
Intact 0.44 0.27 0.00 to 1.31
Residual 1.28 0.25 0.97 to 1.49
Intact 1.11 0.36 0.00 to 1.45
Residual 7.63 1.24 6.23 to 8.89
Intact 0.03 0.02 0.00 to 0.10
Residual <0.01 <0.01 <0.01
Intact 0.16 0.01 0.00 to 0.03
Residual 0.73 0.03 0.62 to 0.83
RF
IHS
CTO
CHS
ITO
HAM
IHS
CTO
CHS
ITO
GMED
IHS
CTO
CHS
ITO
IL
IHS
CTO
CHS
ITO
Gait event Limb Mean SD
GMAX
IHS
CTO
CHS
ITO
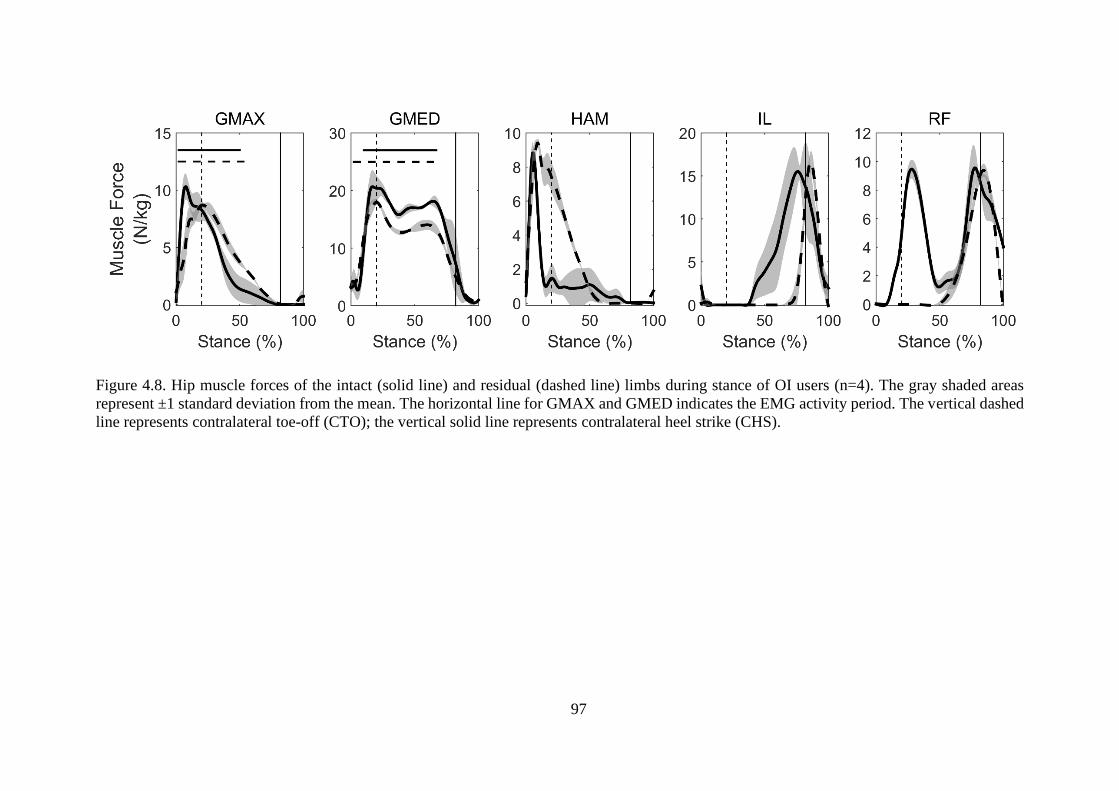
97
Figure 4.8. Hip muscle forces of the intact (solid line) and residual (dashed line) limbs during stance of OI users (n=4). The gray shaded areas
represent ±1 standard deviation from the mean. The horizontal line for GMAX and GMED indicates the EMG activity period. The vertical dashed
line represents contralateral toe-off (CTO); the vertical solid line represents contralateral heel strike (CHS).

98
Figure 4.9. Muscle forces of the intact limb’s VAS, GAS and SOL during stance of OI users (n=4). The gray shaded areas represent ±1 standard
deviation from the mean. The horizontal lines indicate the EMG activity period. The vertical dashed line represents contralateral toe-off (CTO);
the vertical solid line represents contralateral heel strike (CHS).

99
The results also showed that VAS contributed mostly to braking in the first half of stance,
whereas SOL and GAS were prominent contributors to propulsion in the second half of stance.
RF’s peak contribution to braking was higher in the intact limb than the residual limb (mean
difference: 0.20 m/s2). The prosthesis generated most of the anterior-posterior COM
acceleration in the whole stance in the residual limb. Body support was primarily provided by
VAS in early to mid-stance and SOL and GAS in the second half of stance of the intact limb.
GMAX contributed more to vertical COM acceleration in the intact limb compared to that in
the residual limb (mean difference: 0.75 m/s2).
The largest contribution to mediolateral COM acceleration was generated by GMED,
which contributed medially throughout the whole stance. The peak GMED contribution to
medial acceleration was greater in the intact limb than the residual limb (mean difference: 0.34
m/s2). The intact limb GMAX contributed laterally to COM acceleration, which contrasts with
the medial contribution of GMAX in the residual limb. The peak IL contribution to lateral
COM acceleration was higher in the intact limb than that in the residual limb (mean difference:
0.09 m/s2). The peak amount of HAM contribution to balance was smaller in the intact limb
compared to the residual limb (mean difference: 0.25 m/s2). The prosthesis generated lateral
contribution to COM acceleration in the residual limb, while VAS contributed medially, and
SOL and GAS contributed laterally during stance of the intact limb (Figure 4.10).

100
Figure 4.10. Individual muscle and prosthesis contribution to anterior-posterior, vertical and mediolateral COM acceleration of OI users (n=4).
The shaded area represents the summed contribution from all actuators. The vertical dashed line represents contralateral toe-off (CTO); the
vertical solid line represents contralateral heel strike (CHS).
101
4.3.3 Sensitivity analysis
Sensitivity analyses were performed to determine the effects of independently changing
moment of inertia and center of mass of the prosthetic leg on knee moment of the intact and
residual limb for one SP amputee. The following alterations were applied to the prosthetic
inertial properties:
i) Increasing the moment of inertia (MOI) of all prosthetic segments by 25% and 50%,
keeping the center of mass (COM) constant.
ii) Moving distally the center of mass of all prosthetic segments by 25% and 50%,
keeping the moment of inertia constant.
iii) Decreasing the moment of inertia of all prosthetic segments by 25% and 50%,
keeping the center of mass constant.
iv) Decreasing the center of mass of all prosthetic segments by 25% and 50%, keeping
the moment of inertia constant.
No significant differences were found in the knee moment of the intact and the residual
limb (Figure 4.11), which is in agreement with previous modeling prosthetic study (Smith et
al., 2014, Narang et al., 2015).

102
Figure 4.11. Knee moment of intact limb and residual limb for one amputee. ±50 (25) % MOI
represents when MOI increased or decreased by 50(25) %; ±50(25) % COM represents when
COM increased (decreased) by 50(25) %.

103
4.4 Discussion
The objective of this study was to employ 3D musculoskeletal modeling to investigate
gait asymmetry in unilateral transfemoral amputees during gait. This was achieved by
determining how the lower limb muscles and prosthesis of unilateral transfemoral amputees
generate forward progression, vertical support, and mediolateral acceleration of the body
COM. Consistent with our hypothesis, hip muscle contributions to propulsion, support and
balance in the intact limb were significantly greater than those in the residual limb for both
socket and osseointegrated groups. The prosthesis was found to function as the major
contributor to support, progression and mediolateral balance in the residual limb. The knee and
ankle extensors of the SP users contributed to the medial acceleration of the COM, while it is
known that these muscles contribute to lateral acceleration of the COM in healthy non-
amputees (Pandy et al., 2010, Silverman and Neptune, 2012). However, the ankle extensors
(SOL and GAS) of the OI users contributed to lateral COM acceleration, which was similar to
non-amputee’s muscle behavior according to literature.
In agreement with previous studies (Nolan et al., 2003, Gard, 2006, Hof et al., 2007), a
significantly longer stance phase was shown in the intact limb of the SP users compared to that
in the residual limb. This may be due to the greater dependence of the amputee’s intact limb
on generation of support and propulsion of the body COM, which was evidenced from greater
vertical and anterior-posterior components of the GRFs compared to those in the residual limb
(Nolan et al., 2003, de Cerqueira et al., 2013, Harandi et al., 2020). For example, the amputees'
inability to flex their prosthetic knee during weight transfer to the intact limb may necessitate
greater compensatory hip motion from the intact limb during the swing phase of the residual
limb, thus prolonging the stance in the intact limb (Gard, 2006). The shorter residual limb
stance phase may also be exacerbated by contrasting mass and inertial properties between the
104
two legs (Mattes et al., 2000, Harandi et al., 2020). Regarding the OI users, the spatiotemporal
parameters of the intact limb were greater than those of the residual limb. However, the
differences in each parameter between the intact and residual limb were smaller in the OI users
than those of the SP users. This may be due to the greater self-selected walking speed of the
OI users than the SP users, which might be affected by the direct anchorage of the femur to the
residual limb (Frossard et al., 2010).
The present study showed that hip flexion and extension in the residual limb were
significantly reduced at IHS, CTO and CHS compared to that in the intact limb in SP users.
This reduced femoral motion may be affected by socket-pelvis interference. The femoral
rotation relative to the pelvis is restricted in the acetabulum of the hip due to the anatomical
constraints imposed by the skeletal anatomy (Jaegers et al., 1995b, Rabuffetti et al., 2005). The
amputees also tilted their pelvis more in the stance phase of the residual limb than the that of
the intact limb, which was mostly observed during hip extension. This may be associated with
an increase in hip abduction and extension of the intact limb as a compensatory mechanism for
the reduced hip function in the residual limb (Cappozzo et al., 1982, Sjödahl et al., 2003,
Goujon-Pillet et al., 2008). For the OI users, the hip extension and adduction of the intact limb
were greater than those in the residual limb. The OI users extended their residual limb’s hip
more to reach their intact limb’s hip extension when compared with SP users (Rabuffetti et al.,
2005, Tranberg et al., 2011). It may be correlated with differences in step length values between
the intact and residual limb. The step length of the residual limb in the SP users was
significantly smaller than that of the intact limb, which is in contrast to OI users. This may lead
to a reduced hip extension during stance (Kerrigan et al., 1998, Sawicki and Ferris, 2009). The
difference in step length of the SP and OI users between their intact and residual limb may also
be due to the influence of direct attachment of the femur to the implant, which allows the hip
joint moves in a larger range than socket type (Tranberg et al., 2011). On the other hand, the

105
SP users tilted their pelvis more anteriorly, when the residual limb was in stance phase, to
compensate the reduced residual limb’s hip extension due to restrictions caused by the socket
(Kerrigan et al., 1998).
The present study about both SP and OI users showed that VAS and GMAX in the intact
limb were the major contributors to the fore-aft and vertical body COM acceleration in early
to mid-stance, which has already been shown in studies of healthy adults (Lim et al., 2013, Lin
et al., 2015). Also, RF in the intact limb contributed more to posterior COM acceleration than
that in the residual limb, while the intact limb’s IL contributed more to anterior COM
acceleration compared to those contributions in the residual limb. Furthermore, VAS and
GMAX contributed significantly more to support, and VAS also contributed more considerably
to breaking. The greater contribution to COM acceleration of the hip muscles in the intact limb
compared to those in the residual limb may be due to the lower hip joint motions and smaller
hip joint moments in the residual limb, which led to an increase in hip motion, greater hip
moments and higher hip muscles forces of the intact limb (Lim et al., 2013, Lin et al., 2015).
Regarding the OI users, the peak of hip muscles forces and contributions to COM acceleration
in the intact limb were greater than those in the residual limb; however, the difference between
the two limbs was smaller than that of the SP users.
While this study did not quantify muscle and joint function in healthy controls, forces
generated by VAS, SOL and GAS in the intact limb of the transfemoral amputees were greater
than those previously measured in non-amputees (Lim et al., 2013, Harandi et al., 2020). In
addition, previous studies on healthy individuals have shown that VAS, SOL, and GAS
contribute to lateral body COM acceleration, whereas our study on SP users showed that these
muscles contributed to medial body COM acceleration (Silverman and Neptune, 2012). This
difference may be associated with the greater step width and hip abduction in the intact limb
compared to the residual limb (Silverman and Neptune, 2012). For example, the maximum and

106
average values of the intact limb hip abduction angle were 11.04˚ and 4.64˚, respectively,
which were higher than those in non-amputees reported previously (4.3˚ and 1.0˚, respectively)
(Silverman and Neptune, 2012, Harandi et al., 2020). For the OI users, VAS generated medial
contribution, but SOL and GAS contributed to lateral body COM acceleration, which was in
contrast with the medial contribution of the two latter muscles in SP users. OI users showed
6.76˚ and 3.82˚ as the maximum and average values of the intact limb hip abduction,
respectively. These values were smaller and greater than those in SP users described above.
This intact foot’s inclination to the lateral body COM may also be associated with the increase
in stability due to loss of ankle plantarflexors of the residual limb (Kerrigan et al., 1998). The
contribution of SP users’ VAS, SOL and GAS to the medial acceleration of the body COM in
transfemoral amputees may be caused by the placement of the intact limb’s foot relative to the
body COM more laterally than that in the residual limb to control mediolateral balance. This
difference in foot placement may be a result of the loss of ankle plantarflexors to increase the
stability of the body during walking (Kerrigan et al., 1998). However, the OI users showed
similarity in the contribution of SOL and GAS to lateral COM acceleration with non-amputees
in the literature.
The prosthesis of the SP and OI users provided the major contribution to body support
during stance in the residual limb, but it also contributed to braking and progression in the first
and second half of stance, respectively. The function of the prosthesis to braking, propulsion,
and support was similar to the overall role of VAS, SOL, and GAS in the intact limb during
walking. While the prosthesis contributed to lateral COM acceleration, GMED in the residual
limb contributed substantially to medial COM acceleration. However, contributions from
GMED and GMAX of the residual limb were smaller relative to those in the intact leg. This
may be related to smaller hip moments and hip muscle forces accompanying smaller hip range

107
of motion in the residual limb, as demonstrated in previous lower limb amputee studies
(Renström et al., 1983, Moirenfeld et al., 2000).
One may raise question about the SP users in this dissertation is that they are divided into
two groups (three with the passive knee joint and three with active knee joint). The type of
knee joint has been demonstrated to affect knee flexion angle and moment of the intact limb
(Kaufman et al., 2007, Frossard et al., 2010, Kaufman et al., 2012, Frossard et al., 2019), which
has also been confirmed by our result (Figure 4.12-Figure 4.13). Furthermore, all the
musculoskeletal modeling and computational procedures were separately performed for the SP
users with passive and active knee joint. The results of induced acceleration analysis showed
consistency in the overall pattern of muscle recruitment during walking between the passive
and active knee prosthesis (Figure 4.14-Figure 4.15). However, the magnitudes of individual
muscle contribution to COM acceleration were different between the two groups fitted with
passive and active knee prosthesis (Harandi et al., 2020). The aim of this study was to
investigate the dynamics role of muscles when generating walking movement in transfemoral
amputees with socket and osseointegration prosthesis. So, one view might be doing average
amongst all the SP users ignoring their type of knee joint and considering only the effect of
socket on their walking.

108
Figure 4.12. The intact and residual limb’s joints angles of the amputees with passive (solid
line, n=3) and active (dashed line, n=3) prosthesis. The vertical dashed line represents
contralateral toe-off (CTO); the vertical solid line represents contralateral heel strike (CHS).
Figure 4.13. The intact and residual limb’s joints moments of the amputees with passive (solid
line, n=3) and active (dashed line, n=3) knee prosthesis. The vertical dashed line represents
contralateral toe-off (CTO); the vertical solid line represents contralateral heel strike (CHS).

109
Figure 4.14. The intact limb muscle contribution to COM acceleration for amputees with passive (mechanical) knee joint (top, n=3) and active
(microprocessor) knee joint (bottom, n=3). The shaded area represents the summed contribution from all actuators.

110
Figure 4.15. The residual limb muscle contribution to COM acceleration for amputees with passive (mechanical) knee joint (top, n=3) and active
(microprocessor) knee joint (bottom, n=3). The shaded area represents the summed contribution from all actuators.
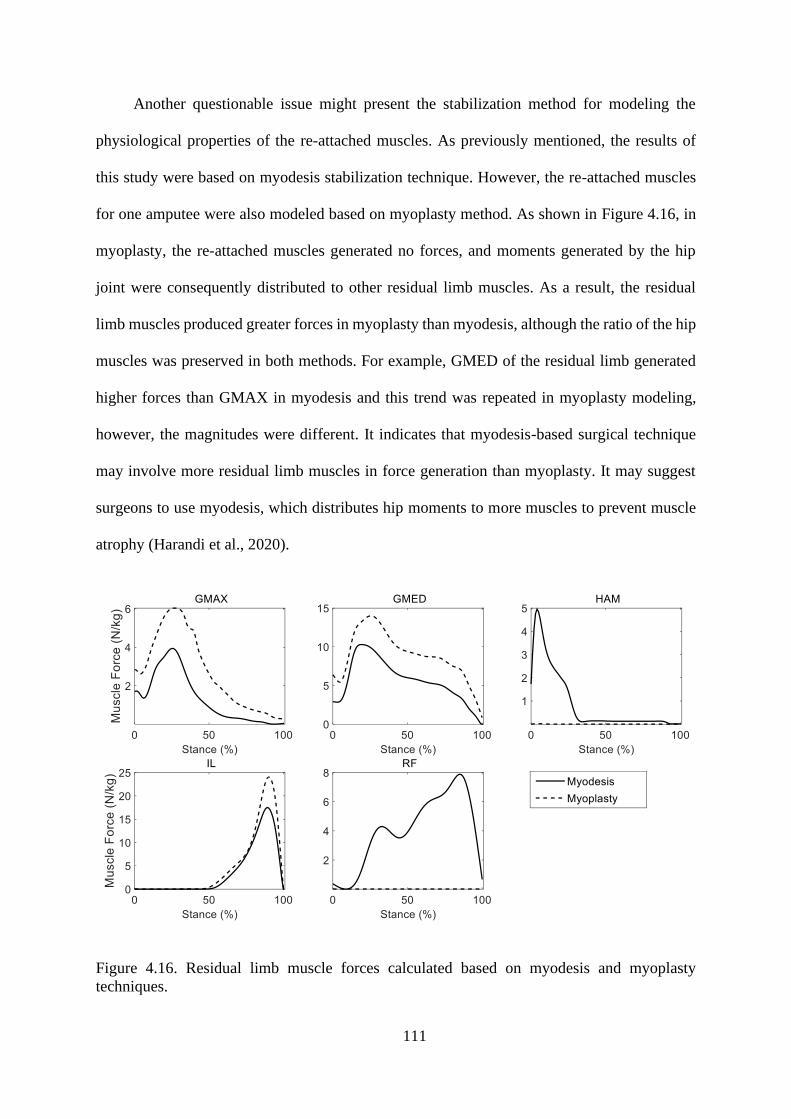
111
Another questionable issue might present the stabilization method for modeling the
physiological properties of the re-attached muscles. As previously mentioned, the results of
this study were based on myodesis stabilization technique. However, the re-attached muscles
for one amputee were also modeled based on myoplasty method. As shown in Figure 4.16, in
myoplasty, the re-attached muscles generated no forces, and moments generated by the hip
joint were consequently distributed to other residual limb muscles. As a result, the residual
limb muscles produced greater forces in myoplasty than myodesis, although the ratio of the hip
muscles was preserved in both methods. For example, GMED of the residual limb generated
higher forces than GMAX in myodesis and this trend was repeated in myoplasty modeling,
however, the magnitudes were different. It indicates that myodesis-based surgical technique
may involve more residual limb muscles in force generation than myoplasty. It may suggest
surgeons to use myodesis, which distributes hip moments to more muscles to prevent muscle
atrophy (Harandi et al., 2020).
Figure 4.16. Residual limb muscle forces calculated based on myodesis and myoplasty
techniques.

112
Moreover, the inertial properties (center of mass and moment of inertia) of prosthetic
segments were estimated by the prosthetics’ reverse-engineering design in SolidWorks. The
results demonstrated that differences in joint moments between the initial properties estimated
by SolidWorks and the alterations described in 4.3.3 were small during stance phase, which
was in accordance with previous studies (Smith et al., 2014, Narang et al., 2015) (Figure 4.11).
Narang et al. investigated the effects of different mass and moment of inertia on knee moment
and found there would be no notable difference in the knee moment of the prosthetic leg if the
inertial parameters of the prosthetic changed to 25% and 50% of the corresponding segments
in the intact limb during stance. In general, it seems that the type of prosthesis and knee joint
both influence the joints angles and moments (Huch et al., 1997, Bae et al., 2007, Steele et al.,
2012b).
There are several limitations to the present study. Firstly, the cost function used in the
static optimization minimized the sum of squares of muscle activations. Activation criterion
does not consider musculoskeletal conditions for amputees. For example, muscle fatigue
frequently occurs in atrophied muscles of lower limb amputees, which may influence gait
compensation strategies (Ackermann and Van den Bogert, 2010). Secondly, the low number
of subjects recruited may not be representative of the average data for a broad population of
amputees and may affect statistically the results. However, the sample size was sufficient to
detect significant differences in spatiotemporal parameters, joint angles and joint moments
between limbs for the SP users. The small number size of the OI users did not permit to perform
any statistical analysis.
This chapter demonstrated gait asymmetries in transfemoral amputees (SP and OI users),
including increased anterior pelvis tilt during the residual limb’s stance and increased hip
extension in the intact limb compared to that in the residual limb. Reduced hip extension in the
residual limb and a shorter residual limb stance phase was associated with increased anterior

113
pelvis tilt. Increases in the intact limb’s hip joint range of motion and hip muscle function
appeared to be a compensatory mechanism associated with decreases in the residual limb’s hip
muscle forces and contributions to COM acceleration. For the OI users, spatiotemporal
parameters, joint kinematics and kinetics, muscle forces and muscle contribution to COM
acceleration in the intact limb were greater than those of the residual limb. However, the results
depicted that differences in these parameters between the two limbs were smaller than those of
the SP users since there was no significant difference between the two limbs. This may prove
that the OI users walked more symmetrically than the SP users. However, we believe that the
small sample size (four OI users) may not be representative of the transfemoral osseointegrated
community and larger sample size is needed to reach a solid statement. The outcomes of this
study may help with prescribing targeted rehabilitation and help with improving the design and
function of prostheses.

114
This chapter is based on the following submitted paper:
• Vahidreza Jafari Harandi, David Charles Ackland, Raneem Haddara, L. Eduardo
Cofré Lizama, Mark Graf, Mary Pauline Galea, Peter Vee Sin Lee – Muscle
contribution to hip contact forces in osseointegrated transfemoral amputees during
walking. Computer Methods in Biomechanics and Biomedical Engineering, Under
Review (Submitted December 2019).
Muscle contribution to hip
contact forces

115
5.1 Introduction
The number of individuals with lower extremity amputation is estimated to increase by
2050 in the US (Ziegler-Graham et al., 2008). Approximately one-third of socket-worn
transfemoral amputees has been reported to complaint chronic skin pain due to the interaction
with socket (Rommers et al., 1996, Hagberg and Brånemark, 2001b, Meulenbelt et al., 2009,
Butler et al., 2014). This tissue problem has affected their mobility and quality of life (Pezzin
et al., 2000, Demet et al., 2003, Pezzin et al., 2004a), which has led to design new sockets for
better walking; however, skin problems still exist (Van de Meent et al., 2013). Thus, an
alternative technique, osseointegration, has been used to decrease these problems (Branemark
et al., 2001, Al Muderis et al., 2018). On the other hand, the prevalence rate of pain and
osteoarthritis (OA) in the hip of the intact limb has been shown in lower extremity amputees
to be higher with 14% more than able-bodied individuals (Struyf et al., 2009, Welke et al.,
2019).
Osseointegrated transfemoral amputees have improved gait parameters compared to
those fitted with socket prosthesis. For example, they have shown greater hip range of motion,
quicker cadence and increase in walking speed than conventional socket patients; however,
slower cadence and larger gait duration have been recognized in osseointegrated transfemoral
amputees compared to non-amputees (Hagberg et al., 2005, Frossard et al., 2010, Tranberg et
al., 2011, Pinard and Frossard, 2012, Leijendekkers et al., 2017, Robinson et al., 2020). Lower
cadence and stride length have been associated with lower hip contact forces (Stansfield and
Nicol, 2002). One study has found improvement in hip extension of the residual limb after
osseointegration surgery relative to when wearing socket prosthesis (Tranberg et al., 2011).
Lewis et al. reported that increase in hip extension resulted in increase in anterior hip contact
forces (Lewis et al., 2007, Lewis et al., 2010, Wesseling et al., 2015). A decreased hip extension

116
at terminal stance has been linked to a reduction in hip contact forces (Bennett et al., 2008,
Beaulieu et al., 2010, Wesseling et al., 2015). Also, increased hip contact force has been
indicated to relate to increase in hip extension and adduction angles and moments in patients
with total hip replacement (Foucher et al., 2009, Wesseling et al., 2015). Increasing hip loading
has been illuminated as a sign for hip OA development (Felson, 2004). Transfemoral amputees
also showed greater intact limb ground reaction forces (GRFs) than the residual limb
(Schaarschmidt et al., 2012, Okita et al., 2018), which may result greater joint loading in the
intact limb. As a result, joint loading variations between the intact and residual limb should be
identified to assimilating how walking mechanisms contribute to the prevalence of hip OA.
Several instrumented implants-based studies have measured hip contact forces in daily
activities (Rydell, 1966, Crowninshield et al., 1978, Bergmann et al., 1993, Bergmann et al.,
2001). The in vivo approach in these studies is limited to those with total hip replacement
surgery, which does not apply to amputees and healthy subjects. Therefore, musculoskeletal
modeling techniques have been utilized to noninvasively calculate hip contact forces (Heller et
al., 2001, Stansfield et al., 2003, Correa et al., 2010, Schache et al., 2018). The resultant hip
contact forces have mostly been investigated in non-amputees during walking and running
(Crowinshield et al., 1978, Röhrle et al., 1984, Read and Nigg, 1999, Giarmatzis et al., 2015).
However, three studies provided a more complete understanding of muscle function to hip
contact forces in healthy individuals (Correa et al., 2010, Pandy and Andriacchi, 2010, Schache
et al., 2018). Despite muscles have been shown as major contributors to mechanical joint
loading (Herzog et al., 2003), further study is required to analyze individual muscle role to joint
contact force in amputees due to differences in walking mechanism than non-amputees.
Previous studies have investigated individual muscle contribution to the anterior-
posterior, superior-inferior and medial-lateral components of the hip joint contact forces in
non-amputees (Correa et al., 2010, Schache et al., 2018). The crossing hip joint muscles,

117
gluteus maximus (GMAX) and gluteus medius (GMED), contributed more to posterior and
anterior hip contact forces, respectively. In addition, the axial and mediolateral components of
hip contact forces were provided by GMAX and GMED. Of those non-crossing the hip joint
muscles, vasti (VAS) contributed more to the anterior and superior of hip contact forces during
the first half of stance, while soleus (SOL) and gastrocnemius (GAS) generated greater
contribution to the superior of hip contact forces during the second half of stance (Correa et al.,
2010, Schache et al., 2018). Differences in spatiotemporal parameters and joint angles and
moments in the intact limb than the residual limb as well as the loss of functional behavior of
a number of below-knee muscles and knee extensors may be affecting walking mechanisms in
unilateral transfemoral amputees. As a result, the way in which individual muscles contribute
to hip contact forces in transfemoral amputees is ambiguous.
The purpose of this study was to use three-dimensional musculoskeletal modelling to
investigate individual muscle contribution to hip contact forces through analysis of joint
kinematics and moments, then muscle forces and muscle contribution to GRFs in SP and OI
users. Our hypothesis was the hip muscles contribution to hip contact forces would be different
to that of the residual limb. The outcome of this study may be important to prevent or postpone
the increase rate of hip OA in amputees.
5.2 Materials and Methods
The detail of materials and methods used in this study has been comprehensively
discussed in chapter Chapter 3. In this section, a brief explanation of the methods is presented.
However, the relevant section in the methods chapter is mentioned to avoid repetition.

118
5.2.1 Subject recruitment
Gait experiments were performed on six individuals with unilateral transfemoral
amputation wearing socket and four osseointegrated unilateral transfemoral amputees. All
subjects wore their own prosthesis and were able to walk without assistive devices. The
prostheses alignment and fitting were checked by an experienced prosthetist prior to data
collection. Ethical approval was obtained by the Melbourne Health Human Research Ethics
Committee with the number HREC 2015.148, and each participant provided written informed
consent.
5.2.2 Testing protocol
Experimental data were collected over three trials of over-ground walking at each
subject’s preferred speed. The three-dimensional positions of reflective markers were recorded
using an eight-camera motion capture system (Vicon, Oxford Metrics) sampling at 200 Hz.
The markers were placed on body segments on the intact and residual limb, followed by the
marker set protocol developed by Dorn (Dorn, 2011). On the prosthesis, the markers were
mounted in medial and lateral knee and ankle, heel and toe. Three force platforms (Watertown
MA, USA), embedded in the ground, were used to measure GRF, sampling at 1000 Hz. EMG
was simultaneously recorded on the intact limb muscles (GMAX, GMED, SOL, GAS and VAS
(supplementary material)) and residual leg muscles (GMAX and GMED) based on the
previously described procedure to collect electromyography (EMG) data (Hermens et al.,
2000), sampling at 1000 Hz. Muscle contraction was performed to check EMG signals prior to
experiment to obtain the accuracy of electrodes (Hermens et al., 1999, Wentink et al., 2013).

119
5.2.3 Data processing
Marker trajectories were then low-pass filtered with a cut-off frequency of 4 Hz using a
4th order Butterworth filter. A 4th order Butterworth filter was used to low-pass filter GRFs data
with a cut-off frequency of 60 Hz. EMG offset signals were removed and then rectified and
low-pass filtered at 10 Hz using a 2nd order Butterworth filter to create linear envelopes. Joint
trajectories were calculated using inverse-kinematics and averaged across three successive gait
cycles (Harandi et al., 2020).
5.2.4 Musculoskeletal modeling
A 10-segment, 23 degree-of-freedom generic skeletal model of the body was scaled in
OpenSim 3.2 for each subject (Delp et al., 2007). The head, arm, and torso were lumped
together as a single rigid body, which articulated with the pelvis via a ball-and-socket back
joint. The hip was modelled as a ball-and-socket joint, both anatomical knee and metatarsal
joints of the intact limb as hinge joints, and each ankle-subtalar complex of the intact limb as
a universal joint. The lower limbs and trunk were actuated by 76 Hill-type muscle-tendon units
(Zajac, 1989) (supplementary material). Scaled-personalized models were then developed by
scaling segment length and muscle tendon parameters of the generic musculoskeletal model.
A scaling factor was calculated using the relative distance between each segment’s pair of
markers measured in a static standing calibration trial and the corresponding virtual markers
mounted in the model (Delp et al., 2007, Schache et al., 2018).
For each subject, the dimensions of the lower-limb prosthesis’ segments including knee
joint, pylon and foot were measured using digital caliper and tape measure, and the weight of
the prosthesis’ segments was measured using digital scale (AND brand, model SJ-5001HS
5000g x 1g). The prosthesis was then reverse-engineered in SolidWorks (Massachusetts, USA),
120
assuming homogeneous material, to calculate moment of inertia and center of mass position,
and virtually placed in the individualized scaled model. The knee and ankle of the prosthetic
leg were modeled as hinge joint. The residual limb was modeled as a frustum of a right circular
cone to obtain mass, center of mass and moment of inertia (Ferris et al., 2017, Harandi et al.,
2020).
The below-knee segments including tibia, talus, and foot (in concomitant with that
portion of femur replaced with implant) were removed from the scaled model. Uniarticular
muscles spanning the knee joint were also excluded from model. Two different surgical
techniques, myodesis and myoplasty, are the most common stabilization strategies for the re-
attached muscles. However, myodesis has been shown to improve the re-anchored muscle’s
capacity such as hamstrings and hip adductors to generate hip forces and moments (Gottschalk,
2004, Tintle et al., 2010, Ranz et al., 2017). Thus, the current study followed the myodesis
stabilization technique for alteration, re-anchored muscle properties. This technique directly
re-attaches the detached muscles to the distal end of the residual femur (Ranz et al., 2017). In
this case, muscle parameters were changed to preserve the muscle tension in the neutral
position based on data from the same muscle in the opposite limb (Ranz et al., 2017). Tendon
slack length was changed to maintain muscle tension; optimal fibre length was then calculated
in equal proportion to the sum of muscle tendon slack length and fibre length of the intact
limb’s muscles in neutral position (Ranz et al., 2017, Harandi et al., 2020).
Hip, knee ankle joint trajectories were calculated using inverse kinematics (IK) (Lu and
O’connor, 1999). Net joint moments were obtained using inverse dynamics. Residual
Reduction Analysis (RRA) was then performed to vary the model’s torso center of mass to
diminish the dynamic inconsistency between the collected GRFs and the measured kinematics
of the model (Thelen and Anderson, 2006, Delp et al., 2007). Muscle forces were calculated
using static optimization by decomposing the net joint moments into discrete muscle actuator

121
loads (Anderson and Pandy, 2001b). The optimization problem aimed to minimize the sum of
squared muscle activation constrained by each muscle’s force-length-velocity property.
Contribution of muscle forces, gravity, inertia and other external forces to the GRFs were
subsequently quantified using a pseudo-inverse GRF decomposition method and induced
acceleration analysis, considering five-point foot-ground contact model for both the intact and
residual limb (Dorn et al., 2012a). The foot-ground model is required as mechanical constraint
to implement induced acceleration analysis. The hip contact forces were calculated using a
recursive bottom-up operation which starts from the most distal segments and ends at the most
proximal body (Steele et al., 2012a). At each time step, muscle contributions to hip contact
forces were computed by remaining only the muscle interest and the corresponding muscle
force and muscle contribution to GRF, and then solving hip contact forces described above
(Sasaki and Neptune, 2010). Hip contact forces and muscle contributions to hip contact force
were calculated at four major gait events including ipsilateral heel-strike (IHS), contralateral
toe-off (CTO), contralateral heel-strike (CHS) and ipsilateral toe-off (ITO) during stance phase.
5.3 Results
In this section, the results for both SP and OI users are presented. However, the reader is
referred to relevant sections in some cases to avoid repetition. Overall, the SP and OI users
showed differences in walking parameters including spatiotemporal, joint angles, joint
moments and muscle forces between the intact and residual limb.
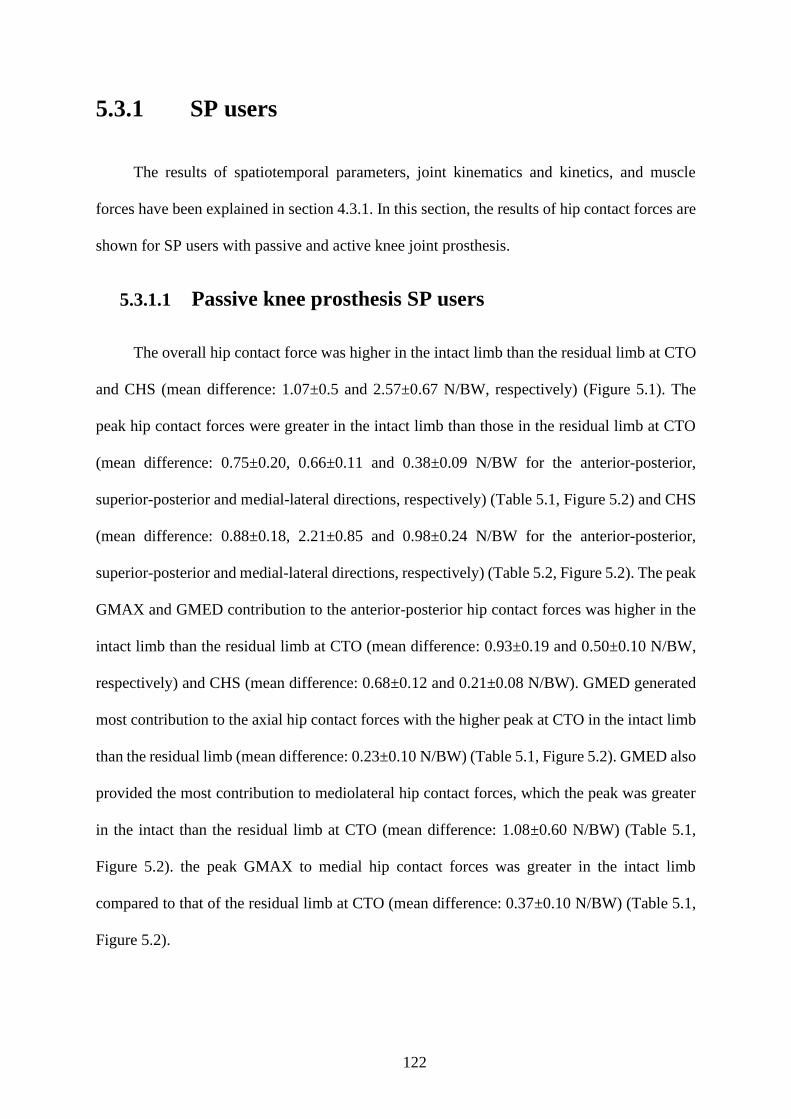
122
5.3.1 SP users
The results of spatiotemporal parameters, joint kinematics and kinetics, and muscle
forces have been explained in section 4.3.1. In this section, the results of hip contact forces are
shown for SP users with passive and active knee joint prosthesis.
5.3.1.1 Passive knee prosthesis SP users
The overall hip contact force was higher in the intact limb than the residual limb at CTO
and CHS (mean difference: 1.07±0.5 and 2.57±0.67 N/BW, respectively) (Figure 5.1). The
peak hip contact forces were greater in the intact limb than those in the residual limb at CTO
(mean difference: 0.75±0.20, 0.66±0.11 and 0.38±0.09 N/BW for the anterior-posterior,
superior-posterior and medial-lateral directions, respectively) (Table 5.1, Figure 5.2) and CHS
(mean difference: 0.88±0.18, 2.21±0.85 and 0.98±0.24 N/BW for the anterior-posterior,
superior-posterior and medial-lateral directions, respectively) (Table 5.2, Figure 5.2). The peak
GMAX and GMED contribution to the anterior-posterior hip contact forces was higher in the
intact limb than the residual limb at CTO (mean difference: 0.93±0.19 and 0.50±0.10 N/BW,
respectively) and CHS (mean difference: 0.68±0.12 and 0.21±0.08 N/BW). GMED generated
most contribution to the axial hip contact forces with the higher peak at CTO in the intact limb
than the residual limb (mean difference: 0.23±0.10 N/BW) (Table 5.1, Figure 5.2). GMED also
provided the most contribution to mediolateral hip contact forces, which the peak was greater
in the intact than the residual limb at CTO (mean difference: 1.08±0.60 N/BW) (Table 5.1,
Figure 5.2). the peak GMAX to medial hip contact forces was greater in the intact limb
compared to that of the residual limb at CTO (mean difference: 0.37±0.10 N/BW) (Table 5.1,
Figure 5.2).

123
GAS, SOL and VAS generated the most contribution to the three components of the
intact limb’s hip contact forces. GAS provided higher contribution to the superior hip contact
forces at CTO (0.44±0.09 N/BW), followed by and VAS (0.28±0.05 N/BW) (Table 5.1, Figure
5.3). The peak VAS contribution to axial hip contact forces was greater at CHS (0.56±0.11
N/BW) than GAS (0.34±0.08 N/BW) (Table 5.2, Figure 5.3).
Figure 5.1. Total hip contact forces for the intact and residual limb of the SP users with only
passive knee prosthesis (n=3). The vertical solid lines indicate the intact limb and the vertical
dashed lines indicate the residual limb.

124
Table 5.1. Individual muscle contribution to the peak hip contact forces during CTO for the SP users with only passive knee prosthesis (n=3).
Intact Residual Intact Residual Intact Residual
Hip-spanning muscles
ALAM 0.14 0.03 0.47 0.16 0.12 0.05
GMAX -0.94 <0.01 1.55 1.14 0.49 0.12
GMED 0.83 0.33 2.35 2.12 1.27 0.19
IL 0.20 0.12 0.75 0.05 0.16 0.04
RF 0.03 -0.01 -0.36 <0.01 <0.01 0.02
HAM 0.07 0.01 0.47 0.21 0.04 0.04
Subtotal 0.33 0.48 5.23 3.68 2.08 0.46
Non-hip-spanning muscles
GAS 0.05 --- 0.44 --- <0.01 ---
SOL 0.03 --- -0.28 --- <0.01 ---
VAS 0.07 --- 0.28 --- 0.02 ---
Subtotal 0.15 --- 0.44 --- 0.02 ---
Others 0.76 0.01 -2.25 -0.92 -0.91 0.35
Total 1.24 0.49 3.42 2.76 1.19 0.81
Anterior(+)/ Posterior(-) Superior(+)/ Inferior(-) Medial(+)/ Lateral(-)

125
Table 5.2. Individual muscle contribution to the peak hip contact forces during CHS for the SP users with only passive knee prosthesis (n=3).
Intact Residual Intact Residual Intact Residual
Hip-spanning muscles
ALAM 0.15 0.02 0.66 0.15 0.06 0.03
GMAX -0.71 -0.03 0.75 0.56 0.06 0.19
GMED 0.44 0.23 1.52 2.02 0.65 0.59
IL 0.83 0.01 2.07 0.12 0.51 0.01
RF 0.17 -0.02 0.32 -0.08 -0.02 <0.01
HAM 0.14 0.04 0.63 0.07 0.02 0.03
Subtotal 1.02 0.25 5.95 2.84 1.28 0.85
Non-hip-spanning muscles
GAS 0.09 --- 0.34 --- 0.04 ---
SOL 0.13 --- -0.11 --- -0.04 ---
VAS 0.12 --- 0.56 --- 0.02 ---
Subtotal 0.34 --- 0.79 --- 0.02 ---
Others -0.20 0.03 -1.93 -0.15 0.39 -0.14
Total 1.16 0.28 4.81 2.69 1.69 0.71
Anterior(+)/ Posterior(-) Superior(+)/ Inferior(-) Medial(+)/ Lateral(-)

126
Figure 5.2. Individual hip-spanning muscles to the three components of the hip contact forces for the SP users with only passive knee prosthesis
(n=3). The vertical dashed and solid lines indicate contralateral toe-off and contralateral heel-strike, respectively. The shaded area represents the
total hip contact forces acting along the three coordinate directions.

127
Figure 5.3. Individual non-hip-spanning muscles to the three components of the hip contact forces for the SP users with only passive knee prosthesis
(n=3). The vertical dashed and solid lines indicate contralateral toe-off and contralateral heel-strike, respectively. The shaded area represents the
total hip contact forces acting along the three coordinate directions.

128
5.3.1.2 Active knee prosthesis SP users
The hip contact forces were greater in the intact limb relative to the residual limb at CTO
and CHS (mean difference: 0.04±0.01 and 0.18±0.08 N/BW, respectively) (Figure 5.4).
Specifically, the anterior-posterior, superior-inferior and medial-lateral hip contact forces of
the intact limb were higher than those of the residual limb at CTO (mean difference: 0.10±0.05,
0.45±0.15 and 0.44±0.20 N/BW, respectively) (Table 5.3). The peak hip contact force of the
intact limb was greater than the residual limb at CHS for the superior-inferior direction (mean
difference: 0.44±0.12 N/BW) (Table 5.4). GMED contributed to the anterior hip contact force,
which the peak was higher in the intact limb than the residual limb at CTO (mean difference:
0.30±0.10 N/BW). The axial hip contact force was basically provided by GMED and GMAX,
which the peak at CTO was greater in the intact limb than the residual limb (mean difference:
0.32±0.12 and 0.36±0.16 N/BW, respectively) (Table 5.3). The peak contribution to medial-
lateral hip contact force of GMED was greater in the intact limb than the residual limb at CTO
(mean difference: 0.65±0.35 N/BW) (Table 5.3) (Figure 5.5).
VAS generated most contribution to the superior hip contact forces at CTO and CHS
with the peak of 0.47±0.20 and 0.41±0.25 N/BW, respectively, followed by GAS with the peak
of 0.29±0.09 N/BW, respectively) (Table 5.3, Figure 5.6). While SOL contributed to the lateral
hip contact force with the peak of 0.16±0.05 N/BW (Table 5.4, Figure 5.6).

129
Figure 5.4. Total hip contact forces for the intact and residual limb of the SP users with only
active knee prosthesis (n=3). The vertical solid lines indicate the intact limb and the vertical
dashed lines indicate the residual limb.
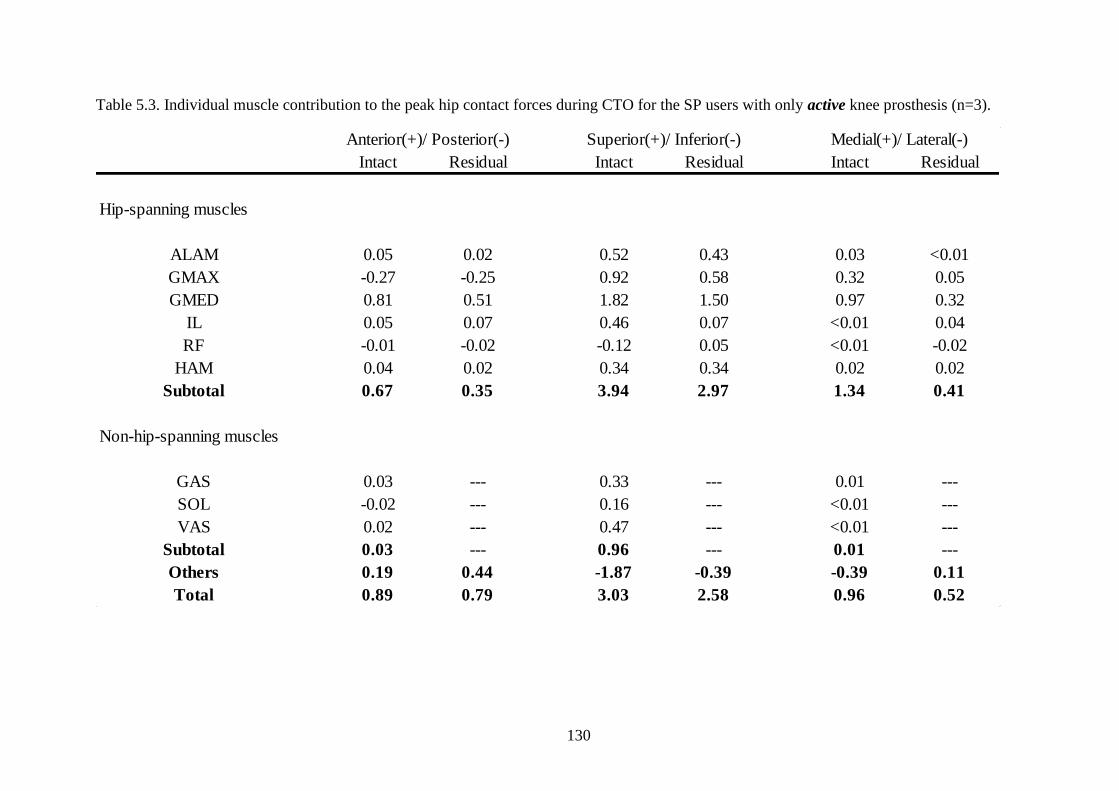
130
Table 5.3. Individual muscle contribution to the peak hip contact forces during CTO for the SP users with only active knee prosthesis (n=3).
Intact Residual Intact Residual Intact Residual
Hip-spanning muscles
ALAM 0.05 0.02 0.52 0.43 0.03 <0.01
GMAX -0.27 -0.25 0.92 0.58 0.32 0.05
GMED 0.81 0.51 1.82 1.50 0.97 0.32
IL 0.05 0.07 0.46 0.07 <0.01 0.04
RF -0.01 -0.02 -0.12 0.05 <0.01 -0.02
HAM 0.04 0.02 0.34 0.34 0.02 0.02
Subtotal 0.67 0.35 3.94 2.97 1.34 0.41
Non-hip-spanning muscles
GAS 0.03 --- 0.33 --- 0.01 ---
SOL -0.02 --- 0.16 --- <0.01 ---
VAS 0.02 --- 0.47 --- <0.01 ---
Subtotal 0.03 --- 0.96 --- 0.01 ---
Others 0.19 0.44 -1.87 -0.39 -0.39 0.11
Total 0.89 0.79 3.03 2.58 0.96 0.52
Anterior(+)/ Posterior(-) Superior(+)/ Inferior(-) Medial(+)/ Lateral(-)

131
Table 5.4. Individual muscle contribution to the peak hip contact forces during CHS for the SP users with only active knee prosthesis (n=3).
Intact Residual Intact Residual Intact Residual
Hip-spanning muscles
ALAM 0.16 0.04 0.55 0.41 0.05 0.02
GMAX -0.39 -0.34 0.79 0.75 0.13 0.06
GMED 0.22 0.23 1.51 1.43 0.39 0.33
IL 0.55 0.38 1.81 0.08 0.12 0.18
RF 0.11 0.02 0.73 0.15 0.02 0.01
HAM 0.15 0.05 0.51 0.31 0.05 0.02
Subtotal 0.80 0.38 5.90 3.13 0.76 0.62
Non-hip-spanning muscles
GAS 0.06 --- 0.29 --- 0.03 ---
SOL 0.06 --- -0.19 --- 0.01 ---
VAS 0.11 --- 0.41 --- 0.04 ---
Subtotal 0.23 --- 0.51 --- 0.08 ---
Others -0.16 0.47 -2.99 -0.15 0.02 0.29
Total 0.87 0.85 3.42 2.98 0.86 0.91
Anterior(+)/ Posterior(-) Superior(+)/ Inferior(-) Medial(+)/ Lateral(-)

132
Figure 5.5. Individual hip-spanning muscles to the three components of the hip contact forces for the SP users with only active knee prosthesis
(n=3). The vertical dashed and solid lines indicate contralateral toe-off and contralateral heel-strike, respectively. The shaded area represents the
total hip contact forces acting along the three coordinate directions.

133
Figure 5.6. Individual non-hip-spanning muscles to the three components of the hip contact forces for the SP users with only active knee prosthesis
(n=3). The vertical dashed and solid lines indicate contralateral toe-off and contralateral heel-strike, respectively. The shaded area represents the
total hip contact forces acting along the three coordinate directions.
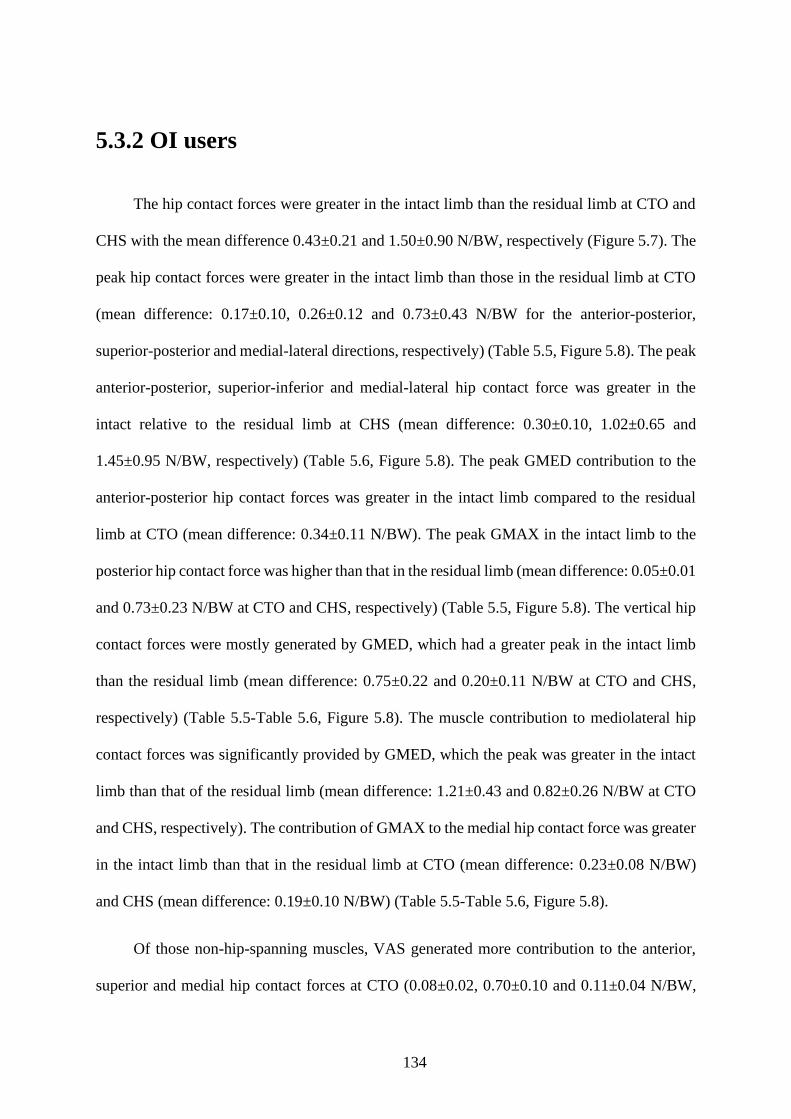
134
5.3.2 OI users
The hip contact forces were greater in the intact limb than the residual limb at CTO and
CHS with the mean difference 0.43±0.21 and 1.50±0.90 N/BW, respectively (Figure 5.7). The
peak hip contact forces were greater in the intact limb than those in the residual limb at CTO
(mean difference: 0.17±0.10, 0.26±0.12 and 0.73±0.43 N/BW for the anterior-posterior,
superior-posterior and medial-lateral directions, respectively) (Table 5.5, Figure 5.8). The peak
anterior-posterior, superior-inferior and medial-lateral hip contact force was greater in the
intact relative to the residual limb at CHS (mean difference: 0.30±0.10, 1.02±0.65 and
1.45±0.95 N/BW, respectively) (Table 5.6, Figure 5.8). The peak GMED contribution to the
anterior-posterior hip contact forces was greater in the intact limb compared to the residual
limb at CTO (mean difference: 0.34±0.11 N/BW). The peak GMAX in the intact limb to the
posterior hip contact force was higher than that in the residual limb (mean difference: 0.05±0.01
and 0.73±0.23 N/BW at CTO and CHS, respectively) (Table 5.5, Figure 5.8). The vertical hip
contact forces were mostly generated by GMED, which had a greater peak in the intact limb
than the residual limb (mean difference: 0.75±0.22 and 0.20±0.11 N/BW at CTO and CHS,
respectively) (Table 5.5-Table 5.6, Figure 5.8). The muscle contribution to mediolateral hip
contact forces was significantly provided by GMED, which the peak was greater in the intact
limb than that of the residual limb (mean difference: 1.21±0.43 and 0.82±0.26 N/BW at CTO
and CHS, respectively). The contribution of GMAX to the medial hip contact force was greater
in the intact limb than that in the residual limb at CTO (mean difference: 0.23±0.08 N/BW)
and CHS (mean difference: 0.19±0.10 N/BW) (Table 5.5-Table 5.6, Figure 5.8).
Of those non-hip-spanning muscles, VAS generated more contribution to the anterior,
superior and medial hip contact forces at CTO (0.08±0.02, 0.70±0.10 and 0.11±0.04 N/BW,
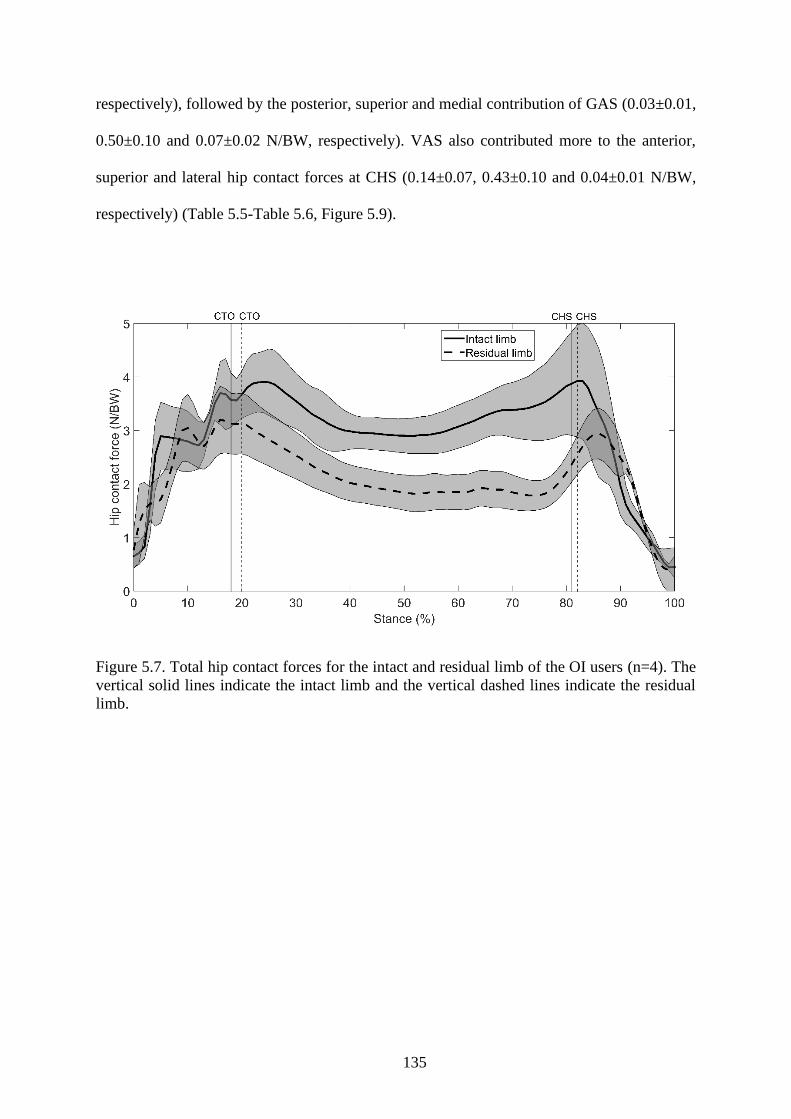
135
respectively), followed by the posterior, superior and medial contribution of GAS (0.03±0.01,
0.50±0.10 and 0.07±0.02 N/BW, respectively). VAS also contributed more to the anterior,
superior and lateral hip contact forces at CHS (0.14±0.07, 0.43±0.10 and 0.04±0.01 N/BW,
respectively) (Table 5.5-Table 5.6, Figure 5.9).
Figure 5.7. Total hip contact forces for the intact and residual limb of the OI users (n=4). The
vertical solid lines indicate the intact limb and the vertical dashed lines indicate the residual
limb.

136
Table 5.5. Individual muscle contribution to the peak hip contact forces during CTO for the OI users (n=4).
Intact Residual Intact Residual Intact Residual
Hip-spanning muscles
ALAM -0.08 -0.01 0.13 0.39 0.16 0.04
GMAX -0.23 -0.16 1.32 0.7 0.38 0.15
GMED 0.69 0.35 1.71 0.96 1.67 0.46
IL 0.18 0.13 0.04 -0.2 -0.06 0.05
RF -0.01 -0.01 -0.09 -0.04 0.03 -0.01
HAM -0.01 0.03 0.15 0.1 0.12 -0.03
Subtotal 0.54 0.33 3.25 1.9 2.29 0.67
Non-hip-spanning muscles
GAS -0.03 --- 0.5 --- 0.07 ---
SOL < 0.01 --- -0.25 --- 0.03 ---
VAS 0.08 --- 0.7 --- 0.11 ---
Subtotal 0.05 --- 0.95 --- 0.21 ---
Others 0.4 0.5 -1.08 0.96 -0.82 0.27
Total 0.99 0.82 3.12 2.86 1.67 0.94
Anterior(+)/ Posterior(-) Superior (+)/ Inferior(-) Medial(+)/ Lateral(-)

137
Table 5.6. Individual muscle contribution to the peak hip contact forces during CHS for the OI users (n=4).
Intact Residual Intact Residual Intact Residual
hip-spanning muscles
ALAM -0.08 -0.04 0.42 0.21 0.04 0.07
GMAX -0.83 -0.1 0.47 0.15 0.26 0.07
GMED 0.05 0.24 0.94 0.74 1.09 0.27
IL 0.82 -0.04 1.07 0.25 0.5 0.13
RF 0.09 0.01 0.56 -0.07 -0.01 < 0.01
HAM 0.13 0.15 0.52 0.33 -0.05 0.02
Subtotal 0.18 0.23 3.98 1.6 1.82 0.57
Non-hip-spanning muscles
GAS 0.04 --- 0.22 --- 0.01 ---
SOL 0.09 --- 0.23 --- -0.01 ---
VAS 0.14 --- 0.43 --- -0.04 ---
Subtotal 0.27 --- 0.89 --- -0.04 ---
Others 0.48 0.4 -1.58 0.67 -0.04 -0.29
Total 0.93 0.63 3.29 2.27 1.73 0.28
Anterior(+)/ Posterior(-) Superior(+)/ Inferior(-) Medial(+)/ Lateral(-)

138
Figure 5.8. Individual hip-spanning muscles to the three components of the hip contact forces for the OI users (n=4). The vertical dashed and solid
lines indicate contralateral toe-off and contralateral heel-strike, respectively. The shaded area represents the total hip contact forces acting along
the three coordinate directions.

139
Figure 5.9. Individual non-hip-spanning muscles to the three components of the hip contact forces for the OI (n=4). The vertical dashed and solid
lines indicate contralateral toe-off and contralateral heel-strike, respectively. The shaded area represents the total hip contact forces acting along
the three coordinate directions.
140
5.4 Discussion
This study aimed to employ three-dimensional musculoskeletal modelling to analyze the
individual muscle contribution to the hip contact forces in unilateral transfemoral amputees
fitted with socket (passive and active knee prosthesis) and osseointegration prosthesis. The
anterior-posterior, axial and medial-lateral hip contact forces were mostly generated by GMED
and GMAX in the intact and residual limb among the SP and OI users; however, the magnitudes
were greater in the intact limb than the residual limb.
The intact and residual limb resultant hip contact forces were in agreement with previous
studies in terms of shape and number of peaks (Bergmann et al., 2001, Correa et al., 2010). For
example, the model predicted two peaks in anterior-posterior, superior-inferior and
mediolateral hip contact forces during stance. The resultant peak hip contact forces of the intact
and residual limb were 3.83 and 2.92 N/BW for the SP users with passive knee, 3.30 and 2.75
N/BW for the SP users with active knee and 4.45 and 3.92 N/BW for the OI users, respectively.
This result may be due to the greater GRF on the intact limb than the residual limb, which is
consistent with previous studies (Silverman and Neptune, 2014). It might also be related to a
gait adaptation of the amputees in which a reduction in hip extension has been reported to lead
to decreased hip contact forces (Bennett et al., 2008, Beaulieu et al., 2010). As this study
showed, the hip extension of the residual limb was smaller than that in the intact limb for the
both SP and OI groups (Table 4.2-Table 4.7). Increase in the hip extension of the intact limb
relative to the residual limb may be related to an increase in the hip extension moment which
is consistent with previous studies (Sjödahl et al., 2003, Goujon-Pillet et al., 2008). This
difference in hip extension angle and moment has been demonstrated to generate different hip
contact forces (Wesseling et al., 2015).

141
The resultant peak hip contact forces in the intact limb of all the SP and OI users were
greater than what measured (2.4 N/BW) on patients implanted with hip replacement, who
walked at their normal speed (1.09 m/s); however, it was smaller than the peak hip contact
forces (4.8 N/BW) in the same group walking at their fast speed of 1.46 m/s. The reason might
be due to the relationship between the walking speed and joint contact forces. The hip contact
forces may reduce when the walking speed decreases (Bergmann et al., 1993, Bergmann et al.,
2001, Correa et al., 2010), which our results agreed with. The self-selected walking speed for
SP users with passive knee, SP users with active knee and OI users was 1.19 m/s, 1.12 m/s and
1.29 m/s, respectively.
The predominant contribution to hip contact forces for the two SP-user groups and the
OI users was mostly generated by the muscles crossing the hip joint in all three directions,
specifically GMAX, GMED and IL, which have been shown in previous studies (Correa et al.,
2010, Schache et al., 2018). GMED contributed anteriorly in both intact and residual limbs,
while GMAX had a posterior contribution during stance. GMED and GMAX were the major
contributors to the axial hip contact forces during the whole stance in the intact and the residual
limb. In addition, GMED contributed more to the mediolateral hip contact forces throughout
stance. Intact limb’s GMAX contributed medially in the first half of stance, while it contributed
to medial hip contact forces during the whole stance in the residual limb. Furthermore, IL
contributed more superiorly to hip contact forces in late-stance. However, peak contribution of
the hip muscles was higher in the intact limb than the residual limb. This increase might be
pertained to the greater intact limb muscles forces than those in the residual limb, which
resulted from higher intact limb’s hip moments due to an increase in hip extension and
adduction than that in the residual limb (Lenaerts et al., 2009, Lim et al., 2013, Valente et al.,
2013, Lin et al., 2015, Wesseling et al., 2015). It has also been indicated that reduction in hip
extension may be related to hip extensors weakness (Tranberg et al., 2011). In addition,

142
increasing in hip contact forces has been influenced by increase in hip abductors (Valente et
al., 2013, Wesseling et al., 2015). The increase in hip extension of the intact limb than the
residual limb would thereby support the evidence of increase in hip joint loading which leads
to anterior hip pain (Lewis et al., 2010). It also might be related to the longer stance phase of
the intact limb, which led to the dependency of the body on the intact limb and was confirmed
by greater GRFs of the intact limb to that of the residual limb (Nolan et al., 2003).
The muscles that did not cross the hip joint also had a considerable contribution to hip
contact forces. VAS, SOL and GAS showed two peaks in the first and second half of stance,
which is in contrast to previous healthy study showing one peak during stance (Correa et al.,
2010). VAS contributed more to anterior and superior hip contact forces, while SOL had a
greater contribution to anterior hip contact forces in mid-stance than the other two muscles. In
addition, VAS and GAS contributed more to medial hip contact forces in the first half of stance.
The contribution of ankle plantarflexors and knee extensors to hip contact forces is related to
dynamic coupling. All lower limb muscles contribute to accelerate the joints and due to the
relationship between angular acceleration of joints and joint contact forces, each muscle
contributes to all joints contact forces (Zajac and Gordon, 1989, Pandy, 2001, Correa et al.,
2010).
The prosthesis also contributed to the hip contact forces via coupling dynamic theory. It
contributed to the posterior and anterior hip contact forces in the first and second half of stance,
respectively for the three groups of the amputees (Figure 5.3, Figure 5.6, Figure 5.9).
Furthermore, the prosthesis was the major contributor to the superior component of the hip
contact forces during the whole stance. However, the prosthesis contribution to the medial-
lateral hip contact forces was different between amputees. The amputees showed lateral, medial
and lateral contribution of their prosthesis to hip contact forces during early-stance, mid-stance
and late-stance, respectively. In general, its function was similar to the overall role of the VAS,

143
SOL and GAS of the intact limb in superior and medial contribution to hip contact forces during
the entire stance.
The first limitation is that averaging the results may not be a proper way to conclude further
outcomes due to differences in knee types of the prostheses; however, the joints kinematics and
moments of the amputees showed no significant difference (Figure 4.12, Figure 4.13). Further
study is needed to individually consider different knee types in a broad range of amputees.
Another potential limitation is that the intrinsic properties of the residual limb muscles such as
atrophy and maximum isometric force were kept equal to what is in the intact limb’s muscles,
and this may affect the muscle forces calculation. Thirdly, neither muscles atrophy nor fatigue
considered in the objective function used to calculate muscle forces, which was based on
minimization of the sum of squared muscles activations. The fatigue-related cost functions may
be more suitable for gait analysis in disabled population (Ackermann and Van den Bogert,
2010). Finally, the knee joint of the residual limb was modeled as a hinge joint, which may not
be representative of an actual active knee joint of the prosthesis and may affect the muscle
forces results of the reattached muscles.
The current study indicated greater hip muscles forces as well as muscle contributions to
the hip contact forces of the intact than those in the residual limb of amputees. Increased hip
extension of the intact limb was pertained to increase in the intact limb hip muscles forces and
muscle contribution to hip contact forces. The overall trend of individual muscle contribution
to hip contact forces in the intact and the residual limb was similar in the SP and OI users;
however, the OI users showed less asymmetry in muscle contribution to hip contact forces
between the two limbs than the SP users. Figure 5.10 depicted that there was significant
difference (P=0.028) in hip contact impulse during stance phase between the intact and residual
limb when considering the effect of socket. But we did not find any significant difference in
hip contact impulse between the two limbs for the OI users (P=0.068). It should be mentioned

144
that the power of data is too small to do statistical analysis between the intact and residual limb
of the osseointegrated amputees. However, the outcome concludes that the osseointegration
surgery might result less risk of osteoarthritis in the hip of the intact limb. As shown in section
4.3.2, the joint kinematics’ magnitudes of the intact limb had a small difference compared to
those of the residual limb. In addition, people with active knee demonstrated small differences
in the hip angles between the two limbs if compared to the SP users with passive knee. The
result may be useful to devise new rehabilitation training programs and new prostheses to
improve their function.
Figure 5.10. Hip contact impulse between the intact and residual limb for SP and OI user

145
Summary and future work

146
The main focus of this thesis was to enhance understanding of the lower limb muscles
during walking in unilateral transfemoral amputees with socket and osseointegration
prosthesis. Firstly, a three-dimensional musculoskeletal modeling was developed in OpenSim
for amputees. Secondly, a computational and dynamical framework was used to investigate the
mechanism utilized by amputees. The results provided unique insight into the role of lower
extremity muscles to forward propulsion, body support and mediolateral balance. In addition,
the dynamic function of muscles to joint contact forces was investigated. This chapter outlines
a brief summary of findings, associated implications and possible future advancements based
on the limitations addressed in this thesis.
Computational and dynamical musculoskeletal frameworks have the potential to quantify
individual muscle behavior which are impossible to be experimentally measured during
walking such as muscle forces and muscle contribution. In Chapter 3, experimental data and
an advanced developed computer-based modeling was used to find walking mechanism
amongst transfemoral amputees. In this way, marker trajectories, ground reaction forces and
EMG data were simultaneously collected for three amputees fitted with socket with passive
knee joint, three amputees fitted with socket with active knee joint and four osseointegrated
amputees during their self-selected over-ground walking. A generic model was developed in
OpenSim for every single transfemoral amputee to individually simulate their walking and then
calculate lower extremity joint angles and joint moments through inverse kinematics and
inverse dynamics, respectively. The static optimization method was used to decompose joint
moments into individual muscle to generate forces. These forces then applied to calculate
muscle contribution to walking using induced acceleration analysis approach. Combined
muscle forces and muscle contribution to center of mass acceleration, individual muscle
contribution to joint contact forces were calculated for the amputees while walking.

147
Chapter 4 addressed the changes in lower limb spatiotemporal parameters, joint
kinematics and kinetics, muscle forces and muscle contribution to walking between the intact
and the residual limb for the three-group of amputees. The results showed that the intact limb
hip muscles contributed more to propulsion, support and mediolateral balance compared to
those of the residual limb. In general, the hip extension and abduction of the intact limb were
greater than the residual limb, which might be associated with increase in anterior pelvis tilt
when the residual limb was in stance compared to pelvis tilt when the intact limb was in stance.
The differences in hip movement between the intact and residual limb were found to relate to
the greater intact limb step length than that of the residual limb. However, the OI users showed
less asymmetry in joint kinematics between the two limbs, which might be pertained to the
direct attachment of the femur to the implant. The results also showed that the prosthesis
functioned as the major contributor to walking in the residual limb. VAS of the intact limb
contributed more to the fore-aft and vertical body center of mass acceleration in the first half
of stance than other intact limb’s muscles. Of the hip muscles, gluteal muscles were the main
contributors to the fore-aft and vertical body center of mass acceleration in early to mid-stance.
In addition, RF contributed more posterior and IL contributed more anterior than those of the
residual limb. One of the key findings of this study was differences in contribution of VAS,
SOL and GAS in the intact limb to mediolateral center of mass acceleration. The SP users
demonstrated medial contribution of these muscle which contrasted with their lateral
contribution in non-amputees from previous studies; however, SOL and GAS of the OI users
generated lateral contribution which was similar to non-amputees. This might be associated
with the greater step width and hip abduction in the intact limb compared to the residual limb.
Chapter 5 investigated individual muscle contribution to hip contact forces between the
intact and residual limb in the SP and OI users. Overall, the hip contact forces of the intact limb
were greater than the residual limb in all amputees. The resultant hip contact forces agreed with
148
previous studies in terms of shape and number of peaks. The resultant peak of the hip contact
forces of the intact limb was larger than that of the residual limb, which might be due to the
greater ground reaction forces of the intact limb compared to the residual limb. It also might
be due to walking mechanism of the amputees to reduce hip extension of the residual limb
which is relative to reduction in hip contact forces. Gluteal and iliopsoas muscles were found
major contributors to hip contact forces in both limbs. Gluteus maximus contributed to posterior
hip contact forces, while gluteus medius contributed anteriorly throughout stance phase. The
non-hip-spanning muscles and prosthesis also contributed to hip contact forces through
dynamic coupling approach.
There are several limitations of the present study. Firstly, since three amputees had
passive knee and the other three had active knee in their prosthesis, and different types of knee
may affect joint kinematics and kinetics, averaging the results for all the participants may not
be a proper way forward to show the muscle behaviors during walking. For example, amputees
with mechanical passive knee are required to lock their prosthetic knee in full extension for
stability during stance. It also requires to applying full body weight from stance stabilities
feature. While microprocessor-controlled knee prostheses are designed to reduce the need for
compensation of the intact limb's muscles. This might lead to differences in muscle recruitment.
To address this limitation, the muscle contributions for participants with active and passive
knee joints were also analyzed separately. Secondly, there was a lack of participants’
experience information. For example, the level of participant's satisfaction with their socket
were not scored, which may affect the results of gait asymmetries. Thirdly, the cost function
used in the static optimization problem minimized the sum of squares of muscle activations,
and this did not consider musculoskeletal conditions that are known to adversely affect joint
function in these subjects. For example, muscle fatigue frequently occurs in atrophied muscles
of lower limb amputees, and this may influence gait compensation strategies. Fourthly, residual

149
limb muscle-tendon parameters such as maximum isometric force as well as atrophy were not
considered in the musculoskeletal model, and this may ultimately result in larger muscle force
predictions. In addition, a rigid connection was assumed between the residual limb and the
socket due to the negligible deformation between the socket and stump, which need to be
considered in further studies. Furthermore, the use of inverse dynamics may be challenging to
calculate joint forces and moments. Further study is needed to consider direct measurement of
joint moments in prosthesis components. Finally, the low number of subjects recruited may not
be representative of the average data for a broad population of amputees and may affect
statistically the results. Although, the sample size was sufficient to detect significant
differences in spatiotemporal parameters and joint angles and joint moments between limbs, it
did not allow to consider difference in age and gender of participants.

150
References

151
ACKERMANN, M. & VAN DEN BOGERT, A. J. 2010. Optimality principles for model-based
prediction of human gait. Journal of biomechanics, 43, 1055-1060.
ACKLAND, D. C., LIN, Y.-C. & PANDY, M. G. 2012. Sensitivity of model predictions of muscle
function to changes in moment arms and muscle–tendon properties: a Monte-Carlo analysis.
Journal of biomechanics, 45, 1463-1471.
AIHWB 2014. Cardiovascular disease, diabetes and chronic kidney disease: Australian facts: morbidity
hospital care. Cardiovascular, diabetes and chronic kidney disease series no. 3. Cat. no. CDK
3. Canberra: AIHW.
AIT-HADDOU, R., BINDING, P. & HERZOG, W. 2000. Theoretical considerations on cocontraction
of sets of agonistic and antagonistic muscles. Journal of biomechanics, 33, 1105-1111.
AL MUDERIS, M. M., LU, W. Y., LI, J. J., KAUFMAN, K., ORENDURFF, M., HIGHSMITH, M. J.,
LUNSETH, P. A. & KAHLE, J. T. 2018. Clinically relevant outcome measures following limb
osseointegration; systematic review of the literature. Journal of orthopaedic trauma, 32, e64-
e75.
ALLEN, J. L. & NEPTUNE, R. R. 2012. Three-dimensional modular control of human walking.
Journal of biomechanics, 45, 2157-2163.
AMARO, A., AMADO, F., DUARTE, J. & APPELL, H.-J. 2007. Gluteus medius muscle atrophy is
related to contralateral and ipsilateral hip joint osteoarthritis. International Journal of Sports
Medicine, 28, 1035-1039.
ANDERSON, F. C. & PANDY, M. G. 1999. A dynamic optimization solution for vertical jumping in
three dimensions. Computer methods in biomechanics and biomedical engineering, 2, 201-231.
ANDERSON, F. C. & PANDY, M. G. 2001a. Dynamic optimization of human walking. Journal of
biomechanical engineering, 123, 381-390.
ANDERSON, F. C. & PANDY, M. G. 2001b. Static and dynamic optimization solutions for gait are
practically equivalent. Journal of biomechanics, 34, 153-161.
ANDERSON, F. C. & PANDY, M. G. 2003. Individual muscle contributions to support in normal
walking. Gait & posture, 17, 159-169.
BAE, T., CHOI, K. & MUN, M. 2009. Level walking and stair climbing gait in above-knee amputees.
Journal of medical engineering & technology, 33, 130-135.
BAE, T. S., CHOI, K., HONG, D. & MUN, M. 2007. Dynamic analysis of above-knee amputee gait.
Clinical Biomechanics, 22, 557-566.
BAHLER, A. S. 1968. Modeling of mammalian skeletal muscle. IEEE Transactions on Biomedical
Engineering, 249-257.
BEAULIEU, M. L., LAMONTAGNE, M. & BEAULÉ, P. E. 2010. Lower limb biomechanics during
gait do not return to normal following total hip arthroplasty. Gait & posture, 32, 269-273.
BENNETT, D., HUMPHREYS, L., O’BRIEN, S., KELLY, C., ORR, J. & BEVERLAND, D. 2008.
Gait kinematics of age-stratified hip replacement patients—a large scale, long-term follow-up
study. Gait & posture, 28, 194-200.
BERGMANN, G., DEURETZBACHER, G., HELLER, M., GRAICHEN, F., ROHLMANN, A.,
STRAUSS, J. & DUDA, G. 2001. Hip contact forces and gait patterns from routine activities.
Journal of biomechanics, 34, 859-871.
BERGMANN, G., GRAICHEN, F. & ROHLMANN, A. 1993. Hip joint loading during walking and
running, measured in two patients. Journal of biomechanics, 26, 969-990.
BERKE, G., BUELL, N., FERGASON, J., GAILEY, R., HAFNER, B., HUBBARD, S. &
WILLINGHAM, L. 2008. Transfemoral Amputation: The Basics and Beyond. Prosthetics
Research Study.
152
BOGEY, R., PERRY, J. & GITTER, A. 2005. An EMG-to-force processing approach for determining
ankle muscle forces during normal human gait. IEEE Transactions on Neural Systems and
Rehabilitation Engineering, 13, 302-310.
BONATO, P., ROY, S. H., KNAFLITZ, M. & DE LUCA, C. J. 2001. Time-frequency parameters of
the surface myoelectric signal for assessing muscle fatigue during cyclic dynamic contractions.
IEEE Transactions on Biomedical Engineering, 48, 745-753.
BOONSTRA, A., SCHRAMA, J., EISMA, W., HOF, A. & FIDLER, V. 1996. Gait analysis of
transfemoral amputee patients using prostheses with two different knee joints. Archives of
physical medicine and rehabilitation, 77, 515-520.
BRAND, R. A., PEDERSEN, D. R., DAVY, D. T., KOTZAR, G. M., HEIPLE, K. G. & GOLDBERG,
V. M. 1994. Comparison of hip force calculations and measurements in the same patient. The
Journal of arthroplasty, 9, 45-51.
BRÅNEMARK, R., BERLIN, Ö., HAGBERG, K., BERGH, P., GUNTERBERG, B. & RYDEVIK, B.
2014. A novel osseointegrated percutaneous prosthetic system for the treatment of patients with
transfemoral amputation: A prospective study of 51 patients. The bone & joint journal, 96, 106-
113.
BRANEMARK, R., BRANEMARK, P., RYDEVIK, B. & MYERS, R. R. 2001. Osseointegration in
skeletal reconstruction and rehabilitation: a review. Journal of rehabilitation research and
development, 38, 175-182.
BUCHANAN, T. S., LLOYD, D. G., MANAL, K. & BESIER, T. F. 2004. Neuromusculoskeletal
modeling: estimation of muscle forces and joint moments and movements from measurements
of neural command. Journal of applied biomechanics, 20, 367-395.
BUCHANAN, T. S., LLOYD, D. G., MANAL, K. & BESIER, T. F. 2005. Estimation of muscle forces
and joint moments using a forward-inverse dynamics model. Medicine & Science in Sports &
Exercise, 37, 1911-1916.
BURKETT, B., SMEATHERS, J. & BARKER, T. M. 2004. A computer model to simulate the swing
phase of a transfemoral prosthesis. Journal of Applied Biomechanics, 20, 25-37.
BUTLER, K., BOWEN, C., HUGHES, A.-M., TORAH, R., AYALA, I., TUDOR, J. & METCALF, C.
D. 2014. A systematic review of the key factors affecting tissue viability and rehabilitation
outcomes of the residual limb in lower extremity traumatic amputees. Journal of Tissue
Viability, 23, 81-93.
CAPPOZZO, A., FIGURA, F., GAZZANI, F., LEO, T. & MARCHETTI, M. 1982. Angular
displacements in the upper body of AK amputees during level walking. Prosthetics and
orthotics international, 6, 131-138.
CHUMANOV, E. S., HEIDERSCHEIT, B. C. & THELEN, D. G. 2011. Hamstring musculotendon
dynamics during stance and swing phases of high speed running. Medicine and science in sports
and exercise, 43, 525.
CLEATHER, D. J. & BULL, A. M. 2011. An optimization-based simultaneous approach to the
determination of muscular, ligamentous, and joint contact forces provides insight into
musculoligamentous interaction. Annals of biomedical engineering, 39, 1925-1934.
COLLINS, J. 1995. The redundant nature of locomotor optimization laws. Journal of biomechanics,
28, 251-267.
CORREA, T. A., CROSSLEY, K. M., KIM, H. J. & PANDY, M. G. 2010. Contributions of individual
muscles to hip joint contact force in normal walking. Journal of biomechanics, 43, 1618-1622.
CROWINSHIELD, R. D., BRAND, R. A. & JOHNSTON, R. 1978. The effects of walking velocity
and age on hip kinematics and kinetics. Clinical Orthopaedics and Related Research, 140-144.

153
CROWNINSHIELD, R., JOHNSTON, R., ANDREWS, J. & BRAND, R. 1978. A biomechanical
investigation of the human hip. Journal of biomechanics, 11, 75-85.
CROWNINSHIELD, R. D. & BRAND, R. A. 1981. A physiologically based criterion of muscle force
prediction in locomotion. Journal of biomechanics, 14, 793-801.
DAMM, P., SCHWACHMEYER, V., DYMKE, J., BENDER, A. & BERGMANN, G. 2013. In vivo
hip joint loads during three methods of walking with forearm crutches. Clinical Biomechanics,
28, 530-535.
DAVY, D. & AUDU, M. 1987. A dynamic optimization technique for predicting muscle forces in the
swing phase of gait. Journal of biomechanics, 20, 187-201.
DAVY, D., KOTZAR, G., BROWN, R., HEIPLE, K., GOLDBERG, V., HEIPLE, J. K., BERILLA, J.
& BURSTEIN, A. 1988. Telemetric force measurements across the hip after total arthroplasty.
The Journal of bone and joint surgery. American volume, 70, 45-50.
DE CERQUEIRA, A. S. O., YAMAGUTI, E. Y., MOCHIZUKI, L., AMADIO, A. C. & SERRÃO, J.
C. 2013. Ground reaction force and electromyographic activity of transfemoral amputee gait: a
case series. Brazilian Journal of Kinanthropometry and Human Performance, 15, 16-26.
DE LUCA, C. J. 1997. The use of surface electromyography in biomechanics. Journal of applied
biomechanics, 13, 135-163.
DEBAERE, S., DELECLUSE, C., AERENHOUTS, D., HAGMAN, F. & JONKERS, I. 2015. Control
of propulsion and body lift during the first two stances of sprint running: a simulation study.
Journal of sports sciences, 33, 2016-2024.
DELP, S. L., ANDERSON, F. C., ARNOLD, A. S., LOAN, P., HABIB, A., JOHN, C. T.,
GUENDELMAN, E. & THELEN, D. G. 2007. OpenSim: open-source software to create and
analyze dynamic simulations of movement. IEEE transactions on biomedical engineering, 54,
1940-1950.
DELP, S. L. & LOAN, J. P. 1995. A graphics-based software system to develop and analyze models of
musculoskeletal structures. Computers in biology and medicine, 25, 21-34.
DELP, S. L., LOAN, J. P., HOY, M. G., ZAJAC, F. E., TOPP, E. L. & ROSEN, J. M. 1990. An
interactive graphics-based model of the lower extremity to study orthopaedic surgical
procedures. Biomedical Engineering, IEEE Transactions on, 37, 757-767.
DEMET, K., MARTINET, N., GUILLEMIN, F., PAYSANT, J. & ANDRE, J.-M. 2003. Health related
quality of life and related factors in 539 persons with amputation of upper and lower limb.
Disability and rehabilitation, 25, 480-486.
DEVAN, H., HENDRICK, P., RIBEIRO, D. C., HALE, L. A. & CARMAN, A. 2014. Asymmetrical
movements of the lumbopelvic region: is this a potential mechanism for low back pain in people
with lower limb amputation? Medical hypotheses, 82, 77-85.
DILLINGHAM, T. R., PEZZIN, L. E. & SHORE, A. D. 2005. Reamputation, mortality, and health care
costs among persons with dysvascular lower-limb amputations. Archives of physical medicine
and rehabilitation, 86, 480-486.
DILLON, M. P., FORTINGTON, L. V., AKRAM, M., ERBAS, B. & KOHLER, F. 2017. Geographic
variation of the incidence rate of lower limb amputation in Australia from 2007-12. PloS one,
12, e0170705.
DORN, T. W. 2011. Computational modelling of lower-limb muscle function in human running.
DORN, T. W., LIN, Y.-C. & PANDY, M. G. 2012a. Estimates of muscle function in human gait depend
on how foot-ground contact is modelled. Computer methods in biomechanics and biomedical
engineering, 15, 657-668.

154
DORN, T. W., SCHACHE, A. G. & PANDY, M. G. 2012b. Muscular strategy shift in human running:
dependence of running speed on hip and ankle muscle performance. Journal of Experimental
Biology, 215, 1944-1956.
DUDEK, N. L., MARKS, M. B., MARSHALL, S. C. & CHARDON, J. P. 2005. Dermatologic
conditions associated with use of a lower-extremity prosthesis. Archives of physical medicine
and rehabilitation, 86, 659-663.
DUMAS, R., BRÅNEMARK, R. & FROSSARD, L. 2016. Gait analysis of transfemoral amputees:
errors in inverse dynamics are substantial and depend on prosthetic design. IEEE transactions
on neural systems and rehabilitation engineering, 25, 679-685.
DUMAS, R., CHEZE, L. & FROSSARD, L. A. 2009. Load during prosthetic gait: Is direct
measurement better than inverse dynamics?
EDWARDS, W. B., TAYLOR, D., RUDOLPHI, T. J., GILLETTE, J. C. & DERRICK, T. R. 2010.
Effects of running speed on a probabilistic stress fracture model. Clinical Biomechanics, 25,
372-377.
ERDEMIR, A., MCLEAN, S., HERZOG, W. & VAN DEN BOGERT, A. J. 2007. Model-based
estimation of muscle forces exerted during movements. Clinical biomechanics, 22, 131-154.
EWING, K. A., FERNANDEZ, J. W., BEGG, R. K., GALEA, M. P. & LEE, P. V. 2016. Prophylactic
knee bracing alters lower-limb muscle forces during a double-leg drop landing. Journal of
biomechanics, 49, 3347-3354.
FELSON, D. T. 2004. Obesity and vocational and avocational overload of the joint as risk factors for
osteoarthritis. The Journal of Rheumatology Supplement, 70, 2-5.
FELSON, D. T., ZHANG, Y., ANTHONY, J. M., NAIMARK, A. & ANDERSON, J. J. 1992. Weight
loss reduces the risk for symptomatic knee osteoarthritis in women: the Framingham Study.
Annals of internal medicine, 116, 535-539.
FERRIS, A. E., SMITH, J. D., HEISE, G. D., HINRICHS, R. N. & MARTIN, P. E. 2017. A general
model for estimating lower extremity inertial properties of individuals with transtibial
amputation. Journal of Biomechanics, 54, 44-48.
FOUCHER, K. C., HURWITZ, D. E. & WIMMER, M. A. 2009. Relative importance of gait vs. joint
positioning on hip contact forces after total hip replacement. Journal of Orthopaedic Research,
27, 1576-1582.
FREGLY, B. J., BESIER, T. F., LLOYD, D. G., DELP, S. L., BANKS, S. A., PANDY, M. G. &
D'LIMA, D. D. 2012. Grand challenge competition to predict in vivo knee loads. Journal of
Orthopaedic Research, 30, 503-513.
FRIEDERICH, J. A. & BRAND, R. A. 1990. Muscle fiber architecture in the human lower limb.
Journal of biomechanics, 23, 91-95.
FROSSARD, L. 2019. Loading characteristics data applied on osseointegrated implant by transfemoral
bone-anchored prostheses fitted with basic components during daily activities. Data in brief,
26, 104492.
FROSSARD, L., CHEZE, L. & DUMAS, R. 2011. Dynamic input to determine hip joint moments,
power and work on the prosthetic limb of transfemoral amputees: ground reaction vs knee
reaction. Prosthetics and Orthotics International, 35, 140-149.
FROSSARD, L., HAGBERG, K., HÄGGSTRÖM, E., GOW, D. L., BRÅNEMARK, R. & PEARCY,
M. 2010. Functional outcome of transfemoral amputees fitted with an osseointegrated fixation:
temporal gait characteristics. JPO: Journal of Prosthetics and Orthotics, 22, 11-20.
FROSSARD, L., LEECH, B. & PITKIN, M. 2019. Automated characterization of anthropomorphicity
of prosthetic feet fitted to bone-anchored transtibial prosthesis. IEEE Transactions on
Biomedical Engineering, 66, 3402-3410.

155
FROSSARD, L. A., HAGGSTROM, E., HAGBERG, K. & BRANEMARK, R. 2013. Load applied on
a bone-anchored transfemoral prosthesis: Characterisation of a prosthesis: A pilot study.
Journal of rehabilitation research and development, 50, 619-634.
FUKASHIRO, S., ROB, M., ICHINOSE, Y., KAWAKAMI, Y. & FUKUNAGA, T. 1995.
Ultrasonography gives directly but noninvasively elastic characteristic of human tendon in
vivo. European journal of applied physiology and occupational physiology, 71, 555-557.
GARD, S. A. 2006. Use of quantitative gait analysis for the evaluation of prosthetic walking
performance. JPO: Journal of Prosthetics and Orthotics, 18, P93-P104.
GENIN, J. J., BASTIEN, G. J., FRANCK, B., DETREMBLEUR, C. & WILLEMS, P. A. 2008. Effect
of speed on the energy cost of walking in unilateral traumatic lower limb amputees. European
journal of applied physiology, 103, 655.
GIARMATZIS, G., JONKERS, I., WESSELING, M., VAN ROSSOM, S. & VERSCHUEREN, S.
2015. Loading of hip measured by hip contact forces at different speeds of walking and running.
Journal of Bone and Mineral Research, 30, 1431-1440.
GOTTSCHALK, F. 1999. Transfemoral amputation: biomechanics and surgery. Clinical Orthopaedics
and Related Research®, 361, 15-22.
GOTTSCHALK, F. 2004. Transfemoral amputation: surgical management. Atlas of amputations and
limb deficiencies: surgical, prosthetic, and rehabilitation principles. 3rd ed. Rosemont, IL:
American Academy of Orthopaedic Surgeons, 533-40.
GOUJON-PILLET, H., SAPIN, E., FODÉ, P. & LAVASTE, F. 2008. Three-dimensional motions of
trunk and pelvis during transfemoral amputee gait. Archives of physical medicine and
rehabilitation, 89, 87-94.
HAGBERG, K. & BRÅNEMARK, R. 2001a. Consequences of non-vascular trans-femoral amputation:
a survey of quality of life, prosthetic use and problems. Prosthetics and orthotics international,
25, 186-194.
HAGBERG, K. & BRÅNEMARK, R. 2001b. Consequences of non‐vascular trans‐femoral amputation:
A survey of quality of life, prosthetic use and problems. Prosthetics and orthotics international,
25, 186-194.
HAGBERG, K., BRÅNEMARK, R. & HÄGG, O. 2004. Questionnaire for Persons with a Transfemoral
Amputation (Q-TFA): Initial validity and reliability of a new outcome measure. Journal of
Rehabilitation Research & Development, 41.
HAGBERG, K., HÄGGSTRÖM, E., UDEN, M. & BRÅNEMARK, R. 2005. Socket versus bone-
anchored trans-femoral prostheses: hip range of motion and sitting comfort. Prosthetics and
orthotics international, 29, 153-163.
HAGBERG, K., HANSSON, E. & BRÅNEMARK, R. 2014. Outcome of percutaneous osseointegrated
prostheses for patients with unilateral transfemoral amputation at two-year follow-up. Archives
of physical medicine and rehabilitation, 95, 2120-2127.
HAGGSTROM, E., HAGBERG, K., RYDEVIK, B. & BRANEMARK, R. 2013. Vibrotactile
evaluation: osseointegrated versus socket-suspended transfemoral prostheses. Journal of
Rehabilitation Research & Development, 50, 1423-1436.
HALL, A. L., PETERSON, C. L., KAUTZ, S. A. & NEPTUNE, R. R. 2011. Relationships between
muscle contributions to walking subtasks and functional walking status in persons with post-
stroke hemiparesis. Clinical biomechanics, 26, 509-515.
HAMMARLUND, C. S., CARLSTRÖM, M., MELCHIOR, R. & PERSSON, B. M. 2011. Prevalence
of back pain, its effect on functional ability and health-related quality of life in lower limb
amputees secondary to trauma or tumour: a comparison across three levels of amputation.
Prosthetics and orthotics international, 35, 97-105.

156
HAMNER, S. R. & DELP, S. L. 2013. Muscle contributions to fore-aft and vertical body mass center
accelerations over a range of running speeds. Journal of biomechanics, 46, 780-787.
HAMNER, S. R., SETH, A. & DELP, S. L. 2010. Muscle contributions to propulsion and support
during running. Journal of biomechanics, 43, 2709-2716.
HARANDI, V. J., ACKLAND, D. C., HADDARA, R., LIZAMA, L. E. C., GRAF, M., GALEA, M. P.
& LEE, P. V. S. 2020. Gait compensatory mechanisms in unilateral transfemoral amputees.
Medical Engineering & Physics.
HEINTZ, S. & GUTIERREZ-FAREWIK, E. M. 2007. Static optimization of muscle forces during gait
in comparison to EMG-to-force processing approach. Gait & posture, 26, 279-288.
HELLER, M., BERGMANN, G., DEURETZBACHER, G., DÜRSELEN, L., POHL, M., CLAES, L.,
HAAS, N. & DUDA, G. 2001. Musculo-skeletal loading conditions at the hip during walking
and stair climbing. Journal of biomechanics, 34, 883-893.
HERMENS, H. J., FRERIKS, B., DISSELHORST-KLUG, C. & RAU, G. 2000. Development of
recommendations for SEMG sensors and sensor placement procedures. Journal of
electromyography and Kinesiology, 10, 361-374.
HERMENS, H. J., FRERIKS, B., MERLETTI, R., STEGEMAN, D., BLOK, J., RAU, G.,
DISSELHORST-KLUG, C. & HÄGG, G. 1999. European recommendations for surface
electromyography. Roessingh research and development, 8, 13-54.
HERZOG, W., LONGINO, D. & CLARK, A. 2003. The role of muscles in joint adaptation and
degeneration. Langenbeck's Archives of Surgery, 388, 305-315.
HIGHSMITH, M. J., SCHULZ, B. W., HART-HUGHES, S., LATLIEF, G. A. & PHILLIPS, S. L.
2010. Differences in the spatiotemporal parameters of transtibial and transfemoral amputee
gait. JPO: Journal of Prosthetics and Orthotics, 22, 26-30.
HILL, A. V. 1938. The heat of shortening and the dynamic constants of muscle. Proceedings of the
Royal Society of London. Series B-Biological Sciences, 126, 136-195.
HILL, A. V. 1953. The mechanics of active muscle. Proceedings of the Royal Society of London. Series
B-Biological Sciences, 141, 104-117.
HOF, A. L., VAN BOCKEL, R. M., SCHOPPEN, T. & POSTEMA, K. 2007. Control of lateral balance
in walking: experimental findings in normal subjects and above-knee amputees. Gait & posture,
25, 250-258.
HOF, A. L. & VAN DEN BERG, J. 1981. EMG to force processing I: an electrical analogue of the Hill
muscle model. Journal of biomechanics, 14, 747-758.
HONG, J. H. & MUN, M. S. 2005. Relationship between socket pressure and EMG of two muscles in
trans-femoral stumps during gait. Prosthetics and orthotics international, 29, 59-72.
HUCH, K., KUETTNER, K. E. & DIEPPE, P. Osteoarthritis in ankle and knee joints. Seminars in
arthritis and rheumatism, 1997. Elsevier, 667-674.
HUNGERFORD, D. & COCKIN, J. 1975. Fate of the retained lower limb joints in Second World War
amputees. J Bone Joint Surg, 57, 111.
JACOBS, R., BRÅNEMARK, R., OLMARKER, K., RYDEVIK, B., STEENBERGHE, D. V. &
BRÅNEMARK, P. I. 2000. Evaluation of the psychophysical detection threshold level for
vibrotactile and pressure stimulation of prosthetic limbs using bone anchorage or soft tissue
support. Prosthetics and orthotics international, 24, 133-142.
JAEGERS, S. M., ARENDZEN, J. H. & DE JONGH, H. J. 1995a. Changes in hip muscles after above-
knee amputation. Clinical orthopaedics and related research, 319, 276-284.

157
JAEGERS, S. M., ARENDZEN, J. H. & DE JONGH, H. J. 1995b. Prosthetic gait of unilateral
transfemoral amputees: a kinematic study. Archives of physical medicine and rehabilitation,
76, 736-743.
JAEGERS, S. M., ARENDZEN, J. H. & DE JONGH, H. J. 1996. An electromyographic study of the
hip muscles of transfemoral amputees in walking. Clinical orthopaedics and related research,
328, 119-128.
JINHA, A., AIT-HADDOU, R., BINDING, P. & HERZOG, W. 2006. Antagonistic activity of one-
joint muscles in three-dimensions using non-linear optimisation. Mathematical biosciences,
202, 57-70.
KAUFMAN, K. R., FRITTOLI, S. & FRIGO, C. A. 2012. Gait asymmetry of transfemoral amputees
using mechanical and microprocessor-controlled prosthetic knees. Clinical Biomechanics, 27,
460-465.
KAUFMAN, K. R., LEVINE, J. A., BREY, R., IVERSON, B., MCCRADY, S., PADGETT, D. &
JOYNER, M. J. 2007. Gait and balance of transfemoral amputees using passive mechanical
and microprocessor-controlled prosthetic knees. Gait & posture, 26, 489-493.
KENNON, C. R. http://www.jisrf.org/osteointegration-implant-for-transfemoral-amputation.html.
KERRIGAN, D. C., TODD, M. K., DELLA CROCE, U., LIPSITZ, L. A. & COLLINS, J. J. 1998.
Biomechanical gait alterations independent of speed in the healthy elderly: evidence for specific
limiting impairments. Archives of physical medicine and rehabilitation, 79, 317-322.
KOMI, P., BELLI, A., HUTTUNEN, V., BONNEFOY, R., GEYSSANT, A. & LACOUR, J. 1996.
Optic fibre as a transducer of tendomuscular forces. European journal of applied physiology
and occupational physiology, 72, 278-280.
KOMI, P., SALONEN, M., JÄRVINEN, M. & KOKKO, O. 1987. In vivo registration of Achilles
tendon forces in man. International journal of sports medicine, 8, S3-S8.
KOMI, P. V. 2000. Stretch-shortening cycle: a powerful model to study normal and fatigued muscle.
Journal of biomechanics, 33, 1197-1206.
KOTZAR, G., DAVY, D., GOLDBERG, V., HEIPLE, K., BERILLA, J., HEIPLE JR, K., BROWN,
R. & BURSTEIN, A. 1991. Telemeterized in vivo hip joint force data: a report on two patients
after total hip surgery. Journal of Orthopaedic Research, 9, 621-633.
KRISTIANSLUND, E., KROSSHAUG, T. & VAN DEN BOGERT, A. J. 2012. Effect of low pass
filtering on joint moments from inverse dynamics: implications for injury prevention. Journal
of biomechanics, 45, 666-671.
KRISTIANSLUND, E., KROSSHAUG, T. & VAN DEN BOGERT, A. J. 2013. Artefacts in measuring
joint moments may lead to incorrect clinical conclusions: the nexus between science
(biomechanics) and sports injury prevention! : BMJ Publishing Group Ltd and British
Association of Sport and Exercise Medicine.
KULKARNI, J., ADAMS, J., THOMAS, E. & SILMAN, A. 1998. Association between amputation,
arthritis and osteopenia in British male war veterans with major lower limb amputations.
Clinical Rehabilitation, 12, 348-353.
KULKARNI, J., GAINE, W., BUCKLEY, J., RANKINE, J. & ADAMS, J. 2005. Chronic low back
pain in traumatic lower limb amputees. Clinical rehabilitation, 19, 81-86.
KUO, A. D. 1998. A least-squares estimation approach to improving the precision of inverse dynamics
computations. Journal of biomechanical engineering, 120, 148-159.
LAFEBER, F. P., INTEMA, F., VAN ROERMUND, P. M. & MARIJNISSEN, A. C. 2006. Unloading
joints to treat osteoarthritis, including joint distraction. Current opinion in rheumatology, 18,
519-525.

158
LEIJENDEKKERS, R. A., VAN HINTE, G., FRÖLKE, J. P., VAN DE MEENT, H., NIJHUIS-VAN
DER SANDEN, M. W. & STAAL, J. B. 2017. Comparison of bone-anchored prostheses and
socket prostheses for patients with a lower extremity amputation: a systematic review.
Disability and rehabilitation, 39, 1045-1058.
LEMAIRE, E. D. & FISHER, F. R. 1994. Osteoarthritis and elderly amputee gait. Archives of physical
medicine and rehabilitation, 75, 1094-1099.
LENAERTS, G., MULIER, M., SPAEPEN, A., VAN DER PERRE, G. & JONKERS, I. 2009. Aberrant
pelvis and hip kinematics impair hip loading before and after total hip replacement. Gait &
posture, 30, 296-302.
LEWIS, C. L., SAHRMANN, S. A. & MORAN, D. W. 2007. Anterior hip joint force increases with
hip extension, decreased gluteal force, or decreased iliopsoas force. Journal of biomechanics,
40, 3725-3731.
LEWIS, C. L., SAHRMANN, S. A. & MORAN, D. W. 2010. Effect of hip angle on anterior hip joint
force during gait. Gait & posture, 32, 603-607.
LI, K., ACKLAND, D. C., MCCLELLAND, J. A., WEBSTER, K. E., FELLER, J. A., DE STEIGER,
R. & PANDY, M. G. 2013. Trunk muscle action compensates for reduced quadriceps force
during walking after total knee arthroplasty. Gait & posture, 38, 79-85.
LIM, Y. P., LIN, Y.-C. & PANDY, M. G. 2013. Muscle function during gait is invariant to age when
walking speed is controlled. Gait & posture, 38, 253-259.
LIN, Y.-C., DORN, T. W., SCHACHE, A. G. & PANDY, M. G. 2012. Comparison of different methods
for estimating muscle forces in human movement. Proceedings of the Institution of Mechanical
Engineers, Part H: Journal of Engineering in Medicine, 226, 103-112.
LIN, Y.-C., FOK, L. A., SCHACHE, A. G. & PANDY, M. G. 2015. Muscle coordination of support,
progression and balance during stair ambulation. Journal of biomechanics, 48, 340-347.
LIN, Y. C., KIM, H. J. & PANDY, M. G. 2011. A computationally efficient method for assessing
muscle function during human locomotion. International Journal for Numerical Methods in
Biomedical Engineering, 27, 436-449.
LIU, M. Q., ANDERSON, F. C., PANDY, M. G. & DELP, S. L. 2006. Muscles that support the body
also modulate forward progression during walking. Journal of biomechanics, 39, 2623-2630.
LIU, M. Q., ANDERSON, F. C., SCHWARTZ, M. H. & DELP, S. L. 2008. Muscle contributions to
support and progression over a range of walking speeds. Journal of biomechanics, 41, 3243-
3252.
LLOYD, D. G. & BESIER, T. F. 2003. An EMG-driven musculoskeletal model to estimate muscle
forces and knee joint moments in vivo. Journal of biomechanics, 36, 765-776.
LU, T.-W. & O’CONNOR, J. 1999. Bone position estimation from skin marker co-ordinates using
global optimisation with joint constraints. Journal of biomechanics, 32, 129-134.
MADSEN, M. S., RITTER, M. A., MORRIS, H. H., MEDING, J. B., BEREND, M. E., FARIS, P. M.
& VARDAXIS, V. G. 2004. The effect of total hip arthroplasty surgical approach on gait.
Journal of orthopaedic research, 22, 44-50.
MATSUMOTO, M. E., CZERNIECKI, J. M., SHAKIR, A., SURI, P., ORENDURFF, M. &
MORGENROTH, D. C. 2018. The relationship between lumbar lordosis angle and low back
pain in individuals with transfemoral amputation. Prosthetics and orthotics international,
0309364618792746.
MATTES, S. J., MARTIN, P. E. & ROYER, T. D. 2000. Walking symmetry and energy cost in persons
with unilateral transtibial amputations: matching prosthetic and intact limb inertial properties.
Archives of physical medicine and rehabilitation, 81, 561-568.
159
MCGOWAN, C., KRAM, R. & NEPTUNE, R. 2009. Modulation of leg muscle function in response
to altered demand for body support and forward propulsion during walking. Journal of
biomechanics, 42, 850-856.
MELZER, I., YEKUTIEL, M. & SUKENIK, S. 2001. Comparative study of osteoarthritis of the
contralateral knee joint of male amputees who do and do not play volleyball. The Journal of
rheumatology, 28, 169-172.
MESSIER, S. P., GUTEKUNST, D. J., DAVIS, C. & DEVITA, P. 2005. Weight loss reduces knee‐joint loads in overweight and obese older adults with knee osteoarthritis. Arthritis &
Rheumatism, 52, 2026-2032.
MEULENBELT, H. E., GEERTZEN, J. H., JONKMAN, M. F. & DIJKSTRA, P. U. 2009.
Determinants of skin problems of the stump in lower-limb amputees. Archives of physical
medicine and rehabilitation, 90, 74-81.
MEULENBELT, H. E., GEERTZEN, J. H., JONKMAN, M. F. & DIJKSTRA, P. U. 2011. Skin
problems of the stump in lower limb amputees: 1. A clinical study. Acta dermato-
venereologica, 91, 173-177.
MOIRENFELD, I., AYALON, M., BEN-SIRA, D. & ISAKOV, E. 2000. Isokinetic strength and
endurance of the knee extensors and flexors in trans-tibial amputees. Prosthetics and orthotics
international, 24, 221-225.
MOKHTARZADEH, H., PERRATON, L., FOK, L., MUÑOZ, M. A., CLARK, R., PIVONKA, P. &
BRYANT, A. L. 2014. A comparison of optimisation methods and knee joint degrees of
freedom on muscle force predictions during single-leg hop landings. Journal of biomechanics,
47, 2863-2868.
MOKHTARZADEH, H., YEOW, C. H., GOH, J. C. H., OETOMO, D., MALEKIPOUR, F. & LEE, P.
V.-S. 2013. Contributions of the soleus and gastrocnemius muscles to the anterior cruciate
ligament loading during single-leg landing. Journal of biomechanics, 46, 1913-1920.
MORGENROTH, D. C., GELLHORN, A. C. & SURI, P. 2012. Osteoarthritis in the disabled
population: a mechanical perspective. PM&R, 4, S20-S27.
MORGENROTH, D. C., ORENDURFF, M. S., SHAKIR, A., SEGAL, A., SHOFER, J. &
CZERNIECKI, J. M. 2010. The relationship between lumbar spine kinematics during gait and
low-back pain in transfemoral amputees. American Journal of Physical Medicine &
Rehabilitation, 89, 635-643.
MORGENROTH, D. C., SHAKIR, A., ORENDURFF, M. S. & CZERNIECKI, J. M. 2009. Low-back
pain in transfemoral amputees: is there a correlation with static or dynamic leg-length
discrepancy? American journal of physical medicine & rehabilitation, 88, 108-113.
MOVEFORWARDDPT http://www.jisrf.org/osteointegration-implant-for-transfemoral-amputation.
MOXEY, P., HOFMAN, D., HINCHLIFFE, R., JONES, K., THOMPSON, M. & HOLT, P. 2010.
Epidemiological study of lower limb amputation in England between 2003 and 2008. British
journal of surgery, 97, 1348-1353.
MPHTY, H. D. 2012. Physical activity and lower-back pain in persons with traumatic transfemoral
amputation: a national cross-sectional survey. Journal of rehabilitation research and
development, 49, 1457.
MUNGIOLE, M. & MARTIN, P. E. 1990. Estimating segment inertial properties: comparison of
magnetic resonance imaging with existing methods. Journal of Biomechanics, 23, 1039-1046.
NARANG, Y. S., ARELEKATTI, V. M. & WINTER, A. G. 2015. The effects of prosthesis inertial
properties on prosthetic knee moment and hip energetics required to achieve able-bodied
kinematics. IEEE Transactions on Neural Systems and Rehabilitation Engineering, 24, 754-
763.

160
NELSON, R. G., GOHDES, D. M., EVERHART, J. E., HARTNER, J. A., ZWEMER, F. L., PETTITT,
D. J. & KNOWLER, W. C. 1988. Lower-extremity amputations in NIDDM: 12-yr follow-up
study in Pima Indians. Diabetes care, 11, 8-16.
NEPTUNE, R. & HULL, M. 1998. Evaluation of performance criteria for simulation of submaximal
steady-state cycling using a forward dynamic model. Journal of Biomechanical Engineering,
120, 334-341.
NEPTUNE, R., KAUTZ, S. & ZAJAC, F. 2001. Contributions of the individual ankle plantar flexors
to support, forward progression and swing initiation during walking. Journal of biomechanics,
34, 1387-1398.
NEPTUNE, R., ZAJAC, F. & KAUTZ, S. 2004. Muscle force redistributes segmental power for body
progression during walking. Gait & posture, 19, 194-205.
NOLAN, L. & LEES, A. 2000. The functional demands on the intact limb during walking for active
trans‐femoral and trans‐tibial amputees. Prosthetics and orthotics international, 24, 117-125.
NOLAN, L., WIT, A., DUDZIÑSKI, K., LEES, A., LAKE, M. & WYCHOWAÑSKI, M. 2003.
Adjustments in gait symmetry with walking speed in trans-femoral and trans-tibial amputees.
Gait & posture, 17, 142-151.
NORVELL, D. C., CZERNIECKI, J. M., REIBER, G. E., MAYNARD, C., PECORARO, J. A. &
WEISS, N. S. 2005. The prevalence of knee pain and symptomatic knee osteoarthritis among
veteran traumatic amputees and nonamputees. Archives of physical medicine and
rehabilitation, 86, 487-493.
OKITA, Y., YAMASAKI, N., NAKAMURA, T., KUBO, T., MITSUMOTO, A. & AKUNE, T. 2018.
Kinetic differences between level walking and ramp descent in individuals with unilateral
transfemoral amputation using a prosthetic knee without a stance control mechanism. Gait &
Posture, 63, 80-85.
OTTOBOCK https://www.ottobock.in/prosthetics/information-for-amputees.
PANDY, M., GARNER, B. & ANDERSON, F. 1995. Optimal control of non-ballistic muscular
movements: a constraint-based performance criterion for rising from a chair. Journal of
biomechanical engineering, 117, 15-26.
PANDY, M. G. 2001. Computer modeling and simulation of human movement. Annual review of
biomedical engineering, 3, 245-273.
PANDY, M. G. & ANDRIACCHI, T. P. 2010. Muscle and joint function in human locomotion. Annual
review of biomedical engineering, 12, 401-433.
PANDY, M. G., LIN, Y.-C. & KIM, H. J. 2010. Muscle coordination of mediolateral balance in normal
walking. Journal of biomechanics, 43, 2055-2064.
PANTALL, A. & EWINS, D. 2013. Muscle activity during stance phase of walking: Comparison of
males with transfemoral amputation with osseointegrated fixations to nondisabled male
volunteers. J Rehabil Res Dev, 50, 499-514.
PEJHAN, S., FARAHMAND, F. & PARNIANPOUR, M. Design optimization of an above-knee
prosthesis based on the kinematics of gait. 2008 30th Annual International Conference of the
IEEE Engineering in Medicine and Biology Society, 2008. IEEE, 4274-4277.
PETERSON, C. L., HALL, A. L., KAUTZ, S. A. & NEPTUNE, R. R. 2010. Pre-swing deficits in
forward propulsion, swing initiation and power generation by individual muscles during
hemiparetic walking. Journal of biomechanics, 43, 2348-2355.
PEZZIN, L. E., DILLINGHAM, T. R. & MACKENZIE, E. J. 2000. Rehabilitation and the long-term
outcomes of persons with trauma-related amputations. Archives of physical medicine and
rehabilitation, 81, 292-300.

161
PEZZIN, L. E., DILLINGHAM, T. R., MACKENZIE, E. J., EPHRAIM, P. & ROSSBACH, P. 2004a.
Use and satisfaction with prosthetic limb devices and related services. Archives of physical
medicine and rehabilitation, 85, 723-729.
PEZZIN, L. E., DILLINGHAM, T. R., MACKENZIE, E. J., EPHRAIM, P. & ROSSBACH, P. 2004b.
Use and satisfaction with prosthetic limb devices and related services 1. Archives of physical
medicine and rehabilitation, 85, 723-729.
PICKLE, N. T., GRABOWSKI, A. M., AUYANG, A. G. & SILVERMAN, A. K. 2016. The functional
roles of muscles during sloped walking. Journal of biomechanics, 49, 3244-3251.
PINARD, V. & FROSSARD, L. 2012. Spatio-temporal characteristics of locomotion and functional
outcomes of individuals with transfemoral amputation fitted with OPRA fixation.
PRINSEN, E. C., NEDERHAND, M. J. & RIETMAN, J. S. 2011. Adaptation strategies of the lower
extremities of patients with a transtibial or transfemoral amputation during level walking: a
systematic review. Archives of physical medicine and rehabilitation, 92, 1311-1325.
RABUFFETTI, M., RECALCATI, M. & FERRARIN, M. 2005. Trans-femoral amputee gait: Socket–
pelvis constraints and compensation strategies. Prosthetics and orthotics international, 29, 183-
192.
RADIN, E., BURR, D., CATERSON, B., FYHRIE, D., BROWN, T. & BOYD, R. Mechanical
determinants of osteoarthrosis. Seminars in arthritis and rheumatism, 1991. Elsevier, 12-21.
RANZ, E. C. 2016. Mobility in individuals with traumatic lower-limb injuries: implications for device
design, surgical intervention and rehabilitation therapies.
RANZ, E. C., WILKEN, J. M., GAJEWSKI, D. A. & NEPTUNE, R. R. 2017. The influence of limb
alignment and transfemoral amputation technique on muscle capacity during gait. Computer
methods in BiomeChaniCs and BiomediCal engineering, 20, 1167-1174.
RASMUSSEN, J., DAMSGAARD, M. & VOIGT, M. 2001. Muscle recruitment by the min/max
criterion—a comparative numerical study. Journal of biomechanics, 34, 409-415.
READ, L. & NIGG, B. 1999. An analysis of hip joint loading during walking, running, and skiing.
Medicine and science in sports and exercise, 31, 131-142.
REMY, C. D. & THELEN, D. G. 2009. Optimal estimation of dynamically consistent kinematics and
kinetics for forward dynamic simulation of gait. Journal of biomechanical engineering, 131,
031005.
RENSTRÖM, P., GRIMBY, G. & LARSSON, E. 1983. Thigh muscle strength in below-knee amputees.
Scandinavian journal of rehabilitation medicine. Supplement, 9, 163-173.
ROBBINS, S., WAKED, E. & KROUGLICOF, N. 2001. Vertical impact increase in middle age may
explain idiopathic weight-bearing joint osteoarthritis. Archives of physical medicine and
rehabilitation, 82, 1673-1677.
ROBINSON, D. L., SAFAI, L., HARANDI, V. J., GRAF, M., LIZAMA, L. E. C., LEE, P., GALEA,
M. P., KHAN, F., TSE, K. M. & ACKLAND, D. C. 2020. Load response of an osseointegrated
implant used in the treatment of unilateral transfemoral amputation: An early implant loosening
case study. Clinical Biomechanics, 73, 201-212.
RÖHRLE, H., SCHOLTEN, R., SIGOLOTTO, C., SOLLBACH, W. & KELLNER, H. 1984. Joint
forces in the human pelvis-leg skeleton during walking. Journal of biomechanics, 17, 409-424.
ROMMERS, G., VOS, L., GROOTHOFF, J. & EISMA, W. 1996. Clinical rehabilitation of the
amputee: a retrospective study. Prosthetics and orthotics international, 20, 72-78.
RYDELL, N. W. 1966. Forces acting on the femoral head-prosthesis: a study on strain gauge supplied
prostheses in living persons. Acta Orthopaedica Scandinavica, 37, 1-132.

162
SARTORI, M., REGGIANI, M., FARINA, D. & LLOYD, D. G. 2012. EMG-driven forward-dynamic
estimation of muscle force and joint moment about multiple degrees of freedom in the human
lower extremity. PloS one, 7, e52618.
SASAKI, K. & NEPTUNE, R. R. 2010. Individual muscle contributions to the axial knee joint contact
force during normal walking. Journal of biomechanics, 43, 2780-2784.
SAWICKI, G. S. & FERRIS, D. P. 2009. Powered ankle exoskeletons reveal the metabolic cost of
plantar flexor mechanical work during walking with longer steps at constant step frequency.
Journal of Experimental Biology, 212, 21-31.
SCHAARSCHMIDT, M., LIPFERT, S. W., MEIER-GRATZ, C., SCHOLLE, H.-C. & SEYFARTH,
A. 2012. Functional gait asymmetry of unilateral transfemoral amputees. Human movement
science, 31, 907-917.
SCHACHE, A. G., BLANCH, P. D., DORN, T. W., BROWN, N. A., ROSEMOND, D. & PANDY, M.
G. 2011. Effect of running speed on lower limb joint kinetics. Medicine & Science in Sports &
Exercise, 43, 1260-1271.
SCHACHE, A. G., LIN, Y.-C., CROSSLEY, K. M. & PANDY, M. G. 2018. Is Running Better than
Walking for Reducing Hip Joint Loads? Medicine and science in sports and exercise, 50, 2301-
2310.
SEGAL, A. D., ORENDURFF, M. S., KLUTE, G. K. & MCDOWELL, M. L. 2006. Kinematic and
kinetic comparisons of transfemoral amputee gait using C-Leg® and Mauch SNS® prosthetic
knees. Journal of rehabilitation research and development, 43, 857.
SEROUSSI, R. E., GITTER, A., CZERNIECKI, J. M. & WEAVER, K. 1996. Mechanical work
adaptations of above-knee amputee ambulation. Archives of physical medicine and
rehabilitation, 77, 1209-1214.
SETH, A. & PANDY, M. G. 2007. A neuromusculoskeletal tracking method for estimating individual
muscle forces in human movement. Journal of biomechanics, 40, 356-366.
SHANDIZ, M. A., FARAHMAND, F., OSMAN, N. A. A. & ZOHOOR, H. 2013. A robotic model of
transfemoral amputee locomotion for design optimization of knee controllers. International
Journal of Advanced Robotic Systems, 10, 161.
SHAO, Q., BASSETT, D. N., MANAL, K. & BUCHANAN, T. S. 2009. An EMG-driven model to
estimate muscle forces and joint moments in stroke patients. Computers in biology and
medicine, 39, 1083-1088.
SILVERMAN, A. K. & NEPTUNE, R. R. Individual muscle function in below Knee amputee walking.
Conference Proceedings of the Annual Meeting of the American Society, 2010. 166.
SILVERMAN, A. K. & NEPTUNE, R. R. 2012. Muscle and prosthesis contributions to amputee
walking mechanics: a modeling study. Journal of biomechanics, 45, 2271-2278.
SILVERMAN, A. K. & NEPTUNE, R. R. 2014. Three-dimensional knee joint contact forces during
walking in unilateral transtibial amputees. Journal of biomechanics, 47, 2556-2562.
SJÖDAHL, C., JARNLO, G.-B., SÖDERBERG, B. & PERSSON, B. 2002. Kinematic and kinetic gait
analysis in the sagittal plane of trans-femoral amputees before and after special gait re-
education. Prosthetics and orthotics international, 26, 101-112.
SJÖDAHL, C., JARNLO, G. B., SÖDERBERG, B. & PERSSON, B. 2003. Pelvic motion in trans‐femoral amputees in the frontal and transverse plane before and after special gait re‐education.
Prosthetics and orthotics international, 27, 227-237.
SMITH, J. D., FERRIS, A. E., HEISE, G. D., HINRICHS, R. N. & MARTIN, P. E. 2014. Oscillation
and reaction board techniques for estimating inertial properties of a below-knee prosthesis.
Journal of visualized experiments: JoVE.
163
STANSFIELD, B. & NICOL, A. 2002. Hip joint contact forces in normal subjects and subjects with
total hip prostheses: walking and stair and ramp negotiation. Clinical Biomechanics, 17, 130-
139.
STANSFIELD, B., NICOL, A., PAUL, J., KELLY, I., GRAICHEN, F. & BERGMANN, G. 2003.
Direct comparison of calculated hip joint contact forces with those measured using
instrumented implants. An evaluation of a three-dimensional mathematical model of the lower
limb. Journal of biomechanics, 36, 929-936.
STEELE, K. M., DEMERS, M. S., SCHWARTZ, M. H. & DELP, S. L. 2012a. Compressive
tibiofemoral force during crouch gait. Gait & posture, 35, 556-560.
STEELE, K. M., SETH, A., HICKS, J. L., SCHWARTZ, M. S. & DELP, S. L. 2010. Muscle
contributions to support and progression during single-limb stance in crouch gait. Journal of
biomechanics, 43, 2099-2105.
STEELE, K. M., VAN DER KROGT, M. M., SCHWARTZ, M. H. & DELP, S. L. 2012b. How much
muscle strength is required to walk in a crouch gait? Journal of biomechanics, 45, 2564-2569.
STRUYF, P. A., VAN HEUGTEN, C. M., HITTERS, M. W. & SMEETS, R. J. 2009. The prevalence
of osteoarthritis of the intact hip and knee among traumatic leg amputees. Archives of physical
medicine and rehabilitation, 90, 440-446.
SUZUKI, Y. 2010. Dynamic optimization of transfemoral prosthesis during swing phase with residual
limb model. Prosthetics and Orthotics International, 34, 428-438.
THELEN, D. G. 2003. Adjustment of muscle mechanics model parameters to simulate dynamic
contractions in older adults. Journal of biomechanical engineering, 125, 70-77.
THELEN, D. G. & ANDERSON, F. C. 2006. Using computed muscle control to generate forward
dynamic simulations of human walking from experimental data. Journal of biomechanics, 39,
1107-1115.
THELEN, D. G., ANDERSON, F. C. & DELP, S. L. 2003. Generating dynamic simulations of
movement using computed muscle control. Journal of biomechanics, 36, 321-328.
TINTLE, S. M., AGNER FORSBERG, J., KEELING, J. J., SHAWEN, S. B. & KYLE POTTER, B.
2010. Lower extremity combat-related amputations. Journal of surgical orthopaedic advances,
19, 35.
TRANBERG, R., ZÜGNER, R. & KÄRRHOLM, J. 2011. Improvements in hip-and pelvic motion for
patients with osseointegrated trans-femoral prostheses. Gait & posture, 33, 165-168.
TSAOPOULOS, D. E., MAGANARIS, C. N. & BALTZOPOULOS, V. 2007. Can the patellar tendon
moment arm be predicted from anthropometric measurements? Journal of Biomechanics, 40,
645-651.
VALENTE, G., TADDEI, F. & JONKERS, I. 2013. Influence of weak hip abductor muscles on joint
contact forces during normal walking: probabilistic modeling analysis. Journal of
biomechanics, 46, 2186-2193.
VAN DE MEENT, H., HOPMAN, M. T. & FRÖLKE, J. P. 2013. Walking ability and quality of life in
subjects with transfemoral amputation: a comparison of osseointegration with socket
prostheses. Archives of physical medicine and rehabilitation, 94, 2174-2178.
VAUGHAN, C. L., DAVIS, B. L. & O'CONNOR, J. C. 1992. Dynamics of human gait, Human Kinetics
Publishers Champaign, Illinois.
VENTURA, J. D., KLUTE, G. K. & NEPTUNE, R. R. 2015. Individual muscle contributions to circular
turning mechanics. Journal of biomechanics, 48, 1067-1074.
WARD, S. R., ENG, C. M., SMALLWOOD, L. H. & LIEBER, R. L. 2009. Are current measurements
of lower extremity muscle architecture accurate? Clinical orthopaedics and related research,
467, 1074-1082.

164
WELKE, B., JAKUBOWITZ, E., SEEHAUS, F., DANIILIDIS, K., TIMPNER, M., TREMER, N.,
HURSCHLER, C. & SCHWARZE, M. 2019. The prevalence of osteoarthritis: Higher risk after
transfemoral amputation?—A database analysis with 1,569 amputees and matched controls.
PloS one, 14, e0210868.
WENTINK, E. C., PRINSEN, E. C., RIETMAN, J. S. & VELTINK, P. H. 2013. Comparison of muscle
activity patterns of transfemoral amputees and control subjects during walking. Journal of
neuroengineering and rehabilitation, 10, 1.
WESSELING, M., DE GROOTE, F., MEYER, C., CORTEN, K., SIMON, J. P., DESLOOVERE, K.
& JONKERS, I. 2015. Gait alterations to effectively reduce hip contact forces. Journal of
Orthopaedic Research, 33, 1094-1102.
WICKIEWICZ, T. L., ROY, R. R., POWELL, P. L. & EDGERTON, V. R. 1983. Muscle architecture
of the human lower limb. Clinical orthopaedics and related research, 275-283.
WINTER, D. A. 2009. Biomechanics and motor control of human movement, John Wiley & Sons.
WRETENBERG, P., NÉMETH, G., LAMONTAGNE, M. & LUNDIN, B. 1996. Passive knee muscle
moment arms measured in vivo with MRI. Clinical Biomechanics, 11, 439-446.
ZAJAC, F. E. 1989. Muscle and tendon Properties models scaling and application to biomechanics and
motor. Critical reviews in biomedical engineering, 17, 359-411.
ZAJAC, F. E. 2002. Understanding muscle coordination of the human leg with dynamical simulations.
Journal of biomechanics, 35, 1011-1018.
ZAJAC, F. E. & GORDON, M. E. 1989. Determining muscle's force and action in multi-articular
movement. Exercise and sport sciences reviews, 17, 187-230.
ZAJAC, F. E., NEPTUNE, R. R. & KAUTZ, S. A. 2002. Biomechanics and muscle coordination of
human walking: Part I: Introduction to concepts, power transfer, dynamics and simulations.
Gait & posture, 16, 215-232.
ZAJAC, F. E., NEPTUNE, R. R. & KAUTZ, S. A. 2003. Biomechanics and muscle coordination of
human walking: part II: lessons from dynamical simulations and clinical implications. Gait &
posture, 17, 1-17.
ZIEGLER-GRAHAM, K., MACKENZIE, E. J., EPHRAIM, P. L., TRAVISON, T. G. &
BROOKMEYER, R. 2008. Estimating the prevalence of limb loss in the United States: 2005
to 2050. Archives of physical medicine and rehabilitation, 89, 422-429.

Minerva Access is the Institutional Repository of The University of Melbourne
Author/s:
Jafari Harandi, Vahidreza
Title:
Muscle and joint functions during walking in individuals with transfermoral amputation
Date:
2019
Persistent Link:
http://hdl.handle.net/11343/241458
File Description:
Final thesis file
Terms and Conditions:
Terms and Conditions: Copyright in works deposited in Minerva Access is retained by the
copyright owner. The work may not be altered without permission from the copyright owner.
Readers may only download, print and save electronic copies of whole works for their own
personal non-commercial use. Any use that exceeds these limits requires permission from
the copyright owner. Attribution is essential when quoting or paraphrasing from these works.