mushroom value chain analysis in kegalle district of sri lanka 1.pdf · through a spawn production...
TRANSCRIPT

1Amity Journal of Agribusiness
Volume 3 Issue 2 2018 AJAB
ADMAA
Amity Journal of Agribusiness3 (2), (1-19)
©2018 ADMAA
Mushroom Value Chain Analysis in Kegalle District of Sri Lanka
Sameera Thilakarathne & Pathmanathan SivashankarSabaragamuwa University of Sri Lanka, Belihuloya, Sri Lanka
IntroductionAgriculture plays a vital role in Sri Lankan economy. According to the Department of Census
and Statistics, agriculture contributed 7.5 per cent to the national GDP in 2016 and 27.1 percent of total population still depend on agriculture as their main income (DCS, 2016). With the move
AbstractThe main objective of this study was to identify and clarify actors and their functions in the mushroom
value chain in Kegalle district of Sri Lanka. Primary data were collected from 70 mushroom producers, 20 intermediaries, and 40 consumers using household survey through questionnaires, focused group discussions and personal observations. Secondary data were gathered from mushroom farming instructors, Export Development Board, Sri Lanka, and Department of Agriculture, Kegalle District office. In analyzing the results descriptive statistics and inferential statistics were used. All the mushroom producers were sole proprietors. Most of them were unregistered sole proprietors. Structure-Conduct-Performance approach of mushroom producers revealed a perfectly competitive market structure. Most of the mushroom producers had not adhered to the recommendations given by the department of agriculture on the mushroom house. Most of the farmers had production in the range of 50- 100 kg per season. While the consumer got the highest price from the mushroom producer as LKR 61, Collectors got the lowest price and the highest fluctuation in the price. There are five mushroom market channels in Kegalle district. Majority of the producers (42.9%) sold their harvest directly to the consumers only. Oyster mushroom was the main variety that most of the consumers (85.3%) had experienced. Major constraints found in the mushroom value chain were shortage of the substrate and spawn, difficulty in finding suitable labor and lack of storage facilities. Major opportunities were increasing customer awareness about the mushroom, subsidies provided by the authorities and inventions of machines to solve labor problem. There was high need for institutional intervention in increasing the consumer awareness as the producer themselves didn’t have the ability to engage in promotion. There was clear need for setting a certification program or establishing standards for quality control in the mushroom production.
Keywords: Conduct, Mushroom value chain, Performance, Structure, Value additionJEL Classification: Q10, Q13, L10Paper Classification: Research Paper
2 Amity Journal of Agribusiness
Volume 3 Issue 2 2018AJAB
ADMAA
of Sri Lankan economy towards industry and service sectors away from agriculture, Sri Lanka is facing a risk of food security. Attention towards food that can be grown in low space using less agricultural inputs is growing.
Mushroom, referred as “Vegan meat”, stays at the top in this list due to its high nutrient and energy level, with its unique taste. Mushroom can be defined as a macrofungus with a distinctive fruiting body which can be either above ground (epigeous) or below ground (hypogeous) (Miles and Chang, 1997). Sri Lankan mushroom industry is still growing and only few varieties and few mushroom products are available in the market, limiting the choices consumers have. Socio economic research on the mushroom industry in Sri Lanka is limited compared to other crops cultivated (Karunarathne et al., 2017; Rajapakse, 2014; Wijerathne and Silva, 2014; Thilakarathne et al., 2017). So, the mushroom farmers have little knowledge about what are the consumer preferences in their products and how they can increase the profit by engaging in more value-added activities for their products. The cultivation of edible mushrooms has become an attractive economic alternative over past few years mainly due to increase in its demand and market value (Cho et al., 2006; Chiu and Moore, 2001). Mushroom cultivation has a long history. Mushroom became popular in Sri Lanka as an agribusiness only in the late 1980’s through a spawn production project by export development board (EDB) in 1980s (Amarasinghe, 1995). The commercial mushroom cultivation was initiated in Sri Lanka in the latter part of nineteenth century with oyster mushroom (Pleurotus ostreatus) as it was the most appropriate with its climate (Gnaneswaran and Wijegunasekara, 1999). Mushroom industry in Sri Lanka is still growing as a cottage industry with high potential to be developed as a much larger industry. Although there are many mushrooms that can be grown commercially, only a few ones including American Oyster (Pleurotus ostreatus) and button mushroom (Agaricus bisporus) are preferred. Sri Lanka exported US$ 229,765 worth of mushroom in 2014 (EDB, 2016). Technological improvements of mushroom cultivation in Sri Lanka are not satisfactory when compared to other countries. Despite high growth in the industry through mushroom growing programs introduced in the rural areas as self-employment generation by many government and non-government poverty alleviation programs (Thilakarathne and Pathirana, 2017), value addition is little developed in Sri Lanka.
A value chain can be defined as the full range of activities which are required to bring a product or service from conception, through different phases of production (involving a combination of the physical transformation and the input of various producer services), delivery to final customers, and final disposal after use (Hellin and Meijer, 2006). It is critical for a growing industry to identify and clarify the nodes, actors and the related activities in its value chain. The objectives of this research are a) to identify different nodes and actors of the mushroom value chain, b) to identify the amount of value addition along the MVC, c) to assess the MVC through Structure-Conduct-Performance (S-C-P) paradigm, d) to identify determinants of producers choice to alternative markets and e) to identify the opportunities and constraints along the MVC in Kegalle district of Sri Lanka.
Further this attempt aid in identifying the improvements that are required to be more competitive and enhance the livelihood of its members. Since few studies are done on mushroom value chain, there is larger knowledge gap about mushroom value chain actors and their functions. Therefore, this research has significant importance as the constraints and the opportunities that are identified in this research will aid in formulating interventions that are required to improve the existing value chain.

3Amity Journal of Agribusiness
Volume 3 Issue 2 2018 AJAB
ADMAA
Review of LiteratureThe mushroom is a delicious food consumed by children and also elders throughout the
world. It is also called, ‘the future vegetable which is a guarantee for food insecurity, malnutrition problem and has medicinal value’ (Getachew, 2016). At present, demand for mushroom has increased as mushrooms satisfy the needs of health-conscious consumers and are a desirable alternative food, especially for vegetarians (United States International Trade Commission, 2010).
According to Baraza et al. (2007), Barros et al., (2008) and Ergonul et al. (2012), mushrooms are low in fat and simple carbohydrates. And they are rich in digestible protein, high molecular weight polysaccharides among other nutritional constituents and good source of fiber. Further, mushroom contains unsaturated fatty acids, which constitute over 70% of the total content of fatty acids, contain essential fatty acids, and are low in calories, and high in vegetable proteins, minerals and vitamins. Also, mushrooms are rich source of secondary metabolites which may be essential for nutraceuticals, pharmacological and medicinal applications. According to Dembitsky et al. (2010) and Kidukuli et al. (2010), ‘some mushrooms have therapeutic activity which is useful in preventing diseases such as hypertension, hypercholesterolemia, atherosclerosis and cancer’.
So, mushrooms are highly nutritious food. Though, at past, our people consumed non-cultivable varieties; commercially cultivable mushroom were first introduced to Sri Lanka in 1985 and today both endemic and native species are cultivated (Karunarathne et al., 2017). At present mushroom marketing and production is increased. A value chain is the full range of activities (including, design, production, marketing, and distribution) business goes through to bring a product or service from conception to delivery (Senanayake and Premaratne, 2016). Mushroom value chain actors were generally classified into input suppliers, producers, traders, processors and consumers. All actors along the chain, add value in the process of changing product title (Getachew et al., 2016).
Market Structure, Conduct and Performance (S-C-P) ParadigmSCP model (Bain, 1951) was one of the earliest methods of analyzing the organization of an
industry. It is widely used to analyze competitive conditions in industries by examining how the structure of industry relates to the market conduct and performance. Porter first discussed the value chain concept in his book “Competitive Advantage: Creating and Sustaining Superior Performance”. So, for an organization, SCP model is a path for gaining competitive advantage.
Market StructureMarket structure is the organizational and other characteristics of a market. These are the
characteristics which affect the degree of competition between firms and their pricing decisions.
The structure of a specific market depends on three main factors. They are the degree of concentration of buyers and sellers, the degree of product differentiation and the number of barriers to entry into the specific market or industry. Upon the above-mentioned factors, there can be four main market structures that can be clearly identified. They are perfect competition, monopoly, monopolistic competition and oligopoly. Each market structure determines the influence of the price, supply, barriers of entry, efficiency and the competition (Krister, 2008).
Measurements of Market StructureEmpirically market structure is measured by using absolute concentration measures and
relative concentration measures. Concentration ratio and Herfindahl- Hirschman index are used as

4 Amity Journal of Agribusiness
Volume 3 Issue 2 2018AJAB
ADMAA
the absolute concentration measures, while Gini coefficient and Lorenz curve is used as indicators of relative concentration.
Market concentration is an important proxy for competition among firms in an industry (Hrazdil and Zhang, 2012). It is useful as an economic tool because it points the degree of competition in the market. And it is a function of the number of firms and their respective shares of the total production or sales (Pulaj and Kume, 2014).
If the CRk represents the concentration ratio,
CRk = ∑i=1 Si, k = 4, 8, 12, 20k ............................................1
Where, Si= market share of firm i, belonging to the k largest firms
When considering the concentration ratio (CR), it is the cumulative share of the k largest firms in the market. Here the typical values of k are taken as 4, 8, 12, 16 and 20 (Wesman, 2005). Therefore, the four-firm concentration ratio (CR4) can be calculated and identified as the totality of market shares of the four largest firms in the industry to the total market share. The most common measure of market size, is it sales, but concentration ratios also could be calculated by other measures of market size such as value added, employment or assets. The main advantage of the concentration ratio is its relative easiness to understand. The result will range from zero to hundred percent where zero percent will be for the perfectly competitive market and hundred percent for the monopoly firm. Further, the result of concentration ratio can be interpreted as if the result falls between 75-100 percent, the industry is considered highly concentrated. It is considered as moderately concentrated if the ratio falls between 50-75 percent. And the market is considered as slightly concentrated if 25-50 percent; finally atomistic if the ratio falls between 0-25 percent.
The Herfindahl-Hirschman Index (HHI) is considered as more informative and complex method of measuring the market structure. This contains more information about the size of the largest firms. This will change if there are significant shifts in the market share of the largest companies.
HHI is calculated as follows,
HHI =∑i=1 (Xi/T)2k ..................................................2
Where, k= number of firms in the market; Xi= the sales volume of firms i; T = total market share.
HHI is considered to be a measure of dispersion. This index considers the number and the share of all the firms producing for the market. Higher the value of the index, it is less likely that the industry will show competitive behavior and becomes more equal in firms’ sizes. According to Hirschman (1964), the HHI can determine market structure by dividing them into three sectors as, if
• HHI<1000 = concentrated • 1000<HHI<1800 = moderatelyconcentrated • HHImorethan1800 = highlyconcentrated
In practice, under the Horizontal Merger Guidelines 1997 Revised, the United States Department of Justice and the Federal Trade Commission, also used the HHI range as the framework for measuring market competitiveness (APEC, 2008).

5Amity Journal of Agribusiness
Volume 3 Issue 2 2018 AJAB
ADMAA
Market ConductMarket conduct comprises the methods of the price and quality determination, selling
promotions and the tactics of barrier to others into the market (Umar et al., 2011). Market conduct can be identified as the patterns of behavior that sellers follow and how they adopt to the changing market conditions. For example, market conduct can be seen as price setting behavior or buying and selling practices. Elements of market conduct include price setting behavior like, who sets the price and how the prices are determined, buying and selling behavior and also other business conducts such as return of goods, the traders getting merge or the traders lobbing the politicians or officials to control the markets (USADI, 2008).
Measurement of ConductThe conduct of the mushroom industry was analyzed according to the product differentiation
in terms of different mushroom types, their attributes and the availability of brands (Wijesinghe and Weerahewa, 2017). Hedonic price analysis was performed to find the implicit prices paid for different quality attributes of mushroom and available brands by the consumers.
Market PerformanceMarket performance can be identified as the degree to which the markets produce products
or services that are considered as good or preferred by the society. The main elements of the market performance can be identified as price levels and the price stability which include the price consistency in long run, over space and in the short run. And also, price levels include the margins and the costs when compared to what is received by the farmer and what is paid by the consumer when compared to the marketing, processing and transaction costs. Another main element of market performance is the product quality and variety. This element includes the acceptable quality of the products that are supplied to the consumers who could have major implications with the nutrition level expected. And the variety of products that are supplied to the consumers that suit with the region or preferred by the specific market segment.
Other element of market performance is the distribution of products within the market. This includes the consistency of the supplies to different markets in the region (USAID, 2008).
Measurement of PerformanceMeasuring the market performance is used to monitor the results of the competition among
firms, within the industry, market and the entire economy. The measurements can be used to identify how a firm or a system is performing and identify the trends of performance over time.
Accounting profits can be taken as the measure of relative performance because the data is readily available and this data doesn’t require a judgment about the competitive rate of return. Two general indicators can be identified in measuring the performance in terms of profit rate. They are the rate of return on the assets after tax and the rate of return on shareholder’s equity after tax. Another indicator to measure performance in terms of sale is the rate of return on sales after tax.
Return on AssetsReturn on assets measures the overall ability of the company to use the assets of the company
in which it has invested to earn a profit.
6 Amity Journal of Agribusiness
Volume 3 Issue 2 2018AJAB
ADMAA
Return on Assets= (P – T + I)A
.......................................3
Where, P = net profits; T = tax on profits; I = interest payment to debt holders; A = total assets.
Return on Sales after TaxThis ratio is directly related to the bottom line of the income statement. It acts as a fundamental
indication of the overall profitability of a business.
Return on Sales after Tax= (P – T)S
.................................4
Where P = net profits; T = tax on profits; S = total sales (APEC, 2010)
Market margin is also main tool that is used to measure market performance. Market margin can be calculated by taking the price difference between the farmers and the retailers. Producer’s share can be defined as the ratio of produce’s price to consumer’s price.
PS = PPCP = 1– MM
CP …………................................……..5
Where, PS= Producer’s share, PP= Producer’s price, CP = Consumer price, MM = marketing margin
The total gross marketing margin is always related to final price paid by the consumer and that is expressed as percentage.
If TGMM is total gross marketing margin,
TGMM =CP – PPCP
............................................................6
Methodology of the StudySince, mushroom industry is new and rapidly growing, information about its actors is very
limited. Therefore, both probability and non – probability sampling methods had to be used in data collection, since there is no record that can be used to get the sample frame for mushroom farmer population, input suppliers, traders, processors or consumers. Purposive sampling was used for those actors of the mushroom value chain. This study is conducted in Kegalle district, Sri Lanka. Research used 70 farmers, 20 Intermediaries and 40 consumers. Although there is no registered data of the mushroom producers in Kegalle district; according to the District Office of Department of Agriculture, there are approximately 600 mushroom farmers, but about 550 can be identified as actively engaged. But due to time and budget limitations, the above amounts were selected as the sample size.
Primary data was collected using household survey providing a questionnaire, focused group discussions and personal observations. Secondary data were gathered from mushroom farming trainers and from Kegalle District’s Department of Agriculture office. There are about 10 mushroom farmer societies that are formed in each DS division. Focus group discussions were conducted with the help of those societies. Intermediaries, input suppliers and consumers met and were interviewed at their places. A structured questionnaire for each group was prepared and used. For analyzing the gathered data both descriptive and inferential statistics were used.

7Amity Journal of Agribusiness
Volume 3 Issue 2 2018 AJAB
ADMAA
Results and Discussion
Mushroom value chain in Kegalle districtActors involved in MVC in Sri Lanka can be classified into four main groups as input
suppliers, producers, processors and consumers. Actors in the value chain add value along the value chain. Value chain actors and activities are shown in Figure1.Figure 1: Value chain actors and activities performed in mushroom value chain
Value Chain Actors
Input Suppliers of Mushroom ProductionIn a mushroom value chain, there are two types of mushroom input suppliers. Those are
primary suppliers who produce and sell mushroom spawn and other suppliers are who only sell spawn to the producers. As there are no spawn producers in Kegalle district that are registered in the Department of Agriculture, the spawn producers had to be found with the directions from the farmers and agriculture instructors. There was one new small-scale mushroom spawn producer in Kegalle district. Mushroom producers buy the required mushroom seed from the department of agriculture sales outlet in Gannoruwa and from Mushroom development center in Rathmalana, which are not located in the Kegalle district.
Mushroom ProducersIn gender distribution among mushroom producers in Kegalle district, majority of the
respondents were male producers (51.4%). But this gender disparity is not high as female producers accounted for 48.6%. Contrastingly, in age there was a clear disparity. Significant portion of the producers (81.4%) were in the age range of 20- 35 years. This means most of the farmers in mushroom cultivation are young, which is an indirect indicator showing that they have only few years of experience. This shall be because the mushroom industry in Sri Lanka started commercial production during the latter part of the nineteenth century. Since the farmers are young, the future of mushroom cultivation seems bright. As the production is still in its inception stage and most of the youngsters in general are diversifying their income, mushroom cultivation could be a good additional income source for many farmers in the years to come (Imtiaj and Rahman, 2008; Gnaneswaran and Wijayagunasekara, 1999)

8 Amity Journal of Agribusiness
Volume 3 Issue 2 2018AJAB
ADMAA
According to the educational background of the mushroom producers, the significant portion (85.7%) of them had secondary education or above; out of them only 20% of the producers had passed Advanced level education. Proving Sri Lankan mushroom industry is still in infant stage; all the respondents engaged in mushroom cultivations were sole proprietor business types. The mushroom producers are trying to form a corporative or partnerships in order to find solutions for critical problems that they face like lack of storage facilities (Gnaneswaran and Wijegunasekara, 1999). So, they have to maintain close relationships with buyers as mushroom is a highly perishable produce.
Most of the farmers (62.9%) are engaged in mushroom production as their full-time occupation in Kegalle District. According to the findings of Thilakarathne and Pathirana (2017), 25% of respondents were engaged in mushroom cultivation in Rathnapura district while rest were engaged as part time and some as hobby. Part timers engaged in various full-time occupations, such as business (11.5%), self-employment (30.8%), Government sector (26.9%) and private sector (30.8%). The distribution of educational level and type of business is described by Table A1 and there was no significant relationship between educational level of producers and the type of business.
Table 1. Type of Business and Educational level
Sole proprietor (registered)
Type of BusinessChi-Square testSole proprietor
(Unregistered)
Educational Level Primary 7 (10%) 3 (4.3%)
0.4796-10 grade 18 (25.7%) 3 (4.3%)
11-13 grade 21 (30%) 4 (5.7%)
A/L passed 8 (11.4%) 4 (4.7%)
Graduate 1 (1.4%) 1 (1.4%)
Total 55 (78.6%) 15 (21.4%)
Spawn producers who are major actors has important functions in a typical mushroom value chain. But there was no registered mushroom spawn producer in Kegalle district. Therefore, the mushroom producers had to incur high transportation cost in order to procure them.
Significant number of farmers are still not registered with the Department of Agriculture. Therefore, registering of mushroom farmers has to be encouraged so that the mushroom value chain can be streamlined, providing the subsidies and other benefits to all the farmers.
Mushroom TradersMajority of the mushroom traders (80%) happen to be males, and most of them are between 40-
50 years of age. Most of the traders had secondary education (65%) and 40% of all the responded traders had passed GCE Advanced level. Main functions of the mushroom trader are collecting, sorting and selling to different customers. Main retail mushroom traders were available in the public markets available in Kegalle and Ruwanwella. There was a constant supply that was consistent all year around.

9Amity Journal of Agribusiness
Volume 3 Issue 2 2018 AJAB
ADMAA
Majority of the mushroom traders (70%) were sole proprietors while 10% of the traders were partnerships and 20% were corporative. Most of the mushroom traders (20%) had been in the business more than twenty years. Only 15% of the traders engage in the sale of the imported mushroom which is major competitor for domestically cultivated mushroom. 60% of the traders engage in selling only fresh mushroom. Although some traders were in the mushroom business for several years, they were unable to recognize the mushroom variety. They just know the color of the mushroom. Since only few varieties were available, the researcher was able to identify the variety by the description by them. Only half (50%) of the traders responded that there was a timely supply of mushroom. Out of the traders that responded, that they are unable to get the mushroom on their request, 50% stated that they have to wait another 1-2 weeks to get the requested supply. Majority of the traders were able to sell 5-10 200g packets of the mushroom. That is 1-2kg.There was no significant difference between sales per week by the types of customer that the mushroom traders use to cater.
When considering the governance of the traders in the value chain, the decision making on the price of packet of the mushroom is determined by the trader according to 45% of the traders. Therefore, there might be significant power by the traders over the mushroom value chain. Majority of the suppliers (95%) traders or the producers of the mushroom are sole proprietors. And most of the traders have 1-5 suppliers of the mushroom. There was an informal agreement between the traders and the producers to buy certain amount of harvest from a particular supplier. This was built over long-time business relationship. Average purchasing price of fresh mushroom kilograms by traders is LKR 257.5. And LKR 286.5 is the average selling price by the traders.
Mushroom ConsumersIn MVC, consumer purchases mushrooms directly from the producers, traders and processors.
Majority of the mushroom consumers (56%) were male, and most of them (24%) are in the age group of 25-30 years. When considering the education level of the consumers, majority of the consumers (63%) have passed GCE ordinary level examination and 60.9% of the consumers responded had a monthly income exceeding LKR 20 000.
Oyster mushroom was the most famous among the consumers. A significant portion of consumers have consumed Wild mushroom, viz, Indalolu, Maweli hathu and Straw mushroom.
Majority (65.9%) of them did not agree to the fact that there is adequate supply of the mushroom to meet the demand. Consumers bought the mushroom directly from producer, from retailer, from hotels and supermarkets. The major place they bought mushroom was at the retail shop (83.3%). The distance to the mushroom market showed major importance as majority of the consumers bought their harvest from sources less than 5km away from their homes. The relationship between demographic factors and consumption of mushroom consumers is given in Table 2.
Table 2. Demographic Factor and Pearson Chi-square
Demographic factor Pearson Chi – squareAgeGenderEducation levelIncome level
0.2720.4690.4290.007
10 Amity Journal of Agribusiness
Volume 3 Issue 2 2018AJAB
ADMAA
Value Chain Activities
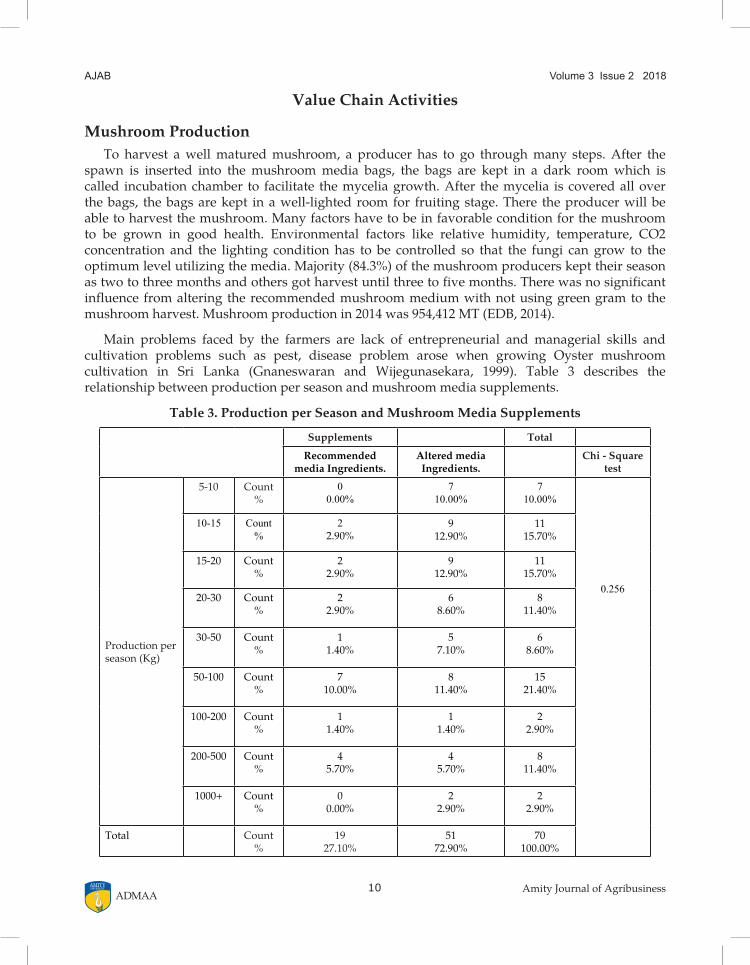
Mushroom ProductionTo harvest a well matured mushroom, a producer has to go through many steps. After the
spawn is inserted into the mushroom media bags, the bags are kept in a dark room which is called incubation chamber to facilitate the mycelia growth. After the mycelia is covered all over the bags, the bags are kept in a well-lighted room for fruiting stage. There the producer will be able to harvest the mushroom. Many factors have to be in favorable condition for the mushroom to be grown in good health. Environmental factors like relative humidity, temperature, CO2 concentration and the lighting condition has to be controlled so that the fungi can grow to the optimum level utilizing the media. Majority (84.3%) of the mushroom producers kept their season as two to three months and others got harvest until three to five months. There was no significant influence from altering the recommended mushroom medium with not using green gram to the mushroom harvest. Mushroom production in 2014 was 954,412 MT (EDB, 2014).
Main problems faced by the farmers are lack of entrepreneurial and managerial skills and cultivation problems such as pest, disease problem arose when growing Oyster mushroom cultivation in Sri Lanka (Gnaneswaran and Wijegunasekara, 1999). Table 3 describes the relationship between production per season and mushroom media supplements.
Table 3. Production per Season and Mushroom Media Supplements
Supplements Total
Recommended media Ingredients.
Altered media Ingredients.
Chi - Square test
Production per season (Kg)
5-10 Count%
00.00%
710.00%
710.00%
0.256
10-15 Count%
22.90%
912.90%
1115.70%
15-20 Count%
22.90%
912.90%
1115.70%
20-30 Count%
22.90%
68.60%
811.40%
30-50 Count%
11.40%
57.10%
68.60%
50-100 Count%
710.00%
811.40%
1521.40%
100-200 Count%
11.40%
11.40%
22.90%
200-500 Count%
45.70%
45.70%
811.40%
1000+ Count%
00.00%
22.90%
22.90%
Total Count%
1927.10%
5172.90%
70100.00%

11Amity Journal of Agribusiness
Volume 3 Issue 2 2018 AJAB
ADMAA
The source of finance for mushroom producers and its utilization relationship is discussed in Table 4.
Table 4. Source of Finance and Utilization of Finance
For purchasing tools and
equipment
For running the business
For renovation For expanding Total Chi Squre test
Bank Count%
00.00%
13.00%
13.00%
00.00%
26.10%
0.008Financial institution
Count%
721.20%
00.00%
927.30%
26.10%
1854.50%
DOA Count%
721.20%
00.00%
515.20%
13.00%
1339.40%
Total Count%
1442.40%
13.00%
1545.50%
39.10%
Mushroom HousingMajority of the mushroom producers had mushroom houses that is with area less than the
recommended values of the department of agriculture, Sri Lanka. Here the mushroom house refers to the mushroom growing house. Most of the farmers (28.6%) had mushroom houses with area between 60-80 square feet. The recommended area of the mushroom house by the department of agriculture is 132 square feet. (11 x 12 ft.) Other recommendations are the door should be able to open towards outside, build only part walls (2.5 feet) and cover the rest with insect proof nets. It is recommended that the floor should be cement or concrete but it was found that small number of producers (12.9%) still use clay to prepare the floor. The recommended material for the roof is to use tile, but there were farmers who still use hay or coconut leaves for the preparation of the roof. Beside all the recommendations, it was noted that most of the producers do not care about the recommendations; they use sarees instead of insect proof nets and they proceed with the resources that they can acquire easily. Area of the mushroom house showed a significant difference between the roofing and floor materials used. It is discussed in Table 5.
Production of Mushroom Varieties There are mainly four mushroom varieties cultivated commercially in Sri Lanka. They are
American oyster, Butan oyster, Abelone and Button mushroom. In addition, Makandura white is a variety introduced recently, and it is not popular with the mushroom producers due to various reasons like lack of knowledge about the variety etc.
The cultivated main mushroom variety in Kegalle district is American oyster (72.9%), which is then followed by Butan oyster and Abalone. Although Abalone is fleshier and has higher weight, it takes more time to get to the mature stage. This may be the reason that it gets lower attention from the producers. It was found that although there are producers who cultivate American oyster alone, there were no farmers who cultivate other varieties alone. Famers, who had grown other varieties, had grown Abelone and Butan oyster with American Oyster. This might be due to the high consumer preference and resistance of American oyster to the pest and diseases.

12 Amity Journal of Agribusiness
Volume 3 Issue 2 2018AJAB
ADMAA
Tab
le 5
. Mu
shro
om H
ousi
ng
on R
oof
and
Flo
or T
ype
Mu
shro
om h
ousi
ng
Are
a (S
qu
are
feet
)
”20-
40”
”40-
60”
”60-
80”
”80-
100”
”100
-150
””1
50-2
50”
”250
-500
””1
000+
”T
otal
Ch
i-sq
uar
e te
st
Roof
Iron
Cou
nt4
94
00
20
120
0.03
6
%5.
70%
12.9
0%5.
70%
0.00
%0.
00%
2.90
%0.
00%
1.40
%28
.60%
Hay
/C
ocon
ut
leav
esC
ount
00
12
00
00
3
%0.
00%
0.00
%1.
40%
2.90
%0.
00%
0.00
%0.
00%
0.00
%4.
30%
Asb
esto
sC
ount
26
36
70
10
25
%2.
90%
8.60
%4.
30%
8.60
%10
.00%
0.00
%1.
40%
0.00
%35
.70%
Tile
Cou
nt5
56
51
00
022
%7.
10%
7.10
%8.
60%
7.10
%1.
40%
0.00
%0.
00%
0.00
%31
.40%
Tota
lC
ount
1120
1413
82
11
Floo
r
%15
.70%
28.6
0%20
.00%
18.6
0%11
.40%
2.90
%1.
40%
1.40
%
Cem
ent
Cou
nt1
76
63
10
024
0.00
0
%1.
40%
10.0
0%8.
60%
8.60
%4.
30%
1.40
%0.
00%
0.00
%34
.30%
Con
cret
eC
ount
212
87
51
11
37
%2.
90%
17.1
0%11
.40%
10.0
0%7.
10%
1.40
%1.
40%
1.40
%52
.90%
Cla
yC
ount
81
00
00
00
9
%11
.40%
1.40
%0.
00%
0.00
%0.
00%
0.00
%0.
00%
0.00
%12
.90%
Tota
lC
ount
1120
1413
82
11
%15
.70%
28.6
0%20
.00%
18.6
0%11
.40%
2.90
%1.
40%
1.40
%

13Amity Journal of Agribusiness
Volume 3 Issue 2 2018 AJAB
ADMAA
Inputs for Mushroom ProductionAlthough there are many substrates that are tested and proven as suitable such as straw and
bagasse, all the producers responded used saw dust as their substrate because of easy availability. All the other substrates are available abundantly only in seasons. But saw dust is available all around the year. There are only a few who buy saw dust from intermediaries; almost all the producers buy saw dust from the saw mill directly. But supply of saw dust is getting scarcer as the main saw dust supplier has started making furniture out of sawdust of rubber and other light wood, which is used in mushroom cultivation. Due to the consistency of the demand from the furniture manufacturer, saw mill owners tend to give the saw dust to the furniture factory. Therefore, at present, the mushroom farmers have to buy saw dust in larger quantities. Earlier they used to buy saw dust as they needed and in the exact quantity they required.
Mushroom cultivation requires a substrate and supplements for the growth of the fungi. The main supplements are MgSO4, CaCO3, Rice bran and Green gram flour. Although the producers use all the other supplements, 72.9% of the mushroom producers do not use mush flour or substitute such as “Samaposa”. They omit it from the mixture in the belief that there is no benefit to the harvest from that though it amounts to higher cost of mixture.
Mushroom ProcessingMushrooms have to be consumed in three to four days after harvesting to prevent spoilage.
The better price is ensured for the mushroom farmers where the necessary infrastructure is available, end customer is close so to sell as soon as the harvesting is done, and the local market or the wholesaler can be found, on the same day harvested. In large-scale mushroom cultivations, cold rooms with temperature of 5 to 8 °C, are used to store the mushrooms before sending them to the market.
The small-scale farmers can use the processing for their advantage. According to the market availability, they can extend the shelf-life. In some situations, this is value addition and advantageous for marketing. Though some investment is needed, infrastructure is necessary for effective processing because the mushrooms need to be carefully packed and stored safely.
Besides drying, majority of the mushroom producers did not engage in any value addition activities. Only 4.3% of the mushroom producers have engaged in mushroom value addition besides drying and packing.
Mushroom MarketingMushroom producers in Kegalle district sold their harvest for consumers directly, retailers,
hotels, collectors and super markets. Majority of the producers (42.9%) sold their harvest directly to the consumers only. Majority of the mushroom producers (39.1%) sold their harvest to customers within five kilo meters from the mushroom house. 37.7% of the producers sold their harvest between 5-10 kilo meters from the mushroom house. Mushroom producers use many transport methods to take the harvest to its customer. The significant portion of the mushroom farmers (32.9%) transported the mushroom harvest by foot. This is because most of the small-scale mushroom farmers tend to door to door selling for the daily harvested mushroom when supplying directly to the consumer. Majority of the producers had their own vehicle, and they used that for the transport of the mushroom from the farm to the consumer. Most of the time, this vehicle happens to be a three-wheeler or a motorcycle. When considering the governance of the mushroom value chain in Kegalle district, it was understood that the decision-making power
14 Amity Journal of Agribusiness
Volume 3 Issue 2 2018AJAB
ADMAA
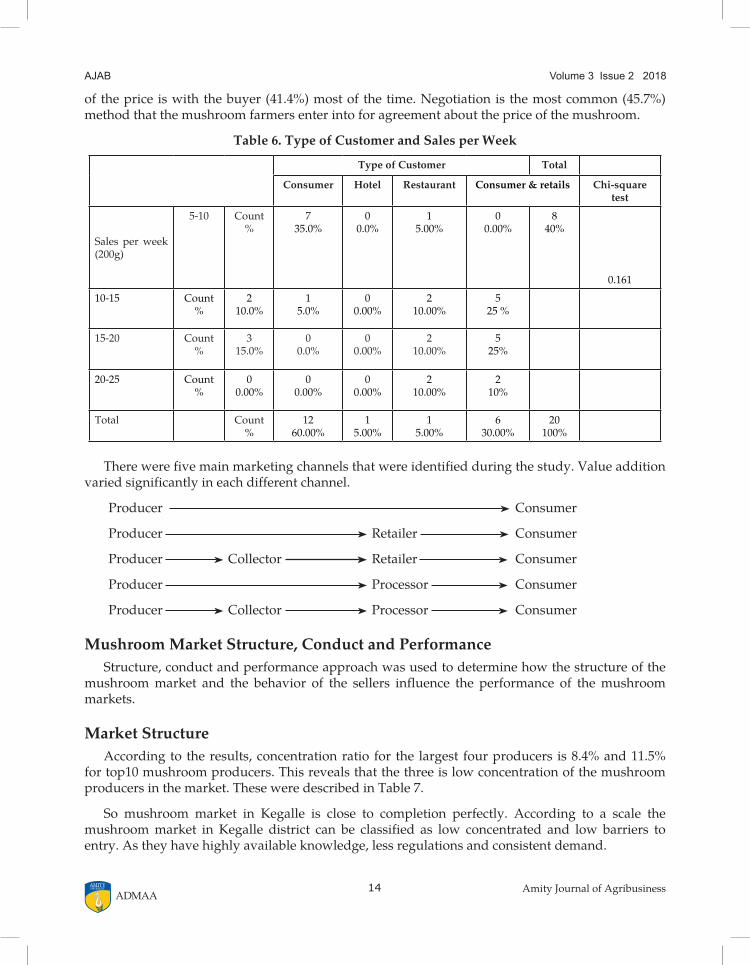
of the price is with the buyer (41.4%) most of the time. Negotiation is the most common (45.7%) method that the mushroom farmers enter into for agreement about the price of the mushroom.
Table 6. Type of Customer and Sales per Week
Type of Customer Total
Consumer Hotel Restaurant Consumer & retails Chi-square test
Sales per week (200g)
5-10 Count%
735.0%
00.0%
15.00%
00.00%
840%
0.16110-15 Count
% 2
10.0%1
5.0%0
0.00%2
10.00%5
25 %
15-20 Count%
315.0%
00.0%
00.00%
210.00%
525%
20-25 Count%
00.00%
00.00%
00.00%
210.00%
210%
Total Count%
1260.00%
15.00%
15.00%
630.00%
20100%
There were five main marketing channels that were identified during the study. Value addition varied significantly in each different channel.
Producer Consumer
Producer Retailer Consumer
Producer Collector Retailer Consumer
Producer Processor Consumer
Producer Collector Processor Consumer
Mushroom Market Structure, Conduct and PerformanceStructure, conduct and performance approach was used to determine how the structure of the
mushroom market and the behavior of the sellers influence the performance of the mushroom markets.
Market StructureAccording to the results, concentration ratio for the largest four producers is 8.4% and 11.5%
for top10 mushroom producers. This reveals that the three is low concentration of the mushroom producers in the market. These were described in Table 7.
So mushroom market in Kegalle is close to completion perfectly. According to a scale the mushroom market in Kegalle district can be classified as low concentrated and low barriers to entry. As they have highly available knowledge, less regulations and consistent demand.

15Amity Journal of Agribusiness
Volume 3 Issue 2 2018 AJAB
ADMAA
Table 7. Concentration Ratio for Mushroom Producers
Top producers Production(kg) per Month Concentration ratio
1 1700
CR4 =
∑1 Si
4 = 5.522 16003 4504 4505 450
CR8 =∑1 Si8 = 7.57
6 4507 3508 3009 160
CR12 = ∑1 Si12 = 8.36
10 15011 15012 15013 130
CR 16 = ∑1 Si16 = 8.98
14 12015 12016 10017 100
CR 16 =∑1 Si20 = 9.5
18 10019 10020 90
Total(N=600) 76000
Market ConductWhen the price setting behavior is considered in mushroom value chain in Kegalle district, it
was found that majority of the producers (45.7%) set the price with their buyers after negotiation and mostly if not, negotiation buyer decides the price (41.4%). Only 8.6% stated that they would be able to go with the market price.
Market PerformanceMarket performance is measured to monitor the results of the competition among the firms
within the industry, market and entire economy.
Return on SaleReturn on sales is the main metric used to measure the market performance. Since most of
the mushroom producers are small holders and fulltime employees in mushroom industry, they themselves engage in cultivation. Therefore, allocating the minimum wage in Sri Lanka (LKR 10000, National minimum wage of workers act, No. 3 of 2016), return for sale is 23.78%.
Total Gross Marketing Margin (TGMM)Total gross market margin is also another major metric that is used to measure the market
performance. When considering the TGMM for the five marketing channels, the highest margin was (100%) found in the first marketing channel as there, the producer directly provides produce
16 Amity Journal of Agribusiness
Volume 3 Issue 2 2018AJAB
ADMAA
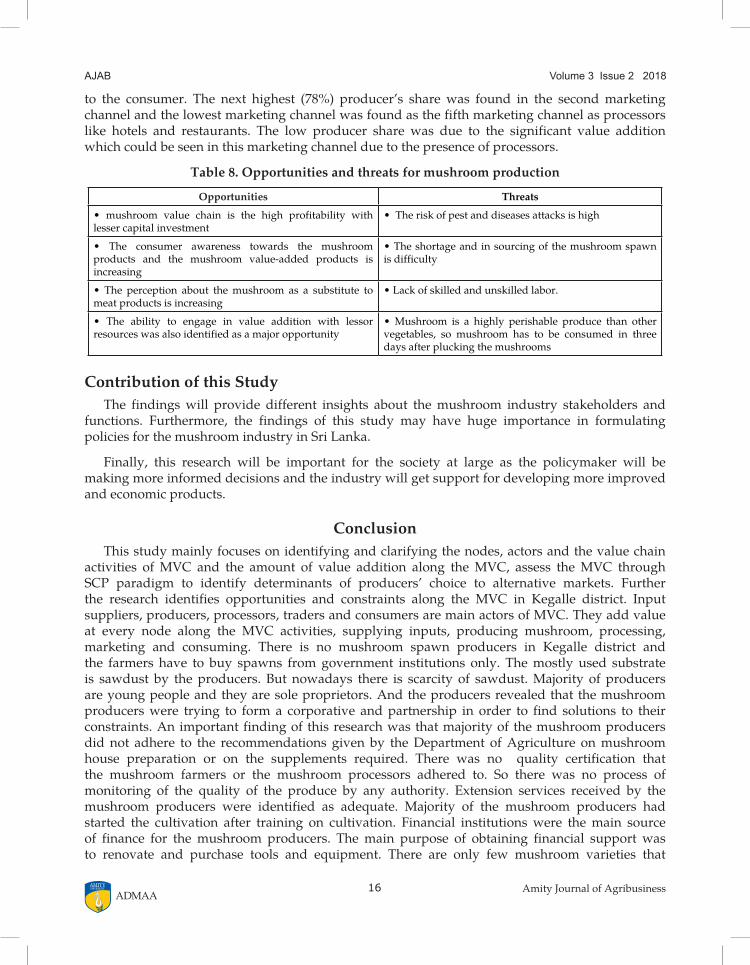
to the consumer. The next highest (78%) producer’s share was found in the second marketing channel and the lowest marketing channel was found as the fifth marketing channel as processors like hotels and restaurants. The low producer share was due to the significant value addition which could be seen in this marketing channel due to the presence of processors.
Table 8. Opportunities and threats for mushroom production
Opportunities Threats
• mushroom value chain is the high profitability withlesser capital investment
•Theriskofpestanddiseasesattacksishigh
• The consumer awareness towards the mushroomproducts and the mushroom value-added products is increasing
•Theshortageandinsourcingofthemushroomspawnis difficulty
• The perception about themushroom as a substitute tomeat products is increasing
•Lackofskilledandunskilledlabor.
• The ability to engage in value addition with lessorresources was also identified as a major opportunity
•Mushroom is a highly perishable produce than othervegetables, so mushroom has to be consumed in three days after plucking the mushrooms
Contribution of this StudyThe findings will provide different insights about the mushroom industry stakeholders and
functions. Furthermore, the findings of this study may have huge importance in formulating policies for the mushroom industry in Sri Lanka.
Finally, this research will be important for the society at large as the policymaker will be making more informed decisions and the industry will get support for developing more improved and economic products.
ConclusionThis study mainly focuses on identifying and clarifying the nodes, actors and the value chain
activities of MVC and the amount of value addition along the MVC, assess the MVC through SCP paradigm to identify determinants of producers’ choice to alternative markets. Further the research identifies opportunities and constraints along the MVC in Kegalle district. Input suppliers, producers, processors, traders and consumers are main actors of MVC. They add value at every node along the MVC activities, supplying inputs, producing mushroom, processing, marketing and consuming. There is no mushroom spawn producers in Kegalle district and the farmers have to buy spawns from government institutions only. The mostly used substrate is sawdust by the producers. But nowadays there is scarcity of sawdust. Majority of producers are young people and they are sole proprietors. And the producers revealed that the mushroom producers were trying to form a corporative and partnership in order to find solutions to their constraints. An important finding of this research was that majority of the mushroom producers did not adhere to the recommendations given by the Department of Agriculture on mushroom house preparation or on the supplements required. There was no quality certification that the mushroom farmers or the mushroom processors adhered to. So there was no process of monitoring of the quality of the produce by any authority. Extension services received by the mushroom producers were identified as adequate. Majority of the mushroom producers had started the cultivation after training on cultivation. Financial institutions were the main source of finance for the mushroom producers. The main purpose of obtaining financial support was to renovate and purchase tools and equipment. There are only few mushroom varieties that

17Amity Journal of Agribusiness
Volume 3 Issue 2 2018 AJAB
ADMAA
are grown and consumed in the region. Out of them, American oyster is the main variety that was produced by the farmers, sold by intermediaries and consumed. At processing level, they practiced only drying method. On considering the consumer perception about the mushroom supply to the market, majority of the mushroom consumers had experience that supply to the market is inadequate. According to concentration ratio, the mushroom producers in Kegalle is low concentrated and structure is closer to perfect competition. The opportunities and constrains identified revealed there are huge need of institutional support for the improvement in mushroom value chain. So, the findings of this study are more worth in policy making and developing mushroom industry.
LimitationsSince there are no spawn producer’s in Kegalle district, the relationship between them and
the value addition couldn’t be examined in this study. Therefore in order to examine a complete value chain, a location with spawn producer has to be selected. The failure to find out properly developed sampling frame was another limitation and due to the reason have to conduct non-probability sampling techniques.
ReferencesAmarasinghe, D. M. (1995). Bimmal Wagawa (Sinhala). Srilanka: Sara Printers.
APEC. (2008). Market Liberalization and its Relationship with Market Structure Conduct and Performance of the Food. Retrieved from https://www.apec.org/Publications/2008/04/Market-Liberalization-and-its-Relationship-with-Market-Structure-Conduct-and-Performance-of-the-Food
Bain, J. S. (1951). Relation of Profit Rate to Industry Concentration: American Manufacturing, 1936-1940. The Quarterly Journal of Economics, 65(3), 293–324.
Baraza, L., Joseph, C., Moshi, M., & Nkunya, M. (2007). Chemical constituents and biological activity of three Tanzanian wild mushroom species. Tanzania Journal of Science, 33(1), 1–7.
Barros, L., Venturini, B. A., Baptista, P., Estevinho, L. M., & Ferreira, I. C. F. R. (2008). Chemical Composition and Biological Properties of Portuguese Wild Mushrooms: A Comprehensive Study. Journal of Agricultural and Food Chemistry, 56(10), 3856–3862.
Chiu, S., & Moore, D. (2001). Threats to biodiversity caused by traditional mushroom cultivation technology in China. In British Mycological Society Symposium Series (pp. 111–119). In host Publication.
Cho, E. J., Oh, J. Y., Chang, H. Y., & Yun, J. W. (2006). Production of exopolysaccharides by submerged mycelial culture of a mushroom Tremella fuciformis. Journal of Biotechnology, 127(1), 129–140.
Dembitsky, V. M., Terent’ev, A. O., & Levitsky, D. O. (2010). Amino and fatty acids of wild edible mushrooms of the genus Boletus. Records of Natural Products, 4(4), 218–223.
EDB. (2016). Industry Capability Report. Retrieved from http://www.srilankabusiness.com/pdf/industry_capability_reports/fruit_and_veg.pdf
Ergonul, P., Ergonul, B., Kalyoncu, F., & Akata, I. (2012). Fatty Acid Compositions of Five Wild Edible Mushroom Species Collected from Turkey. International Journal of Pharmacology, 8(5), 463–466.
Getachew, D., Zemedu, L., & Eshete, A. (2016). Journal of Agricultural Extension and Rural Development Mushroom value chain analysis in Addis Ababa, Ethiopia. Journal of Agricultural Extension and Rural Development, 8(8), 130–140.
18 Amity Journal of Agribusiness
Volume 3 Issue 2 2018AJAB
ADMAA
Gnaneswaran, R., & Wijayagunasekera, H. N. P. (1999). Survey and identification of insect pests of oyster mushroom (pleurotus ostreatus) cultures in central province of Sri Lanka. Tropical Agricultural Research and Extension, 2(1), 21–25.
Hellin, J., & Meijer, M. (2006). Guidelines for Value Chain Analysis. In Food and Agriculture Organization of the United Nations. Retrieved from https://www.scirp.org/(S(lz5mqp453edsnp55rrgjct55))/reference/ReferencesPapers.aspx?ReferenceID=2004482
Imtiaj, A., & Rahman, S. . (2008). Economic viability of mushrooms cultivation to poverty reduction in Bangladesh. Tropical and Subtropical Agroecosystems , 8(1), 93–99.
Karunarathna, S., Mortimer, P., Xu, J., & Hyde, K. (2017). Overview of research of mushrooms in Sri Lanka. Revista Fitotecnia Mexicana, 40(4), 399–403.
Kidukuli, A. W., Mbwambo, Z. H., Malebo, H. M., Mgina, C. A., & Mihale, M. J. (2010). In Vivo Antiviral Activity, Protease Inhibition and Brine Shrimp Lethality of Selected Tanzanian Wild Edible Mushrooms. Journal of Applied Biosciences, 31(1), 1887–1894.
Krister, A. (2008). Essentials of Microeconomics. Retrieved from https://library.ku.ac.ke/wp-content/downloads/2011/08/Bookboon/Economics/microeconomics-uk.pdf
McCarty, T. (2010). Mushrooms Industry & Trade Summary (Control No. 2010002). Washington, DC: Office of Industries Mushrooms Publication.
Miles, P. G., & Chang, S. T. (Shu-ting). (1997). Mushroom biology : concise basics and current developments. Singapore: World Scientific Publishing.
Pulaj, E., & Kume, V. (2014). Basic Tools and Frameworks for Analyzing and Understanding Competitiveness Within the Industry. European Journal of Sustainable Development, 3(1), 47–56.
Rajapakse, J. C. (2014). Status of edible and medicinal mushroom research in Sri Lanka. In M.Singh (Ed.), In the Proceedings of the 8th International Conference on Mushroom Biology and Mushroom Products (ICMBMP8) (pp. 417–421). New Delhi: ICAR-Directorate of Mushroom Research.
Senanayake, S. M. P., & Premaratne, S. P. (2016). An Analysis of the Paddy/Rice Value Chains in Sri Lanka An Analysis of the Paddy/Rice Value Chains in Sri Lanka (W/P No.04). Srilanka:ASARC.
Thilakarathna, K. A. D. S., Dulmini, N. N. D., Mahaliyanaarachchi, R. P., & Shivashankar, P. (2017). Consumer preference towards Mushroom products in Colombo Minicipal Council area. In the Proceedings of the 6th International Conference of SUSL. Srilanka: Sabargamuwa University.
Thilakaratna, S., & Pathirana, B. (2017). Present Status of Mushroom Cultivation in Kuruwita Division in the Ratnapura District of Sri Lanka. In the 3rd International Conference on Dry Zone Agriculture 2017. Srilanka: University of Jaffna.
Umar, H. Y., Otitolaiye, J. O., & Opaluwa, H. I. (2011). Evaluation of Acacia species (Gum Arabic) Market Structure, Conduct and Performance in Borno State Nigeria. Journal of Agriculture and Social Science, 7(2), 17–20.
USAID. (2008). Land market development in Kyrgyzstan: Analysis and recommendations. Retrieved from https://www.land-links.org/what-is-land-tenure/land-and-global-development-agenda/
Weisman, D. L. (2005). Assessing Market Power: The Trade-off Between Market Concentration and Multi-Market Participation. Journal of Competition Law & Economics, 1(2), 339–354.
Wijeratne, M., & De Silva, N. (2014). Mobile phone intervention for Sri Lankan mushroom producers. Asian Association of Open Universities Journal, 9(1), 57–63.
Wijesinghe, A., & Weerahewa, J. (2017). Structure, Conduct and Performance of the rice milling industry of Sri Lanka: Evidence from selected cases. Sri Lanka Journal of Economic Research, 4(2), 71–90.

19Amity Journal of Agribusiness
Volume 3 Issue 2 2018 AJAB
ADMAA
Authors’ Profile
K A D S Thilakarathne is a B.Sc graduate in Agricultural Sciences and Management specializing in Agribusiness Management, from the Sabaragamuwa University of Sri Lanka, Belihuloya, Sri Lanka. He is also a top CIMA finalist. He has conducted research on consumer demand for Mushrooms and usage of ICT in Agricultural Extension in Sri Lanka and has presented both in International and National Conferences.
P Sivashankar, presently serving as a Lecturer at the Department of Agribusiness Management, Faculty of Agricultural Sciences of the Sabaragamuwa University of Sri Lanka, Belihuloya, Sri Lanka. He holds an M.Phil in Agricultural Economics and B.Sc in Agricultural Technology and Management from the University of Peradeniya, Peradeniya, Sri Lanka. His research interests are Agricultural economics, Agribusiness management and consumer behavior. He has published several articles and presented in various national and international conferences during the past five years.