mushrooms - cornell universityusda.mannlib.cornell.edu/usda/nass/mush//2010s/2015/mush-08-20... ·...
TRANSCRIPT
Mushrooms
ISSN: 1949-1530
Released August 20, 2015, by the National Agricultural Statistics Service (NASS), Agricultural Statistics Board, United States Department of
Agriculture (USDA).
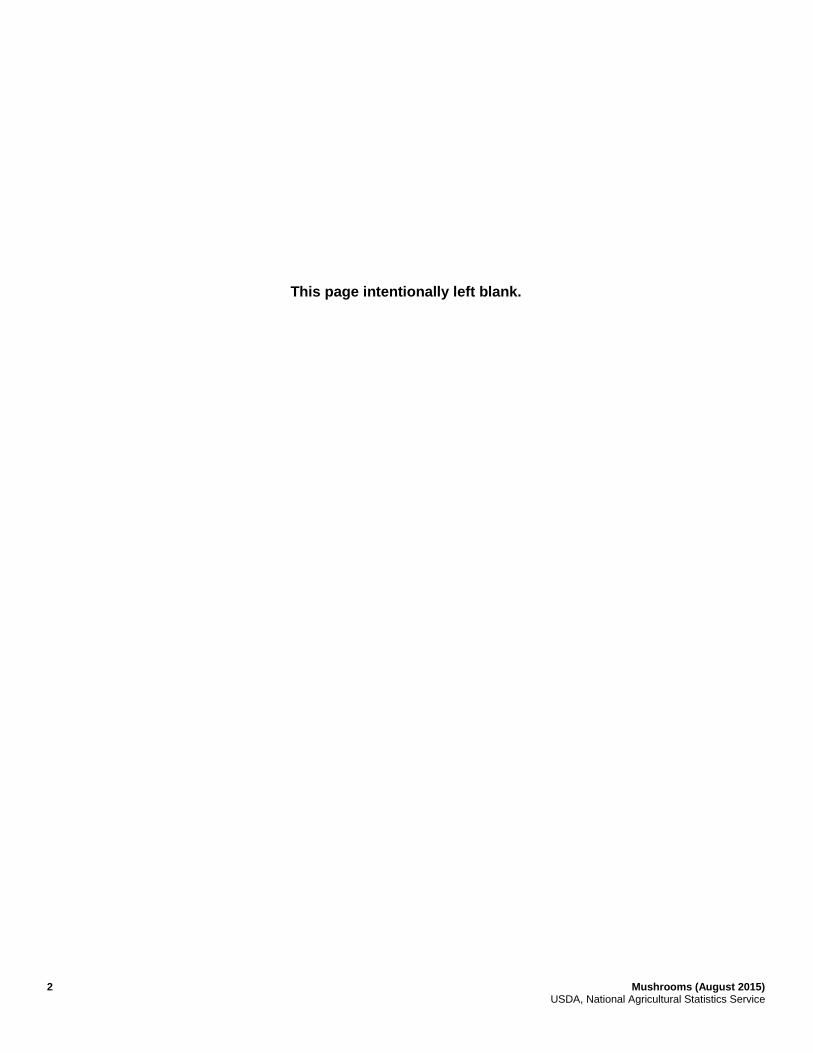
All Mushroom Value of Sales Approaches $1.23 Billion
Volume of sales of the 2014-2015 United States mushroom crop totaled 953 million pounds, up 6 percent from last
season. Value of sales for the 2014-2015 United States mushroom crop is $1.23 billion, up 10 percent from the previous
season. The number of growers, at 354, is up 9 from last season. The reported average price is $1.29 per pound, up 5 cents
from a year earlier.
Agaricus and Specialty Mushroom Number of Growers, Sales, Price, and Value – United States: 2012-2013, 2013-2014, and 2014-2015
Year Growers 1
All sales
Volume of sales
Price per pound
2
Value of sales
(number) (1,000 pounds) (dollars) (1,000 dollars)
2012-2013 ...................... 2013-2014 ...................... 2014-2015 ......................
304 345 354
888,252 899,833 952,619
1.240 1.240 1.290
1,103,886 1,115,628 1,227,973
1 Number of growers counted once if growing both Agaricus and specialty mushrooms.
2 Prices for mushrooms are the average prices producers receive at the point of first sale, commonly referred to as the average price as sold. For example, if in a given State, part of the fresh mushrooms are sold F.O.B. packed by growers, part are sold bulk to brokers or repackers, and some are sold retail at roadside stands, the mushroom average price as sold is a weighted average of the average price for each method of sale.
2 Mushrooms (August 2015) USDA, National Agricultural Statistics Service
This page intentionally left blank.
Mushrooms (August 2015) 3 USDA, National Agricultural Statistics Service
Contents
Agaricus Mushroom Area, Sales, Price, and Value – States, Regions, and United States: 2012-2013, 2013-2014,
and 2014-2015 ........................................................................................................................................................................ 4
Agaricus Mushroom Sales, Price, and Value by Utilization – States, Regions, and United States: 2012-2013,
2013-2014, and 2014-2015 ..................................................................................................................................................... 5
Agaricus Mushroom Number of Growers, Sales, Price, and Value – States, Regions, and United States:
2012-2013, 2013-2014, and 2014-2015 .................................................................................................................................. 6
Agaricus Mushroom Yield and Dollar Volume per Square Foot of Growing Area – States, Regions, and
United States: 2012-2013, 2013-2014, and 2014-2015 .......................................................................................................... 7
Brown Mushrooms (Portabello and Crimini) Number of Growers, Sales, and Value – Regions and United States:
2012-2013, 2013-2014, and 2014-2015 .................................................................................................................................. 7
Agaricus Mushroom Sales and Percent of Total – United States: 2005-2015 ........................................................................ 8
Agaricus Mushroom Volume of Sales – United States Chart ................................................................................................. 8
Agaricus Mushroom Price and Value by Utilization – United States: 2005-2015 ................................................................. 9
Agaricus Mushroom Value of Sales – United States Chart .................................................................................................... 9
Agaricus Mushroom Number of Growers, Area in Production, Yield, and Dollar Volume per Square Foot –
United States: 2005-2015 ...................................................................................................................................................... 10
Agaricus Mushroom Number of Growers – United States Chart ......................................................................................... 10
Agaricus Mushroom Growing Area Intended for Production by Utilization – States, Regions, and United States:
July 2015-June 2016 ............................................................................................................................................................. 11
Agaricus Mushroom Number of Growers by Sales Category – United States: 2013-2014 and 2014-2015 ......................... 11
Specialty Mushroom Number of Growers, Total Production, Volume of Sales, Price, and Value of Sales by
Variety – United States: 2012-2013, 2013-2014, and 2014-2015......................................................................................... 12
Specialty Mushroom Area in Production by Variety – United States: 2012-2013, 2013-2014, and 2014-2015 .................. 13
Mushroom Comments ........................................................................................................................................................... 14
Regional Mushroom Producing States Listing ..................................................................................................................... 15
Statistical Methodology ........................................................................................................................................................ 16
Information Contacts ............................................................................................................................................................ 16
4 Mushrooms (August 2015) USDA, National Agricultural Statistics Service
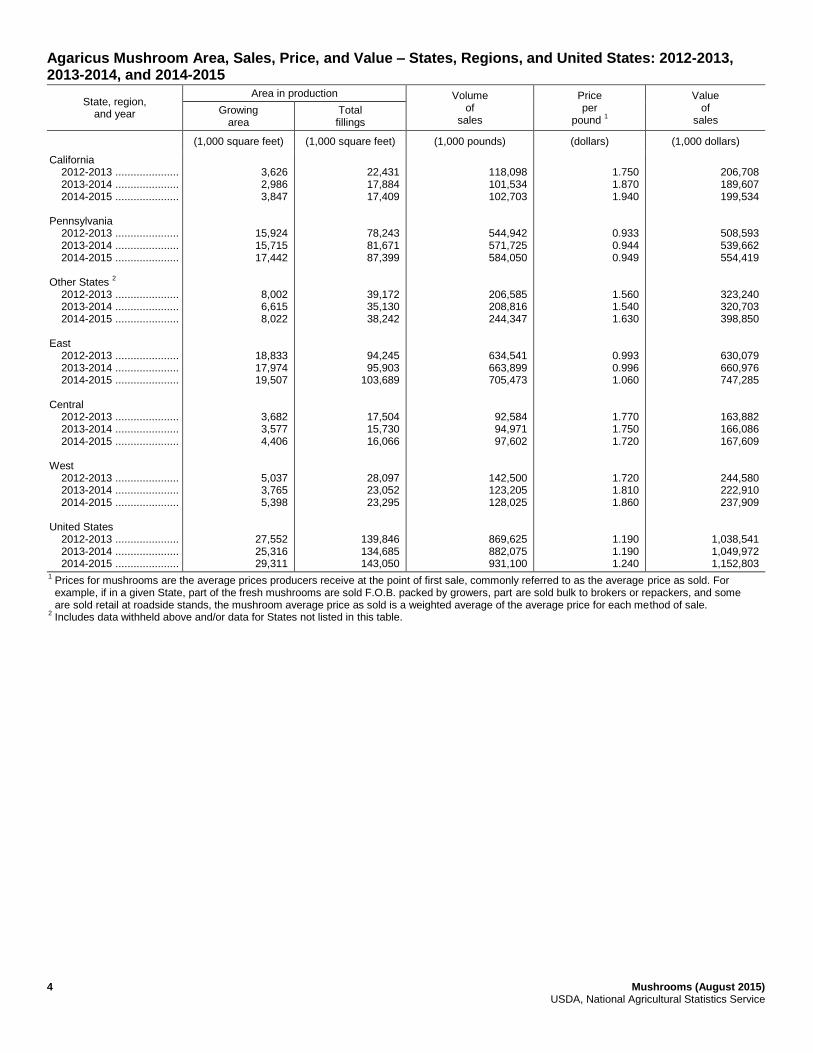
Agaricus Mushroom Area, Sales, Price, and Value – States, Regions, and United States: 2012-2013, 2013-2014, and 2014-2015
State, region, and year
Area in production Volume of
sales
Price per
pound 1
Value of
sales Growing
area Total fillings
(1,000 square feet) (1,000 square feet) (1,000 pounds) (dollars) (1,000 dollars)
California 2012-2013 ..................... 2013-2014 ..................... 2014-2015 ..................... Pennsylvania 2012-2013 ..................... 2013-2014 ..................... 2014-2015 ..................... Other States
2
2012-2013 ..................... 2013-2014 ..................... 2014-2015 ..................... East 2012-2013 ..................... 2013-2014 ..................... 2014-2015 ..................... Central 2012-2013 ..................... 2013-2014 ..................... 2014-2015 ..................... West 2012-2013 ..................... 2013-2014 ..................... 2014-2015 ..................... United States 2012-2013 ..................... 2013-2014 ..................... 2014-2015 .....................
3,626 2,986 3,847
15,924 15,715 17,442
8,002 6,615 8,022
18,833 17,974 19,507
3,682 3,577 4,406
5,037 3,765 5,398
27,552 25,316 29,311
22,431 17,884 17,409
78,243 81,671 87,399
39,172 35,130 38,242
94,245 95,903
103,689
17,504 15,730 16,066
28,097 23,052 23,295
139,846 134,685 143,050
118,098 101,534 102,703
544,942 571,725 584,050
206,585 208,816 244,347
634,541 663,899 705,473
92,584 94,971 97,602
142,500 123,205 128,025
869,625 882,075 931,100
1.750 1.870 1.940
0.933 0.944 0.949
1.560 1.540 1.630
0.993 0.996 1.060
1.770 1.750 1.720
1.720 1.810 1.860
1.190 1.190 1.240
206,708 189,607 199,534
508,593 539,662 554,419
323,240 320,703 398,850
630,079 660,976 747,285
163,882 166,086 167,609
244,580 222,910 237,909
1,038,541 1,049,972 1,152,803
1 Prices for mushrooms are the average prices producers receive at the point of first sale, commonly referred to as the average price as sold. For example, if in a given State, part of the fresh mushrooms are sold F.O.B. packed by growers, part are sold bulk to brokers or repackers, and some are sold retail at roadside stands, the mushroom average price as sold is a weighted average of the average price for each method of sale.
2 Includes data withheld above and/or data for States not listed in this table.
Mushrooms (August 2015) 5 USDA, National Agricultural Statistics Service
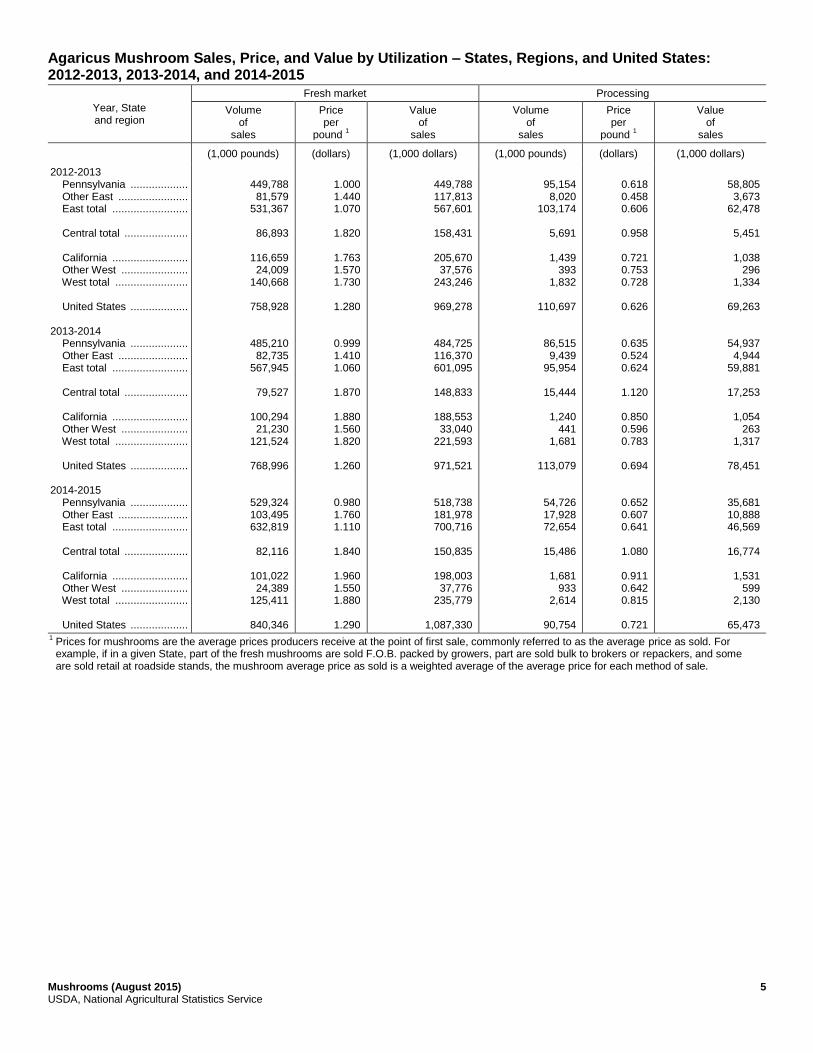
Agaricus Mushroom Sales, Price, and Value by Utilization – States, Regions, and United States: 2012-2013, 2013-2014, and 2014-2015
Year, State and region
Fresh market Processing
Volume of
sales
Price per
pound 1
Value of
sales
Volume of
sales
Price per
pound 1
Value of
sales
(1,000 pounds) (dollars) (1,000 dollars) (1,000 pounds) (dollars) (1,000 dollars)
2012-2013 Pennsylvania ................... Other East ....................... East total ......................... Central total ..................... California ......................... Other West ...................... West total ........................ United States ................... 2013-2014 Pennsylvania ................... Other East ....................... East total ......................... Central total ..................... California ......................... Other West ...................... West total ........................ United States ................... 2014-2015 Pennsylvania ................... Other East ....................... East total ......................... Central total ..................... California ......................... Other West ...................... West total ........................ United States ...................
449,788 81,579
531,367
86,893
116,659 24,009
140,668
758,928
485,210 82,735
567,945
79,527
100,294 21,230
121,524
768,996
529,324 103,495 632,819
82,116
101,022 24,389
125,411
840,346
1.000 1.440 1.070
1.820
1.763 1.570 1.730
1.280
0.999 1.410 1.060
1.870
1.880 1.560 1.820
1.260
0.980 1.760 1.110
1.840
1.960 1.550 1.880
1.290
449,788 117,813 567,601
158,431
205,670 37,576
243,246
969,278
484,725 116,370 601,095
148,833
188,553 33,040
221,593
971,521
518,738 181,978 700,716
150,835
198,003 37,776
235,779
1,087,330
95,154 8,020
103,174
5,691
1,439 393
1,832
110,697
86,515 9,439
95,954
15,444
1,240 441
1,681
113,079
54,726 17,928 72,654
15,486
1,681
933 2,614
90,754
0.618 0.458 0.606
0.958
0.721 0.753 0.728
0.626
0.635 0.524 0.624
1.120
0.850 0.596 0.783
0.694
0.652 0.607 0.641
1.080
0.911 0.642 0.815
0.721
58,805 3,673
62,478
5,451
1,038 296
1,334
69,263
54,937 4,944
59,881
17,253
1,054 263
1,317
78,451
35,681 10,888 46,569
16,774
1,531
599 2,130
65,473
1 Prices for mushrooms are the average prices producers receive at the point of first sale, commonly referred to as the average price as sold. For example, if in a given State, part of the fresh mushrooms are sold F.O.B. packed by growers, part are sold bulk to brokers or repackers, and some are sold retail at roadside stands, the mushroom average price as sold is a weighted average of the average price for each method of sale.
6 Mushrooms (August 2015) USDA, National Agricultural Statistics Service
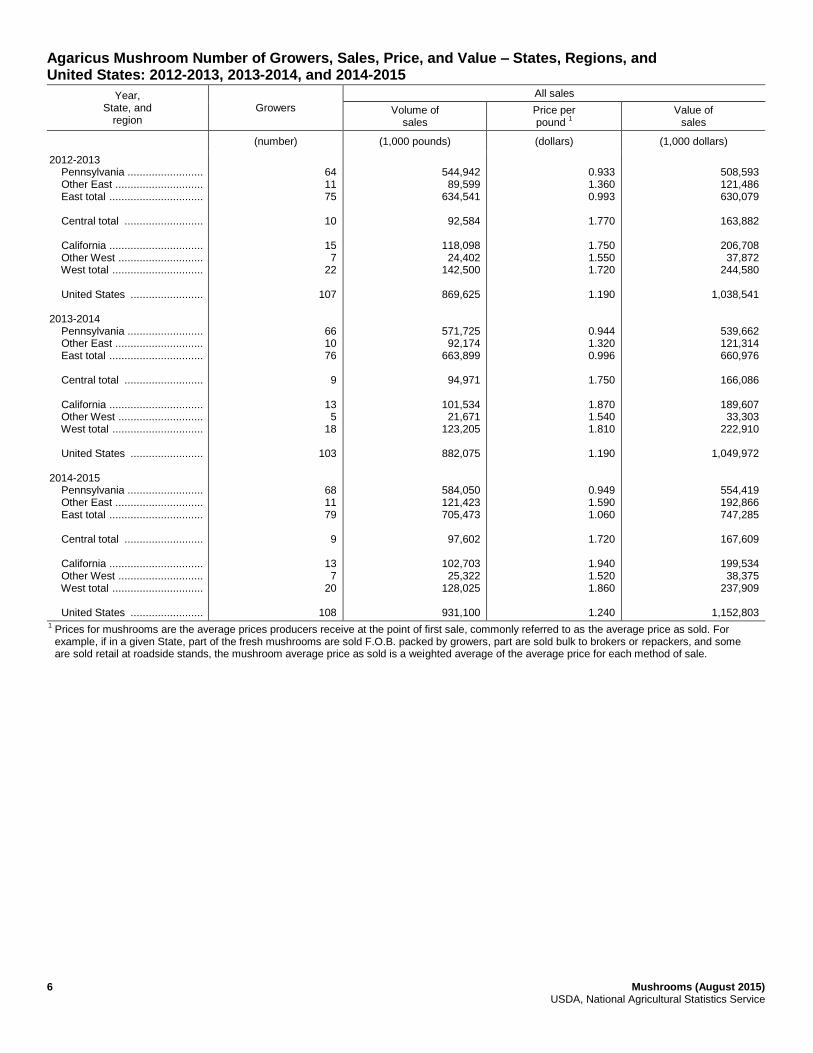
Agaricus Mushroom Number of Growers, Sales, Price, and Value – States, Regions, and United States: 2012-2013, 2013-2014, and 2014-2015
Year, State, and
region Growers
All sales
Volume of sales
Price per pound
1
Value of sales
(number) (1,000 pounds) (dollars) (1,000 dollars)
2012-2013 Pennsylvania ......................... Other East ............................. East total ............................... Central total .......................... California ............................... Other West ............................ West total .............................. United States ........................ 2013-2014 Pennsylvania ......................... Other East ............................. East total ............................... Central total .......................... California ............................... Other West ............................ West total .............................. United States ........................ 2014-2015 Pennsylvania ......................... Other East ............................. East total ............................... Central total .......................... California ............................... Other West ............................ West total .............................. United States ........................
64 11 75
10
15 7
22
107
66 10 76
9
13 5
18
103
68 11 79
9
13 7
20
108
544,942 89,599
634,541
92,584
118,098 24,402
142,500
869,625
571,725 92,174
663,899
94,971
101,534 21,671
123,205
882,075
584,050 121,423 705,473
97,602
102,703 25,322
128,025
931,100
0.933 1.360 0.993
1.770
1.750 1.550 1.720
1.190
0.944 1.320 0.996
1.750
1.870 1.540 1.810
1.190
0.949 1.590 1.060
1.720
1.940 1.520 1.860
1.240
508,593 121,486 630,079
163,882
206,708 37,872
244,580
1,038,541
539,662 121,314 660,976
166,086
189,607 33,303
222,910
1,049,972
554,419 192,866 747,285
167,609
199,534 38,375
237,909
1,152,803 1 Prices for mushrooms are the average prices producers receive at the point of first sale, commonly referred to as the average price as sold. For example, if in a given State, part of the fresh mushrooms are sold F.O.B. packed by growers, part are sold bulk to brokers or repackers, and some are sold retail at roadside stands, the mushroom average price as sold is a weighted average of the average price for each method of sale.
Mushrooms (August 2015) 7 USDA, National Agricultural Statistics Service
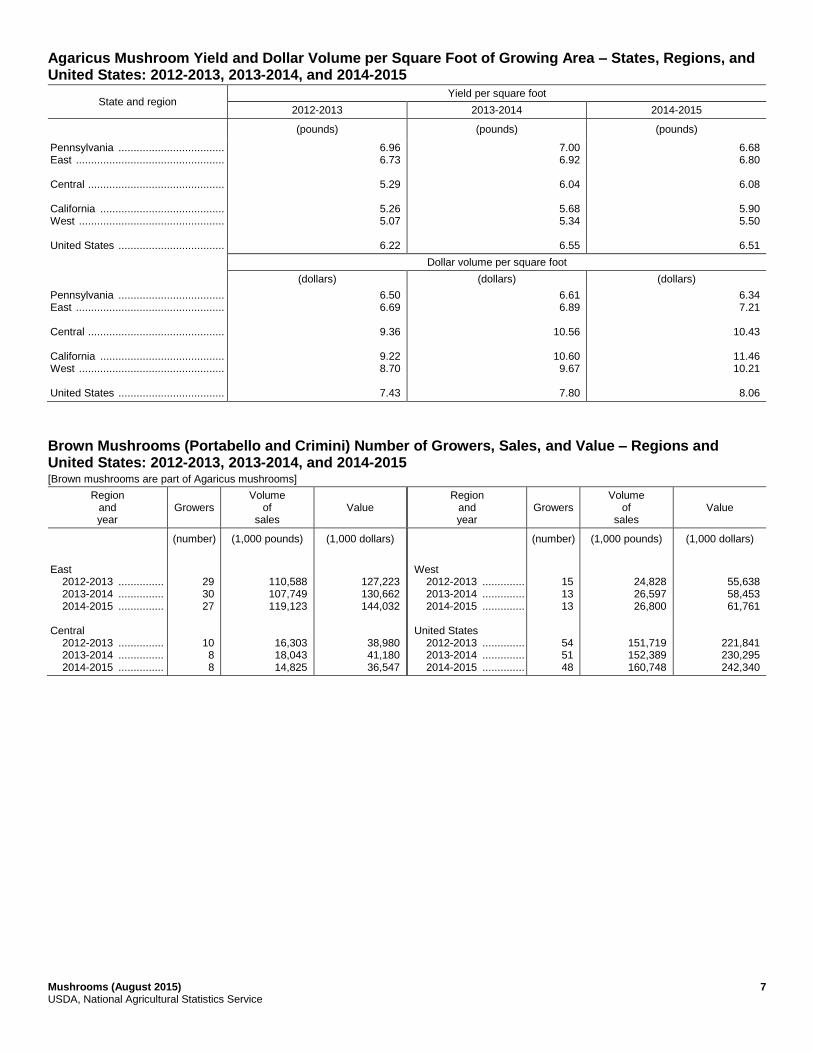
Agaricus Mushroom Yield and Dollar Volume per Square Foot of Growing Area – States, Regions, and United States: 2012-2013, 2013-2014, and 2014-2015
State and region Yield per square foot
2012-2013 2013-2014 2014-2015
(pounds) (pounds) (pounds)
Pennsylvania ................................... East ................................................. Central ............................................. California ......................................... West ................................................ United States ...................................
6.96 6.73
5.29
5.26 5.07
6.22
7.00 6.92
6.04
5.68 5.34
6.55
6.68 6.80
6.08
5.90 5.50
6.51
Dollar volume per square foot
(dollars) (dollars) (dollars)
Pennsylvania ................................... East ................................................. Central ............................................. California ......................................... West ................................................ United States ...................................
6.50 6.69
9.36
9.22 8.70
7.43
6.61 6.89
10.56
10.60 9.67
7.80
6.34 7.21
10.43
11.46 10.21
8.06
Brown Mushrooms (Portabello and Crimini) Number of Growers, Sales, and Value – Regions and United States: 2012-2013, 2013-2014, and 2014-2015 [Brown mushrooms are part of Agaricus mushrooms]
Region and year
Growers Volume
of sales
Value Region
and year
Growers Volume
of sales
Value
(number) (1,000 pounds) (1,000 dollars) (number) (1,000 pounds) (1,000 dollars)
East 2012-2013 ............... 2013-2014 ............... 2014-2015 ............... Central 2012-2013 ............... 2013-2014 ............... 2014-2015 ...............
29 30 27
10 8 8
110,588 107,749 119,123
16,303 18,043 14,825
127,223 130,662 144,032
38,980 41,180 36,547
West 2012-2013 .............. 2013-2014 .............. 2014-2015 .............. United States 2012-2013 .............. 2013-2014 .............. 2014-2015 ..............
15 13 13
54 51 48
24,828 26,597 26,800
151,719 152,389 160,748
55,638 58,453 61,761
221,841 230,295 242,340
8 Mushrooms (August 2015) USDA, National Agricultural Statistics Service
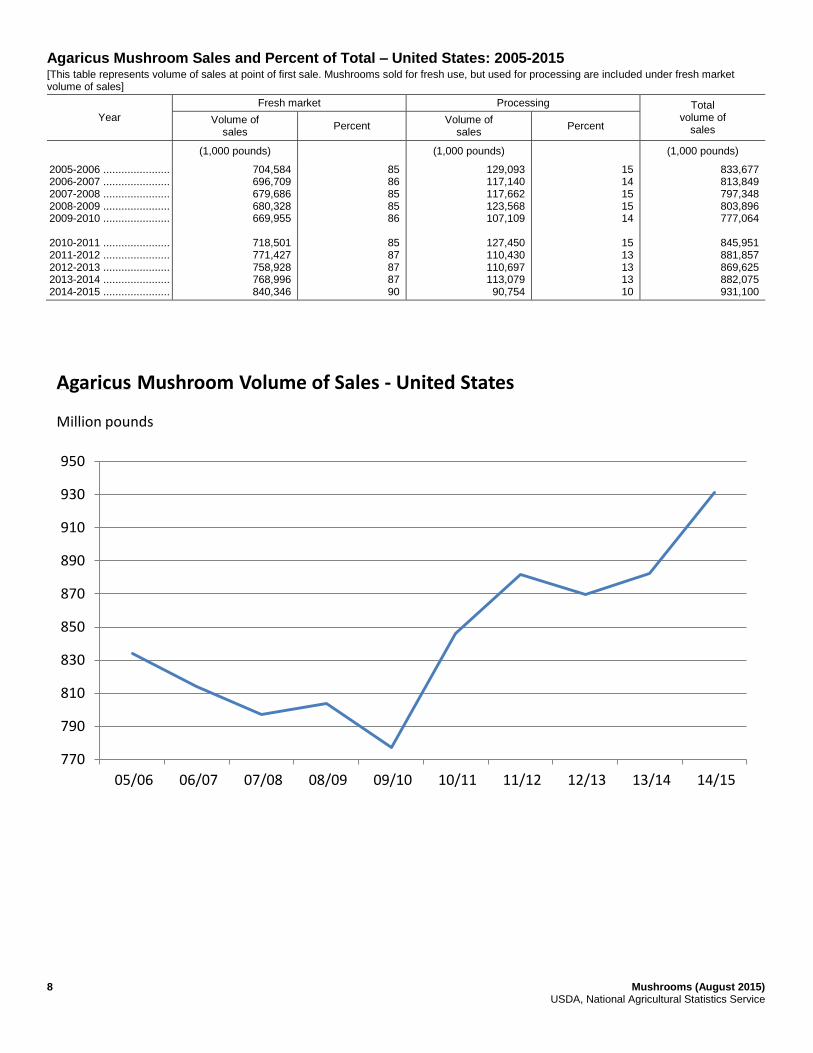
Agaricus Mushroom Sales and Percent of Total – United States: 2005-2015 [This table represents volume of sales at point of first sale. Mushrooms sold for fresh use, but used for processing are included under fresh market volume of sales]
Year
Fresh market Processing Total volume of
sales Volume of
sales Percent
Volume of sales
Percent
(1,000 pounds) (1,000 pounds) (1,000 pounds)
2005-2006 ...................... 2006-2007 ...................... 2007-2008 ...................... 2008-2009 ...................... 2009-2010 ...................... 2010-2011 ...................... 2011-2012 ...................... 2012-2013 ...................... 2013-2014 ...................... 2014-2015 ......................
704,584 696,709 679,686 680,328 669,955
718,501 771,427 758,928 768,996 840,346
85 86 85 85 86
85 87 87 87 90
129,093 117,140 117,662 123,568 107,109
127,450 110,430 110,697 113,079 90,754
15 14 15 15 14
15 13 13 13 10
833,677 813,849 797,348 803,896 777,064
845,951 881,857 869,625 882,075 931,100
770
790
810
830
850
870
890
910
930
950
05/06 06/07 07/08 08/09 09/10 10/11 11/12 12/13 13/14 14/15
Agaricus Mushroom Volume of Sales - United States
Million pounds
Mushrooms (August 2015) 9 USDA, National Agricultural Statistics Service
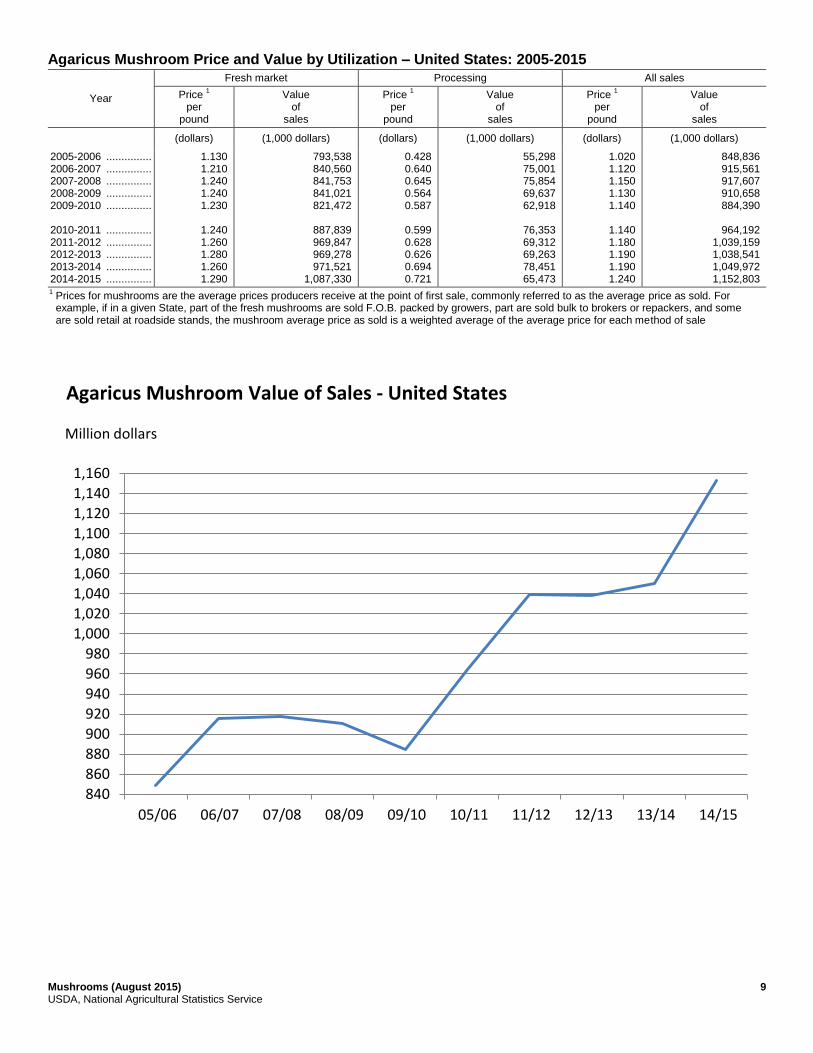
Agaricus Mushroom Price and Value by Utilization – United States: 2005-2015
Year
Fresh market Processing All sales
Price 1
per pound
Value of
sales
Price 1
per pound
Value of
sales
Price 1
per pound
Value of
sales
(dollars) (1,000 dollars) (dollars) (1,000 dollars) (dollars) (1,000 dollars)
2005-2006 ............... 2006-2007 ............... 2007-2008 ............... 2008-2009 ............... 2009-2010 ............... 2010-2011 ............... 2011-2012 ............... 2012-2013 ............... 2013-2014 ............... 2014-2015 ...............
1.130 1.210 1.240 1.240 1.230
1.240 1.260 1.280 1.260 1.290
793,538 840,560 841,753 841,021 821,472
887,839 969,847 969,278 971,521
1,087,330
0.428 0.640 0.645 0.564 0.587
0.599 0.628 0.626 0.694 0.721
55,298 75,001 75,854 69,637 62,918
76,353 69,312 69,263 78,451 65,473
1.020 1.120 1.150 1.130 1.140
1.140 1.180 1.190 1.190 1.240
848,836 915,561 917,607 910,658 884,390
964,192
1,039,159 1,038,541 1,049,972 1,152,803
1 Prices for mushrooms are the average prices producers receive at the point of first sale, commonly referred to as the average price as sold. For example, if in a given State, part of the fresh mushrooms are sold F.O.B. packed by growers, part are sold bulk to brokers or repackers, and some are sold retail at roadside stands, the mushroom average price as sold is a weighted average of the average price for each method of sale
840
860
880
900
920
940
960
980
1,000
1,020
1,040
1,060
1,080
1,100
1,120
1,140
1,160
05/06 06/07 07/08 08/09 09/10 10/11 11/12 12/13 13/14 14/15
Agaricus Mushroom Value of Sales - United States
Million dollars
10 Mushrooms (August 2015) USDA, National Agricultural Statistics Service
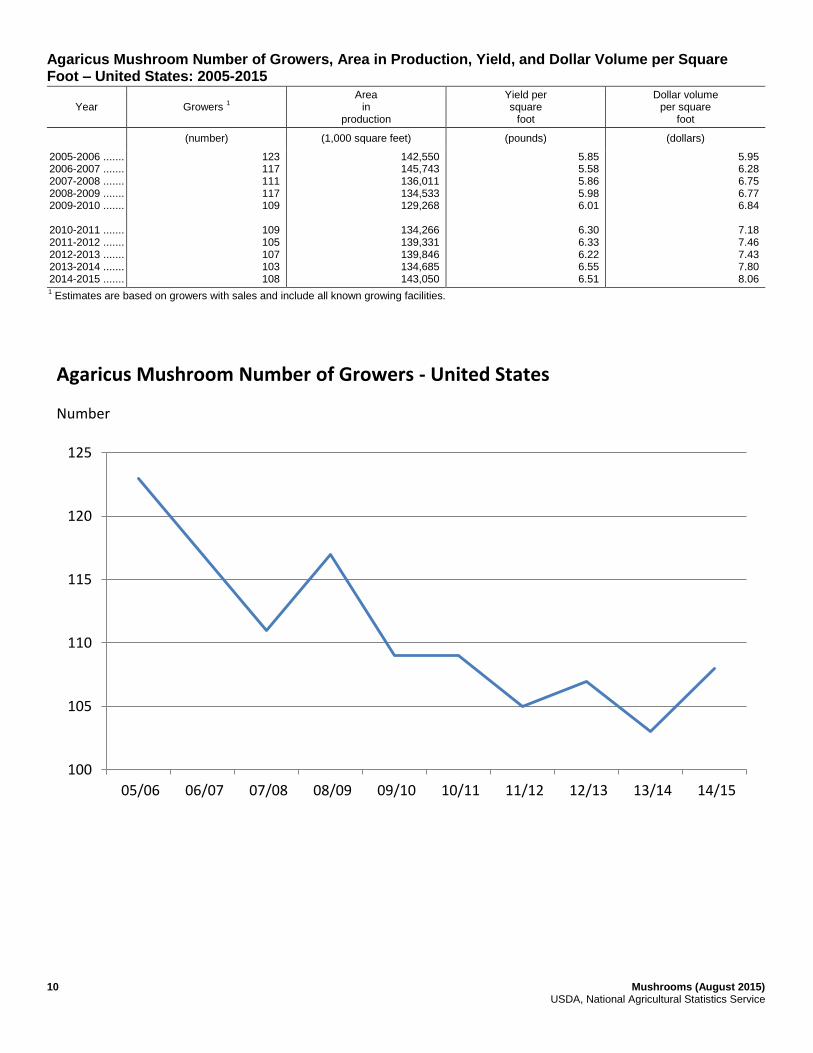
Agaricus Mushroom Number of Growers, Area in Production, Yield, and Dollar Volume per Square Foot – United States: 2005-2015
Year Growers 1
Area in
production
Yield per square
foot
Dollar volume per square
foot
(number) (1,000 square feet) (pounds) (dollars)
2005-2006 ....... 2006-2007 ....... 2007-2008 ....... 2008-2009 ....... 2009-2010 ....... 2010-2011 ....... 2011-2012 ....... 2012-2013 ....... 2013-2014 ....... 2014-2015 .......
123 117 111 117 109
109 105 107 103 108
142,550 145,743 136,011 134,533 129,268
134,266 139,331 139,846 134,685 143,050
5.85 5.58 5.86 5.98 6.01
6.30 6.33 6.22 6.55 6.51
5.95 6.28 6.75 6.77 6.84
7.18 7.46 7.43 7.80 8.06
1 Estimates are based on growers with sales and include all known growing facilities.
100
105
110
115
120
125
05/06 06/07 07/08 08/09 09/10 10/11 11/12 12/13 13/14 14/15
Agaricus Mushroom Number of Growers - United States
Number

Mushrooms (August 2015) 11 USDA, National Agricultural Statistics Service
Agaricus Mushroom Growing Area Intended for Production by Utilization – States, Regions, and United States: July 2015-June 2016
State and region
Intentions July 2015 - June 2016
Fresh market
Processed market
Total fillings
Percent of last year
(1,000 square feet) (1,000 square feet) (1,000 square feet) (percent)
California ...................................... Pennsylvania ................................ Other States
1 ...............................
East .............................................. Central .......................................... West ............................................. United States ................................
(D) (D)
137,630
94,973
(D)
(D)
137,630
(D) (D)
10,813
10,792
(D)
(D)
10,813
17,332 89,593
41,518
105,765
19,455
23,223
148,443
100 103
109
102
121
100
104
(D) Withheld to avoid disclosing data for individual operations. 1
Includes data withheld above and/or data for States not listed in this table.
Agaricus Mushroom Number of Growers by Sales Category – United States: 2013-2014 and 2014-2015
Sales categories (million pounds)
Number of growers
2013-2014 2014-2015
(number) (number)
Over 20.0 .................................................................................. 10.0 - 19.9 ................................................................................ 5.0 - 9.9 .................................................................................... 2.5 - 4.9 .................................................................................... 1.0 - 2.4 .................................................................................... 0.5 - 1.0 .................................................................................... Less than 0.5 ............................................................................ Total .........................................................................................
11 20 16 15 21 5
15
103
13 15 18 17 19 4
22
108
12 Mushrooms (August 2015) USDA, National Agricultural Statistics Service
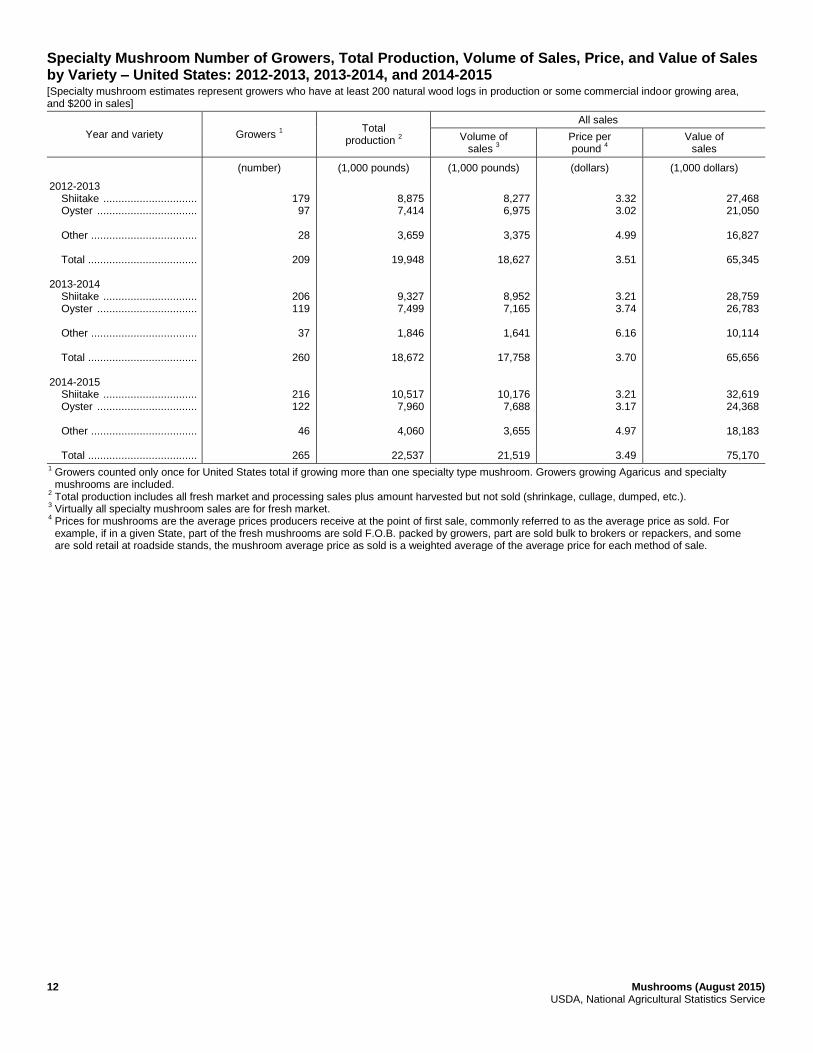
Specialty Mushroom Number of Growers, Total Production, Volume of Sales, Price, and Value of Sales by Variety – United States: 2012-2013, 2013-2014, and 2014-2015 [Specialty mushroom estimates represent growers who have at least 200 natural wood logs in production or some commercial indoor growing area, and $200 in sales]
Year and variety Growers 1
Total production
2
All sales
Volume of sales
3
Price per pound
4
Value of sales
(number) (1,000 pounds) (1,000 pounds) (dollars) (1,000 dollars)
2012-2013 Shiitake ............................... Oyster ................................. Other ................................... Total .................................... 2013-2014 Shiitake ............................... Oyster ................................. Other ................................... Total .................................... 2014-2015 Shiitake ............................... Oyster ................................. Other ................................... Total ....................................
179 97
28
209
206 119
37
260
216 122
46
265
8,875 7,414
3,659
19,948
9,327 7,499
1,846
18,672
10,517 7,960
4,060
22,537
8,277 6,975
3,375
18,627
8,952 7,165
1,641
17,758
10,176 7,688
3,655
21,519
3.32 3.02
4.99
3.51
3.21 3.74
6.16
3.70
3.21 3.17
4.97
3.49
27,468 21,050
16,827
65,345
28,759 26,783
10,114
65,656
32,619 24,368
18,183
75,170
1 Growers counted only once for United States total if growing more than one specialty type mushroom. Growers growing Agaricus and specialty mushrooms are included.
2 Total production includes all fresh market and processing sales plus amount harvested but not sold (shrinkage, cullage, dumped, etc.).
3 Virtually all specialty mushroom sales are for fresh market.
4 Prices for mushrooms are the average prices producers receive at the point of first sale, commonly referred to as the average price as sold. For example, if in a given State, part of the fresh mushrooms are sold F.O.B. packed by growers, part are sold bulk to brokers or repackers, and some are sold retail at roadside stands, the mushroom average price as sold is a weighted average of the average price for each method of sale.
Mushrooms (August 2015) 13 USDA, National Agricultural Statistics Service
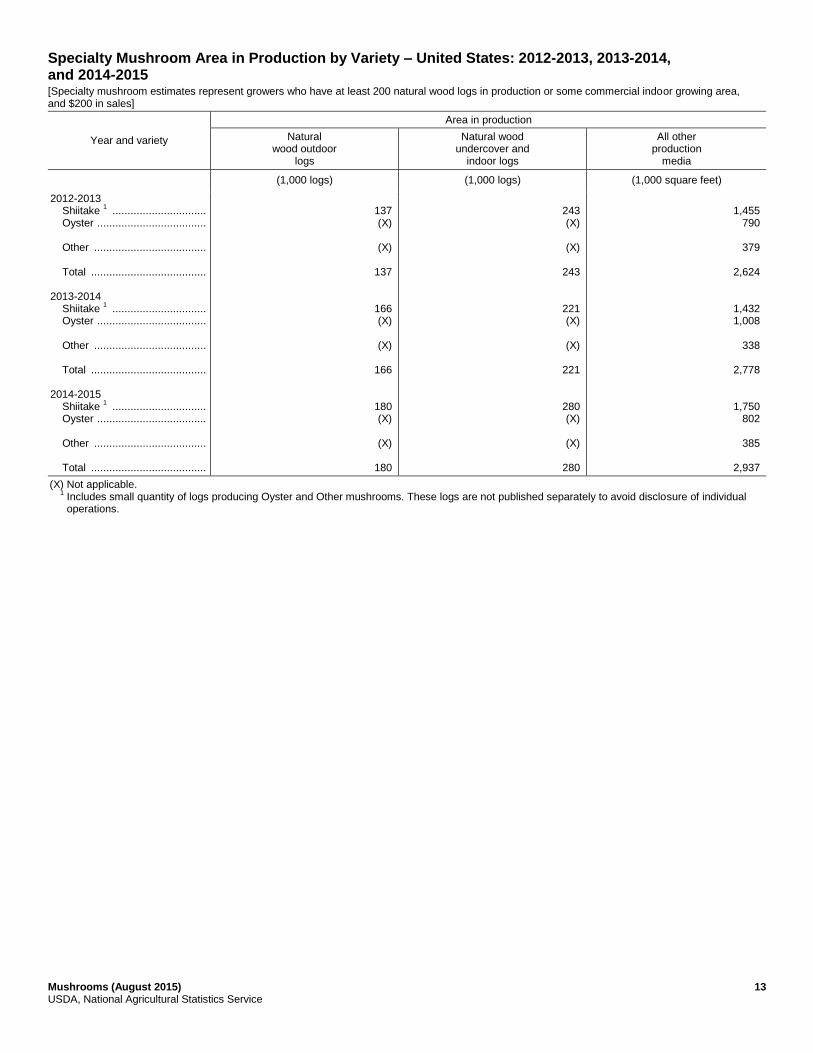
Specialty Mushroom Area in Production by Variety – United States: 2012-2013, 2013-2014, and 2014-2015 [Specialty mushroom estimates represent growers who have at least 200 natural wood logs in production or some commercial indoor growing area, and $200 in sales]
Year and variety
Area in production
Natural wood outdoor
logs
Natural wood undercover and
indoor logs
All other production
media
(1,000 logs) (1,000 logs) (1,000 square feet)
2012-2013 Shiitake
1 ...............................
Oyster .................................... Other ..................................... Total ...................................... 2013-2014 Shiitake
1 ...............................
Oyster .................................... Other ..................................... Total ...................................... 2014-2015 Shiitake
1 ...............................
Oyster .................................... Other ..................................... Total ......................................
137 (X)
(X)
137
166 (X)
(X)
166
180 (X)
(X)
180
243 (X)
(X)
243
221 (X)
(X)
221
280 (X)
(X)
280
1,455
790
379
2,624
1,432 1,008
338
2,778
1,750 802
385
2,937
(X) Not applicable. 1
Includes small quantity of logs producing Oyster and Other mushrooms. These logs are not published separately to avoid disclosure of individual operations.
14 Mushrooms (August 2015) USDA, National Agricultural Statistics Service
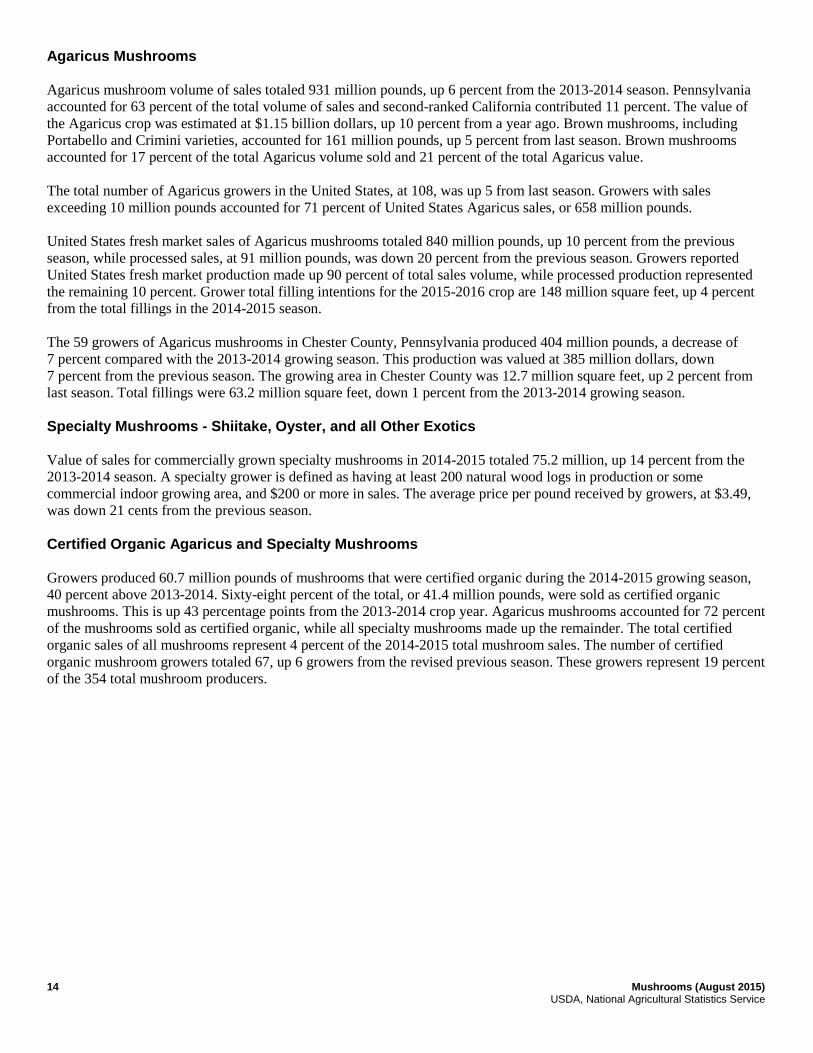
Agaricus Mushrooms
Agaricus mushroom volume of sales totaled 931 million pounds, up 6 percent from the 2013-2014 season. Pennsylvania
accounted for 63 percent of the total volume of sales and second-ranked California contributed 11 percent. The value of
the Agaricus crop was estimated at $1.15 billion dollars, up 10 percent from a year ago. Brown mushrooms, including
Portabello and Crimini varieties, accounted for 161 million pounds, up 5 percent from last season. Brown mushrooms
accounted for 17 percent of the total Agaricus volume sold and 21 percent of the total Agaricus value.
The total number of Agaricus growers in the United States, at 108, was up 5 from last season. Growers with sales
exceeding 10 million pounds accounted for 71 percent of United States Agaricus sales, or 658 million pounds.
United States fresh market sales of Agaricus mushrooms totaled 840 million pounds, up 10 percent from the previous
season, while processed sales, at 91 million pounds, was down 20 percent from the previous season. Growers reported
United States fresh market production made up 90 percent of total sales volume, while processed production represented
the remaining 10 percent. Grower total filling intentions for the 2015-2016 crop are 148 million square feet, up 4 percent
from the total fillings in the 2014-2015 season.
The 59 growers of Agaricus mushrooms in Chester County, Pennsylvania produced 404 million pounds, a decrease of
7 percent compared with the 2013-2014 growing season. This production was valued at 385 million dollars, down
7 percent from the previous season. The growing area in Chester County was 12.7 million square feet, up 2 percent from
last season. Total fillings were 63.2 million square feet, down 1 percent from the 2013-2014 growing season.
Specialty Mushrooms - Shiitake, Oyster, and all Other Exotics
Value of sales for commercially grown specialty mushrooms in 2014-2015 totaled 75.2 million, up 14 percent from the
2013-2014 season. A specialty grower is defined as having at least 200 natural wood logs in production or some
commercial indoor growing area, and $200 or more in sales. The average price per pound received by growers, at $3.49,
was down 21 cents from the previous season.
Certified Organic Agaricus and Specialty Mushrooms
Growers produced 60.7 million pounds of mushrooms that were certified organic during the 2014-2015 growing season,
40 percent above 2013-2014. Sixty-eight percent of the total, or 41.4 million pounds, were sold as certified organic
mushrooms. This is up 43 percentage points from the 2013-2014 crop year. Agaricus mushrooms accounted for 72 percent
of the mushrooms sold as certified organic, while all specialty mushrooms made up the remainder. The total certified
organic sales of all mushrooms represent 4 percent of the 2014-2015 total mushroom sales. The number of certified
organic mushroom growers totaled 67, up 6 growers from the revised previous season. These growers represent 19 percent
of the 354 total mushroom producers.

Mushrooms (August 2015) 15 USDA, National Agricultural Statistics Service
Regional Mushroom Producing States Listing Regional Agaricus Mushroom Producing States
East: Delaware, Florida, Maryland, New York, Pennsylvania, and Tennessee.
Central: Illinois, Louisiana, Missouri, Oklahoma, Texas, and Wisconsin.
West: California, Colorado, Hawaii, Oregon, Utah, and Washington.
Regional Specialty Mushroom Producing States
East: Connecticut, Florida, Georgia, Kentucky, Maine, Maryland, Massachusetts, New Hampshire, New Jersey,
New York, North Carolina, Pennsylvania, Rhode Island, South Carolina, Tennessee, Vermont, Virginia, and
West Virginia.
Central: Illinois, Kansas, Louisiana, Michigan, Minnesota, Mississippi, Missouri, Nebraska, Ohio, Texas, and Wisconsin.
West: Alaska, Arkansas, California, Colorado, Hawaii, Montana, New Mexico, Oregon, Utah, and Washington.
16 Mushrooms (August 2015) USDA, National Agricultural Statistics Service
Statistical Methodology Survey procedures: Grower surveys are conducted in preparation for this report. All known commercial mushroom
producers are contacted utilizing mail, telephone, and personal enumeration. Unless other specific arrangements are made,
data collection for multi-State operations is conducted by the State in which the firm's headquarters is located. Information
is collected for Agaricus (including White Button, Crimini, and Portabello) and specialty mushrooms.
Estimating procedures: Information obtained from the mushroom grower surveys is used to establish estimates of
number of growers, area in production, yield per square foot, utilization, volume of sales, average price per pound, and
value of sales. Estimates are also prepared for the total amount of mushrooms grown as certified organic, quantity sold
from mushrooms certified as organically produced and the number of certified organic growers.
Revision policy: All mushroom estimates, except intentions, are subject to revision the following year based on a
thorough review of all available data.
Reliability: The mushrooms grower surveys are subject to non-sampling errors, such as omissions, duplication, and
mistakes in reporting, recording, and processing the data. These errors cannot be measured directly, but are minimized
through rigid quality controls in the data collection process and a careful review of all reported data for consistency and
reasonableness.
Information Contacts
Listed below are the commodity statisticians in the Crops Branch of the National Agricultural Statistics Service to contact
for additional information. E-mail inquiries may be sent to [email protected]
Lance Honig, Chief, Crops Branch ....................................................................................................... (202) 720-2127
Jorge Garcia-Pratts, Head, Fruits, Vegetables and Special Crops Section ............................................ (202) 720-2127
Vincent Davis – Fresh and Processing Vegetables, Onions, Strawberries, Cherries ....................... (202) 720-2157
Fleming Gibson – Citrus, Coffee, Grapes, Sugar Crops, Tropical Fruits ........................................ (202) 720-5412
Greg Lemmons – Berries, Cranberries, Potatoes, Sweet Potatoes .................................................. (202) 720-4285
Dave Losh – Hops ............................................................................................................................ (360) 709-2400
Dan Norris – Austrian Winter Peas, Dry Edible Peas, Lentils, Mint,
Mushrooms, Peaches, Pears, Wrinkled Seed Peas, Dry Beans .................................................. (202) 720-3250
Daphne Schauber – Floriculture, Maple Syrup, Nursery, Tree Nuts .............................................. (202) 720-4215
Chris Singh – Apples, Apricots, Plums, Prunes, Tobacco .............................................................. (202) 720-4288
Access to NASS Reports For your convenience, you may access NASS reports and products the following ways:
All reports are available electronically, at no cost, on the NASS web site: http://www.nass.usda.gov
Both national and state specific reports are available via a free e-mail subscription. To set-up this free
subscription, visit http://www.nass.usda.gov and in the “Follow NASS” box under “Receive reports by Email,”
click on “National” or “State” to select the reports you would like to receive.
For more information on NASS surveys and reports, call the NASS Agricultural Statistics Hotline at (800) 727-9540,
7:30 a.m. to 4:00 p.m. ET, or e-mail: [email protected].
The U.S. Department of Agriculture (USDA) prohibits discrimination against its customers, employees, and applicants for
employment on the basis of race, color, national origin, age, disability, sex, gender identity, religion, reprisal, and where
applicable, political beliefs, marital status, familial or parental status, sexual orientation, or all or part of an individual's
income is derived from any public assistance program, or protected genetic information in employment or in any program
or activity conducted or funded by the Department. (Not all prohibited bases will apply to all programs and/or
employment activities.)
If you wish to file a Civil Rights program complaint of discrimination, complete the USDA Program Discrimination
Complaint Form (PDF), found online at http://www.ascr.usda.gov/complaint_filing_cust.html, or at any USDA office, or
call (866) 632-9992 to request the form. You may also write a letter containing all of the information requested in the
form. Send your completed complaint form or letter to us by mail at U.S. Department of Agriculture, Director, Office of
Adjudication, 1400 Independence Avenue, S.W., Washington, D.C. 20250-9410, by fax (202) 690-7442 or email at

USDA NASS Data Users’ Meeting Wednesday, October 28, 2015
University of Chicago – Gleacher Center
450 North Cityfront Plaza Drive
Chicago, Illinois 60611
312-464-8787
The USDA’s National Agricultural Statistics Service will be organizing an
open forum for data users. The purpose will be to provide updates on
pending changes in the various statistical and information programs and seek comments and input from
data users. Other USDA agencies to be represented
will include the Agricultural Marketing Service, the Economic Research Service,
the Foreign Agricultural Service, and the World Agricultural Outlook Board.
The Foreign Trade Division from the Census Bureau will also be included in the meeting.
For registration details or additional information for the Data Users’ Meeting,
see the NASS homepage at http://www.nass.usda.gov/meeting/ or contact Tina Hall (NASS) at 202-720-
3896 or at [email protected] .
This Data Users’ Meeting precedes the Industry Outlook Conference that will be held at the same
location on Thursday, October 29, 2015. The outlook meeting brings together analysts from various
commodity sectors to discuss the outlook situation. For registration details or additional information for
the Industry Outlook Conference, see the conference webpage on the LMIC website:
http://lmic.info/page/meetings. For more information, contact James Robb at (303) 716-9933.