myers industries, inc. investor...
TRANSCRIPT
Myers Industries, Inc.
Investor Presentation
November 2013

Forward Looking Statements
2
Statements in this presentation concerning the Company’s goals, strategies, and expectations for business and financial results
may be "forward-looking statements" within the meaning of the Private Securities Litigation Reform Act of 1995 and are based on
current indicators and expectations. Whenever you read a statement that is not simply a statement of historical fact (such as when
we describe what we "believe," "expect," or "anticipate" will occur, and other similar statements), you must remember that our
expectations may not be correct, even though we believe they are reasonable. We do not guarantee that the transactions and
events described will happen as described (or that they will happen at all). You should review this presentation with the
understanding that actual future results may be materially different from what we expect. Many of the factors that will determine
these results are beyond our ability to control or predict. You are cautioned not to put undue reliance on any forward-looking
statement. We do not intend, and undertake no obligation, to update these forward-looking statements. These statements involve
a number of risks and uncertainties that could cause actual results to differ materially from those expressed or implied in the
applicable statements. Such risks include:
(1) Fluctuations in product demand and market acceptance
(2) Uncertainties associated with the general economic conditions in domestic and international markets
(3) Increased competition in our markets
(4) Changes in seasonality
(5) Difficulties in manufacturing operations, such as production outages or maintenance programs
(6) Raw material availability
(7) Fluctuations in raw material costs; fluctuations outside the “normal” range of industry cycles
(8) Changes in laws and regulations and approvals and decisions of courts, regulators, and
governmental bodies
Myers Industries, Inc. encourages investors to learn more about these risk factors. A detailed
explanation of these factors is available in the Company’s publicly filed quarterly and annual reports,
which can be found online at www.myersindustries.com and at the SEC.gov web site.

Strategic Goals
Strategic & Financial Goals to Drive Shareholder Value
• Focus on industries that have strong, sustainable growth and profit potential
• Position our businesses to grow through new products, geographic expansion and acquisitions
• Invest within our five business growth platforms for value creation
• Maintain a strong and flexible balance sheet, providing funds for acquisitions and returns to shareholders
• Optimize Lawn & Garden with Phase 1 and Phase 2 projects
3
• Sales Growth > 1.5x GDP
• Gross Margin > 29%
• EPS Growth > 20% CAGR
• Free Cash Flow ≥ 100% of Net Income
• ROIC > Cost of Capital
• L&G to return Cost of Capital in 2015
Financial Goals

Company at a Glance
4
• NYSE: MYE • Founded in 1933 • Headquartered in Akron, OH • 3,378 employees • Diversified International
manufacturer of polymer products and wholesale distributor that operates in four segments
2012 Net Sales 2012 Adjusted EBIT

Business Segments
5
Po
lym
er
Pro
du
cts
D
istr
ibu
tio
n

Growth Platforms
6
Platform Segment Growth Recent
Acquisitions
Returnable Packaging
Material Handling
Drive conversions to reusable products through further penetration of food, liquid, bulk solids and agricultural
markets. Novel
Storage & Safety
Products
Material Handling
Further grow platform with acquisitions. Strengthen competitive advantage through distribution channels.
Jamco Products Inc.
Tire Repair & Retread Products
Engineered Products
Leverage product and customer expertise to grow niche market.
Specialty Molding
Engineered Products
Expand our capabilities to further grow our positions in Marine and RV.
Tire Supply Distribution
Distribution Grow through market reach, innovative products and
expanded global sourcing. Myers Tyre Supply
India Limited
We will continuously upgrade the value of Myers through disciplined portfolio management and a structured organization operating around market-based growth platforms:

AkroShelf
Innovative New Products 2013 Divider
Label Tab
32x30 Bulk Box
(Gen II) 640-lb
CheeseBox
Grower
Decorative
Containers
Decorative Products
for Retail
AirFlexx
Bendable
Air Valve
Angle Vu Label
Holder
Tiltview
Product Line
Novel Beverage
Crate
Myers Pneumatics Line
Redesigned
AkroBin Lids
TPMS
Program
Tool
7

Optimizing Lawn & Garden
• Second phase of Lawn & Garden Segment restructuring announced July 18, 2013 • Targeted to deliver annual profit improvement of approximately $8 million • Actions include closure of two plants and opening of a west coast plant to
position the segment for future growth • Pre-tax costs estimated to be approximately $15 million of which $3 million will
be non-cash costs
• Phase one of restructuring was announced February 13, 2013 • Product line simplification anticipated to yield annual profit improvement of
approximately $5 million • Pre-tax costs estimated to be approximately $2 million of which $1 million will
be non-cash costs
• Combined annual profit improvement of $13 million ($0.24 per share) from phases one and two of restructuring should enable the Lawn & Garden Segment to generate returns above the company’s cost of capital in 2015
8

$3.5 $3.5 $3.5
$5.0 $5.0
$8.0
$-
$2.0
$4.0
$6.0
$8.0
$10.0
$12.0
$14.0
$16.0
$18.0
2012 Adj. EBIT* 2012 Adj. EBIT* with Phase 1
2012 Adj. EBIT* with Phases 1&2
Lawn & Garden Pro Forma EBIT
Phase 2 Benefits
Phase 1 Benefits
2012 Adjusted Earnings Before Income Taxes (EBIT)
Optimizing Lawn & Garden
9
$Millions
Lawn & Garden 2012 identifiable assets $128.3M
Lawn & Garden 2012 pro forma adj. EBIT with all benefits $16.5M
Lawn & Garden 2012 pro forma pre-tax return with all benefits 13%
*See 2012 Reconciliation of Non-GAAP Financial Measures in appendix

Progress Towards Financial Goals
10
Metric Goal 2013 Sept YTD 2012
Sales Growth(1)
> 1.5x GDP 6.4% 4.7%
Gross Margin > 29% 27.3% 27.2%
EPS Growth(2)
>20% CAGR 42.8% 21.8%
Free Cash Flow ≥ 100% of Net Income 118% 113%
ROIC(3)
> 10% 11% 10%
Innovation / NPD(4)
>10% of Sales 6% 6%
Operations Excellence Savings 5% of COGS (gross) 2% 3%(1) Using real GDP forecasted and actual growth rates, 1.5x GDP growth = 2.4% and 3.3% for 2013 and 2012 respectively.
(2) 2013 EPS growth calculated using TTM (trailing twelve month) figures.
(3) ROIC = Net Operating Profit After Tax/(Debt + Equity); 2013 calculated using TTM figures.
(4) NPD = New Product Development calculation based on products/services introduced within the last three years.
Key Accomplishment Metrics

Strong & Flexible Balance Sheet
11
Note:
1) Net Debt-to-Capital ratio calculated as net debt/(net debt + equity).
Net Debt-to-Capital

Solid Cash Flow Generation
Our strong balance sheet and free cash flow generation position the Company well to make investments
12
Notes:
1) Free cash flow calculated as cash flow from continuing operations less capital expenditures.
$(Millions) Free Cash Flow

Balanced Approach to Capital Allocation
13
• New product development
• Acquisitions
• Dividends
• Share repurchases
• Debt reduction
2) Grow Shareholder Value
3) Return Capital to Shareholders
1) Maintain the Business
• Organic growth capital expenditures
• Process improvements

$0.19 $0.20 $0.20 $0.22 $0.24 $0.24 $0.26 $0.28$0.32
$0.36
$0.05
$0.10
$0.15
$0.20
$0.25
$0.30
$0.35
$0.40
2004 2005 2006 2007 2008 2009 2010 2011 2012 2013
Returning Cash to Shareholders
14
• Consistent Dividend Growth Dividends Paid
Notes: 1) Above adjusted for stock dividends and splits in 2000, 2001, 2002 and 2004. 2) In 2007 there was an additional special dividend (not shown above) of $0.28 or $9.9M accrued but not paid until 2008, resulting from a merger termination payment. 3) In 2012 there was an accelerated dividend paid in December that is not reflected above.
• Share repurchases • Spent $6M to buy back 363k shares September YTD 2013 • Spent $4M to buy back 300k shares in 2012 • Spent $20M to buy back 2M shares in 2011

Appendix
15

2012 Reconciliation of Non-GAAP Measures
16

Strategic Principles
17
• Generate strong financial results – EBITDA growth, Cash, ROIC
• Maintain a strong balance sheet
• Build industry leading decision-making tools across the business
• Ensure industry-best talent
• Make Myers’ training and development a competitive advantage
• Maintain highest standards in safety and productivity
• Ensure process for continuous quality, service and productivity
improvement
• Deliver next-generation products/services in high niche markets
• Utilize “Voice of the Customer” tools
• Market based strategic planning
• Structure the organization closer to the customer - decentralize
• Build and maintain processes to maximize customer input
• Lead our industries in service, quality and delivery
Customer
Dedication
Innovation
Operations
Excellence
Organization
Development
Financial
Strength
Key M
an
ag
em
en
t Cap
ab
ilities

Portfolio Evolution
18

Macro Indicators
19
Material Handling
MHEM (Material Handling Equipment) Index
(40.0)
(30.0)
(20.0)
(10.0)
0.0
10.0
20.0
30.0
40.0
50.0
2008 2009 2010 2011 2012 2013 2014
Material Handling Index Annual rate of change
Shipments Orders
Source: Material Handling Industry of America, Nov 2013 Forecast
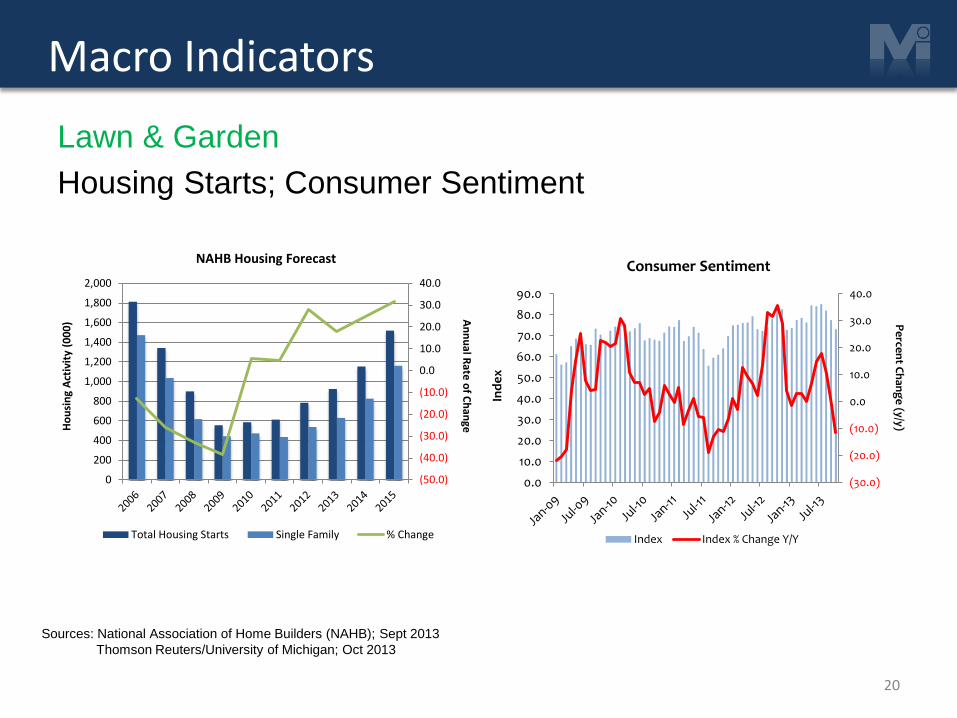
Sources: National Association of Home Builders (NAHB); Sept 2013
Thomson Reuters/University of Michigan; Oct 2013
Macro Indicators
20
Lawn & Garden
Housing Starts; Consumer Sentiment
(50.0)
(40.0)
(30.0)
(20.0)
(10.0)
0.0
10.0
20.0
30.0
40.0
0
200
400
600
800
1,000
1,200
1,400
1,600
1,800
2,000
An
nu
al Rate
of C
han
ge H
ou
sin
g A
ctiv
ity
(00
0)
NAHB Housing Forecast
Total Housing Starts Single Family % Change
0.0
10.0
20.0
30.0
40.0
50.0
60.0
70.0
80.0
90.0
(30.0)
(20.0)
(10.0)
0.0
10.0
20.0
30.0
40.0
Ind
ex
Pe
rcen
t Ch
ang
e (y/y)
Consumer Sentiment
Index Index % Change Y/Y

Macro Indicators
21
Distribution
Replacement Tire Shipments; Miles Driven; Fuel Prices
Source: JP Morgan, RMA, Energy Information Administration
-8.00%
-6.00%
-4.00%
-2.00%
0.00%
2.00%
4.00%
6.00%
8.00%
2002 2003 2004 2005 2006 2007 2008 2009 2010 2011 2012 2013F 2014F
Key Indicators for the Tire Market
Miles Driven (B) Repl Tire Shipments- Gasoline Sales (Gal/B)

Macro Indicators
22
Engineered Products
RVIA; Motor Vehicle and Parts Production
Sources: RVIA Forecasts, Sept 2013
FRB G17 Release (Oct 2013; MAPI Forecast, Sept 2013)
13.2 8.4
3.9
(40)(30)(20)(10)0102030405060
0.0
50.0
100.0
150.0
200.0
250.0
300.0
350.0
400.0
450.0
An
nu
al Rate
of C
han
ge (%
)
Units (000)
RV Shipments
RV Unit Shipments (000) % Change from P/Y
