n by the house resources committee oil and gas … · oil and gas production tax and credits:...
TRANSCRIPT

CSHB 111(RES)\N by the House Resources CommitteeOil and Gas Production Tax and Credits:Background and Bill AnalysisPresentation to House Finance CommitteeKen Alper, Tax Division DirectorAlaska Department of Revenue
March 21, 2017
2
What I’m talking about today
Background on Alaska’s oil and gas taxes and analysis of CS HB111(RES)\N
Money- how oil has funded the state in the past Transition- how we’ve adapted to falling prices Credits- what we know, what has accrued Last year’s HB247 and remaining concerns Overview of CSHB111(RES) with detail of
selected tax sections Fiscal note
3
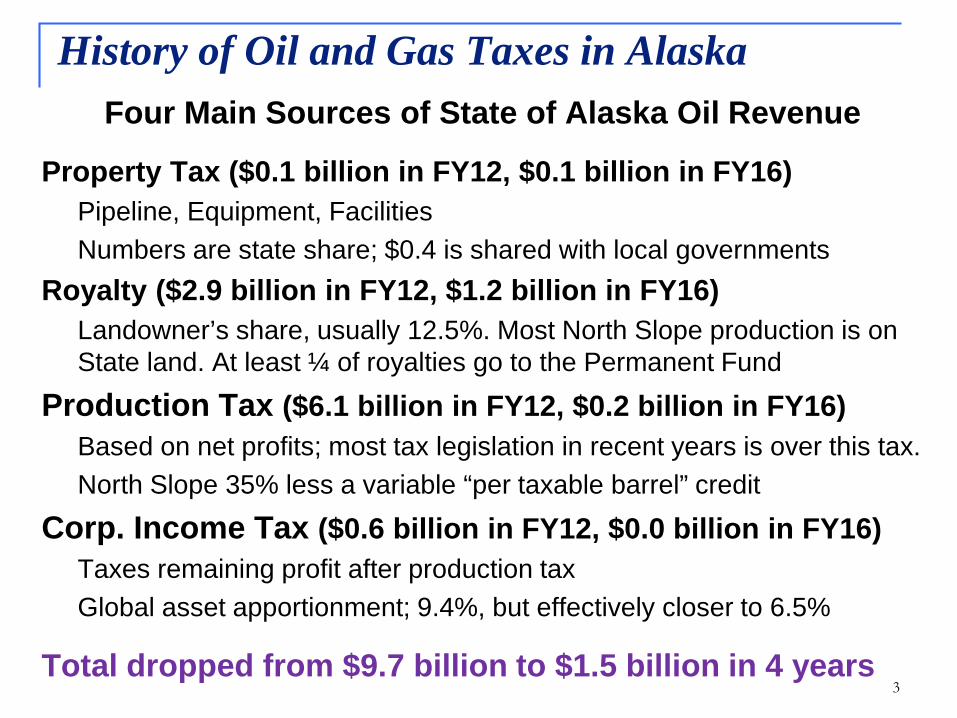
History of Oil and Gas Taxes in AlaskaFour Main Sources of State of Alaska Oil Revenue
Property Tax ($0.1 billion in FY12, $0.1 billion in FY16)Pipeline, Equipment, FacilitiesNumbers are state share; $0.4 is shared with local governments
Royalty ($2.9 billion in FY12, $1.2 billion in FY16)Landowner’s share, usually 12.5%. Most North Slope production is on State land. At least ¼ of royalties go to the Permanent Fund
Production Tax ($6.1 billion in FY12, $0.2 billion in FY16)Based on net profits; most tax legislation in recent years is over this tax.North Slope 35% less a variable “per taxable barrel” credit
Corp. Income Tax ($0.6 billion in FY12, $0.0 billion in FY16)Taxes remaining profit after production taxGlobal asset apportionment; 9.4%, but effectively closer to 6.5%
Total dropped from $9.7 billion to $1.5 billion in 4 years
4
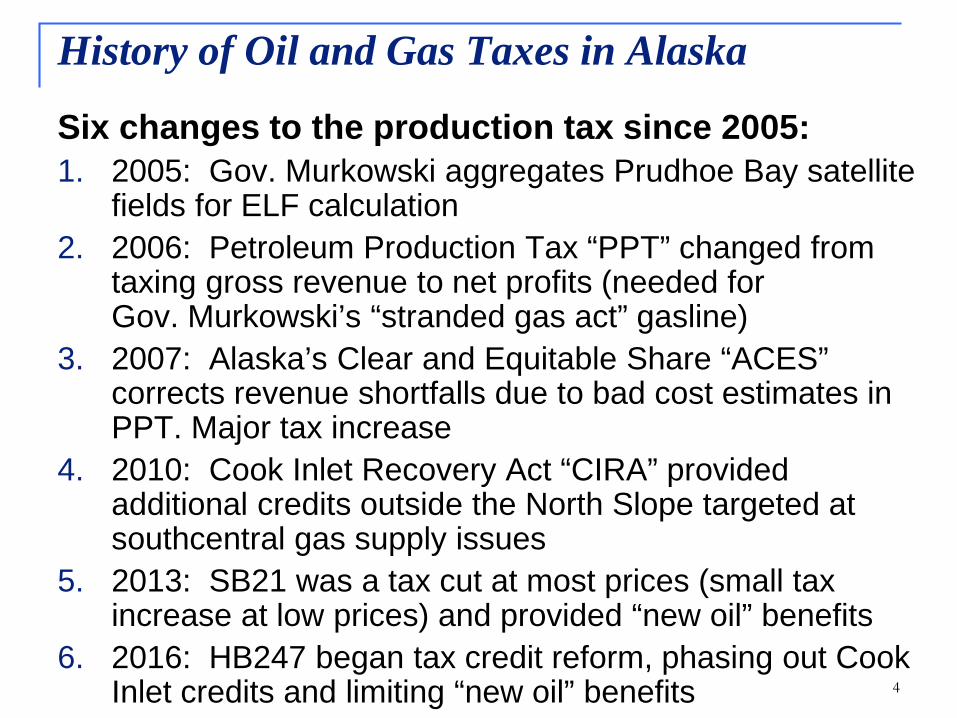
Six changes to the production tax since 2005:1. 2005: Gov. Murkowski aggregates Prudhoe Bay satellite
fields for ELF calculation2. 2006: Petroleum Production Tax “PPT” changed from
taxing gross revenue to net profits (needed for Gov. Murkowski’s “stranded gas act” gasline)
3. 2007: Alaska’s Clear and Equitable Share “ACES” corrects revenue shortfalls due to bad cost estimates in PPT. Major tax increase
4. 2010: Cook Inlet Recovery Act “CIRA” provided additional credits outside the North Slope targeted at southcentral gas supply issues
5. 2013: SB21 was a tax cut at most prices (small tax increase at low prices) and provided “new oil” benefits
6. 2016: HB247 began tax credit reform, phasing out Cook Inlet credits and limiting “new oil” benefits
History of Oil and Gas Taxes in Alaska
5
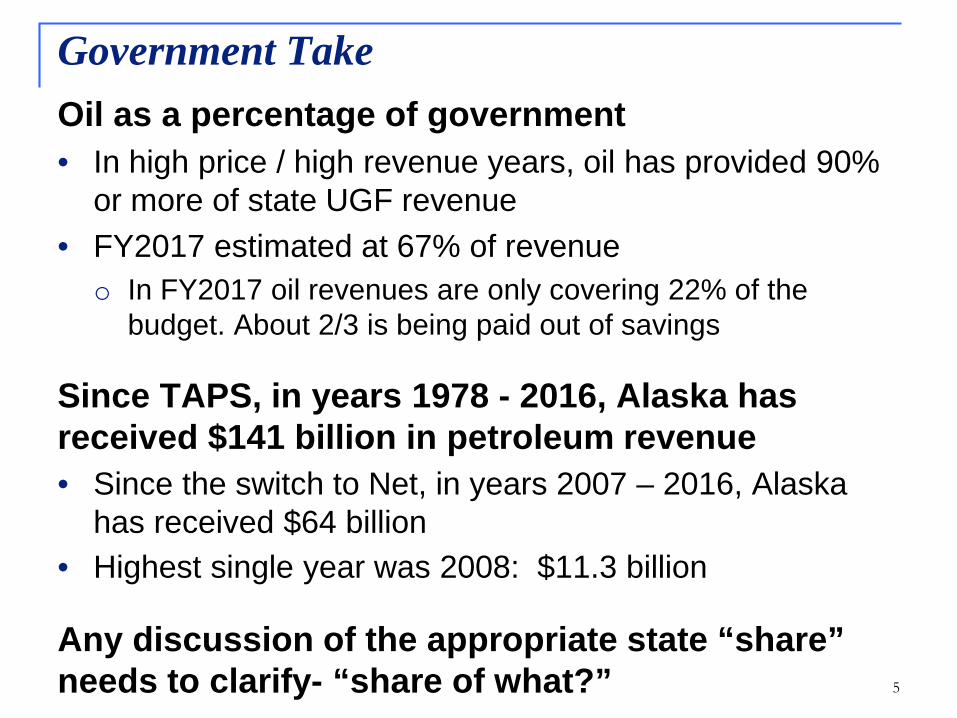
Government TakeOil as a percentage of government• In high price / high revenue years, oil has provided 90%
or more of state UGF revenue• FY2017 estimated at 67% of revenue
o In FY2017 oil revenues are only covering 22% of the budget. About 2/3 is being paid out of savings
Since TAPS, in years 1978 - 2016, Alaska has received $141 billion in petroleum revenue• Since the switch to Net, in years 2007 – 2016, Alaska
has received $64 billion• Highest single year was 2008: $11.3 billion
Any discussion of the appropriate state “share” needs to clarify- “share of what?”
6
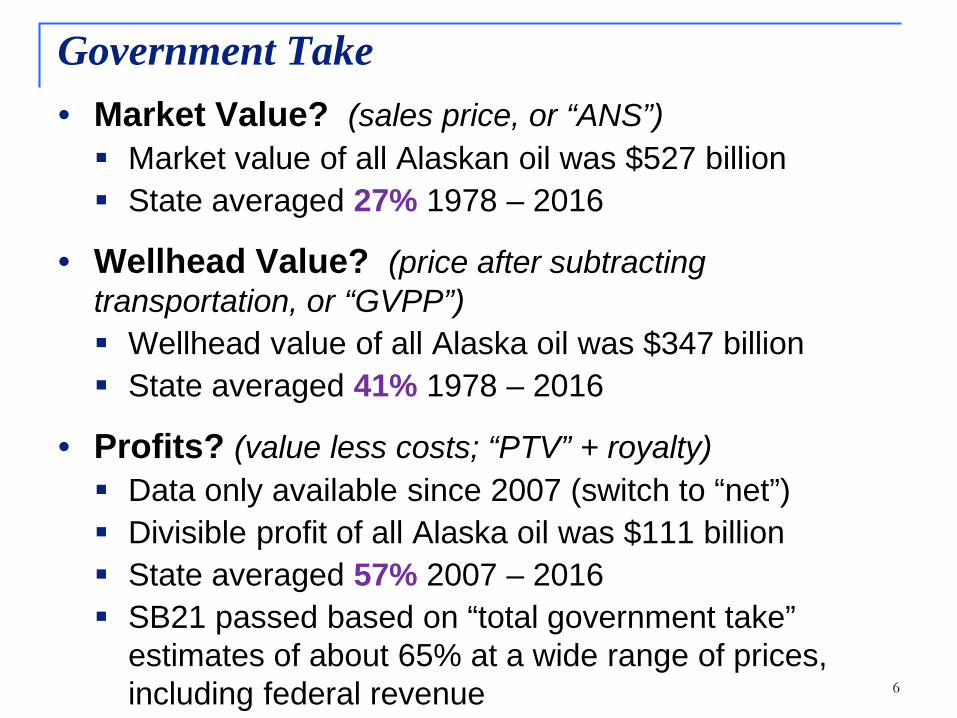
• Market Value? (sales price, or “ANS”) Market value of all Alaskan oil was $527 billion State averaged 27% 1978 – 2016
• Wellhead Value? (price after subtracting transportation, or “GVPP”) Wellhead value of all Alaska oil was $347 billion State averaged 41% 1978 – 2016
• Profits? (value less costs; “PTV” + royalty) Data only available since 2007 (switch to “net”) Divisible profit of all Alaska oil was $111 billion State averaged 57% 2007 – 2016 SB21 passed based on “total government take”
estimates of about 65% at a wide range of prices, including federal revenue
Government Take

777
1978 – 1998 relatively stableState share averaged 40%
1994 major royalty lawsuit settlements
1998-2005 ELFrates decline
2007-2013 high oil prices & net profits system
State share averaged 46%
2014-2016 low oil prices & net profits system
State share averaged 27%adds impact of cash credits
Government Take
8
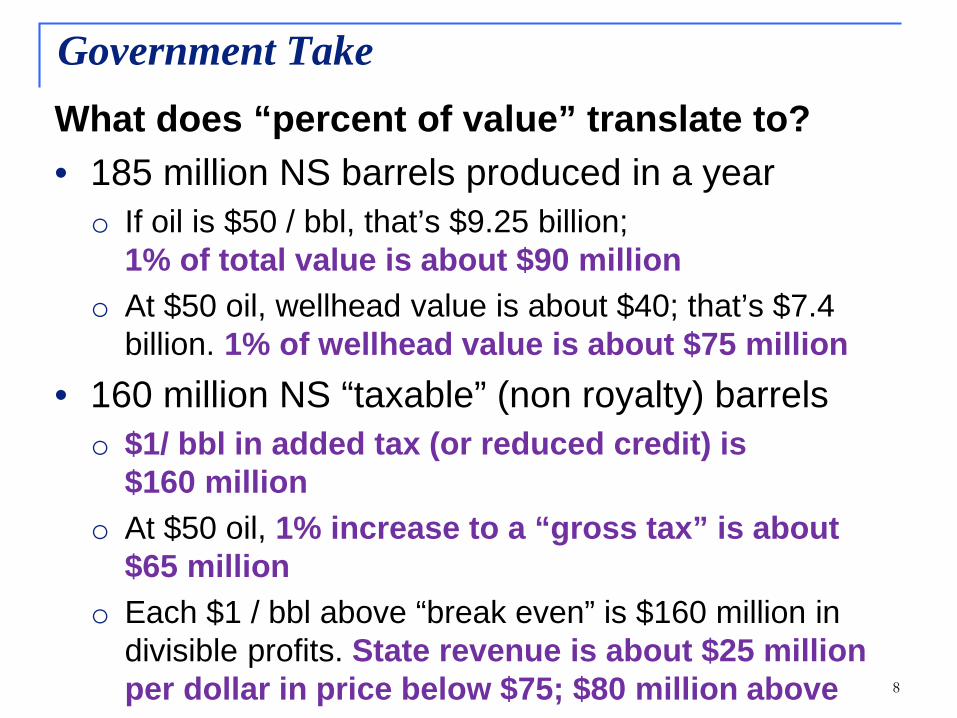
What does “percent of value” translate to?• 185 million NS barrels produced in a yearo If oil is $50 / bbl, that’s $9.25 billion;
1% of total value is about $90 milliono At $50 oil, wellhead value is about $40; that’s $7.4
billion. 1% of wellhead value is about $75 million• 160 million NS “taxable” (non royalty) barrelso $1/ bbl in added tax (or reduced credit) is
$160 milliono At $50 oil, 1% increase to a “gross tax” is about
$65 milliono Each $1 / bbl above “break even” is $160 million in
divisible profits. State revenue is about $25 million per dollar in price below $75; $80 million above
Government Take
9
Background on Alaska’s oil and gas taxes and analysis of CS HB111(RES)\N
Money- how oil has funded the state in the past Transition- how we’ve adapted to falling prices Credits- what we know, what has accrued Last year’s HB247 and remaining concerns Overview of CSHB111(RES) with detail of
selected tax sections Fiscal note
What I’m talking about today
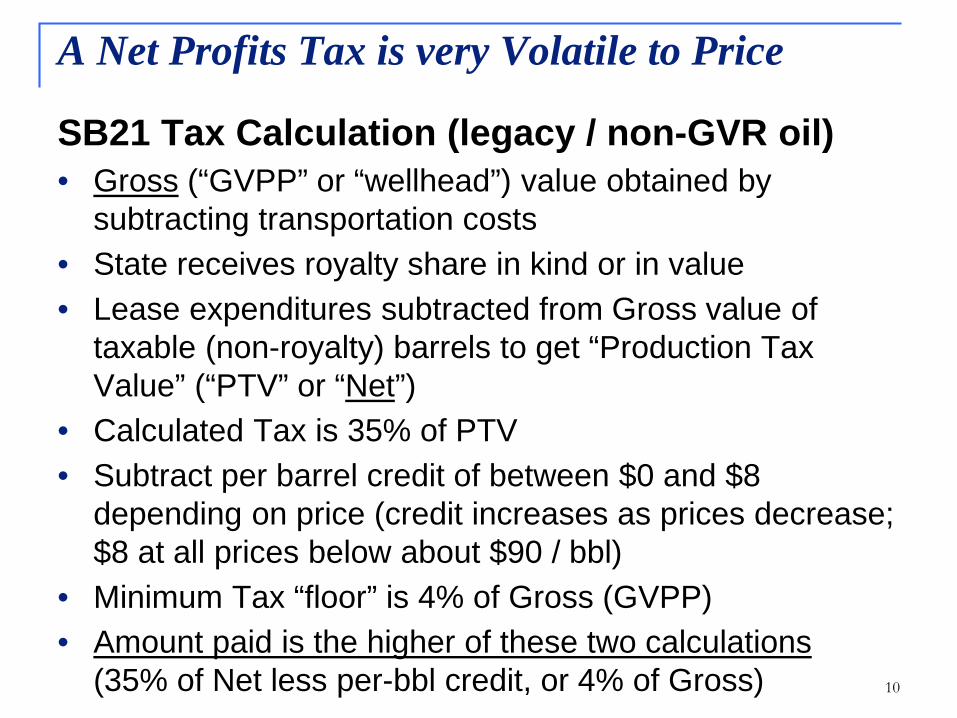
SB21 Tax Calculation (legacy / non-GVR oil)• Gross (“GVPP” or “wellhead”) value obtained by
subtracting transportation costs• State receives royalty share in kind or in value• Lease expenditures subtracted from Gross value of
taxable (non-royalty) barrels to get “Production Tax Value” (“PTV” or “Net”)
• Calculated Tax is 35% of PTV• Subtract per barrel credit of between $0 and $8
depending on price (credit increases as prices decrease; $8 at all prices below about $90 / bbl)
• Minimum Tax “floor” is 4% of Gross (GVPP)• Amount paid is the higher of these two calculations
(35% of Net less per-bbl credit, or 4% of Gross) 10
A Net Profits Tax is very Volatile to Price
11
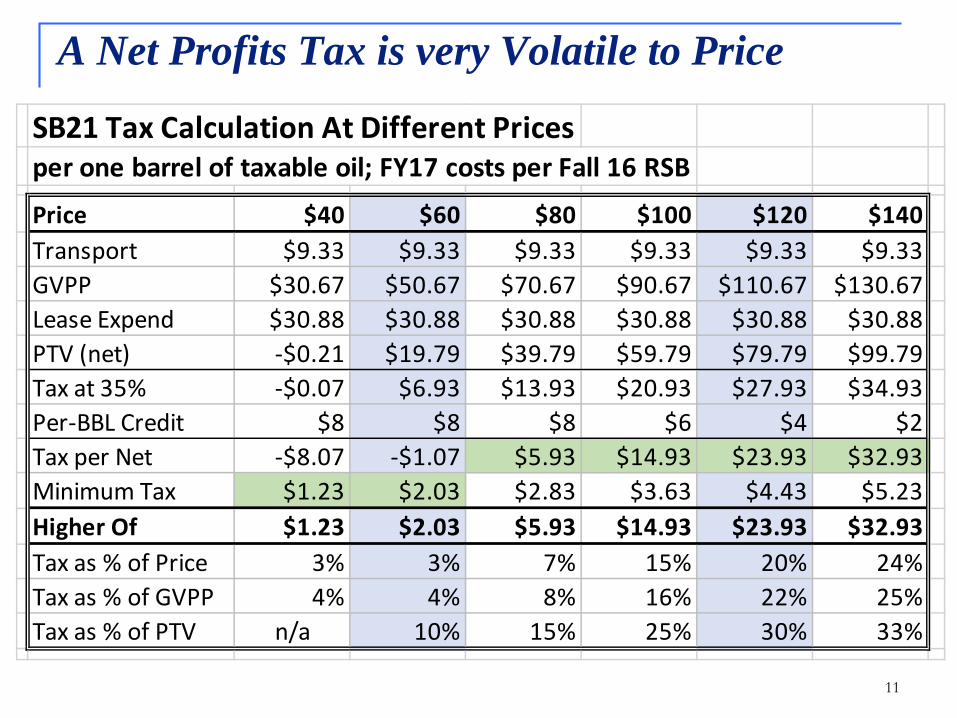
A Net Profits Tax is very Volatile to Price
SB21 Tax Calculation At Different Pricesper one barrel of taxable oil; FY17 costs per Fall 16 RSB
Price $40 $60 $80 $100 $120 $140Transport $9.33 $9.33 $9.33 $9.33 $9.33 $9.33GVPP $30.67 $50.67 $70.67 $90.67 $110.67 $130.67Lease Expend $30.88 $30.88 $30.88 $30.88 $30.88 $30.88PTV (net) -$0.21 $19.79 $39.79 $59.79 $79.79 $99.79Tax at 35% -$0.07 $6.93 $13.93 $20.93 $27.93 $34.93Per-BBL Credit $8 $8 $8 $6 $4 $2Tax per Net -$8.07 -$1.07 $5.93 $14.93 $23.93 $32.93Minimum Tax $1.23 $2.03 $2.83 $3.63 $4.43 $5.23Higher Of $1.23 $2.03 $5.93 $14.93 $23.93 $32.93Tax as % of Price 3% 3% 7% 15% 20% 24%Tax as % of GVPP 4% 4% 8% 16% 22% 25%Tax as % of PTV n/a 10% 15% 25% 30% 33%

Important take-aways from previous slide:When the price of oil falls by half from $120 to $60
• Wellhead value declines by 54%($110.67 to $50.67)
• Taxable “net” declines by 75%($79.79 to $19.79)
• Production taxes paid declines by 91%($23.93 to $2.03; or for a full yearover $3.8 billion to $325 million)
12
A Net Profits Tax is very Volatile to Price
13
Background on Alaska’s oil and gas taxes and analysis of CS HB111(RES)\N
Money- how oil has funded the state in the past Transition- how we’ve adapted to falling prices Credits- what we know, what has accrued Last year’s HB247 and remaining concerns Overview of CSHB111(RES) with detail of
selected tax sections Fiscal note
What I’m talking about today

Types of Credits• Exploration Credits- AS 43.55.025; 2003-2016
o Added as a new incentive during ELF erao 20-40% of seismic work and exploration drilling
• Capital Expenditure Credit- AS 43.55.023(a) and (l) o 20% credit added 2006 as part of “PPT” billo Expanded outside North Slope to include 40% “well lease
expenditure” credit in 2010o Repealed on North Slope with passage of SB21 in 2013o HB247 cut in half 2017, repealed in Cook Inlet 2018
• Carried Forward Annual Loss Credit- AS 43.55.023(b)• “NOL” pays for a percentage of a company’s losses• Currently 35% on North Slope- main remaining credit• Was 25% in Cook Inlet, now 15%, phased out 2018• “Stackable” with Exploration and Capital credits 14
History of Oil and Gas Production Tax Credits

15
History of Oil and Gas Production Tax Credits
Types of Credits (cont’d.)• Small Producer Credit- AS 43.55.024(c)
o Tax reduction of up to $12 million for first nine yearso Qualification ended in 2016; gradually phasing out
• Per-Taxable Barrel Credit- AS 43.55.024(i) and (j)o Subtracted from taxes as part of SB21 calculation
• Credits against corporate income taxes- AS 43.20o Gas storage, LNG storage, Refinery investment
In 2007, state began “repurchasing” certain creditsTo qualify for credit “repurchase” a producer must produce less than 50,000 bbl / day. Larger companies must carry forward to use against future year’s taxesCashable tax credits are unique to Alaska
16
History of Oil and Gas Production Tax Credits
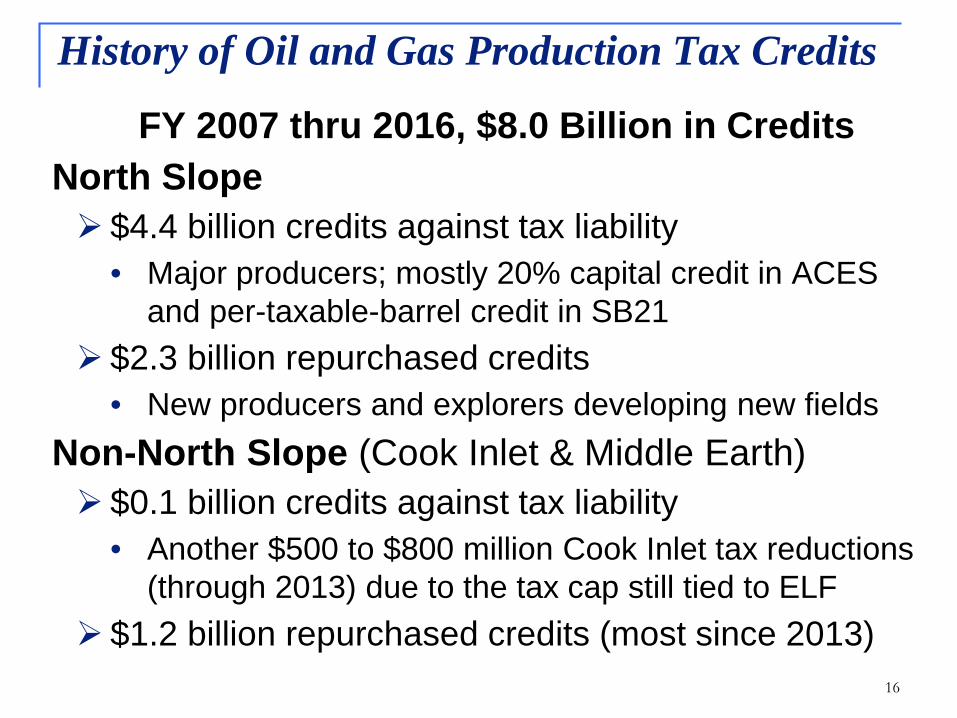
FY 2007 thru 2016, $8.0 Billion in CreditsNorth Slope $4.4 billion credits against tax liability
• Major producers; mostly 20% capital credit in ACES and per-taxable-barrel credit in SB21
$2.3 billion repurchased credits• New producers and explorers developing new fields
Non-North Slope (Cook Inlet & Middle Earth) $0.1 billion credits against tax liability
• Another $500 to $800 million Cook Inlet tax reductions (through 2013) due to the tax cap still tied to ELF
$1.2 billion repurchased credits (most since 2013)
17
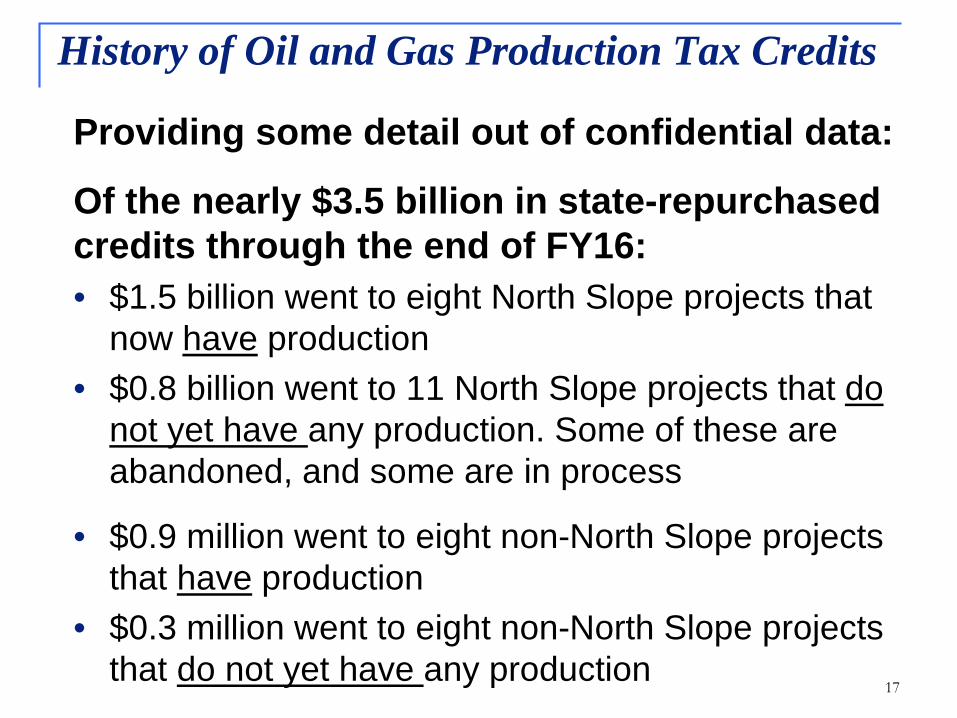
Providing some detail out of confidential data:
Of the nearly $3.5 billion in state-repurchased credits through the end of FY16:• $1.5 billion went to eight North Slope projects that
now have production• $0.8 billion went to 11 North Slope projects that do
not yet have any production. Some of these are abandoned, and some are in process
• $0.9 million went to eight non-North Slope projects that have production
• $0.3 million went to eight non-North Slope projects that do not yet have any production
History of Oil and Gas Production Tax Credits
18
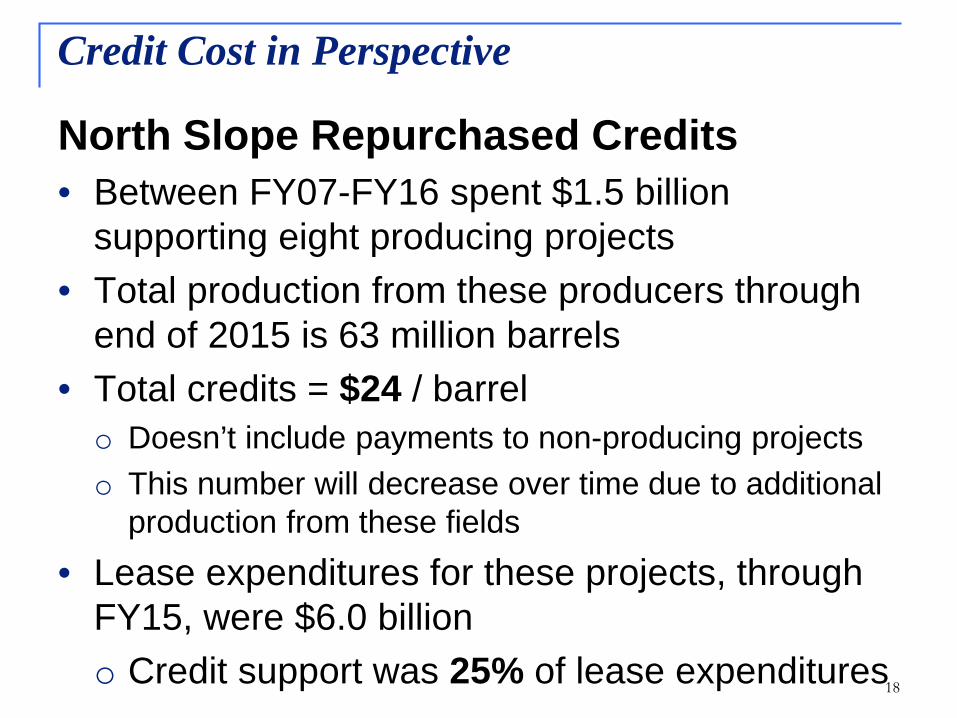
North Slope Repurchased Credits• Between FY07-FY16 spent $1.5 billion
supporting eight producing projects• Total production from these producers through
end of 2015 is 63 million barrels• Total credits = $24 / barrelo Doesn’t include payments to non-producing projectso This number will decrease over time due to additional
production from these fields• Lease expenditures for these projects, through
FY15, were $6.0 billiono Credit support was 25% of lease expenditures
Credit Cost in Perspective

19
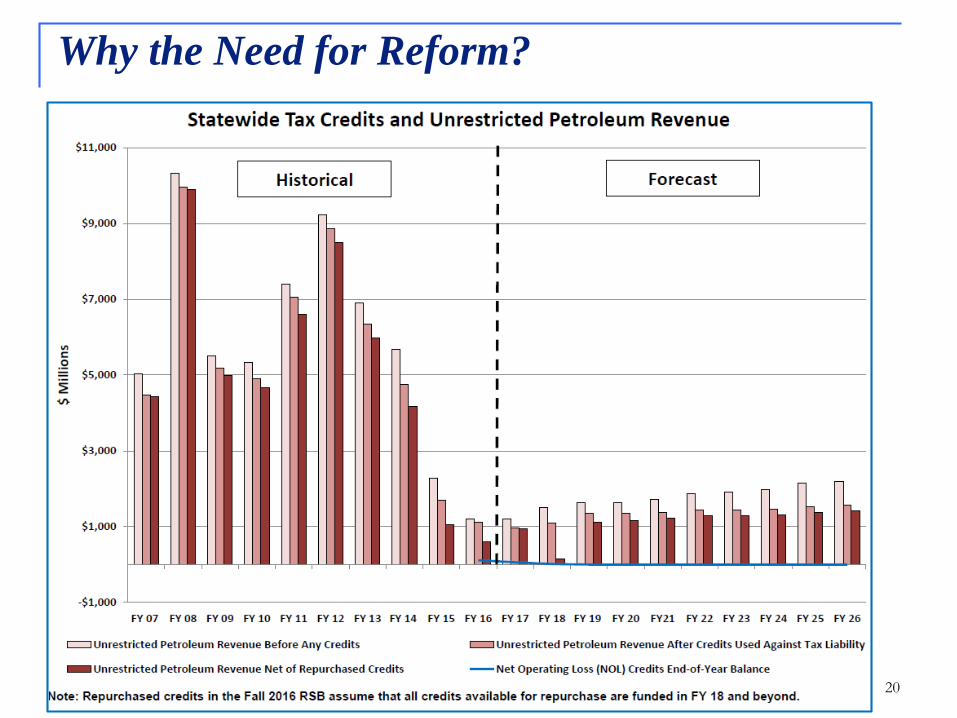
Statewide Tax Credits and Production Tax Revenue
Why the Need for Reform?
20
Why the Need for Reform?

21
• FY2009-2015 Legislature used “open ended” appropriation language. All credit certificates presented were purchased
• FY16 Appropriation Capped at $500 milliono $498 million paid out by end of Juneo About $211 million North Slope, $287 million non-NS
• FY17 Governor proposes $1 billion to clear credit liability as part of reform package and full fiscal plano Legislature appropriated $460 million towards expected
demand of $775 milliono Governor vetoed all but $30 million (formula calc.)o Funds were paid first in-first out; most went to Cook
Inlet capital and well lease expenditure claims
Credits Outstanding, Impact of Partial Payment
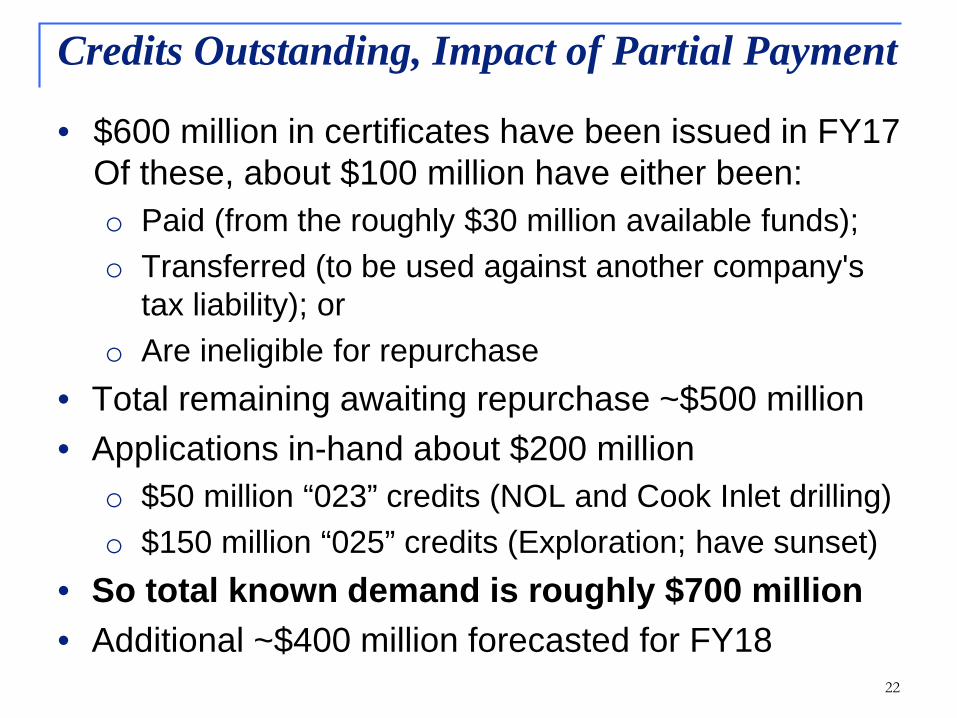
• $600 million in certificates have been issued in FY17 Of these, about $100 million have either been:o Paid (from the roughly $30 million available funds);o Transferred (to be used against another company's
tax liability); oro Are ineligible for repurchase
• Total remaining awaiting repurchase ~$500 million• Applications in-hand about $200 million
o $50 million “023” credits (NOL and Cook Inlet drilling)o $150 million “025” credits (Exploration; have sunset)
• So total known demand is roughly $700 million• Additional ~$400 million forecasted for FY18
22
Credits Outstanding, Impact of Partial Payment

23
Per AS 43.55.028, formula-generated appropriation is 10% of production tax levied, before credits, when ANS price forecast is $60 or higher. Formula appropriation is 15% of production tax levied, before credits, when ANS price forecast is below $60.Does not include changes in company behavior or credit transfers beyond FY 2018 as a result of only making minimum appropriation.
Source: Department of Revenue - Revenue Sources Book Fall 2016
Credits Outstanding, Impact of Partial Payment

Credit appropriation formula AS 43.55.028(b) and (c)• Based on a percentage of production tax revenue
(before subtracting credits that are taken against liability)o Forecast price below $60: 15%o Forecast price above $60: 10%
• Was never used in previous years’ budgets before FY17• Earlier years would have generated large appropriations
that would have exceeded the demand for credits, “endowing” the fund
• Recent years would have spent down any past surpluses; reducing the fund to zero by FY2016
• We’d be in the same place now- only there wouldn’t be the expectation that we’d provide unlimited funding
24
Credits Outstanding, Impact of Partial Payment
25
Tax Credit Fund Appropriations
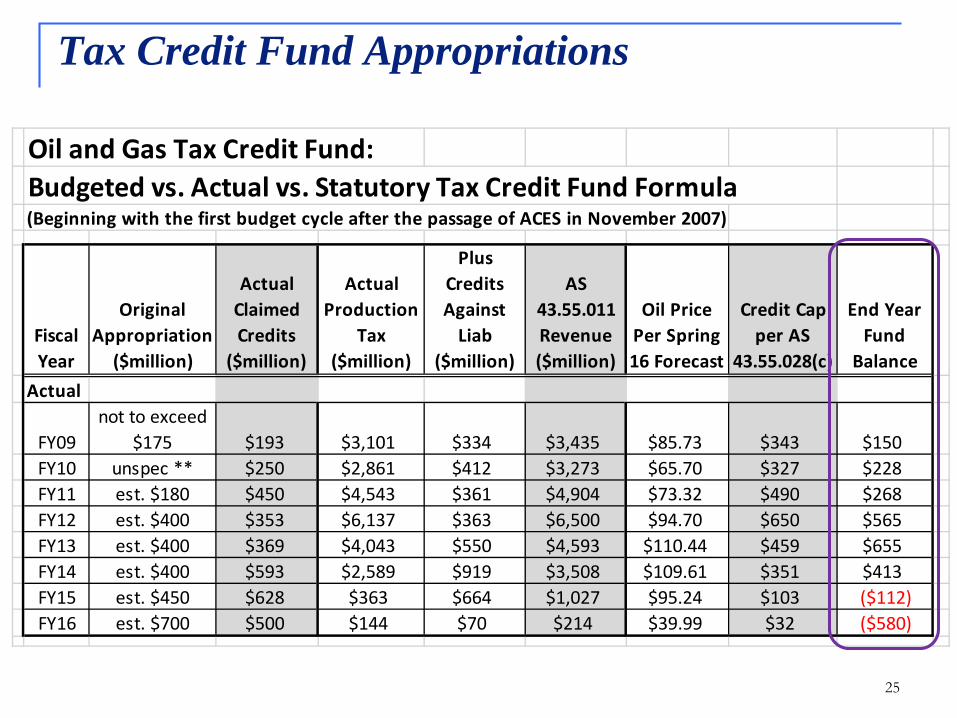
Oil and Gas Tax Credit Fund: Budgeted vs. Actual vs. Statutory Tax Credit Fund Formula(Beginning with the first budget cycle after the passage of ACES in November 2007)
Fiscal Year
Original Appropriation
($million)
Actual Claimed Credits
($million)
Actual Production
Tax ($million)
Plus Credits Against
Liab ($million)
AS 43.55.011 Revenue ($million)
Oil Price Per Spring 16 Forecast
Credit Cap per AS
43.55.028(c)
End Year Fund
BalanceActual
FY09not to exceed
$175 $193 $3,101 $334 $3,435 $85.73 $343 $150FY10 unspec ** $250 $2,861 $412 $3,273 $65.70 $327 $228FY11 est. $180 $450 $4,543 $361 $4,904 $73.32 $490 $268FY12 est. $400 $353 $6,137 $363 $6,500 $94.70 $650 $565FY13 est. $400 $369 $4,043 $550 $4,593 $110.44 $459 $655FY14 est. $400 $593 $2,589 $919 $3,508 $109.61 $351 $413FY15 est. $450 $628 $363 $664 $1,027 $95.24 $103 ($112)FY16 est. $700 $500 $144 $70 $214 $39.99 $32 ($580)

Options for companies holding credit certificates1. Wait for production (use against own taxes) 2. Wait for additional funding (tax credit obligations are
not state “debt” and do not incur interest)3. Sell to a company with a tax liabilityo Limited demand with low oil prices- the major
producers are forecasted to have relatively low liabilityo .023 credits can only offset up to 20% of a company’s
tax liabilityo No restriction on use of .025 credits to offset taxes
other than the minimum tax. The bulk of large .025 credits will be issued later this year
26
Credits Outstanding, Impact of Partial Payment
27
Background on Alaska’s oil and gas taxes and analysis of CS HB111(RES)\N
Money- how oil has funded the state in the past Transition- how we’ve adapted to falling prices Credits- what we know, what has accrued Last year’s HB247 and remaining concerns Overview of CSHB111(RES) with detail of
selected tax sections Fiscal note
What I’m talking about today

Cook Inlet• Complete phase-out of NOL, QCE, and WLE by 2018• Extends “tax caps” on gas indefinitely, adds $1 / bbl oil tax• Municipal utility pro-ration of costs
Middle Earth• Reduces the NOL, QCE, and WLE credit rates• Extends “Frontier Basin” exploration credit to July 2017
North Slope• GVR “Graduation” provision after three to seven years• GVR can’t be used to increase the amount of an NOL
Statewide• $70 million per company per year cap ($61 with “haircut”)• Interest rates increased for 3 years, then drops to zero• Transparency, local hire, state obligation offsets, surety bond
28
HB247: Major Provisions & Regional Impacts
• Hybrid system with a net tax above $75, a gross tax between $45 and $75, and a net tax (via the NOL credit) below $45
• Possible multi-billion dollar future liability for large new discoveries
• Possible ability to use carried forward operating loss credits to zero out all taxes (“hardening the floor”)
• Equity between major producers and new explorers if major changes made to operating loss credits
• High per barrel credit keeps us in the 4% “minimum tax” at up to nearly $80 oil
29
Remaining concerns with tax and credit system

30
Background on Alaska’s oil and gas taxes and analysis of CS HB111(RES)\N
Money- how oil has funded the state in the past Transition- how we’ve adapted to falling prices Credits- what we know, what has accrued Last year’s HB247 and remaining concerns Overview of CSHB111(RES) with detail of
selected tax sections Fiscal note
What I’m talking about today

31
Bill Analysis: Section 2 (interest rates)
Interest rates were amended in HB247• DOR expressed concern when Senate Finance CS
introduced the “zero interest after 3-year” provision• Makes it very hard to settle tax disputes• Sought to get it removed in Conference Committee• Proposed removing it in HB 5005 (July session)• Currently, doesn’t impact any actual interest
calculation until 2020 so can be retroactive to 1/1/17
Concern with language: HB247 separated the Oil and Gas Production Tax interest rate from all other taxes for the first time. HB111 does not fix this. We would prefer all taxes to use the same interest.

32
Information about credits made public • These sections were originally introduced as HB99 • Expands provision from HB247 requiring annual DOR
report of who received tax credits and the amount• Adds to the report how much in tax credit certificates
is issued, as well aso A description of each company’s expenditures;o The purpose of the expenditure; ando The lease or property on which it’s located
Concern with language: As this bill mostly eliminates “credits,” to meet the intent of the original bill it may be necessary to redraft Sec. 4 to report “lease expenditures. Also, Sec. 22 is redundant with the other report requirement in Sec. 4
Bill Analysis: Section 3-4, 20-22 (transparency)
Provides authority for DOR to share certain confidential taxpayer information with legislators
• As written, legislators would have access to the same information as our audit employees
• Section requires developing a substantial confidentiality agreement to be signed by legislators
• Some administrative costs and possible taxpayer concerns
• Would likely engage IRS rules including background checks, chain of custody, information retention, etc.
Concern with language: Also may need to change reference from “credits” to “lease expenditures”
33
Bill Analysis: Section 5, (executive sessions)
34
Bill Analysis: Section 6 (minimum tax)
The minimum tax is an “alternative” calculation• The taxpayer calculates their net-profits tax, which is
35% of “production tax value” less the sliding scale per-barrel credit
• In parallel, they calculate the “gross minimum tax”, which is 4% of gross (wellhead) value when oil prices are above $25 / bbl
• Actual tax due is the ‘higher of’ the two calculations• Typical “crossover” occurs at about $70-$75 oil• Amendment raises this minimum tax from 4% to 5%
when the oil price is above $50

35
Bill Analysis: Section 6 (minimum tax)Increasing the rate moves the “crossover” to a slightly higher oil price

36
Bill Analysis: Section 6 (minimum tax)Impact of the 1% tax increase is limited to prices between $50 and $75
37
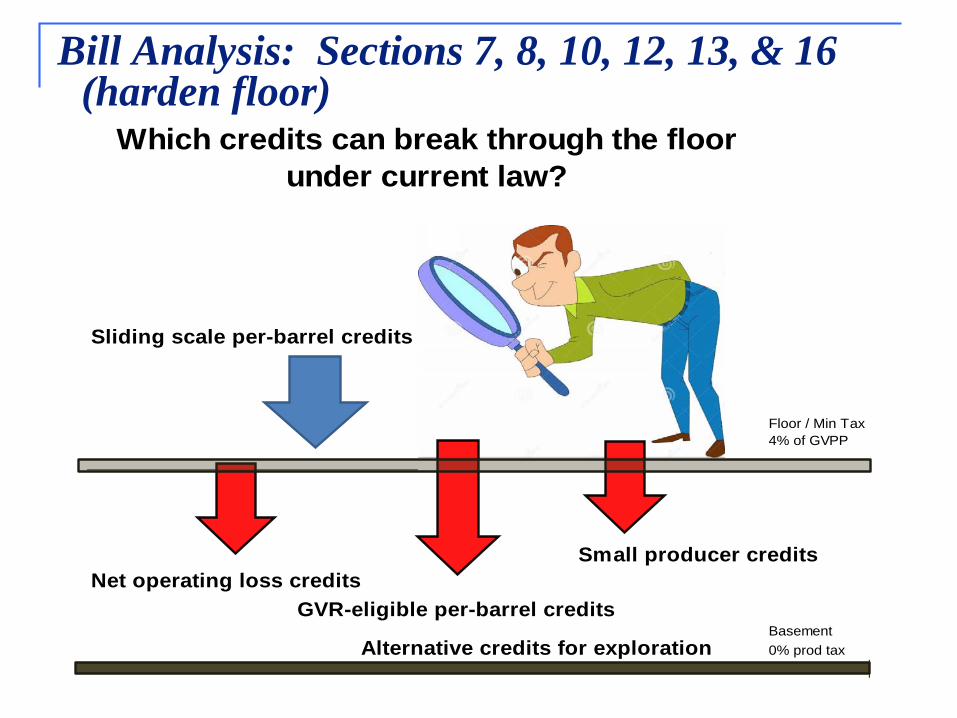
Which credits can break through the floor under current law?
Sliding scale per-barrel credits
Floor / Min Tax4% of GVPP
Small producer creditsNet operating loss credits
GVR-eligible per-barrel creditsBasement
Alternative credits for exploration 0% prod tax
Bill Analysis: Sections 7, 8, 10, 12, 13, & 16 (harden floor)
38
• Current law allows credits other than the sliding scale per-barrel credits for legacy oil to potentially reduce taxes below the minimum tax (“floor”)
• If a company is using any sliding scale credits, no other credits can be used below the floor
• HB 111 seeks to prevent all other credits in AS 43.55 from reducing taxes below the minimum taxo Small producer creditso GVR-eligible per-barrel creditso Net operating loss creditso Alternative credits for exploration
• Near term impact at low prices ~$20 million
Bill Analysis: Sections 7, etc. (harden floor)
39
This is really three different issues / policy questionsAll of these only pertain to the North Slope:
1) Losses incurred by producers not eligible for refundable credits Producers of more than 50,000 bbl / day are ineligible for cash credits and must carry them forward
2) Small Producer Credits Impacts independents plus junior partners within legacy fields
3) Per-Barrel Credits for GVR “New” OilCurrently the $5 per-barrel credit earned during the 3-7 years of eligibility for GVR is not limited by the floor. In CSHB111, floor is 4% of GVPP as reduced by GVR
Bill Analysis: Sections 7, etc. (harden floor)

40
NOLs and Major Producers• Currently, companies producing over 50,000 bbl / day
are not eligible to receive cash for tax credits. They must carry them forward to use in a future year
• NOLs for explorers and developer are simply their allowable expenditures. They don’t have revenue
• NOLs for producers occur when their spending exceeds their revenue. This can be due to low prices, new investment, or a combination of both
• At least one major producer had an operating loss in 2015 and others possibly in 2016• This can be seen in the RSB, table 8-4 on page 80:
$107 million worth of North Slope NOL credits are estimated to be used against liability in FY2017-2019
Bill Analysis: Sections 7, etc. (harden floor)

41
How the CS attempts to preserve a tax benefit for GVR-eligible production while still hardening the floor ($49 oil)
Bill Analysis: Sections 7, etc. (harden floor)
Minimum Tax, Legacy Production,and GVR-Eligible Production*
Legacy GVR-EligibleGVR-Elig
CSHB111(RES)West Coast Price ($/tax bbl) $49.00 $49.00 $49.00Transportation ($/tax bbl) -$9.77 -$9.77 -$9.77Wellhead Value ($/tax bbl) $39.23 $39.23 $39.23
Gross Value Reduction Rate (%) x 0% x 20% x 20%Gross Value Reduction ($/tax bbl) $0.00 $7.85 $7.85Adjusted Wellhead Value ($/tax bbl) $39.23 $31.38 $31.38Lease Expenditures ($/tax bbl) -$33.64 -$33.64 -$33.64Net Value after GVR ($/tax bbl) $5.59 -$2.26 -$2.26Base Tax Rate (%) x 35% x 35% x 35%Base Production Tax before Credits ($/tax bbl) $1.96 -$0.79 -$0.79Per-Taxable-Barrel Credit ($/tax bbl) $8 $5 $5Base Production Tax after credits ($/tax bbl) $0.00 $0.00 $0.00
Minimum Tax Rate (%) 4% 4% 4%Wellhead Value ($/tax bbl) x $39.23 x $39.23 x $39.23Adjusted Wellhead Value n/a n/a x $31.38Minimum Tax ($/tax bbl) $1.57 $1.57 $1.26
*Current assumptions include transport costs of $9.77 per barrel and deductible lease expenditures of $33.64 per taxable barrel, based on the North Slope average for FY 2018 as estimated in the Fall 2016 forecast. For this table, net value is thesame as "production tax value," defined in AS 43.55.160.

42
Bill Analysis: Section 7-8 (migrating credits)Preventing per-taxable barrel credits from being used in a month other than the month earned• In a low price month, the per-barrel credits are only used
until the tax liability reaches the 4% minimum tax.Any additional per-barrel credits are “lost”
• Current law allows sliding scale credits “lost” to the minimum tax to be recovered at annual true-up under certain conditions
• This reduces the “upside” potential for the State in a year with moderate oil price volatility
• Sliding scale credits are earned based on monthly price, and vary from month to month. Language in bill would mean the use of the credit would similarly be monthly with no annual true-up
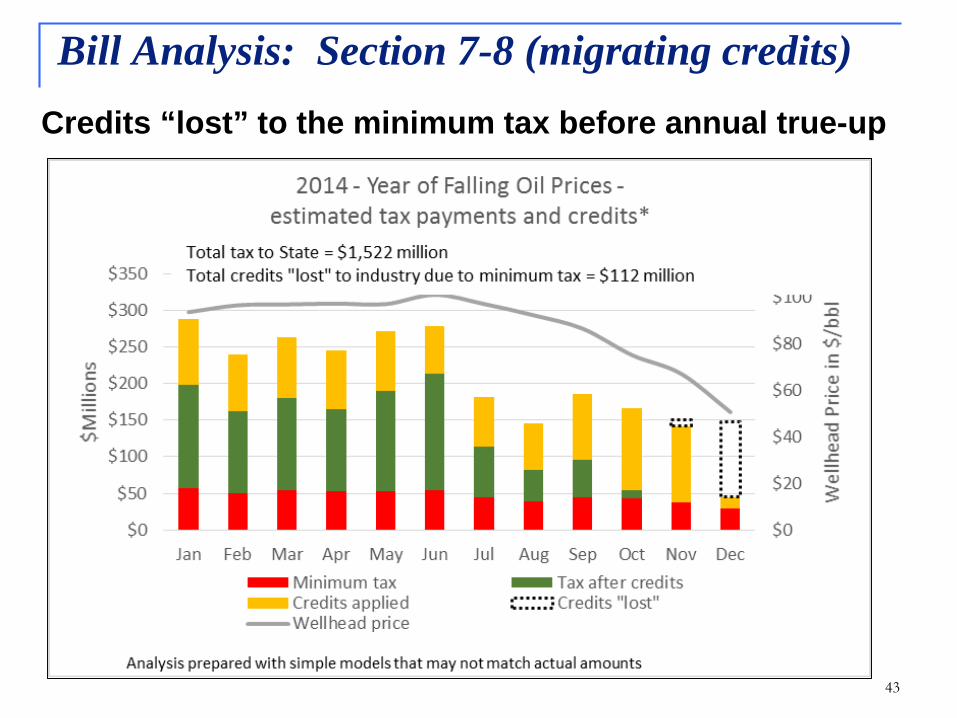
43
Bill Analysis: Section 7-8 (migrating credits)Credits “lost” to the minimum tax before annual true-up
44
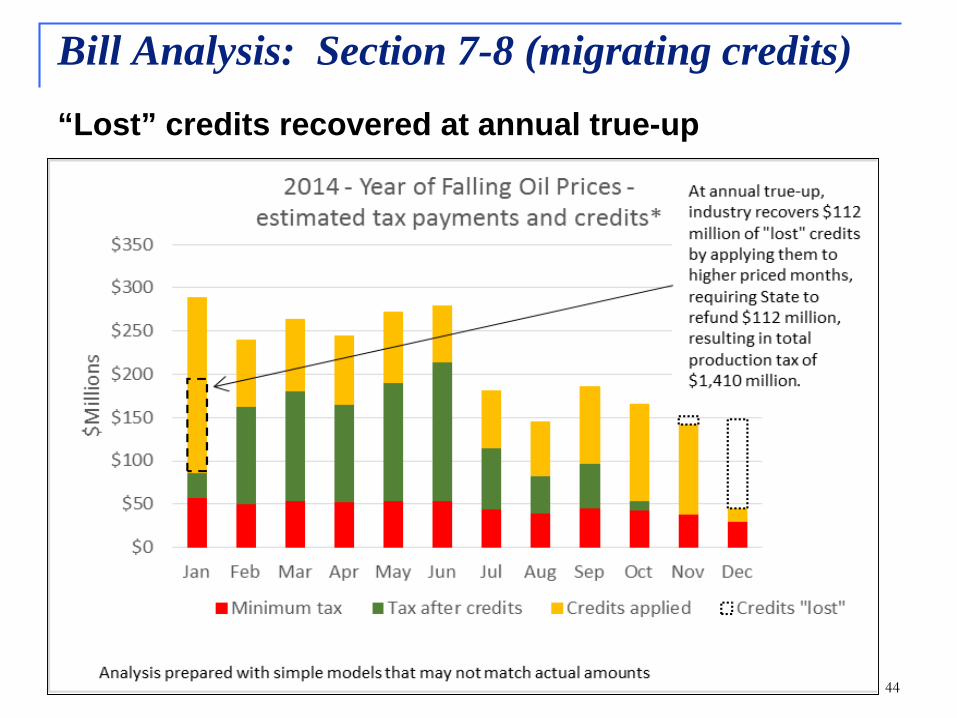
Bill Analysis: Section 7-8 (migrating credits)“Lost” credits recovered at annual true-up

45
Bill Analysis: Section 7-8 (migrating credits)
• This occurs because the minimum tax is an annual tax, and credits that cannot be used within a particular month can be recovered at year’s end
• This is only relevant in calendar years where some months result in a tax collection above the minimum tax, and other months are below- for example 2014
• In years with greater oil price volatility, credit recovery can take a larger share and could reduce State production tax collection to the minimum tax
• At extreme: in a year with otherwise low prices, several months of a major price spike due to a global event, and the state only gets the 4% minimum tax on production from those months
46
These sections eliminate direct cash support for North Slope activities• Sec. 9 eliminates the 35% North Slope NOL• Sec. 11 and 18 amend existing statute that speaks to
transferability and cashability of credits, and the use of the tax credit fund to pay for creditso Since the North Slope benefit is no longer a “credit”, it is no
longer transferrable and must be held by the company• Remaining credits eligible for repurchase:
1. Qualified Capital Expenditure and Well Lease Expenditure credits (only in Middle Earth after 2017)
2. Exploration credits (only in Middle Earth after 2016)3. LNG Storage and Refinery Infrastructure credits (corporate
income tax credits that aren’t earned by oil producers)4. (new dry hole credit added in Sec. 17)
Bill Analysis: Section 9, 11, 18 (NOL certificate)
47
Bill Analysis: Section 14 (per barrel credit)Current credit is $8 at wellhead value <$80; $7 below $90, etc.; going to zero at wellhead value >$150• This is “subtracted” from the 35% tax on production tax value
(profits)• HB111 retains the $8 credit at wellhead value <$60;
generally shifts all the tax tiers down by $20 • Although the $8 credit applies in theory at oil prices below
about $90, in practice the minimum tax limits the amount of this credit that can be used at prices below about $70.
• HB111 reduces most of the break points by $20. This results in a $2 / taxable barrel reduction in tax benefit at a wide range of prices- about $320 million tax impact at oil prices of $80+
Concern with language: Existing per-barrel credit creates an unusual “marginal tax” where a 1c change in price can result in a $1 change in credit benefit. HB111 exaggerates this with the $3 decrease in credit when GVPP increases from $109.99 to $110

48
Bill Analysis: Section 14 (per barrel credit)Effective (usable) rate of “per-taxable barrel” credit at different prices

49
Bill Analysis: Section 14 (per barrel credit)Revenue changes from the “light blue to dark blue” line to the “orange to yellow” line
50
Bill Analysis: Section 15, 17 (dry hole credit)
Creates a new exploration credit that is eligible for cash at 15% once conditions are met:
• No production• Vendors paid• Leases returned• Expenditure not used for another credit
Concerns with language: As written, this would also apply in Cook Inlet. Unsure if this is intentional, as all credits have been eliminated there effective 2018.Also, it’s unsure whether this intended to be linked to all lease expenditures or just qualified exploration expenses that have specific criteria defined in AS 43.55.025.Also, is there a possible “double dip” with carry forwards that could be used elsewhere?
51
Bill Analysis: Section 19 (cash limits)
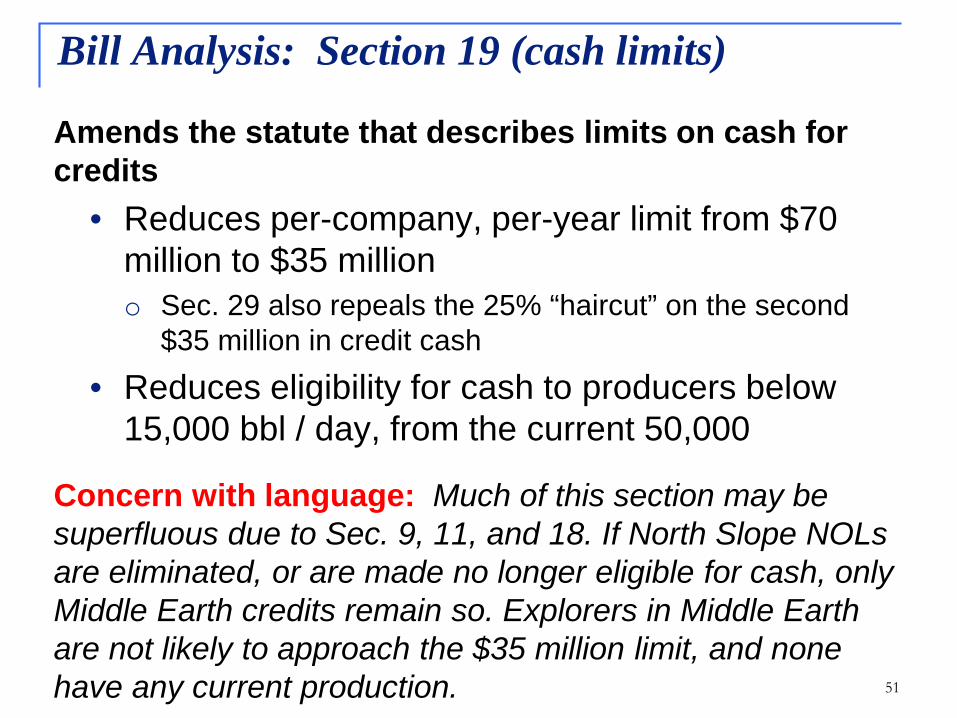
Amends the statute that describes limits on cash for credits
• Reduces per-company, per-year limit from $70 million to $35 milliono Sec. 29 also repeals the 25% “haircut” on the second
$35 million in credit cash
• Reduces eligibility for cash to producers below 15,000 bbl / day, from the current 50,000
Concern with language: Much of this section may be superfluous due to Sec. 9, 11, and 18. If North Slope NOLs are eliminated, or are made no longer eligible for cash, only Middle Earth credits remain so. Explorers in Middle Earth are not likely to approach the $35 million limit, and none have any current production.

52
Notes on large annual credits
Over the 2007-2016 history of the tax credit program:• There has only been one instance of a company who
ever received > $200 million in a single year• Five times ever when one company received between
$100 - $200 million in one year• 11 times ever when one company received between
$50 - $100 million in one year
Of the $500 million existing unpurchased certificates:• Three different companies are holding $100 million+
Bill Analysis: Section 19 (cash limits)
53
Bill Analysis: Section 23 (GVPP below zero)
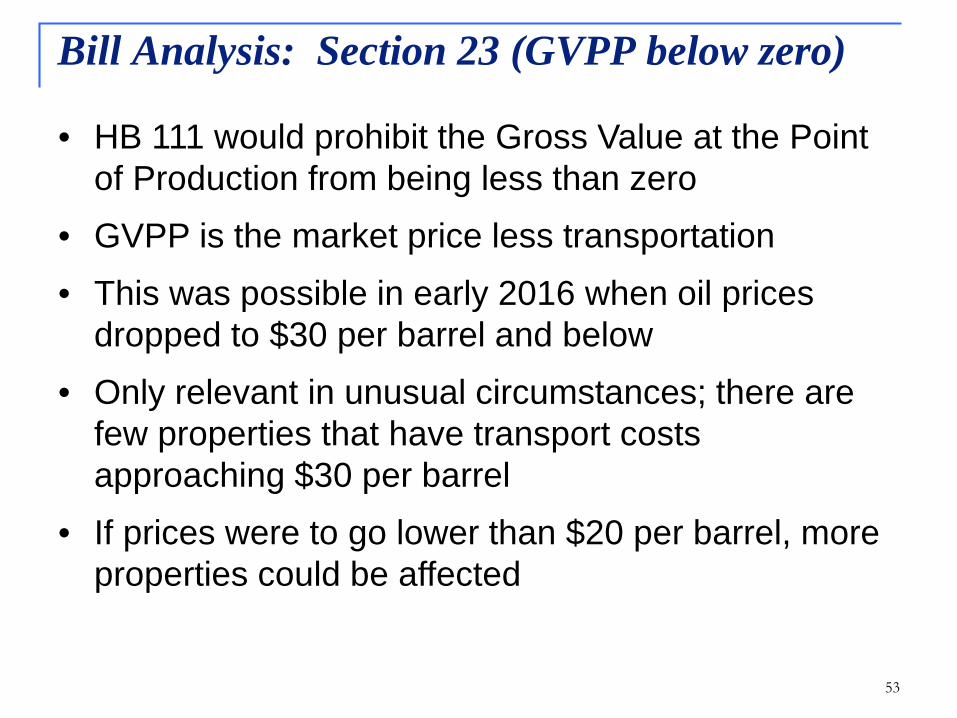
• HB 111 would prohibit the Gross Value at the Point of Production from being less than zero
• GVPP is the market price less transportation• This was possible in early 2016 when oil prices
dropped to $30 per barrel and below• Only relevant in unusual circumstances; there are
few properties that have transport costs approaching $30 per barrel
• If prices were to go lower than $20 per barrel, more properties could be affected
54
Bill Analysis: Section 23 (GVPP below zero)
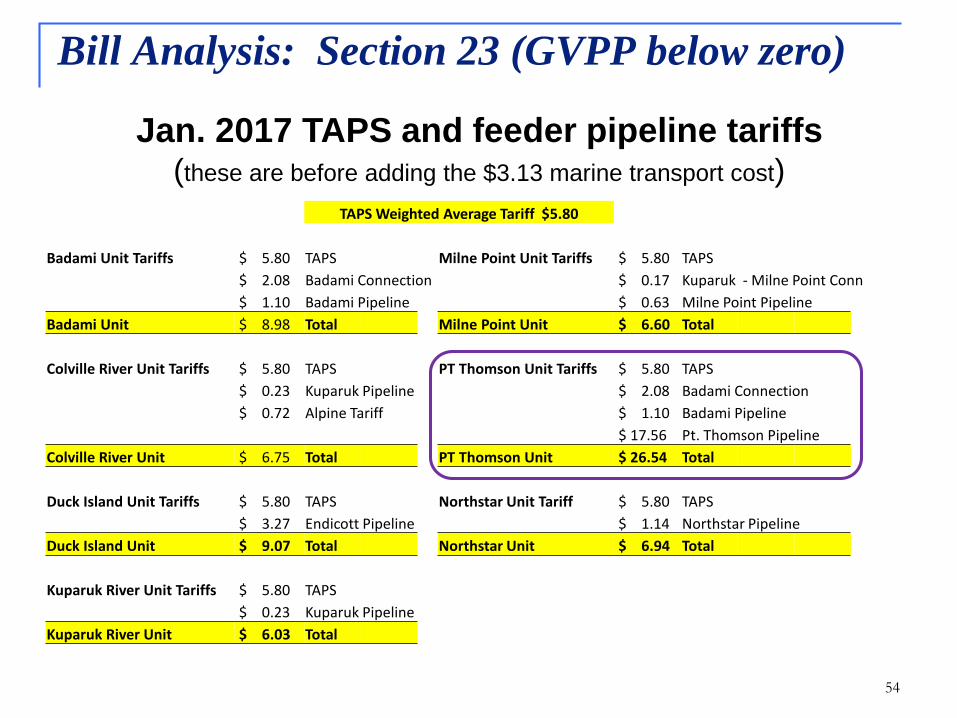
Jan. 2017 TAPS and feeder pipeline tariffs(these are before adding the $3.13 marine transport cost)
TAPS Weighted Average Tariff $5.80
Badami Unit Tariffs $ 5.80 TAPS Milne Point Unit Tariffs $ 5.80 TAPS $ 2.08 Badami Connection $ 0.17 Kuparuk - Milne Point Conn $ 1.10 Badami Pipeline $ 0.63 Milne Point Pipeline
Badami Unit $ 8.98 Total Milne Point Unit $ 6.60 Total
Colville River Unit Tariffs $ 5.80 TAPS PT Thomson Unit Tariffs $ 5.80 TAPS $ 0.23 Kuparuk Pipeline $ 2.08 Badami Connection $ 0.72 Alpine Tariff $ 1.10 Badami Pipeline
$ 17.56 Pt. Thomson PipelineColville River Unit $ 6.75 Total PT Thomson Unit $ 26.54 Total
Duck Island Unit Tariffs $ 5.80 TAPS Northstar Unit Tariff $ 5.80 TAPS $ 3.27 Endicott Pipeline $ 1.14 Northstar Pipeline
Duck Island Unit $ 9.07 Total Northstar Unit $ 6.94 Total
Kuparuk River Unit Tariffs $ 5.80 TAPS $ 0.23 Kuparuk Pipeline
Kuparuk River Unit $ 6.03 Total
55
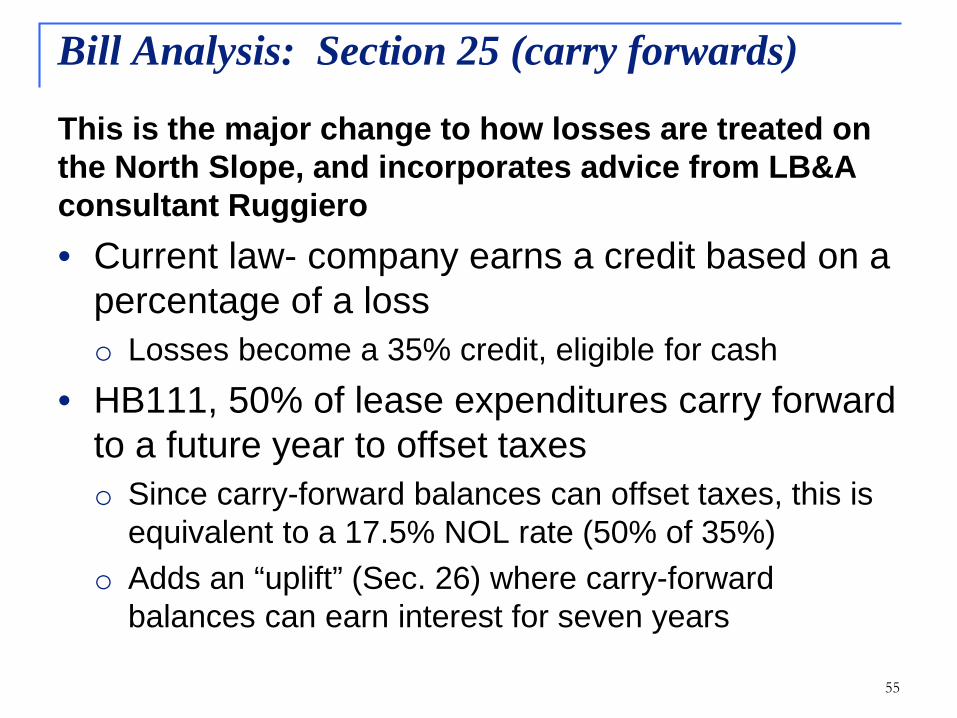
This is the major change to how losses are treated on the North Slope, and incorporates advice from LB&A consultant Ruggiero• Current law- company earns a credit based on a
percentage of a losso Losses become a 35% credit, eligible for cash
• HB111, 50% of lease expenditures carry forward to a future year to offset taxeso Since carry-forward balances can offset taxes, this is
equivalent to a 17.5% NOL rate (50% of 35%)o Adds an “uplift” (Sec. 26) where carry-forward
balances can earn interest for seven years
Bill Analysis: Section 25 (carry forwards)
56
Bill Analysis: Section 25 (carry forwards)
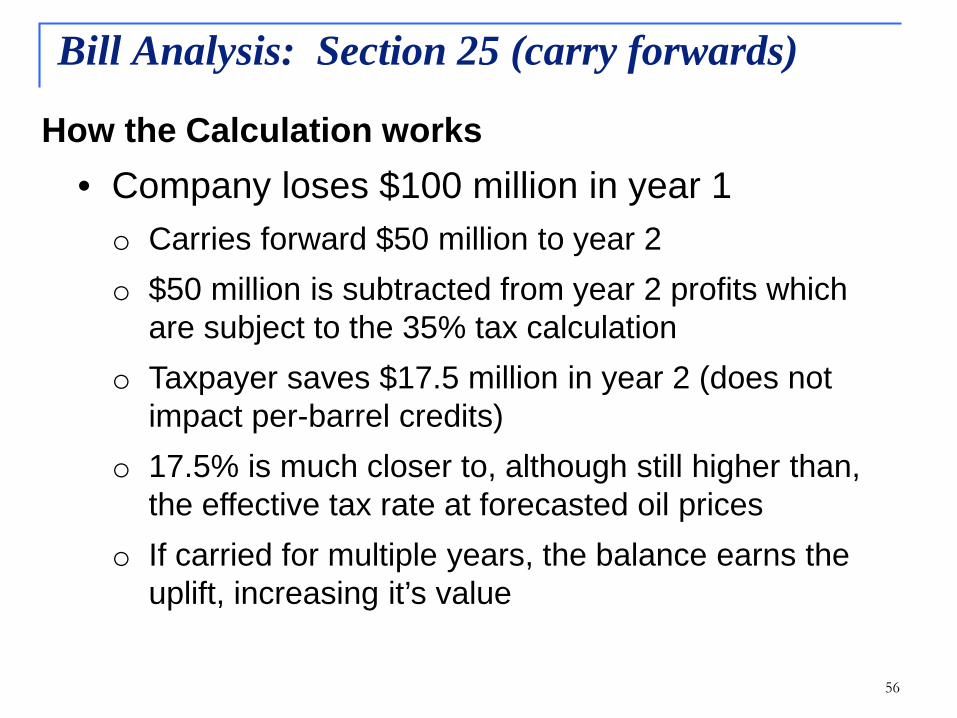
How the Calculation works• Company loses $100 million in year 1o Carries forward $50 million to year 2o $50 million is subtracted from year 2 profits which
are subject to the 35% tax calculationo Taxpayer saves $17.5 million in year 2 (does not
impact per-barrel credits)o 17.5% is much closer to, although still higher than,
the effective tax rate at forecasted oil priceso If carried for multiple years, the balance earns the
uplift, increasing it’s value
57
Bill Analysis: Section 25 (carry forwards)
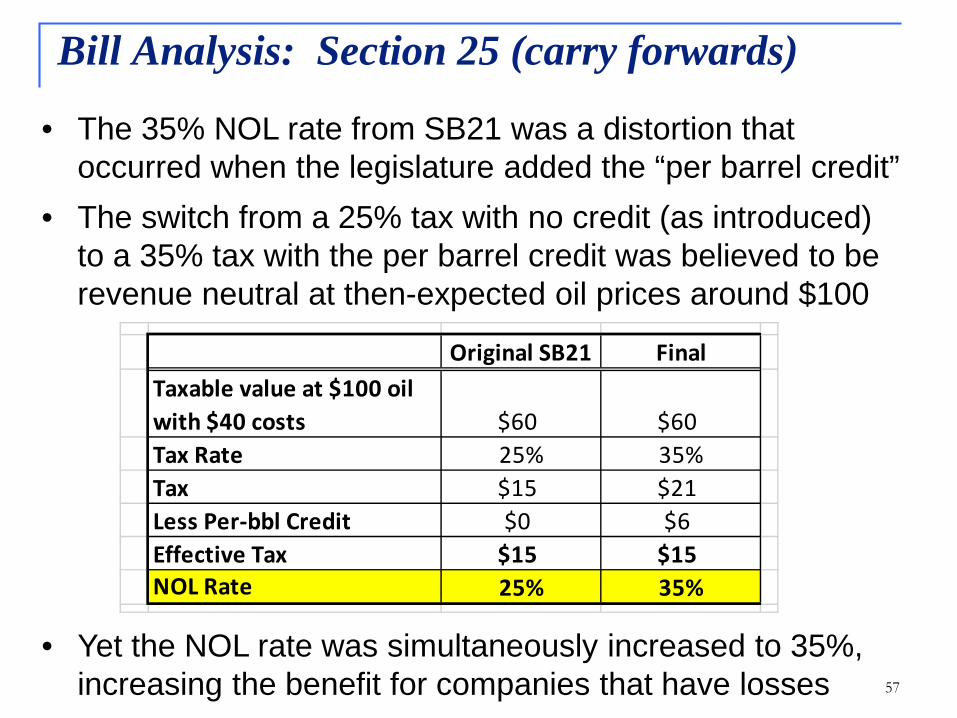
• The 35% NOL rate from SB21 was a distortion that occurred when the legislature added the “per barrel credit”
• The switch from a 25% tax with no credit (as introduced) to a 35% tax with the per barrel credit was believed to be revenue neutral at then-expected oil prices around $100
• Yet the NOL rate was simultaneously increased to 35%, increasing the benefit for companies that have losses
Original SB21 FinalTaxable value at $100 oil with $40 costs $60 $60Tax Rate 25% 35%Tax $15 $21Less Per-bbl Credit $0 $6Effective Tax $15 $15NOL Rate 25% 35%

58
Bill Analysis: Section 25 (carry forwards)Comparison of effective tax rates with NOL (or equivalent) credit rate at different prices
59
Bill Analysis: Section 25 (carry forwards)
Is there any real difference, whether it’s an NOL credit or a carry forward?
1. Taxpayer can’t earn the value until they actually have a tax liability (not cashable)
2. The benefit is not transferrable, meaning the holder can’t sell it to another taxpayer to use against that company’s tax liability
3. Indirectly hardens the floor, since there is no longer a “credit” that can be used to offset taxes
However, each of these could be accomplished by simply adding restrictions to the credit and how it can be used

60
Concerns with language: 50% language could be interpreted as reducing all carry forwards by 50% eachyear. So an unused expenditure from year 1 could be worth 25% in year 3, etc. Technical correction.Carry forwards appear to be available statewide. Given the very different Cook Inlet tax regime, it may be appropriate to limit this to North Slope only.Given the hard floor, it is unclear whether the carried-forward lease expenditures would be used to reduce PTV to zero (while still paying the floor), or to only the amount that would result in the minimum tax payment. May need conforming language in AS 43.55.160(a) that limits deduction of lease expenditures “for the calendar year”
Bill Analysis: Section 25 (carry forwards)

61
Another Possible Concern: Intent of carry forward structure appears to be to defer the tax benefit until a field comes into production. This could potentially be circumvented if the developer simply sold their company to a major producer. This would enable the uplifted lease expenditures to offset tax liability from legacy fields.Possible solution would be to require taxpayers, when filing annual taxes and claiming the NOL, to identify the lease or property to which they are attached, and to limit the applicability of the carry-forwards to production from that field.
Bill Analysis: Section 25 (carry forwards)
62
Bill Analysis: Section 26 (uplift)How the carry-forward and uplift works:• Taxpayer has a $100 million loss in 2018; carries
forward $50 million in lease expenditureso If company is profitable in 2019, they reduce their taxable
PTV by $50 million and pay taxes on the remaining amount (equivalent to a 17.5% NOL rate)
o If company first comes into production in 2026 (seven years later), their balance is “uplifted” by 7% plus the federal discount rate (currently 8.25%) per year
o Compounded value of $50 million x 8.25% x 7 yrs is $87 million (equivalent to a 30% NOL when used)
• Substantial impact if these numbers changeConcerns with language: Section references actual interest rate. May be better to directly tie it to the delinquent tax interest in AS 43.05.225- so both would change together.Unclear whether each year’s lease expenditures earn uplift for 7 years, versus each company once losses begin (technical).

63
Bill Analysis: Section 26 (DNR pre-approval)New section requires DNR to adopt regulations to pre approve lease expenditures and carry forwards• Unclear what criteria should be used for this
approval:o Legal eligibility of the lease expenditure?
(currently done by DOR as part of normal tax examination process)
o Best interest of the state, or cost / benefit? (could be a substantial additional workload)
o How often / what spending levels trigger review?o Other possible solution is to tie the carryforward to the
actual lease so it only has value after production• DNR will have more to add

64
Background on Alaska’s oil and gas taxes and analysis of CS HB111(RES)\N
Money- how oil has funded the state in the past Transition- how we’ve adapted to falling prices Credits- what we know, what has accrued Last year’s HB247 and remaining concerns Overview of CSHB111(RES) with detail of
selected tax sections Fiscal note
What I’m talking about today
65
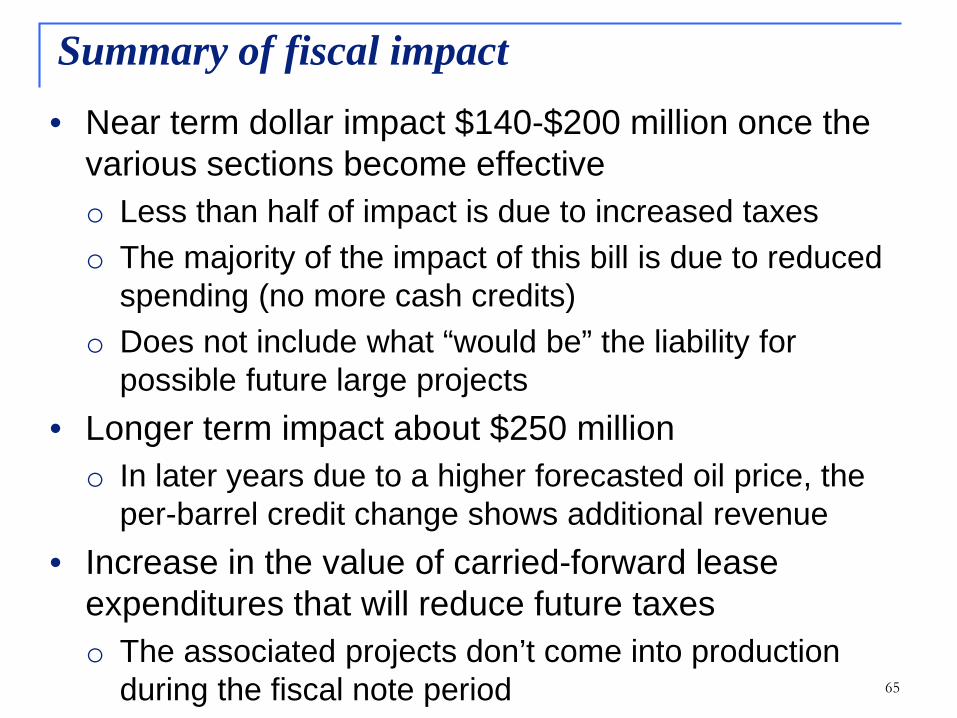
• Near term dollar impact $140-$200 million once the various sections become effectiveo Less than half of impact is due to increased taxeso The majority of the impact of this bill is due to reduced
spending (no more cash credits)o Does not include what “would be” the liability for
possible future large projects• Longer term impact about $250 milliono In later years due to a higher forecasted oil price, the
per-barrel credit change shows additional revenue• Increase in the value of carried-forward lease
expenditures that will reduce future taxeso The associated projects don’t come into production
during the fiscal note period
Summary of fiscal impact
66
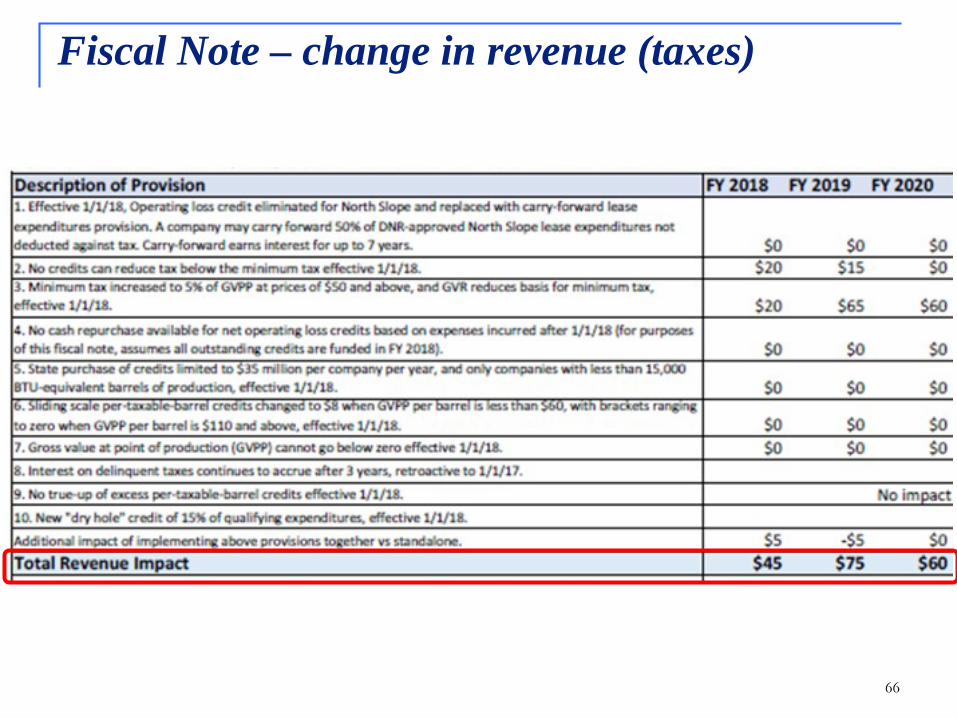
Fiscal Note – change in revenue (taxes)

67
Fiscal Note – budget impact (buying credits) plus carry-forwards
68
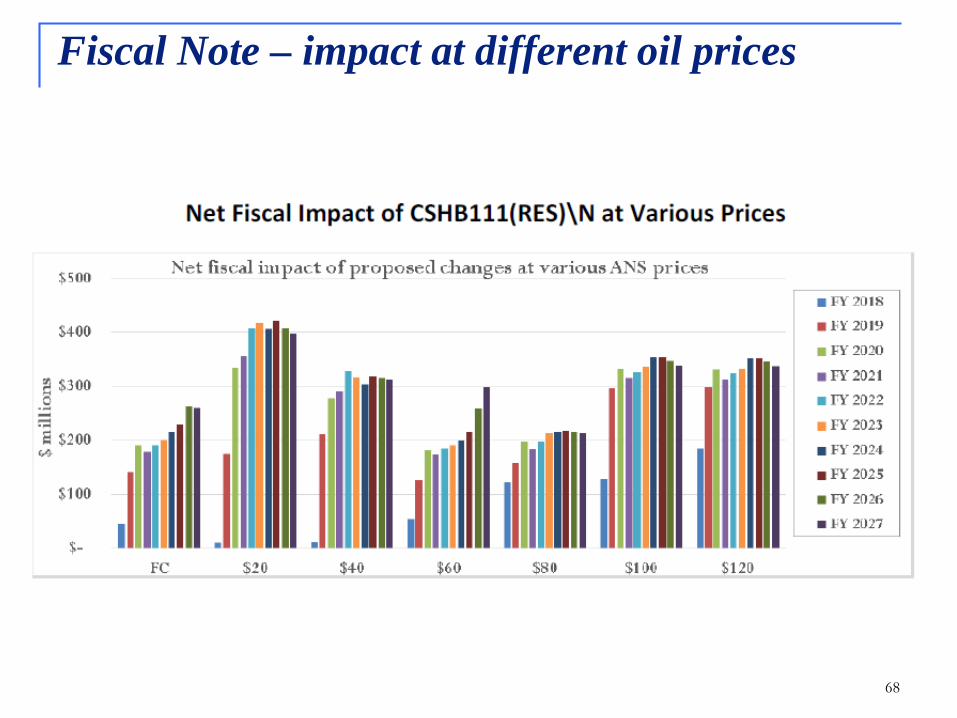
Fiscal Note – impact at different oil prices

69
Fiscal Note – scenario modeling
Lifecycle TotalsTax Credits Repurchased = $M 1,600Production Tax Paid = $M 12,549Net Production Tax = $M 10,950Production Tax NPV @ 6.95% = $M 1,638
Total Annual State Losses = $M 629Total Annual State Gains = $M 23,014Net State Gain (Loss) = $M 22,385State NPV @ 6.95% = $M 4,683Internal Rate of Return (IRR) 29%
Total Producer Cash Out = $M 7,620Total Producer Cash In = $M 26,037Net Producer Cash Flow = $M 18,417Producer Cash NPV @ 10.0% = $M 112Internal Rate of Return (IRR) 10%
-$300
-$100
$100
$300
$500
$700
$900
$1,100
$1,300
$1,500
$ M
illio
ns
Graph assumes: Capex = $13/bbl, Opex = $12/bbl
Annual State Net Gains & Losses, 20% GVR, @ Fall 2016 Forecast Prices, $35M Repurchase Cap, 4 Partners
Production Tax Property Tax Royalty State Corp Income Tax
Project Years 1 - 40
-$2,700
-$1,700
-$700
$300
$1,300
$2,300
$ M
illio
ns
Graph assumes: Capex = $13/bbl, Opex = $12/bbl
Annual Producer Cash Flows, 20% GVR, @ Fall 2016 Forecast Prices, $35M Repurchase Cap, 4 Partners
Red bars represent cash outflows by the Producer; green bars represent cash inflows for the Producer
Project Years 1 - 40
43%
3%
19%
35%
Split of ProfitsState ofAlaskaMuni Govt
FederalGovtProducer(s)
29%
2%
13%
56%
Split of GrossState ofAlaskaMuni Govt
FederalGovtProducer(s)
-$200
$0
$200
$400
$600
$800
$ M
illio
ns
Graph assumes: Capex = $13/bbl, Opex = $12/bbl
Production Tax Credits Repurchased / Tax Payments, 20% GVR, @ Fall 2016 Forecast Prices, $35M Repurchase Cap, 4 Partners
Minimum Tax
Red bars represent cash outflows by the State; green bars represent cash inflows through production tax payments made to the State
Project Years 1 - 40
Additional “life cycle” modeling will be presented on Friday
750 mmbo, Status Quo, Fall 2016 Forecast Prices, 4 Partners

Thank You!
Contact Information
Ken AlperDirector, Tax DivisionDepartment of [email protected](907) 465-8221