naacp opportunity & diversity report c ard the consumer ...action.naacp.org/page/-/economic...
TRANSCRIPT
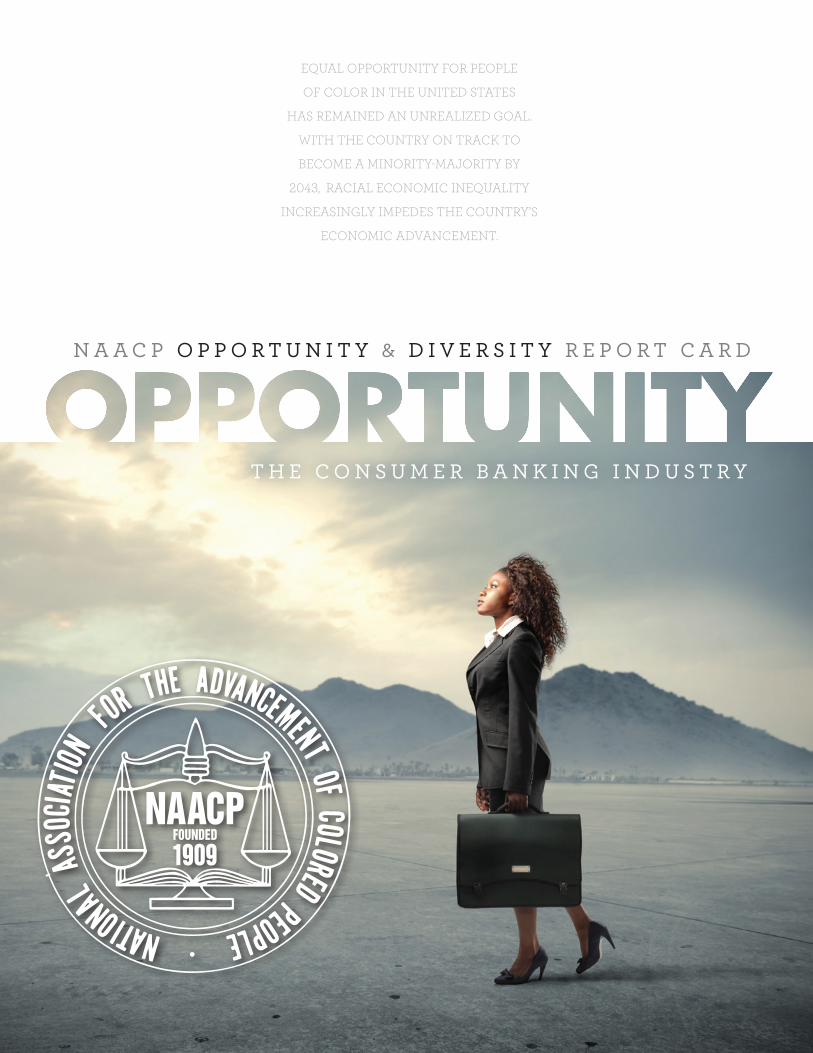
Equal opportunity for pEoplE
of color in thE unitEd StatES
haS rEmainEd an unrEalizEd goal.
With thE country on track to
bEcomE a minority-majority by
2043, racial Economic inEquality
incrEaSingly impEdES thE country’S
Economic advancEmEnt.
N A A C P O P P O r t u N i t y & D i v e r s i t y r e P O r t C A r D
t h e C O N s u m e r B A N k i N g i N D u s t r y

the Consumer Banking industry
NAACP National HeadquartersBaltimore, MD
Roslyn M. Brock
Chairman, Board of Directors
Lorraine C. MillerInterim President and CEO
NAACP Economic DepartmentFinancial Freedom Center
Washington, DC
Dedrick Asante-Muhammad, Senior Director of Economic DepartmentDawn Chase, Manager of Diversity and Inclusion
Jason Richardson, Fair Lending and Inclusion Specialist
NAACPO p p O r t u n i t y & D i v e r s i t y
r e p O r t C a r D
iv
n a a c p o p p o r t u n i t y a n d d i v E r S i t y r E p o r t c a r d
ACkNOwleDgmeNts
The NAACP would like to thank MWM Consulting Group, LLC for their research and technical assistance. In addition we acknowledge the input and expertise of the Insight Center, Center for Responsible Lending, National Community Reinvestment Coalition and UC Berkley Law School of African American Studies.
The NAACP Economic Department acknowledges the leadership of the National Board of Director’s Economic Development Committee.
Specifically, the NAACP Economic Department would like to acknowledge the leadership and support of Interim President and CEO Lorraine Miller, Chairman Roslyn M. Brock as well as the National Board of Directors Economic Development Committee chaired by Leonard James, III and the Housing Committee chaired by Attorney Gary Bledsoe.
The NAACP would also like to thank the financial services institutions for their participation in the survey process.
“To be a poor man is hard, but to be a poor race in a land of dollars is the very bottom of hardships.”
-W.E.B. Dubois
1
t h E c o n S u m E r b a n k i n g i n d u S t r y
COntents
Acknowledgments .......................................................................................................................................................ivOverview .......................................................................................................................................................................2Executive Summary .....................................................................................................................................................3Sector Analysis Introduction ......................................................................................................................................5The 2008 Housing Crash and Subsequent Recovery ...............................................................................................5The Role of Banking Institutions Included in this Survey ......................................................................................6A History of Diversity ..................................................................................................................................................6Employment and Opportunity ...................................................................................................................................8Financial Sector Employment Diversity in the Future ............................................................................................9Summary and Conclusions: Opportunity ...............................................................................................................10Government Diversity Best Practices ......................................................................................................................13NAACP Diversity Recommendations for the Banking Industry .........................................................................15Opportunities in the Banking Sector .......................................................................................................................16Report Card: Diversity ...............................................................................................................................................18Methods .......................................................................................................................................................................28Works Cited .................................................................................................................................................................30Appendix A: Category Grades for All Banks ..........................................................................................................31Appendix B: Grading .................................................................................................................................................33Appendix C: Bank Branch Maps ..............................................................................................................................34Appendix D: Detailed Methods ................................................................................................................................36
list Of figuresFigure 1 Management Level Diversity compared with educational attainment .................................................7Figure 2 College attainment by race and ethnicity ..................................................................................................8Figure 3 Projected employment increase in financial services sector through 2018 ...........................................9Figure 4 Enrollment in MBA programs by race and ethnicity .............................................................................10Figure 5 Management level diversity in banking compared with overall workforce levels ..............................11
2
n a a c p o p p o r t u n i t y a n d d i v E r S i t y r E p o r t c a r d
During this period of high unemployment and declining wealth, which is even more pronounced for African Americans and other people of color, Americans need living wage jobs with long-term career tracks. Given these dire economic circumstances, the NAACP is investigating the diversity and inclusion for industries with the greatest potential to influence job creation and wealth building in our Opportunity and Diversity Report Card. The NAACP recognizes the need to diversify major U.S. industries and seeks to move the country beyond the racial divides that continue to shape its current economy. Through our Opportunity and Diversity Report Card, we will regularly examine the current state of diversity and inclusion in various U.S. economic sectors, highlighting the ones that exhibit the greatest potential for African Americans and other people of color. Furthermore, the NAACP will partner with industry leaders to advance best practices for racial and ethnic inclusion and diversity.
Focusing on specific industries and their issues will permit greater collaboration between the NAACP and industry leaders to advance best practices in inclusion and ensure opportunities for diverse groups. We believe this strategy aligns with the NAACP Economic Program’s objective to “ensure that government and industry are knowledgeable and committed to bridging racial inequality, particularly as it relates to employment, wealth, lending and business ownership.”
In The NAACP Opportunity and Diversity Report Card: The Consumer Banking Industry, the second in a series of reports based on our former Economic Reciprocity Initiative: NAACP Consumer Choice Guide, we analyze the consumer banking industry’s inclusion and diversity practices as they pertain to the race and ethnicity of its workforce, management, and suppliers as well as practices that affect communities of color, such as small dollar loans and bank branch locations. The report card assesses the performance of five of the leading consumer banks in the U.S. in recognition that they possess the greatest potential to influence industry trends, policies and practices. In addition, it will inform the public about career opportunities and realities in the consumer banking industry as the nation strives to strengthen its economy.
Overview
Equal opportunity for people of color in the United States has remained an unrealized goal. With the country on track to
become a minority-majority by 2043,1 racial economic inequality increasingly impedes the country’s economic advancement.
1 United States Census Bureau, 2012
3
t h E c o n S u m E r b a n k i n g i n d u S t r y
exeCutive summaryOverview
1 United States Census Bureau, 2012
One million jobs are going to be added to the financial services sector between 2010 and 20202. While other sectors will add more jobs in raw numbers, few will add so many jobs paying as well as the
financial sector. The equitable distribution of those jobs is of paramount importance to the NAACP. This Opportunity and Diversity Report
Card for the Consumer Banking Industry is designed to help the leading financial corporations advance diversity and inclusion and in doing so
take another step in bridging racial economic inequality.
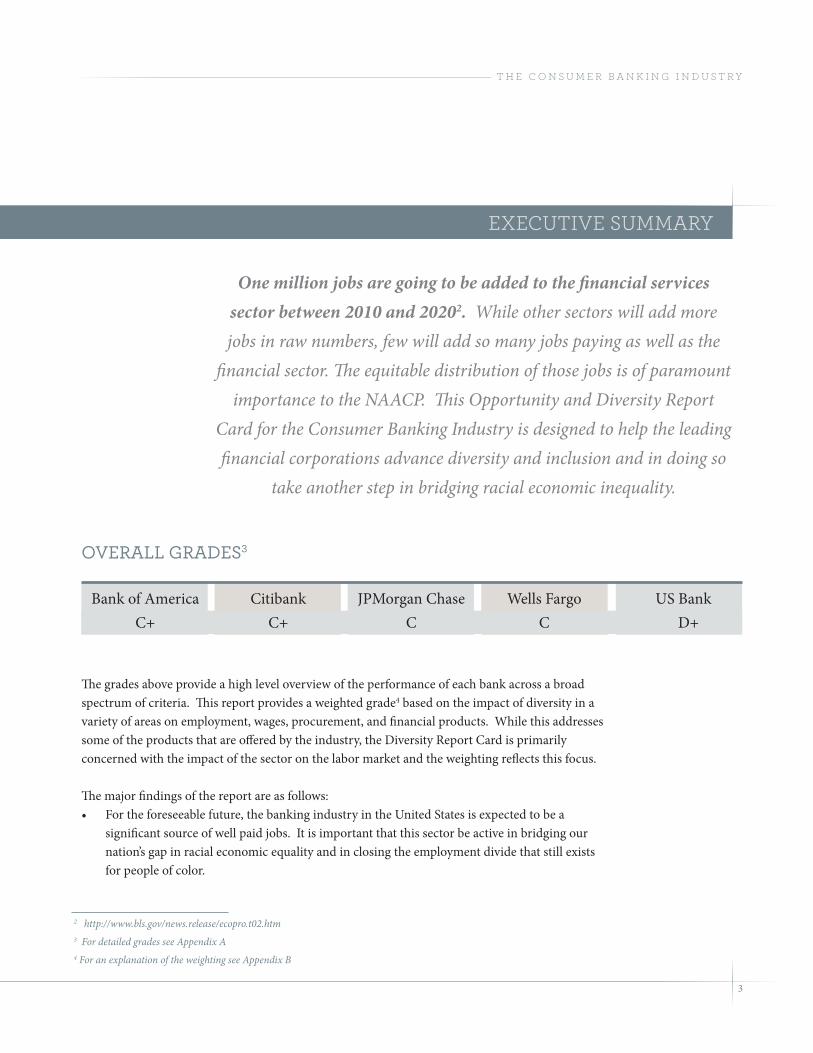
The grades above provide a high level overview of the performance of each bank across a broad spectrum of criteria. This report provides a weighted grade4 based on the impact of diversity in a variety of areas on employment, wages, procurement, and financial products. While this addresses some of the products that are offered by the industry, the Diversity Report Card is primarily concerned with the impact of the sector on the labor market and the weighting reflects this focus.
The major findings of the report are as follows:• For the foreseeable future, the banking industry in the United States is expected to be a
significant source of well paid jobs. It is important that this sector be active in bridging our nation’s gap in racial economic equality and in closing the employment divide that still exists for people of color.
OverAll grADes3
Bank of America Citibank JPMorgan Chase Wells Fargo US Bank C+ C+ C C D+
2 http://www.bls.gov/news.release/ecopro.t02.htm3 For detailed grades see Appendix A4 For an explanation of the weighting see Appendix B

4
n a a c p o p p o r t u n i t y a n d d i v E r S i t y r E p o r t c a r d
• Top management positions remain firmly dominated by white employees, despite the development of programs to increase diversity and in spite of dramatic increases in the number of highly educated minorities entering the workforce over the past 20 years.
• There is limited evidence from existing reports and our survey that highly skilled and middle management bank employees have become more diverse. Yet African Americans are still poorly represented in these categories.
• Semi-skilled positions are the only workforce sector where diversity levels approach equity. This category is under pressure from an increasingly automated banking experience and is shrinking as part of the overall sector.
• Banks continue to struggle with diversification in their supplier purchasing with 1.6% of their supplier budget being the most any bank spent on African American suppliers and 5.3% being the most any bank spent on firms owned by people of color.
• Many banks continue to create products which feature high cost credit or fee-based services. These regressive high cost products hurt the grades of several banks in this report and the NAACP feels strongly that it is imperative that mainstream financial institutions develop affordable small dollar lending products.
5
t h E c o n S u m E r b a n k i n g i n d u S t r y
seCtOr analysis
Deposit institutions such as consumer banks, thrifts, or credit unions play an integral part in the creation of the American middle class. Consumer banks provide most people with both a location to store accumulated wealth as well as the ability to leverage the collective wealth of depositors to build houses into homes, businesses into commercials enterprises, and towns into massive cities.
The financial sector is one of the great American success stories, and fulfills a critical role in the ability of the American economy to weather periodic storms. With local offices in every town and neighborhood, banks form stable anchors for growth. These companies have provided jobs in local areas to a wide swath of American workers, both skilled and not, and they currently employ 5.5 million people5.
the 2008 hOusiNg CrAsh AND suBsequeNt reCOveryThe housing crash of 2008 resulted in the greatest systemic shock to our banking sector since 1929, and the recovery period since then has seen significant shifts in the organization and employment characteristics of our largest consumer banks. In the aftermath of the collapse of the housing bubble, some banks failed and others required massive infusions of public dollars to recapitalize6. Even those that avoided the carnage of the crash relatively unscathed could not escape the new rules designed to prevent such a massive loss in the future.
iNtrODuCtiONIn general, the banking sector of the American economy is comprised of consumer and investment banks. Consumer banks accept deposits and lend capital to consumers for
investment in businesses, homes, and large purchases that most households cannot afford to purchase outright. These deposit institutions are the cornerstone of the financial sector
in terms of employment and they allow for the collective wealth of a large group to be used to enhance the financial ability of individuals or households.
throughout this section look for “Opportunity
Boxes” like this for info on how to find a career in the
banking sector.
5 According to BLS.gov Occupational Employment Statistics Query system, NAICS code 52-53 all occupations
6 (Immergluck, 2009)

6
n a a c p o p p o r t u n i t y a n d d i v E r S i t y r E p o r t c a r d
It is noted by banks and industry observers that there is a change underway in the kind of employee that is being sought after in the financial sector. While as a whole the sector continues to grow, the positions seeing the most growth are not those traditionally associated with diversity. Semi-skilled positions such as tellers, customer service persons, and technical positions are seeing lower growth than normal. Meanwhile positions requiring higher education and experience in the financial sector, such as financial advisor, mortgage loan officer, and investment professional, are expected to grow dramatically from 2010 through 20207. While the enrollment of minorities in suitable educational programs is steadily rising, as shown in Figure 1, we do not see a corresponding increase in minority inclusion at these high level positions.
the rOle Of BANkiNg iNstitutiONs iNCluDeD iN this surveyFor our inaugural NAACP Diversity Report Card on the banking industry we have selected five of the largest consumer banks in the country to survey. These banks provide a significant portion of deposit banking, mortgage lending, and branch services in the United States. In addition, they are all leaders in online banking and in developing new ways of offering services to people who are currently unbanked. This survey is not just a look at some of the largest participants in the retail banking market, but is a sample of the market itself.
A histOry Of DiversityIn 2013, the Government Accountability Office (GAO) completed the latest in a series of studies on the diversity of the workforce in the financial sector between the years 1993-20118. Their findings give strong indications of the successes and the challenges faced by this industry as well as suggestions for possible choices that could be made to create the diverse and creative workforce we feel is necessary to make equal opportunity a reality in this sector. Figure 5 notes that employment of African American and Hispanic workers in this sector has lagged behind overall workforce levels.
semi-skilleD POsitiONs iN BANkiNg: whAt is A “teller”?
Tellers are often the most visible bank employee to the general public. This position provides local employment to communities throughout the entire bank footprint. Tellers are considered “semi-skilled” by the Equal Employment Opportunity Commision -- the most diverse employment segment for the banking industry. However, this class of job encompasses many more positions than teller.
Customer service representatives fulfill many roles outside of a branch setting , from setting up accounts via phone or internet to handling consumer complaints regarding lost or stolen debit cards to transferring funds and explaining bank statements to account holders. Increasingly, the customer service representative is replacing the teller as the primary contact with the public.
Other technical functions such as vault employee, loan processor, receptionist, and fraud investigator all fit in the semi-skilled category as well. These are functions often unseen by the public yet critical to the function of the bank. Often covered under the EEO category of Financial Clerk, they provide an pathway for workers lacking finance backgrounds to gain experience and begin a career in banking.
7 BLS.gov8 (Government Accountability Office, 2013) (Government
Accountability Office, 2010)

7
t h E c o n S u m E r b a n k i n g i n d u S t r y
In general, senior management in the banking sector has long been dominated by white males, with 64% of these positions held by a white male in 2008. Consumer banks have enacted various diversity and inclusion programs. Among their efforts have been programs linking executive pay to the diversity of their departments, internship and scholarship programs to encourage minority students to explore banking careers, partnerships with minority networking groups, and mentoring programs for lower level employees, both female and of color, to encourage them to seek higher positions within the firm. Mentoring programs in particular are cited as being of critical importance, helping younger employees map out a career path for themselves.
The GAO study found that overall minority employment at the management level, from 1993-2011, increased by 7.9%. African American representation in this category rose just 0.7% during this period and Hispanic employment rose just 2.4%. The majority of the increase in minority representation came from the Asian segment, which grew 4% over this period. In part, these changes would be due to shifting demographics in the American workforce, as minorities began to increase as a percentage of the working age population. College attainment is more interesting and perhaps more relevant than simply looking at workforce demographics. In objective terms, and since it can be assumed that management level employees in the financial sector will require a minimum of a bachelor’s degree, significant growth in the attainment of a college education should be a harbinger of significant improvement
q: how would a young professional of color seek a career as a finance or investment professional with your bank?
Bank of America’s response: A young professional of color seeking any number of career opportunities at Bank of America has many ways to contact us. Prospective candidates can go through normal channels like our website or by reaching out to someone who works at the bank. As a student, they can attend one of our on-campus recruiting events. we hold more than 1800 events per year on more than 200 campuses around the world. many of those events are in partnership with diversity colleges and universities, including six historically Black Colleges and universities (hBCus) and three hispanic serving institutions (hsis). some of our partners include emerging leaders; Jumpstart undergraduate Diversity forum; mBA Jumpstart Diversity forum; Posse foundation; and the toigo foundation.
Perc
ent w
ith C
olle
ge D
egre
es Percent in Managem
ent
1993 1998 2000 2008 2011-12
Figure 1 Management level diversity compared with educational attainment (Government Accountability Office, 2010) (Government Accountability Office, 2013)
College DegreeBlack
College DegreeHispanic
Finance ManagementBlack
Finance ManagementHispanic
EEO-1 Data On DivErsity in thE Financial sErvicEs inDustry at thE ManagEMEnt lEvEl cOMparED with EDucatiOnal attainMEnt
8
n a a c p o p p o r t u n i t y a n d d i v E r S i t y r E p o r t c a r d
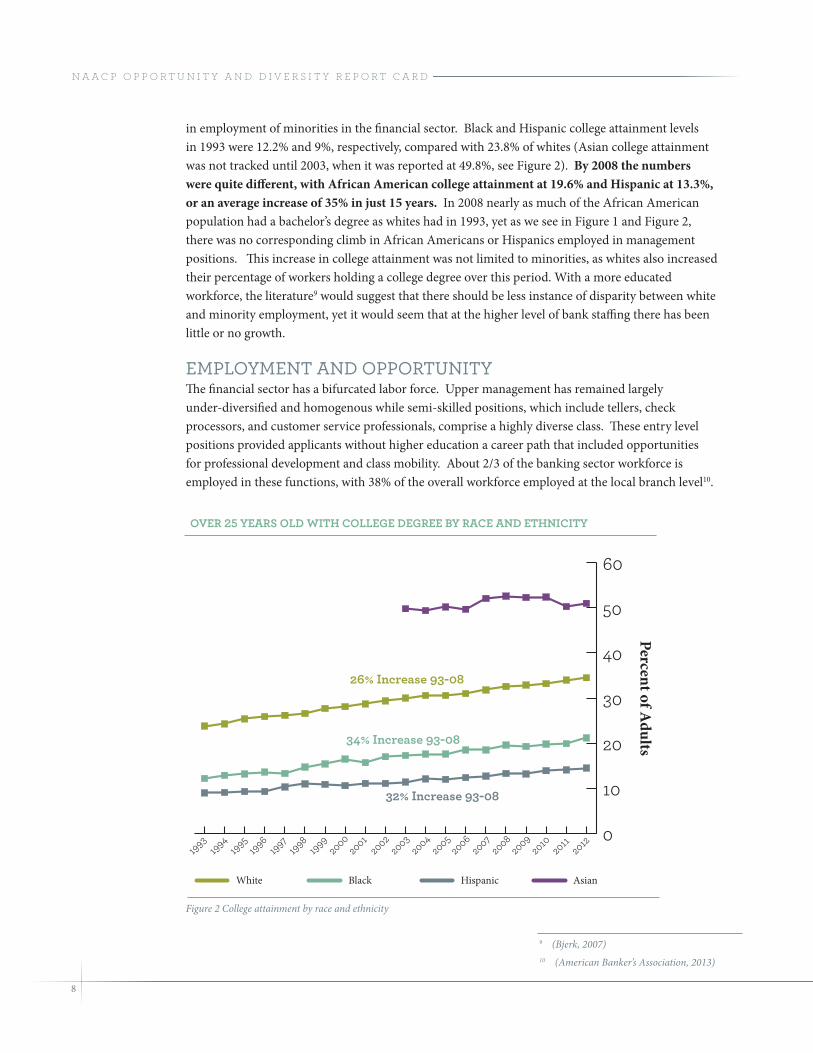
in employment of minorities in the financial sector. Black and Hispanic college attainment levels in 1993 were 12.2% and 9%, respectively, compared with 23.8% of whites (Asian college attainment was not tracked until 2003, when it was reported at 49.8%, see Figure 2). By 2008 the numbers were quite different, with African American college attainment at 19.6% and Hispanic at 13.3%, or an average increase of 35% in just 15 years. In 2008 nearly as much of the African American population had a bachelor’s degree as whites had in 1993, yet as we see in Figure 1 and Figure 2, there was no corresponding climb in African Americans or Hispanics employed in management positions. This increase in college attainment was not limited to minorities, as whites also increased their percentage of workers holding a college degree over this period. With a more educated workforce, the literature9 would suggest that there should be less instance of disparity between white and minority employment, yet it would seem that at the higher level of bank staffing there has been little or no growth.
emPlOymeNt AND OPPOrtuNityThe financial sector has a bifurcated labor force. Upper management has remained largely under-diversified and homogenous while semi-skilled positions, which include tellers, check processors, and customer service professionals, comprise a highly diverse class. These entry level positions provided applicants without higher education a career path that included opportunities for professional development and class mobility. About 2/3 of the banking sector workforce is employed in these functions, with 38% of the overall workforce employed at the local branch level10.
Percent of Adults
OvEr 25 yEars OlD with cOllEgE DEgrEE by racE anD Ethnicity
White Black Hispanic Asian
Figure 2 College attainment by race and ethnicity
9 (Bjerk, 2007)10 (American Banker’s Association, 2013)
26% increase 93-08
34% increase 93-08
32% increase 93-08

9
t h E c o n S u m E r b a n k i n g i n d u S t r y
As automation and technology allowed banks to rid themselves of the branch model, where bank functions were disaggregated at the local level and individual branches functioned as distinct entities, we have seen a shift in where the functions that traditionally define a “bank” are located. Often, bank branches simply function as the physical embodiment of the financial firm, allowing customers to deposit or withdraw funds, speak with bank staff in person, or make use of other bank services such as safety deposit boxes. However, many of the activities the traditional bank was known for, such as financial advice, account setup, loan approval, or business and commercial services, are now often located at remote locations. For the purposes of this study we consider bank employment to be any work performed in the consumer banking sector, although it may not be physically at a branch location.
fiNANCiAl seCtOr emPlOymeNt Diversity iN the futureAlthough the employment opportunities in the banking sector continue to grow in 2013, the rate and composition of growth has changed dramatically. In fact, between 2009 and 2010 the sector grew by just 2.5% overall. This is understandable since this period saw extensive reorganization of the job functions needed by banks due to the aftermath of the financial crisis. In addition to this the growth of the financial sector is held back by the reduction in branch locations. According to the FDIC, 857 net branches were closed between June, 2011 and June, 201211.
Figure 3 Projected employment increase in financial services sector through 2018
In general, wages in the banking industry are expected to rise faster than other sectors in coming years. This is largely due to a move away from hiring semi-skilled workers and a concentration on areas where banks note they have a harder time filling positions13 in lending, financial compliance, and financial management positions—roles where the Bureau of Labor Statistics notes the job outlook between 2010 and 2020 is higher than average. This process is known to create significant inequalities as job polarization reduces the need for semi-skilled workers14. Lower wage positions will see their share of banking jobs shrink, closing the window by which many women and people of color gain access to the financial labor market. This raises critical issues for diversity in this sector. Consumer banks are increasingly interested in automation and the reduction of their physical footprint15. The job functions of banking seeing the most growth requires a specialized skill set and education that is difficult to gain outside of the
Employment12 Percent change(in 000’s) 1998 2008 2018 1998-2008 2008-2018Non-farm 126,624 137,814 152,443 8.8% 10.6%Financial services 7,462 8,145 8,702 9.2% 6.8%
11 (Federal Deposit Insurance Corporation, 2012)12 (American Banker’s Association, 2013)13 (American Banker’s Association, 2013)14 (Mishel, Schmitt, & Shierholz, 2013)15 (Switzky, 2013)
10
n a a c p o p p o r t u n i t y a n d d i v E r S i t y r E p o r t c a r d
higher education and the banking industry. While some economists fear that the increased pace of automation in general may result in a decline in the semi-skilled positions which we know to be the most diverse16, others claim that automation will naturally open new semi-skilled positions to compensate.17 However, those may not be in the banking sector, meaning young workers of diverse backgrounds will be unable to learn the specialized skill sets required to move up the workforce of the banking sector.
Perhaps most importantly, the way in which banks interact with neighborhoods is changing as most of the bigger institutions transition away from the tradition bank branch. In general, these new format banking centers are much smaller than their predecessors and are focused on automated assistance, sometimes making use of a remote teller.18 Banks are betting that by using this method, they can service many of the traditional needs a customer would visit a bank for, including mortgage and loan sales, rather than employing people at the branch location itself. This means that in labor markets without physical banks, a critical pathway to bank management may be lost for telecommuting loan officers, and the impact on women and people of color could be substantial. This highlights the need for banks to re-double their efforts to ensure diversity and make certain that new processes do not weaken an already poor record of inclusion.
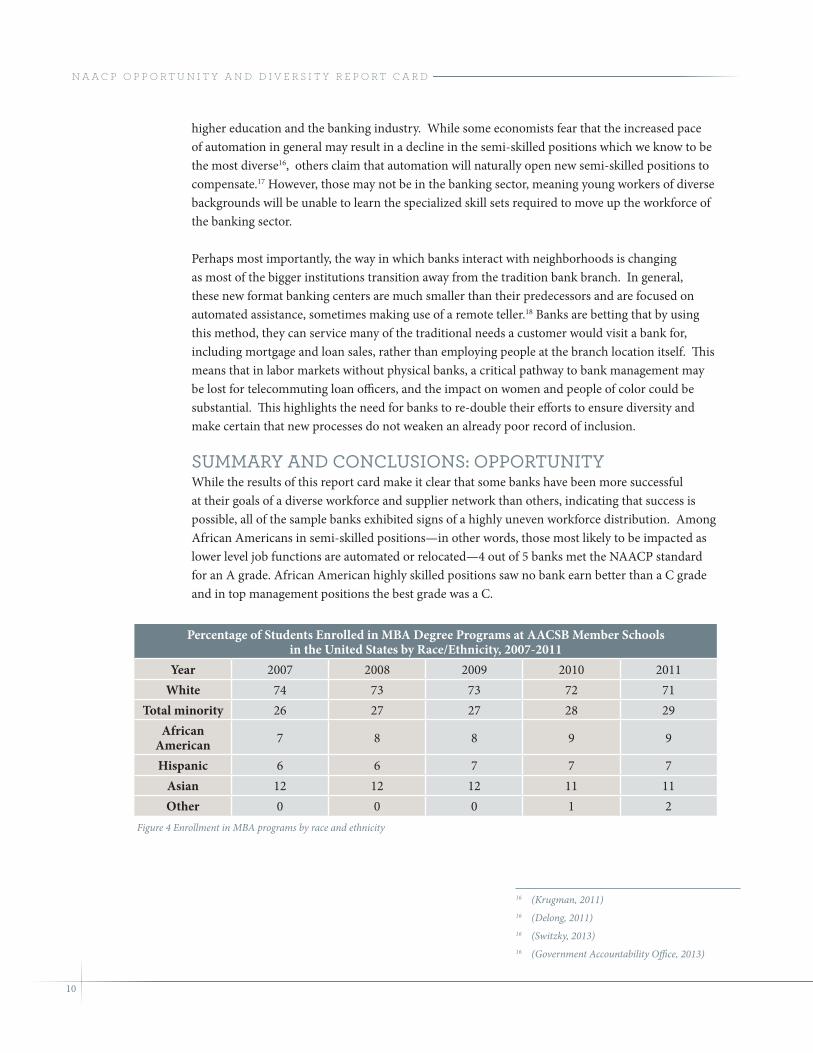
summAry AND CONClusiONs: OPPOrtuNityWhile the results of this report card make it clear that some banks have been more successful at their goals of a diverse workforce and supplier network than others, indicating that success is possible, all of the sample banks exhibited signs of a highly uneven workforce distribution. Among African Americans in semi-skilled positions—in other words, those most likely to be impacted as lower level job functions are automated or relocated—4 out of 5 banks met the NAACP standard for an A grade. African American highly skilled positions saw no bank earn better than a C grade and in top management positions the best grade was a C.
16 (Krugman, 2011)16 (Delong, 2011)16 (Switzky, 2013)16 (Government Accountability Office, 2013)
Percentage of Students Enrolled in MBA Degree Programs at AACSB Member Schools in the United States by Race/Ethnicity, 2007-2011
Year 2007 2008 2009 2010 2011White 74 73 73 72 71
Total minority 26 27 27 28 29African
American 7 8 8 9 9
Hispanic 6 6 7 7 7Asian 12 12 12 11 11Other 0 0 0 1 2
Figure 4 Enrollment in MBA programs by race and ethnicity

11
t h E c o n S u m E r b a n k i n g i n d u S t r y
Although the GAO study noted that banks cited a lack of educated minorities who were suitable for employment in this sector, the educational attainment of both African American and Hispanic adults has greatly increased since 1993 without a corresponding rise in the representation of these groups among bank employees. The available data on both educational attainment and MBA enrollment would suggest that education is not the barrier for minorities that it is perceived to be. No group has increased its share of MBA recipients more than African Americans and no groups has seen its share of MBA holders fall as much as whites without any measurable shift in employment diversity according to Figure 4 above. In particular, minorities remain conspicuously absent from the top management of consumer banks. This result appears to be true in the results of the GAO report as well as the responses of the majority of our sample banks. Again, these findings suggest both that educational barriers are not the primary obstacle to high level diversity, and that further study would be warranted since 20 years of educational attainment seems to have produced little or no improvement in sector diversity. Indeed, more interesting is the idea of some in the industry that the appeal of a career in finance has been tarnished by the recent financial and foreclosure crisis. However, this doesn’t explain the unchanged level of diversity from pre-2008 to today at higher levels, nor does it explain the overall greater degree of success at minority promotion to senior management levels that public agencies have shown.
EEO-1 Data On DivErsity in thE Financial sErvicEs inDustry at thE ManagEMEnt lEvEl cOMparED with OvErall wOrkFOrcE lEvEls
1993 1998 2000 2008
Perc
ent
Workforce % Black
Figure 5 Management level diversity in banking compared with overall workforce levels
Workforce % Hispanic Workforce % Asian
Finance Management Black Finance Management Hispanic Finance Management Asian

12
n a a c p o p p o r t u n i t y a n d d i v E r S i t y r E p o r t c a r d
This lack of movement in terms of diversity over such a long period is problematic in view of the considerable effort each of the sample banks has listed as part of their diversity efforts. These include substantial work in creating and documenting diversity initiatives, participating in multi-industry diversity panels and workshops, and actively recruiting diverse suppliers and college graduates. Yet these efforts appear to have resulted in little progress outside of the semi-skilled occupations. Overall, the higher workforce categories (governing body, management, and highly skilled) show remarkably low levels of diversity in this survey, especially with African Americans. As the NAACP follows up with the banking sector on a future report card it will be interesting to examine the longitudinal effect of increasingly educated minority workers and a shrinking semi-skilled or entry-level category. Public financial regulatory agencies have successfully navigated this transition by stepping up recruitment of educated minority workers. However, the GAO report and our survey show no similar success has yet appeared in the private sector.
While the shift to a more skilled workforce and a concentration of customer service functions will assist banks in meeting the expectations of Wall Street, it may make their efforts at increasing the diversity of their total workforce harder to achieve. Banks will need to focus more heavily on their recruitment, mentoring, and educational outreach efforts to lure qualified candidates to the banking industry from existing occupations requiring skill sets that overlap with banking, such as real estate or insurance. They will also need to increase their visibility to students.
Because they can impact a larger number of individual workers, the supplier diversity categories, including media and advertising spending, represent a greater potential impact on minority wealth and asset building than the direct employment of minorities. Where a single major contract with a firm that is part of our survey might support the operations of an entire minority owned company, the result is often far more widespread than that of employing an individual directly. Uniformly, all of the survey respondents demonstrated substantial room for improvement in supplier diversity spending and we anticipate a significant improvement in our follow up report card on this sector.
A critical concept that is coupled with the principles of equal employment and asset building that our workforce and supplier diversity categories address is that the products offered by the sector
q: what do you recommend to an African American, recent college graduate who is interested in a career in mortgage or small business lending with your bank?
wells fargo’s response: there is a wealth of information available for students and recent college graduates related to careers on our company website at wellsfargo.com/careers. specific to students interested in careers in Community Banking: we also encourage current African-American college students and recent graduates to network with our team members and recruiters at the various industry and diversity conferences we attend annually across the country, such as the National Black mBA Association Conference and the thurgood marshall College fund National leadership institute. At these conferences and other similar events, students and recent graduates can learn more about full-time positions and career paths within our organization and make meaningful connections with industry professionals who can help them navigate the job search process and hone their career management skills.
specific to students interested in careers in the mortgage business: the Consumer lending group offers a summer internship program which gives current college students an opportunity to build their professional network and gain tangible industry experience that can help lead them to a full-time career in the mortgage business or financial services more broadly.
13
t h E c o n S u m E r b a n k i n g i n d u S t r y
not take advantage of the inequalities of our economy. Small dollar loans, payday lending, and overdraft loans are intended for lower income workers and have the potential to be beneficial or predatory. The NAACP supports the historically effective 36% APR rate limit for all credit products and using that standard the banks included in this survey show a clear distinction between those which offer quality, low cost credit options and those who do not.20
At the local level, several sources have indicated that physical branch location is critical to a number of the diversity efforts considered by this report card21. Among these are the jobs in both teller and customer service positions which are widely seen as an entry point into the banking industry for young people of color that lack higher education. The ability to learn the skills required by the banking industry and further their education is critically important to African Americans and people of color who wish to rise in this industry. In addition, these locations are a critical link cited by several sources as driving loan activity, banking access, and commercial development in the surrounding areas.22 23 The analysis of bank branches we conducted reveals relatively mediocre investment in facilities in diverse neighborhoods. However, there is concern that the trend of replacing these full service branches with ATMs or understaffed branches will not have the same impact as a full service branch. Future report cards on this sector will be able to look back and determine what changes, if any, appear in the number or percentage of branch locations occurring in minority areas.
gOverNmeNt Diversity Best PrACtiCesThroughout this report card, the methods and findings are informed by a series of reports on the finance industry. The Government Accountability Office (GAO) takes a broader view of what this industry includes than our report, but their findings still speak to the overall challenges faced by diversity proponents in the financial sector. Critically, the GAO identifies nine practices which seem to correlate with greater success at diversification.24
• Commitment to diversity as demonstrated and communicated by an organization’s top leadership
• Inclusion of diversity management in an organization’s strategic plan
• Diversity linked to performance, making the case that a more diverse and inclusive work environment could help improve productivity and individual and organizational performance
• Measurement of the impact of various aspects of a diversity program
q: if a college graduate of color is already working in banking and their goal is to move into a top management or C-suite position, what would you recommend they pursue with regards to further education or experience?
u.s. Bank’s response: u.s. Bank provides its employees a rich mix of challenging and exciting job opportunities in our varied business lines and corporate functions. Because of this rich variety, and because employees are inherently unique in their skills, experience and interests, no two career paths are ever the same.
u.s. Bank also focuses specifically on developing senior leaders of color. the company selects high-performing leaders of color to participate in a unique year-long mentorship opportunity offered by a company specializing in formal corporate mentoring programs.
20 (Mayer, 2012)21 (Government Accountability Office, 2013)22 (Richardson, 2012)23 (Federal Deposit Insurance Corporation, 2012)24 (Government Accountability Office, 2013)

14
n a a c p o p p o r t u n i t y a n d d i v E r S i t y r E p o r t c a r d
• Management accountability for the progress of diversity initiatives
• Succession planning
• Recruitment
• Employee involvement in an organization’s diversity management
• Training for management and staff about diversity management.
Using interviews with industry partners as well as Office of Minority and Women Inclusion (OMWI) offices required under the Dodd-Frank Act and EEOC data, the GAO has noted that commitment to diversity from leadership drove the other eight practices. Industry contacts further noted that sponsoring diverse candidates and promotional applicants as well as addressing cognitive or unconscious bias was effective, while agency OMWI staff reported that targeted recruitment, training for hiring managers, and internship programs had been highly effective. It is worth noting that while industry diversity has remained relatively unchanged over the duration of the study (1993-2011), the public agencies working under Dodd-Frank mandated OMWI offices have successfully increased their diversity even while automation dramatically decreased their entry level or semi-skilled workforce25.
The GAO also looked at the supplier diversity of public agencies in the finance sector. While this report card does the same for the sample banks, the GAO study was limited to the diverse procurement provisions of the Dodd-Frank Act that financial regulatory agencies such as the Federal Reserve Board are bound by. However, their findings on this topic can inform our report on these efforts by private consumer banks as well. In broad terms, the GAO discovered that many OMWI offices were not staffed with procurement specialists, which made it difficult to both identify and connect with diverse suppliers. In addition, the agencies often had trouble getting apparently qualified candidates to apply for bids even when approached to do so. Larger agencies, roughly analogous in size and needs to our larger sample banks, also noted that due to economies of scale they often seek larger producers, reducing the pool of firms which can be qualified as diverse.
q: if you were speaking with a young person of color who has just completed high school and they expressed to you an interest in a teller or customer service position with your bank what would you recommend?
JPmorgan Chase’s response: Chase has over 5,600 locations where our tellers are the first and most frequent point of contact with our customers. through face-to-face interactions with customers, tellers have the opportunity to provide top-notch customer service by handling financial transactions accurately and efficiently. As a teller with Chase, your day will be spent having professional and friendly interactions with both customers and Chase team members.
hiring managers focus on three core areas when interviewing for tellers – work history, customer service and cash handling experience.
25 (Government Accountability Office, 2013)
15
t h E c o n S u m E r b a n k i n g i n d u S t r y
NAACP Diversity reCOmmeNDAtiONs fOr the BANkiNg iNDustryAfter reviewing the leading banks in the financial sector the NAACP has developed recommendations in two areas: top management and supplier diversity.• The NAACP recommends an adaptation of the “RLJ Rule26” proposed by Robert Johnson to
expand upper management and supplier diversity in the financial industry. This principle holds that for roles at the vice president level or above, and for all supplier contracts, the business seek out and interview at least two qualified people of color. In practice, the result is that qualified individuals normally excluded from the recruitment process or skipped over for interviews are given a chance to prove their value.
• Many sources for this report have noted that diversity at the top management level is made difficult because candidates for these positions are generally recruited from inside the existing organization and require an extended tenure at the bank sometimes up to twenty years. To overcome these challenges the NAACP recommends that the banking industry recruit qualified people of color from outside the financial institution and accelerate promotional opportunities to advance top management diversity. As this report shows, the number of minorities with advanced education and experience has grown dramatically over the past 20 years and these suggested reforms will make is possible to take advantage of the growth in qualified minority finance professionals.
• The NAACP also recommends that banks add flexibility to their procurement system which would allow them to break orders into smaller increments to facilitate more participation from smaller businesses which will be of particular help for businesses owned by people of color. In addition, primary, or Tier 1, contractors can be required to utilize minority owned subcontractors.
• Finally, the NAACP asks that the leading banks develop a goal based timeline for achieving diversity and that they produce empirical results indicating increased workforce and supplier diversity. This will require that all levels of the bank be held accountable for meeting goals related to workforce and supplier diversity, and that those goals and the efforts made in their pursuit be tracked by diversity staff within each organization.
The NAACP, will continue to advocate for greater diversity. We encourage the subjects of this report card to actively recruit, mentor, and retain qualified women and people of color for their workforce. Additionally, we encourage our banking partners to approach their labor decisions with the long term value of a diverse and inclusive workforce in mind, and that a local presence and investment in people is what has built the power of the financial sector in our communities.
26 Private Equity Perspective: The RLJ Rule http://rljequitypartners.com/downloads/PRIVATE-EQUITY-PERSPECTIVE-The-RLJ-Rule-published-in-Mergers-Acquisitions.pdf
16
n a a c p o p p o r t u n i t y a n d d i v E r S i t y r E p o r t c a r d
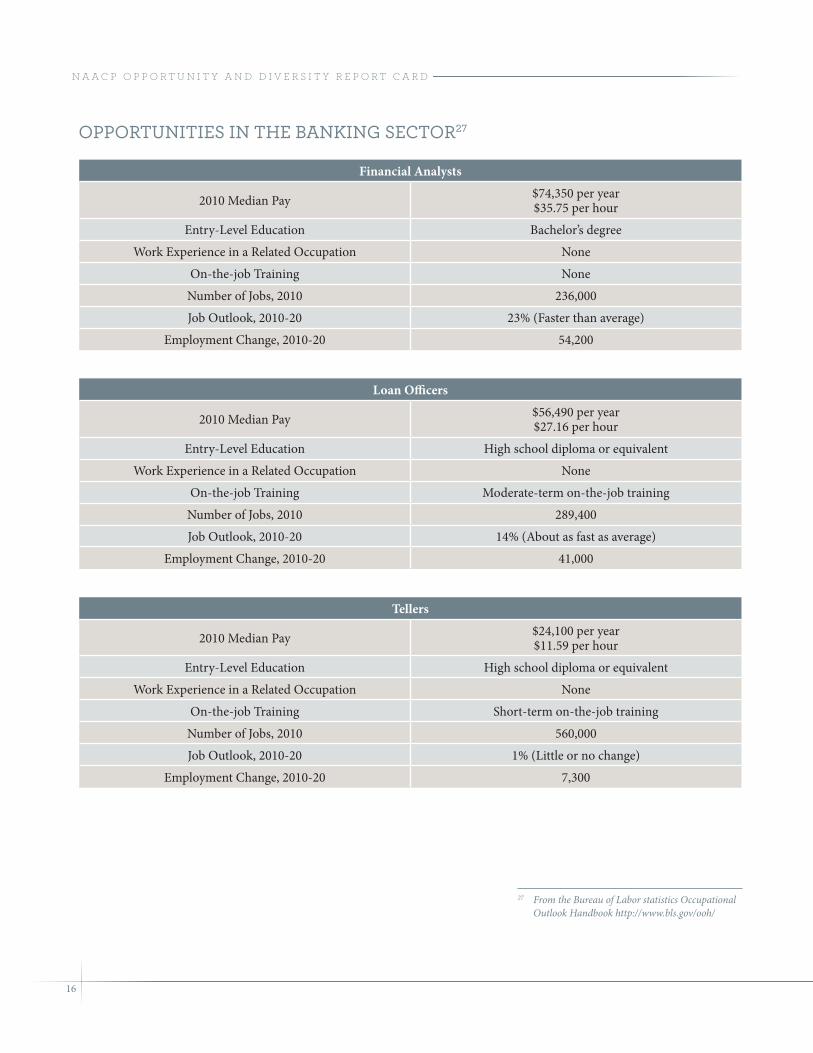
Financial Analysts
2010 Median Pay $74,350 per year $35.75 per hour
Entry-Level Education Bachelor’s degree
Work Experience in a Related Occupation None
On-the-job Training None
Number of Jobs, 2010 236,000
Job Outlook, 2010-20 23% (Faster than average)
Employment Change, 2010-20 54,200
Loan Officers
2010 Median Pay $56,490 per year$27.16 per hour
Entry-Level Education High school diploma or equivalent
Work Experience in a Related Occupation None
On-the-job Training Moderate-term on-the-job training
Number of Jobs, 2010 289,400
Job Outlook, 2010-20 14% (About as fast as average)
Employment Change, 2010-20 41,000
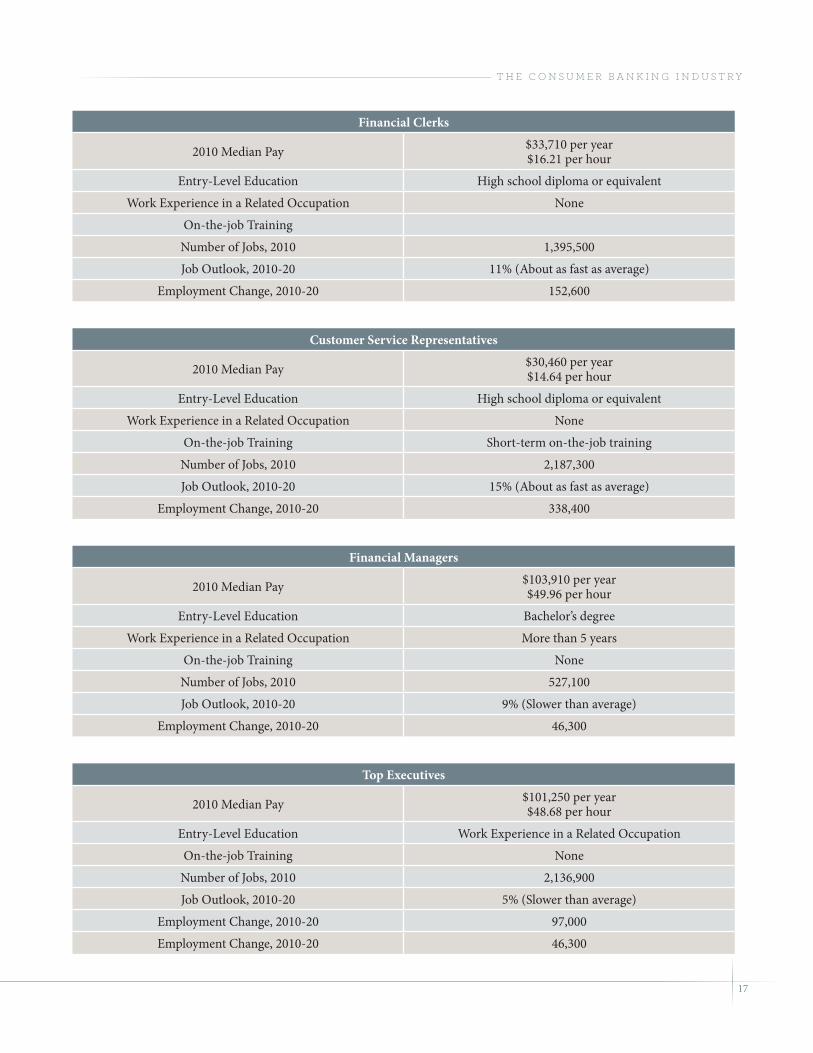
OPPOrtuNities iN the BANkiNg seCtOr27
Tellers
2010 Median Pay $24,100 per year$11.59 per hour
Entry-Level Education High school diploma or equivalent
Work Experience in a Related Occupation None
On-the-job Training Short-term on-the-job training
Number of Jobs, 2010 560,000
Job Outlook, 2010-20 1% (Little or no change)
Employment Change, 2010-20 7,300
27 From the Bureau of Labor statistics Occupational Outlook Handbook http://www.bls.gov/ooh/
17
t h E c o n S u m E r b a n k i n g i n d u S t r y
Financial Clerks
2010 Median Pay $33,710 per year$16.21 per hour
Entry-Level Education High school diploma or equivalent
Work Experience in a Related Occupation None
On-the-job Training
Number of Jobs, 2010 1,395,500
Job Outlook, 2010-20 11% (About as fast as average)
Employment Change, 2010-20 152,600
Customer Service Representatives
2010 Median Pay $30,460 per year$14.64 per hour
Entry-Level Education High school diploma or equivalent
Work Experience in a Related Occupation None
On-the-job Training Short-term on-the-job training
Number of Jobs, 2010 2,187,300
Job Outlook, 2010-20 15% (About as fast as average)
Employment Change, 2010-20 338,400
Financial Managers
2010 Median Pay $103,910 per year$49.96 per hour
Entry-Level Education Bachelor’s degree
Work Experience in a Related Occupation More than 5 years
On-the-job Training None
Number of Jobs, 2010 527,100
Job Outlook, 2010-20 9% (Slower than average)
Employment Change, 2010-20 46,300
Top Executives
2010 Median Pay $101,250 per year$48.68 per hour
Entry-Level Education Work Experience in a Related Occupation
On-the-job Training None
Number of Jobs, 2010 2,136,900
Job Outlook, 2010-20 5% (Slower than average)
Employment Change, 2010-20 97,000
Employment Change, 2010-20 46,300

18
n a a c p o p p o r t u n i t y a n d d i v E r S i t y r E p o r t c a r d
rePOrt CArD: Diversity
Bank of America ResultsGrade: C+
Overall: Bank of America employs over 230,000 people and includes over 5,224 full service branches. When accounting for all variables, including workforce and supplier diversity, products, and bank branch locations, it earned an overall grade of C+.
Notable areas of performance: Areas which Bank of America performed well in compared with their peer group included the diversity among their middle management. Finally, Bank of America’s branch locations were significantly better than the peer group with their B grade indicating that their branch locations are equitably distributed in areas where people of color live. Bank of America also displays a willingness to invest more with African American owned banks and financial institutions than other banks in our study. In addition, since 2011 Bank of America has made significant improvements in their overdraft policies which have resulted in far fewer customers being impacted by these fees and they have recently made changes to their Board of Directors which will result in a much improved grade in this category in the future.
Opportunities for improvement: As is the disappointing norm in the banking industry, the level of overall diversity at Bank of America declines at the higher end of the workforce spectrum. This includes the governing body and top management. This trend is mirrored in the peer group as well as previous literature. In addition, expensive overdraft loans and low grades in the supplier diversity and advertising categories, are areas the NAACP hopes that Bank of America can improve on for thenext report card.
Diversity Initiatives:
Employment Diversity: Bank of America notes its record of recognition for progressive workplace practices. The Bank of America website offers several factsheets about these efforts that provide a more extensive list of the efforts Bank of America has made in this area.
The bank has noted several partnerships with global and national organizations that allow it to participate in diversity recruiting events. In particular it noted a Diversity Executive Recruiting program where it actively identifies prospective executives.
Supplier Diversity: Bank of America works with diversity councils that are members of the National Minority Supplier Development Council and the Women’s Business Enterprise National Council. It also provides the funding and technical support for these entities.
Additionally, it also maintains partnerships with the National Gay and Lesbian Chamber of Commerce and the United States Business Leadership Network, nationally. An additional 650 diverse suppliers were leveraged to provide support for broader marketing-related activities.

19
t h E c o n S u m E r b a n k i n g i n d u S t r y
Bank of America
Overall Grade: C+
African American
NAACP Minimum
Expectation28People of Color
NAACP Minimum
Expectation
Governing Body D 7% C 15%
Top Management D 4% D 15%
Mid/Lower Management B 7% A 20%
Highly Skilled C 7% B 20%
Semi-Skilled A 7% A 20%
New Hires A 7% A 20%
Promotions A 7% A 20%
Turnover C 15% C 15%
Supplier Diversity D 2% D 6%
Ad agencies (%) F 2% A 6%
Media spend (%) F 2% F 6%
Branch C 13% B 30%
$ with Black/Minority-owned
banksA 0.00001% B 0.0001%
Variables not specific to AA/POC
Small dollar loans Not Offered29 <36% APR
Overdraft Fee High Cost30 <36% APR
$ with payday lenders C <0.01%
28 This is the minimum threshold for a grade of C in this category29 Bank of America indicates they offer no loans in this category30 Though the overdraft policies of Bank of America do allow a consumer to
overdraw his or her account, they do not permit the consumer to overdraw the account via debit card point-of-sale transaction. This positive step has dramatically reduced the amount of fees charged to Bank of America customers and is reflected in a bonus point awarded to its grade, although they are still considered high cost.
20
n a a c p o p p o r t u n i t y a n d d i v E r S i t y r E p o r t c a r d
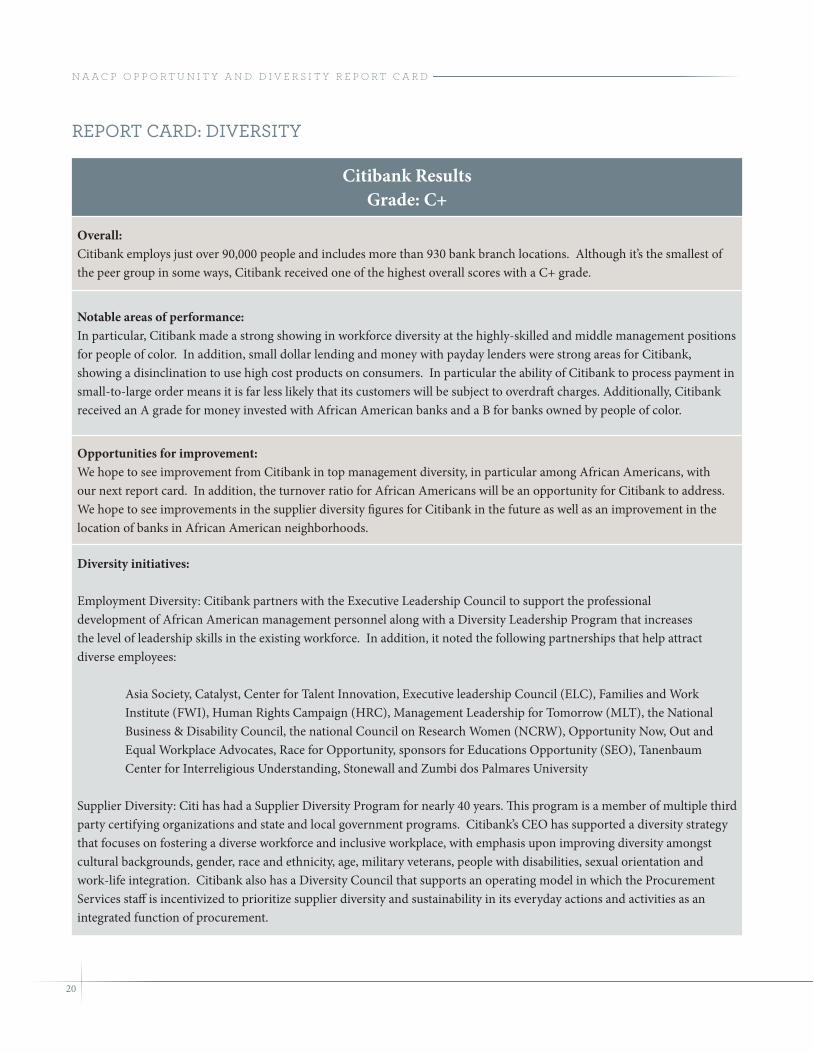
Citibank ResultsGrade: C+
Overall: Citibank employs just over 90,000 people and includes more than 930 bank branch locations. Although it’s the smallest of the peer group in some ways, Citibank received one of the highest overall scores with a C+ grade.
Notable areas of performance: In particular, Citibank made a strong showing in workforce diversity at the highly-skilled and middle management positions for people of color. In addition, small dollar lending and money with payday lenders were strong areas for Citibank, showing a disinclination to use high cost products on consumers. In particular the ability of Citibank to process payment in small-to-large order means it is far less likely that its customers will be subject to overdraft charges. Additionally, Citibank received an A grade for money invested with African American banks and a B for banks owned by people of color.
Opportunities for improvement: We hope to see improvement from Citibank in top management diversity, in particular among African Americans, with our next report card. In addition, the turnover ratio for African Americans will be an opportunity for Citibank to address. We hope to see improvements in the supplier diversity figures for Citibank in the future as well as an improvement in the location of banks in African American neighborhoods.
Diversity initiatives:
Employment Diversity: Citibank partners with the Executive Leadership Council to support the professional development of African American management personnel along with a Diversity Leadership Program that increases the level of leadership skills in the existing workforce. In addition, it noted the following partnerships that help attract diverse employees:
Asia Society, Catalyst, Center for Talent Innovation, Executive leadership Council (ELC), Families and Work Institute (FWI), Human Rights Campaign (HRC), Management Leadership for Tomorrow (MLT), the National Business & Disability Council, the national Council on Research Women (NCRW), Opportunity Now, Out and Equal Workplace Advocates, Race for Opportunity, sponsors for Educations Opportunity (SEO), Tanenbaum Center for Interreligious Understanding, Stonewall and Zumbi dos Palmares University
Supplier Diversity: Citi has had a Supplier Diversity Program for nearly 40 years. This program is a member of multiple third party certifying organizations and state and local government programs. Citibank’s CEO has supported a diversity strategy that focuses on fostering a diverse workforce and inclusive workplace, with emphasis upon improving diversity amongst cultural backgrounds, gender, race and ethnicity, age, military veterans, people with disabilities, sexual orientation and work-life integration. Citibank also has a Diversity Council that supports an operating model in which the Procurement Services staff is incentivized to prioritize supplier diversity and sustainability in its everyday actions and activities as an integrated function of procurement.
rePOrt CArD: Diversity
21
t h E c o n S u m E r b a n k i n g i n d u S t r y
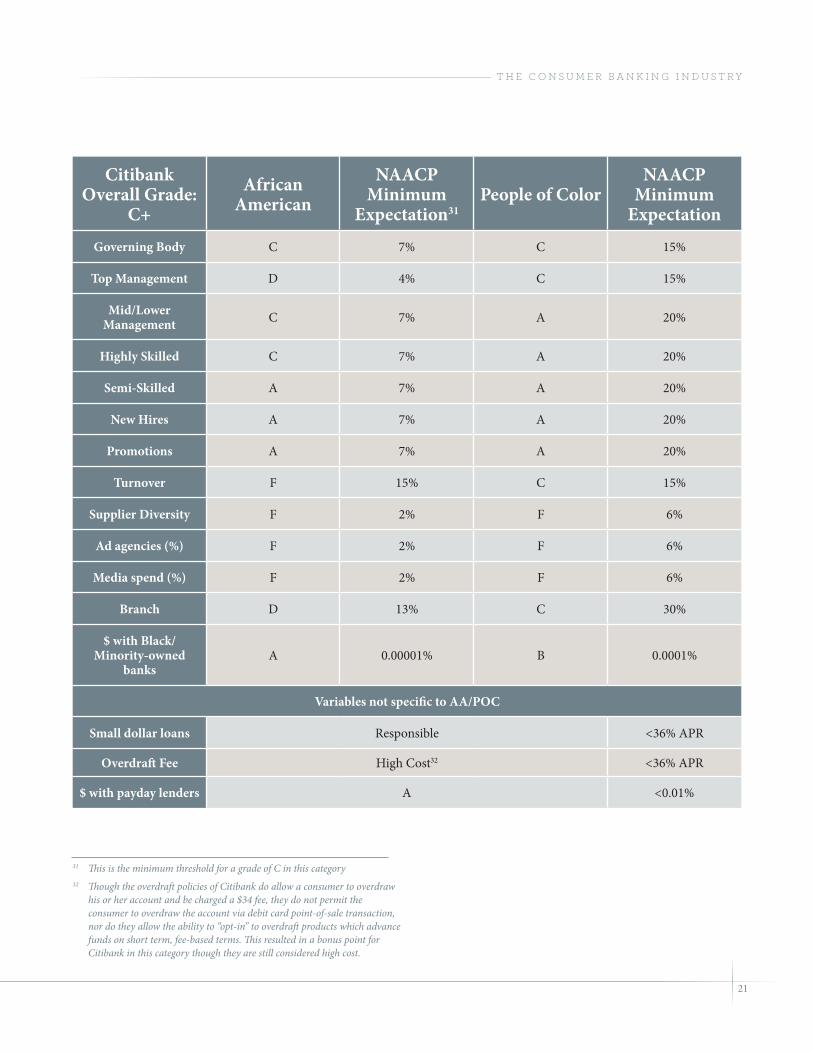
CitibankOverall Grade:
C+African
AmericanNAACP
Minimum Expectation31
People of ColorNAACP
Minimum Expectation
Governing Body C 7% C 15%
Top Management D 4% C 15%
Mid/Lower Management C 7% A 20%
Highly Skilled C 7% A 20%
Semi-Skilled A 7% A 20%
New Hires A 7% A 20%
Promotions A 7% A 20%
Turnover F 15% C 15%
Supplier Diversity F 2% F 6%
Ad agencies (%) F 2% F 6%
Media spend (%) F 2% F 6%
Branch D 13% C 30%
$ with Black/Minority-owned
banksA 0.00001% B 0.0001%
Variables not specific to AA/POC
Small dollar loans Responsible <36% APR
Overdraft Fee High Cost32 <36% APR
$ with payday lenders A <0.01%
31 This is the minimum threshold for a grade of C in this category32 Though the overdraft policies of Citibank do allow a consumer to overdraw
his or her account and be charged a $34 fee, they do not permit the consumer to overdraw the account via debit card point-of-sale transaction, nor do they allow the ability to “opt-in” to overdraft products which advance funds on short term, fee-based terms. This resulted in a bonus point for Citibank in this category though they are still considered high cost.

22
n a a c p o p p o r t u n i t y a n d d i v E r S i t y r E p o r t c a r d
JPMorgan ResultsGrade: C
Overall: JPMorgan Chase received an overall grade of C. This included good workforce and turnover figures for its 191,000 employees and includes more than 5454 full service branch locations.
Notable areas of performance: JPMorgan Chase showed especially strong grades in the area of African Americans in the governing body and in workforce below the top management level for both African Americans and people of color. The advertising diversity for people of color is also an area where Chase shows leadership and it showed solid performance in the employee turnover rates of both African Americans and people of color.
Opportunities for improvement: JPMorgan Chase could raise its grade for the next report card significantly by increasing funds invested with African American and people of color owned banks and financial institutions. In addition, low scores in small dollar and overdraft lending as well as the amount invested with payday lenders give ample opportunity for Chase to improve its performance further.
Diversity initiatives:
Employment Diversity: Chase has developed a series of Business Resource Groups to foster networks of employees. These social groups are to connect traditionally underrepresented populations such as women, African American, Hispanic, and Asian employees with each other to allow for the mutual support and sharing that social relationships provide.
Supplier Diversity: JPMorgan Chase has created several initiatives to work with diverse businesses and suppliers in the hope it will allow them to maintain a competitive edge and deliver cost-reduction benefits, ultimately adding value to communities and generating value for their shareholders. JPMorgan Chase and Chase have established a goal to continually exceed $1 billion in spending with diverse suppliers each year.
JPMorgan Chase defines “Diverse Suppliers” as minority and women-owned business enterprises (“MWBE”), Disabled Business Enterprises (“DBE”), Lesbian/Gay/Bi-sexual/Transgender Enterprises (“LGBT”) and Veteran Business Enterprises (“VBE”) which are certified by a JPMorgan Chase designated third-party as having met the definition of being at least 51% owned, controlled AND operated by one or more members of a diverse group. Interested firms who feel they meet these requirements can learn more here: www.jpmorganchase.com/supplierdiversity
rePOrt CArD: Diversity

23
t h E c o n S u m E r b a n k i n g i n d u S t r y
JPMorganOverall Grade:
CAfrican
AmericanNAACP
Minimum Expectation33
People of ColorNAACP
Minimum Expectation
Governing Body A 7% C 15%
Top Management D 4% D 15%
Mid/Lower Management B 7% A 20%
Highly Skilled C 7% A 20%
Semi-Skilled A 7% A 20%
New Hires A 7% A 20%
Promotions A 7% A 20%
Turnover C 15% C 15%
Supplier Diversity D 2% D 6%
Ad agencies (%) F 2% A 6%
Media spend (%) F 2% F 6%
Branch C 13% C 30%
$ with Black/Minority-owned
banksF* 0.00001% F 0.0001%
Variables not specific to AA/POC
Small dollar loans High Cost/Responsible34 <36% APR
Overdraft Fee High Cost <36% APR
$ with payday lenders D <0.01%
33 This is the minimum threshold for a grade of C in this category34 JPMorgan Chase indicates they offer no loans in this category
* Refused to disclose

24
n a a c p o p p o r t u n i t y a n d d i v E r S i t y r E p o r t c a r d
U.S. Bank ResultsGrade: D+
Overall: U.S. Bank has 62,657 employees and 3147 full service branch locations that were mapped for this study. It received an overall grade of D+, the lowest in our peer group.
Notable areas of performance: U.S. Bank is the only bank in this report card to receive A grades for governing body diversity in both the African American and people of color category. It is also one of two banks that offer a small dollar product that meets the NAACP 36% APR threshold. U.S. Bank also did very well in avoiding investment with predatory payday lenders. U.S. Bank is also the only bank to achieve a B grade for branch locations in African American neighborhoods.
Opportunities for improvement: Supplier diversity and workforce diversity other than the governing body are areas in which U.S. Bank can see positive gains to improve its scores before the next report card. Underperforming in these high value categories hurt the final grade of U.S. Bank significantly. Specifically, U.S. Bank has substantial room to improve its scores in top and middle management as well as highly skilled employees. In these categories U.S. Bank lagged far behind its peer group for both African Americans and people of color.
Diversity initiatives:
Employment Diversity: U.S. Bank notes it has established relationships with the National Society of Hispanic MBAs and National Association of Women MBAs. U.S. Bank has been involved with the National Black MBA Conference, National Urban League, NAACP, the Consortium for Graduate Study in Management, and Multicultural Forum on Workplace Diversity for several years, participating in sponsorships and job fairs.
Supplier Diversity: For supplier diversity, U.S. Bank reports that it attempts to develop relationships with “certified minority and women owned businesses” for its services and goods. Workforce diversity consists of outreach to minority Chambers of Commerce as well as internship and college recruitment efforts aimed at minority college students. U.S. Bank relies on third party certification, and furthermore due diligence is performed by U.S. Bank to ensure suppliers maintain a current certification status to participate within the Supplier Diversity Program with regard to the organization’s MWBE goals.
rePOrt CArD: Diversity

25
t h E c o n S u m E r b a n k i n g i n d u S t r y
U.S. BankOverall Grade:
D+African
AmericanNAACP
Minimum Expectation35
People of ColorNAACP
Minimum Expectation
Governing Body A 7% A 15%
Top Management F 4% F 15%
Mid/Lower Management D 7% D 20%
Highly Skilled D 7% D 20%
Semi-Skilled B 7% B 20%
New Hires C 7% B 20%
Promotions D 7% C 20%
Turnover D 15% D 15%
Supplier Diversity D 2% F 6%
Ad agencies (%) F 2% F 6%
Media spend (%) F 2% F 6%
Branch B 13% C 30%
$ with Black/Minority-owned
banksF 0.00001% F 0.0001%
Variables not specific to AA/POC
Small dollar loans High Cost/Responsible36 <36% APR
Overdraft Fee High Cost <36% APR
$ with payday lenders B <0.01%
35 This is the minimum threshold for a grade of C in this category36 U.S. Bank offers two different products, one that meets our standards and
one which does not.

26
n a a c p o p p o r t u n i t y a n d d i v E r S i t y r E p o r t c a r d
Wells Fargo ResultsGrade: C
Overall: Wells Fargo is the largest bank in this report in terms of both people and branches, with 269,000 employee and 5957 branches. It achieved an overall grade of C.
Notable areas of performance: Wells Fargo did very well in the advertising and media spending categories, being the only bank to get A grades for advertising diversity in both the people of color and African American segments. Wells Fargo is an industry leader in African American representation in top management and showed significant effort to invest funds with minority owned banking institutions.
Opportunities for improvement: Several high value categories were areas in which we have identified a need for improvement at Wells Fargo, including workforce diversity in the top management category for people of color, supplier diversity, small dollar and overdraft loans, as well as the amount invested with payday lenders. These represent areas where Wells Fargo can greatly improve before the next report card.
Diversity initiatives:
Employment Diversity: Wells Fargo notes its effective Executive Mentoring Program connects senior leaders with high-performing talent from different business groups for an 18-month mentoring relationship. Since it was developed in 2011 over 200 people have participated in this program.
Wells Fargo is also involved in building long term relationships with organizations representing diverse communities including National Society of Hispanic MBAs, National Black MBA Association, Organization of Chinese Americans, National Association of Black Accountants, National Association of Asian Americans, as well as colleges and universities (including HBCUs) and diverse scholarship programs (i.e. Hispanic Scholarship Fund, United Negro College Fund, Asian Pacific Islander American Scholarship Fund, Thurgood Marshall College Fund, The Point Foundation).
Supplier Diversity: Wells Fargo purses an “open door” approach in which it engages and includes qualified prospective minority, women, and disadvantaged small business enterprises to link them with appropriate Wells Fargo decision makers based upon their locations, company expertise or product offering. Through this approach, Wells Fargo hopes to provide minority and women owned businesses with the greatest opportunity to participate as one of its partners and suppliers.
rePOrt CArD: Diversity
27
t h E c o n S u m E r b a n k i n g i n d u S t r y
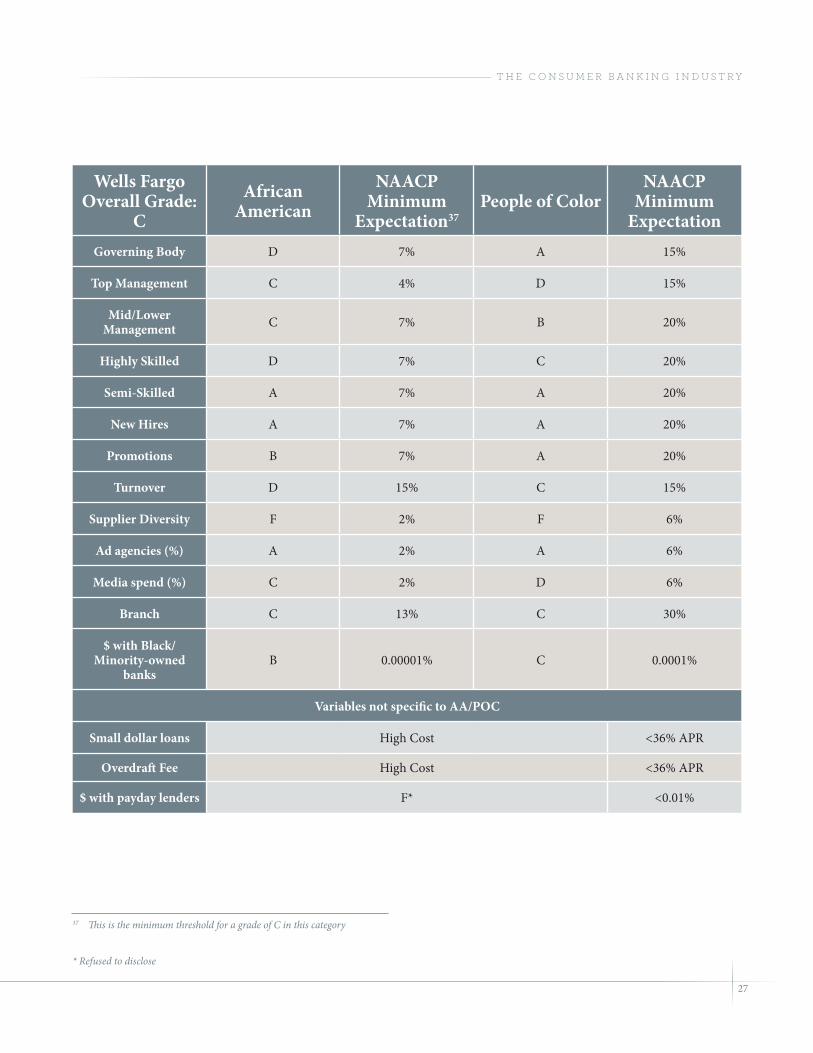
Wells FargoOverall Grade:
CAfrican
AmericanNAACP
Minimum Expectation37
People of ColorNAACP
Minimum Expectation
Governing Body D 7% A 15%
Top Management C 4% D 15%
Mid/Lower Management C 7% B 20%
Highly Skilled D 7% C 20%
Semi-Skilled A 7% A 20%
New Hires A 7% A 20%
Promotions B 7% A 20%
Turnover D 15% C 15%
Supplier Diversity F 2% F 6%
Ad agencies (%) A 2% A 6%
Media spend (%) C 2% D 6%
Branch C 13% C 30%
$ with Black/Minority-owned
banksB 0.00001% C 0.0001%
Variables not specific to AA/POC
Small dollar loans High Cost <36% APR
Overdraft Fee High Cost <36% APR
$ with payday lenders F* <0.01%
37 This is the minimum threshold for a grade of C in this category
* Refused to disclose

28
n a a c p o p p o r t u n i t y a n d d i v E r S i t y r E p o r t c a r d
methODsFor a full list of the methods used in this report see Appendix D. This section explains what comprised the letter grades only. For specific information on the methods used to derive these grades from the survey answers and data provided by the banks, please see the appendix.Workforce: Our subject banks were asked via survey for data on the number of African Americans and people of color (including African Americans) at various levels of the workforce which correspond to the data they report annually to the Equal Employment Opportunity Commission (EEOC). In addition, we asked questions about the turnover, promotion, and hiring of new employees.
Supplier Diversity: The NAACP feels strongly that diversity in the supplier’s major businesses use has a major impact on the work created by these firms. Thus there is a strong emphasis in these report cards on the diversity of suppliers including direct and indirect spending on materials, advertising, and media. The banks were asked for the amounts spent on firms owned by African Americans or people of color as a percentage of their overall budget for these items.
Branch Locations: Using branch data provided by the Federal Deposit Insurance Corporation (FDIC) and the U.S. Census, the branch locations for each bank were mapped and compared with the nearby resident population. Banks in areas with significant numbers of African Americans or people of color were examined for the extent to which they were located in diverse neighborhoods. There is extensive evidence that branch locations are sources of employment, consumers of supplier products, and an important source of local credit and banking services.
Products: The NAACP has long supported a 36% interest rate cap on credit products. Overdraft loans, small dollar loans, and investments in payday lenders are graded in this report to reflect the strong belief of the NAACP that these products have a potentially predatory impact on minority communities.
Grades: The grading system for this report card was developed based on what the NAACP realistically believes the banks can attain. This takes into account Census data, previous reports on diversity, and comparable levels of diversity in closely related fields.
This section is not intended to convey every detail of the methods used in this report. For that information please see Appendix D.

29
t h E c o n S u m E r b a n k i n g i n d u S t r y
30
n a a c p o p p o r t u n i t y a n d d i v E r S i t y r E p o r t c a r d
wOrks CiteD
American Banker’s Association. (2013). Employment Prospects in the Banking Industry 2013 ABA Issue Summary. Washington, DC.
Bjerk, D. (2007). The Differing Nature of Black-White Wage Inequality Across Occupational Sectors. The Journal of Human Resources, XLII, 398-434. Retrieved from http://www.claremontmckenna.edu/pages/faculty/dbjerk/bwgapJHR.pdf
Delong, B. (2011, Mar 7). The hollowing out of the U.S. income distribution under the pressure of technology. Retrieved from http://delong.typepad.com/sdj/2011/03/the-hollowing-out-of-the-us-income-distribution-under-the-pressure-of-technology.html
Federal Deposit Insurance Corporation. (2012). National Survey of Unbanked and Underbanked Households. Washington, DC: Federal Deposit Insurance Corporation.
Government Accountability Office. (2010, May 12). Financial Services Industry: Overall Trends in Management Level Diversity and Diversity Initiatives, 1993-2008. Washington, DC. Retrieved from http://www.gao.gov/new.items/d10736t.pdf
Government Accountability Office. (2013, April). Diversity Management: Trends and Practices in the Financial Services Industry and Agencies after the Recent Financial Crisis. Washington, DC. Retrieved from http://www.gao.gov/assets/660/653814.pdf
Immergluck, D. (2009). Foreclosed. Cornell University Press.
Krugman, P. (2011, Mar 5). Falling demand for brains. NY, NY. Retrieved from http://krugman.blogs.nytimes.com/2011/03/05/falling-demand-for-brains/
Mayer, R. (2012). Loan sharks, interest-rate caps, and deregulation. Washington and Lee Law Review, 807-848.
Mishel, L., Schmitt, J., & Shierholz, H. (2013, Jan 11). Assesing the Job Polarization Explanation of Growing Wage Inequality. Washington, DC. Retrieved from http://www.epi.org/
Richardson, J. (2012). The Effect of Mortgage Liberalization on Housing Patterns in Tampa Bay. Tampa: University of South Florida.
Switzky, B. R. (2013, Apr 12). Wells Fargo unveils new concept branch in NoMa. Washington, DC. Retrieved from http://www.bizjournals.com/washington/news/2013/04/10/wells-fargo-unveils-new-concept-branch.html?page=all
United States Census Bureau. (2012, Dec 12). U.S. Census Bureau Projections Show a Slower Growing, Older, More Diverse Nation a Half Century from Now. Washington, DC. Retrieved from http://www.census.gov/newsroom/releases/archives/population/cb12-243.html
31
t h E c o n S u m E r b a n k i n g i n d u S t r y
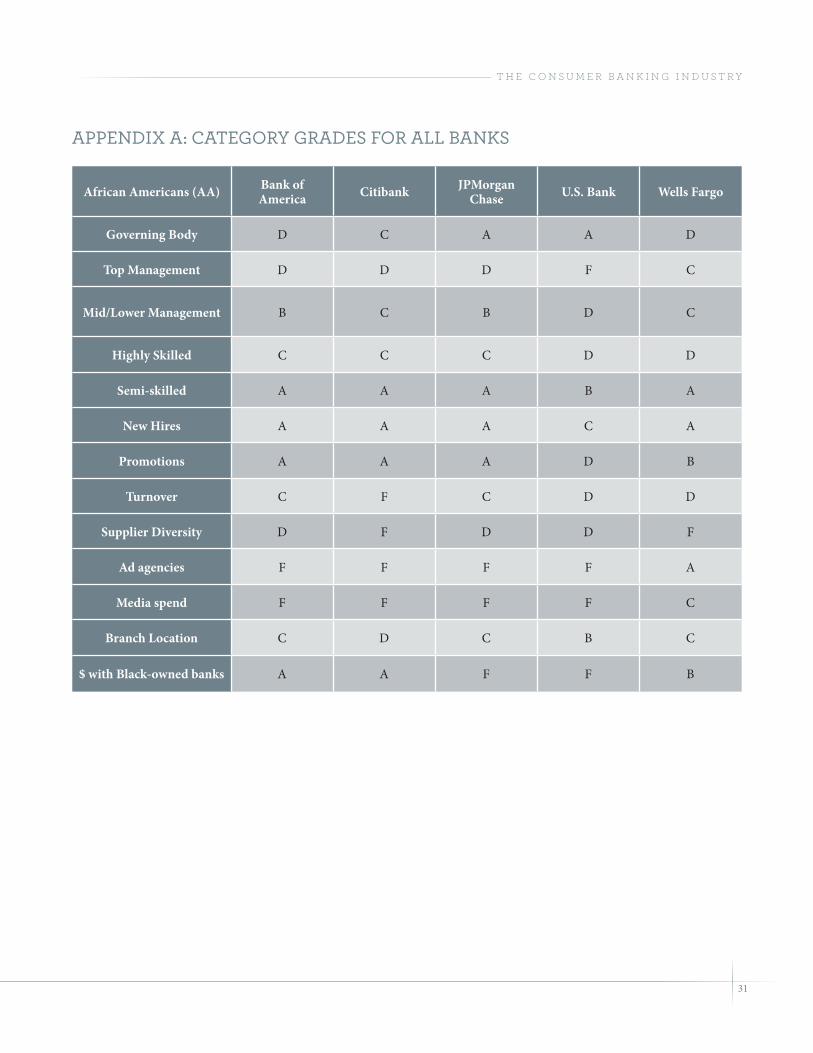
APPeNDix A: CAtegOry grADes fOr All BANks
African Americans (AA) Bank of America Citibank JPMorgan
Chase U.S. Bank Wells Fargo
Governing Body D C A A D
Top Management D D D F C
Mid/Lower Management B C B D C
Highly Skilled C C C D D
Semi-skilled A A A B A
New Hires A A A C A
Promotions A A A D B
Turnover C F C D D
Supplier Diversity D F D D F
Ad agencies F F F F A
Media spend F F F F C
Branch Location C D C B C
$ with Black-owned banks A A F F B

32
n a a c p o p p o r t u n i t y a n d d i v E r S i t y r E p o r t c a r d
People of Color (PoC) Bank of America Citibank JPMorgan
Chase U.S. Bank Wells Fargo
Governing Body C C C A A
Top Management D C D F D
Mid/Lower Management A A A D B
Highly Skilled B A A D C
Semi-skilled A A A B A
New Hires A A A B A
Promotions A A A C A
Turnover C C C D C
Supplier Diversity D F D F F
Ad agencies A F A F A
Media spend F F F F D
Branch Location B C C C C
$ with Minority-owned banks B B F F C
Variables not specific to AA/POC
Bank of America Citibank JPMorgan
Chase U.S. Bank Wells Fargo
Small dollar loans Not Offered Responsible High Cost / Responsible
High Cost / Responsible High Cost
Overdraft Fee High Cost High Cost High Cost High Cost High Cost
$ with payday lenders C A D B F
33
t h E c o n S u m E r b a n k i n g i n d u S t r y
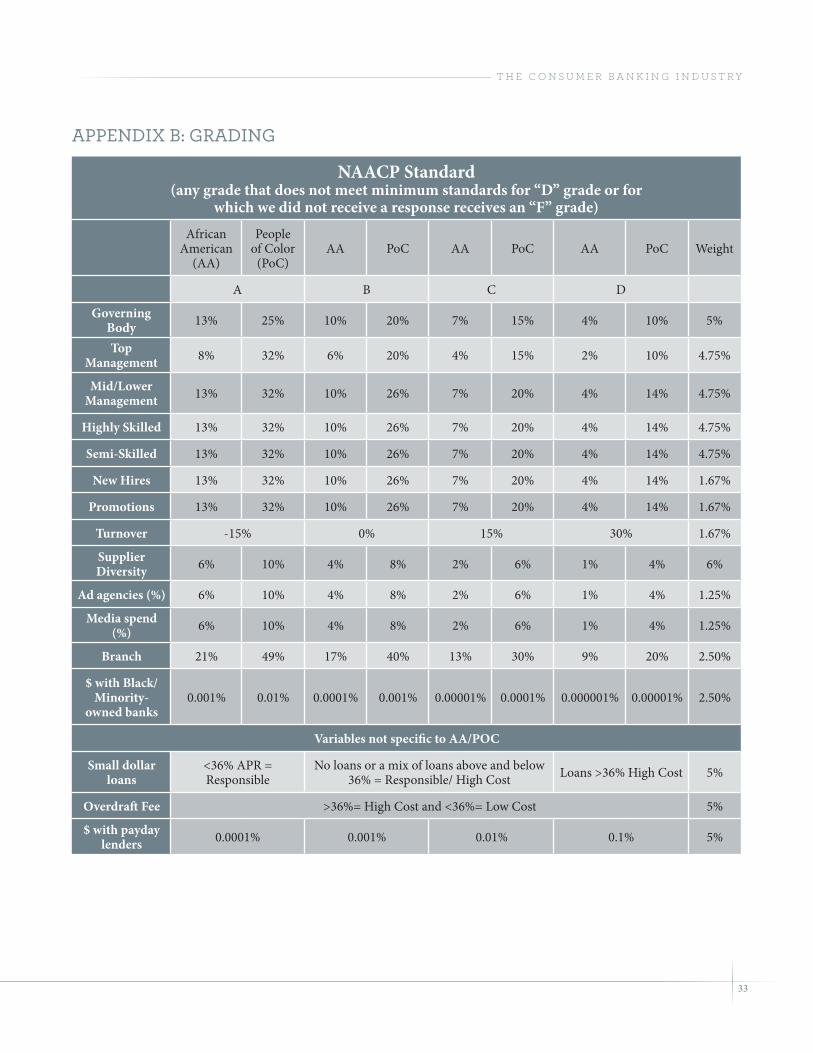
APPeNDix B: grADiNg
NAACP Standard(any grade that does not meet minimum standards for “D” grade or for
which we did not receive a response receives an “F” grade)African
American (AA)
People of Color
(PoC)AA PoC AA PoC AA PoC Weight
A B C D
Governing Body 13% 25% 10% 20% 7% 15% 4% 10% 5%
Top Management 8% 32% 6% 20% 4% 15% 2% 10% 4.75%
Mid/Lower Management 13% 32% 10% 26% 7% 20% 4% 14% 4.75%
Highly Skilled 13% 32% 10% 26% 7% 20% 4% 14% 4.75%
Semi-Skilled 13% 32% 10% 26% 7% 20% 4% 14% 4.75%
New Hires 13% 32% 10% 26% 7% 20% 4% 14% 1.67%
Promotions 13% 32% 10% 26% 7% 20% 4% 14% 1.67%
Turnover -15% 0% 15% 30% 1.67%
Supplier Diversity 6% 10% 4% 8% 2% 6% 1% 4% 6%
Ad agencies (%) 6% 10% 4% 8% 2% 6% 1% 4% 1.25%
Media spend (%) 6% 10% 4% 8% 2% 6% 1% 4% 1.25%
Branch 21% 49% 17% 40% 13% 30% 9% 20% 2.50%
$ with Black/Minority-
owned banks0.001% 0.01% 0.0001% 0.001% 0.00001% 0.0001% 0.000001% 0.00001% 2.50%
Variables not specific to AA/POC
Small dollar loans
<36% APR = Responsible
No loans or a mix of loans above and below 36% = Responsible/ High Cost Loans >36% High Cost 5%
Overdraft Fee >36%= High Cost and <36%= Low Cost 5%
$ with payday lenders 0.0001% 0.001% 0.01% 0.1% 5%

34
n a a c p o p p o r t u n i t y a n d d i v E r S i t y r E p o r t c a r d
APPeNDix C: BANk BrANCh mAPs

35
t h E c o n S u m E r b a n k i n g i n d u S t r y

36
n a a c p o p p o r t u n i t y a n d d i v E r S i t y r E p o r t c a r d
APPeNDix D: DetAileD methODsThis report combines the use of private survey data collected from the subject firms with publicly available data to derive the grades. There are 13 different specific categories where a grade was determined, once for African Americans and once for people of color, giving a total of 26 grading categories. In addition there are 3 more categories that are not race specific, bringing the total number of categories that are used to derive the final grade to 29.
A detailed weighting scale is listed below but data on the workforce, new hires, promotions, turnover, supplier diversity, ad agencies, media spending, investments with minority banks and payday lenders, small dollar lending, and overdraft was derived from the survey instrument. The responses were checked for obvious errors by NAACP researchers. Any data that appeared markedly different from other responses resulted in a communication to the subject to verify the response. This resulted in a clean dataset where the responses reflect the intent of the subjects.
The grading scale for these sections remains based in part upon the relative population size in the United States, its workforce, and suppliers. Unlike the previous report cards, the NAACP has made the decision to move to a more progressive grading system where simply meeting the industry average is not considered sufficient in and of itself. Instead, the grading system is based on a vision of where the NAACP realistically but strongly believes banks can reach in the near future, and we believe where the banks should already be right now. In this vision, there is greater diversity, inclusion, and opportunity at all levels of business. In this vision, there is diversity and inclusion at all levels of employment, in the suppliers and vendors that banks work with for goods and services, and the types of services and programs offered equally and equitably to their diverse customers. The NAACP standard does not hold banks accountable to match the demographic representation of specific minorities. Rather, it develops a minimum standard in recognition of the historic lack of diversity that we feel all banks should be able to meet.

37
t h E c o n S u m E r b a n k i n g i n d u S t r y
Workforce: The categories which include governing body, top management, mid/lower management, highly skilled, and semi-skilled workers as well as data on new hires, promotions, and turnover is collectively referred to as the “workforce” section of the report card. A survey instrument was developed which conformed to current EEOC instructions for defining the job levels as well as race and ethnicity of the employee. Instructions for this can be found at the EEOC website.38 This survey asked for information on employees hired during the 2011 calendar year, and includes questions about the number of current employees as well as those hired, promoted, or whose employment ended during the year. The questions were asked twice, once for people of color and once for African Americans alone.
Turnover: Turnover is computed as a ratio of the number of employees that left the bank as compared with the size of the bank. The results were expressed as a percentage, with a lower percentage of turnover representing a better ability to retain employees.
Branch Location: A list of branches was obtained from the Federal Deposit Insurance Corporation (FDIC) website by searching for the subject bank and filtering the results to exclude any branches other than Service Type 11 and 12 (full service locations). Results were refined to exclude branches lacking addresses, or outside of the continental US. They were then geocoded using ArcGIS 10.1 software and mapped over a layer of 2010 Census tract data. There is no standard definition of census tracts with a high proportion of African American population at the national scale. Consequently, the methodology adopted here relies on the United States Census Bureau break point of 5% of county population used to map counties with significant Black or African American populations.39 This included most of the southern United States and many urban areas of the Midwest, Northeast, and California. Census tracts within counties that met these criteria were then evaluated for high proportions of African American residents. Census tracts containing a proportion of African Americans 150% higher than the county average were selected in this step. This successfully pinpointed the census tracts that could be considered “high minority” within the given geographical context. It also provided a base number for ranking this category. Bank branches in counties not meeting the “floor” 5% African American population were discarded, and the number of remaining branches were divided by the branches in the “high minority” census tracts to calculate a percentage grade.
For the people of color category, the same method was used, although due to the larger number of people and their greater integration counties must have 35% non-white population and the Census tract is considered high minority if it has more than 100% the county average. Upon close examination this method seems to have produced a remarkably accurate representation of minority neighborhoods across geographic scales.
Investment with minority banks and payday lenders: Although the amount of money invested with minority banks was disclosed via the survey response, it was important to measure this against a uniform and empirical scale. To accomplish this, we used the average of quarterly total assets as computed for tier 1 capital requirements under the Basel accords in 2011. Grades were rated on a percentage scale in which higher investment in minority banks received higher grades and higher investment in payday lenders received lower grades.
Small Dollar Loans and Overdraft Policies: Grades for this section were given based on the existing policies of the NAACP, which is that any loan with an APR interest rate of more than 36% is predatory.
38 http://www.eeoc.gov/employers/eeo1survey/upload/instructions_form.pdf39 http://www.census.gov/prod/cen2010/briefs/c2010br-06.pdf

38
n a a c p o p p o r t u n i t y a n d d i v E r S i t y r E p o r t c a r d
To test this we modeled a $500 loan under the terms that the banks included with their survey responses. With the banks which offered a small dollar product, the longest available term offered was used. For overdraft loans (when the bank was not transferring funds from a linked account but instead was forwarding its own funds to cover a customer transaction) the same criteria were used and a uniform term of 60 days was chosen. Banks with no small dollar offering or which had multiple offerings which included at least one loan of 36% or less APR received half credit (2 points on a 4 point scale). For banks that have made the policy decision that reduced the likelihood of customers incurring overdraft, such as no POS or debit card overdraft allowed, an additional point was added to their grades.
Data limitations: Data disaggregation was limited in this analysis. For example, the NAACP was not able to collect data by state or region. We are therefore unable to account for regional differences in the racial and ethnic composition of the workforce or business ownership or off the potential customer base of banks.
By using industry averages as comparison figures, we cannot fully account for the impact of discrimination in these figures. A high mark in areas such as top management, governing body membership, or supplier diversity does not indicate representation proportional to the country’s population. Accounting for the impact of discrimination, including structural racism and implicit bias, is beyond the scope of the current analysis.
The ranking system can magnify small differences, particularly for smaller groups. For example, the inclusion of one African American or person of color in a small group, such as in a governing body, can have a large effect on the ranking.
Reliance on self-reported totals provided by corporations is not ideal. While we did not receive the raw data used to create the statistics in this report, or have the ability to verify its accuracy, we trust the integrity of the data provided by the corporations.
With regards to the GAO studies on diversity in the financial sector, it must be noted that the data are not an exact fit for this report. The GAO takes a far broader view of what the financial sector includes than the consumer banks we have focused our report on. Qualitatively their sample is a good fit since the firms under consideration draw on the same labor pool of financial staff as our sample, thus allowing us to draw general correlations from their reports. The GAO also noted that the data from the Census’ Current Population Survey (CPS), which is also used in our report, has technical limits which make it difficult to draw direct comparisons between the EEO data and CPS data.
Despite these limitations, this report provides valuable information for consumers and advocates interested in advancing fairness and racial diversity among the nation’s leading corporations in the banking sector. By using multiple methodologies, the NAACP was able to examine trends that advanced diversity and inclusion while highlighting opportunities for improvement.
Disclaimer: The NAACP has received support in the past from some of the banks included in this study. That support had no bearing on our scoring of their performance.


National Headquarters
4805 Mt. Hope Drive
Baltimore MD 21215
Local: (410) 580-5777
Toll Free: (877) NAACP-98
Financial Freedom Center
1816 12th St, NW
Washington, DC 20009
Tel.: 202-478-6400
www.naacp.org/econ
Like us on Facebook at www.facebook.com/FinancialFreedomCampaign
Follow us on Twitter @NAACPEcon | For updates, text ECON to 62227