narendranath baliga chief financial officer, basf india
TRANSCRIPT

BASF India Limited
Analysts’ Meeting
Narendranath Baliga
Chief Financial Officer, BASF India Ltd.
August 2, 2018

� Only matters in the public domain can be subject matter of discussion in this meeting
� As a matter of policy, we do not provide any prognosis about the future business situation
� We do not comment or give guidance on future results or business outlook
Cautionary noteForward looking statements

SUSTAINING
PROFITABLE GROWTH

Global and India macro economic drivers
India GDP grew by
6.7%
World growth
strengthened to 3.8%
GST & Demonetization settled – Most sectors
recovered
Climbing crude oil prices
Falling value of
Rupee
Rising inflationary pressures and liquidity are concerns
RERA – game changer
for real estate

Demand varied in our focus industries
Moderate growth at 3 %
Erratic monsoon, higher base
from last year
Four wheelers grew by 7% Two wheelers by 16%
Improvement in rural economy, demonetization-influenced low base
FMCG CONSTRUCTION
Saw 13% growth
Revival in consumption, backed by rural growth
Muted growth at 6%
Demonetization, RERA impact
AGRICULTURE AUTOMOBILE

Agriculture
Automotive & Transportation
Chemicals
Construction
Furniture & Wood
Footwear
Home care
Nutrition Packaging& Print
Paints& Coatings
Pharma
Plastics& Rubber
Paper& Pulp
Our segment performance
Our solutions can be found across industries
PERFORMANCE
PRODUCTS FUNCTIONAL
MATERIALS CHEMICALS
AGRICULTURAL
SOLUTIONS

Optimizing our business portfolio Divestment and Acquisitions
Completed divestment of Leather Chemicals business to Stahl Group
Global acquisition of selected assets from
Bayer CropScience
Transfer of paper wet-end and water chemicals business to Solenis in India initiated

IMPROVED OPERATIONAL EFFICIENCY AND RESOURCE OPTIMISATION

Make in IndiaTop updates from key sites
Crossed 5 million safe manhours
Won 1st regional safety award for
Dispersions and Resins team in Asia
Pacific
Accident-free year for site and plant
certified with ISO 9000 2015
Introduced new product - Lupasol® for
paper imaging market
DAHEJ ANKLESHWAR
#3

48000 litres of treated water recycled
every day. Certified for ISO 9000 (2015)
Conducted awareness program for fire
fighting skills for NMMC hospital in
Vashi
2nd Best Safe Industrial Boiler Award
from DISH
New warehouse for Coatings business
and plant certified for ISO 50001 Energy
Management system
MANGALORE THANE
Make in IndiaTop updates from key sites
#3

CREATING GROWTH ENGINES –
NEW LAUNCHES, CUSTOMER CENTRICITY AND DIGITALIZATION

Innovation: customized solutions for the market
Launched MasterSeal 7000 CCR for extreme wastewater challenges
Algal DHA for infant nutrition launched
Construction Chemicals Crop Protection Dispersions &
ResinsHealth and Nutrition
Launched Acronal S728 for next-generation decorative paints
New products for rice : Basagran, Adexar, Seltimaestablished

Innovation: enhancing outreach through digitalization
YouTube campaigns for
Master EmacoSBR2 & Master
Pel 777
Glysantin, a high-
performance engine coolant
now on Amazon
Enhanced digital outreach
for Crop Protection
Corporate advertising via
Scroll, Future Perfect &
social media

Supply Chain Portal (Transport Tracker)Powered by GPS
Track and Trace #2

BEYOND THENUMBERS
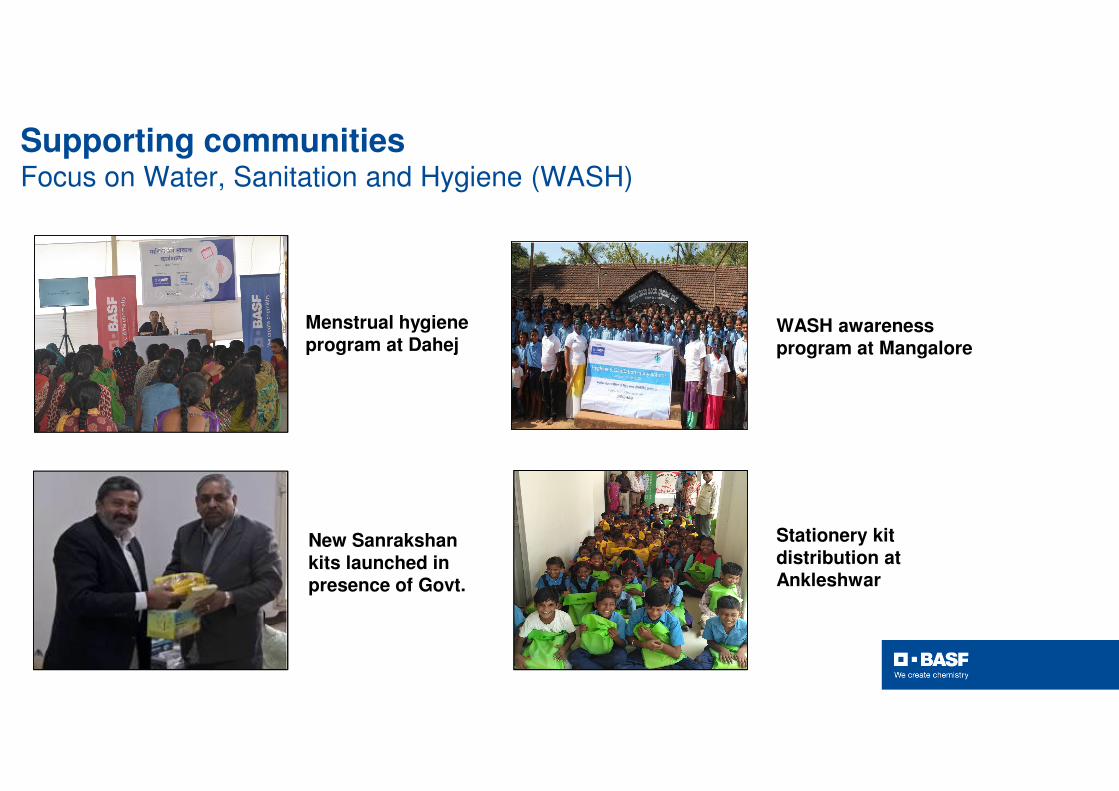
Supporting communitiesFocus on Water, Sanitation and Hygiene (WASH)
WASH awareness program at Mangalore
Stationery kit distribution at Ankleshwar
New Sanrakshankits launched in presence of Govt.
Menstrual hygiene program at Dahej
Performance reviewFY 2017-2018

The year gone by…..
Improving volumes, resource optimisation
Business scenario stabilised post GST
- Opening credit utilisation- Warehouse consolidation
Business portfolio restructuring- Leather carve-out (Sept 2017)- Cessation of TPU* manufacturing
Working capital cycle improved,
borrowings reduced
Measures for faster adoption of Digitalization – frugal
innovations
* TPU: Thermoplastic Polyurethane

FY 2017-18 at a glance
* Sales has been adjusted with GST/Excise duty for the relevant periods for coherent comparison
Rs Crores
� Sales* +10%; Volumes +6%
� Driven by Agro & Dahej BU sales Dahej Sales: Rs.1,331 Crs (PY Rs.1,014 Crs)
� BIL capacity utilisation @73% (PY 67%)
Business Highlights
� Borrowings reduced by ~ Rs 400 Crs
� Debt-Equity ratio 0.6 (PY 1.2)
Capital management
Exceptional Items
Particulars CY PY
Apartment sale 27 6
Divestiture of Industrial coatings business to Akzo Nobel - 11
Divestiture of Leather business to Stahl 156 -
Write down of TPU assets (24) -
Total 159 17

Segmental analysisFY 31st March 2018
* Revenue is not comparable with previous periods due to GST/ Excise duty classification
Performance Products
2,235 (39%)
Functional Materials
2,272 (40%)
Chemicals320 (6%)
Agricultural Solutions864 (15%)
Segment Revenue*(Rs. in Crores)
Crop Protection
PerformanceProducts
Dispersions & Pigments
Care Chemicals
Functional Materials & Solutions
AgriculturalSolutions
Nutrition & Health
Performance Chemicals
Chemicals Functional Materials & Solutions
ConstructionChemicals
Coatings
Performance Materials
Monomers
Intermediates
Petrochemicals

Segmental analysisFY 31st March 2018Agricultural Solutions
Performance Products
Revenue*Dispersions� Improved volumes as a result of enhanced foot print
Care Chemicals
� Headwinds from demonetisation, GST & volatile feedstock
Result� Improved profitability from Dispersions / Contract renegotiations improved profitability for care chemicals� Results impacted due to divesture of leather business
Revenue* � 5%EBIT bEI � 44%
Performance Products includes Dispersions, Pigments, Leather and Care chemicals .Functional Materials & Solutions includes Performance Materials, Coatings, Construction and CatalystsChemicals includes Monomers, Intermediates and Petrochemicals
Revenue*� Erratic monsoon impacted Soybean market� Strategic efforts on crop diversification� Sales from new product launches (rice & corn products such as Adexar, Seltima, Basagran, Tynzer etc.)
Result� Improved profitability from new product launches� Pressure from generics continues on traditional portfolio
21
Revenue* � 26%EBIT bEI � 52%
EBITbEI: Earnings before interest & tax before exceptional item
* Revenue has been adjusted with GST/ Excise duty for the relevant periods for coherent comparison

Segmental analysisFY ended 31st March 2018
Functional Materials & Solutions
Chemicals
Revenue* � 10%EBIT bEI � >100%
Revenue* � 41%EBIT bEI � 47%
Revenue*� Performance Materials: Growth in passenger vehicle and consumer industry business� Coatings: Effect of demonetisation and GST in automotive & two wheeler sector� Constructions: Marginal improvement in sales prices
Results� Better margins in Performance Materials due to increased capacity utilisation at Dahej
Performance Products includes Dispersions, Pigments Leather and Care chemicals Functional Materials & Solutions includes Performance Materials, Coatings, Construction and CatalystsChemicals includes Monomers, Intermediates and Petrochemicals
22
Revenue*� Monomers: Strong market conditions in construction, footwear, packaging etc.� Intermediates: Better realisation due to market shortages
Results� Price increase from key customers in Intermediates
EBITbEI: Earnings before interest & tax before exceptional item
* Revenue has been adjusted with GST/ Excise duty for the relevant periods for coherent comparison

Financial SummaryFY ended 31st March 2018
Apr to Mar 18 Apr to Mar 17
Description Total Total ∆ %
Income (as per publication) 5,746 5,531 4%
Revenue incl. other income * (adjusted for GST/ Excise) 5,606 5,090 10%
Material cost * 4,055 3,693 10%
% to Net sales 72.3% 72.5%
Personnel cost & Operating expenses 1,182 1,116 6%
EBITDA 369 281 31%
Depreciation 154 169
EBIT (before exceptional items) 215 112 90%
Interest 113 141
PBT (before exceptional items) 102 (29)
Exceptional items (net) 159 17
PBT (after exceptional items) 261 (12)
Income tax (including DTA & MAT) 15 2
PAT (after exceptional Items) 246 (14)
Earnings per share (EPS) 56.9 (3.3)
Earnings per share before Exceptional Items (EPSbEI) 22.4 (7.7)
Dividend % 30% 10%
* Adjusted with GST/Excise duty for the
relevant periods for coherent comparison
Rs Crores

Key Balance Sheet No’s & Ratios
EBIT before exceptional items; Capital employed = Equity + Total borrowings
0.6 1.2
FY 17-18 FY 16-17
34.9% 28.4%
9.7% 4.7%
3.8% 2.2%
Debt Equity (times)
Equity vs total assets (%)
ROCE*(%)
EBITbEI to Sales (%)
* ROCE: Return on Capital Employed = EBITbSI/(Equity +Borrowings)
Equity
TradeReceivables
Borrowings(LT & ST)
Inventory
Trade Payables
Cash flowFromOperations
1,344 1,102
868 1,275
1,092 1,069
1,019 920
1,274 1,183
290 221
March 2018 March 2017
Rs Crores
1.2 1.3Current ratio(times)

Performance reviewQ1 June 2018

Quarter at a glance
‘Normal’ monsoon Improvement in Dahej utilization
Volatility in Crude MDI prices
Optimisation of borrowings

Financial SummaryQuarter ended June 30, 2018
Description Apr-Jun18 Apr-Jun17 ∆ %
Income (as per publication) 1,629 1,650 -1%
Revenue incl other income * 1,629 1,510 8%
Material cost * 1,218 1,119 9%
% to Net sales 74.8% 74.1%
Personnel cost & Operating exp. 315 321 -2%
EBITDA 96 70 37%
Depreciation 37 39
EBIT (before exceptional items) 59 31 90%
Interest 24 30
PBT (before exceptional items) 35 1
Exceptional items income - -
PBT (after exceptional items) 35 1
Income tax (including DTA utilised & MAT) 11 -
PAT (after exceptional Items) 24 1
Rs Crores
* Adjusted with GST/Excise duty for the relevant periods for coherent comparison

Our priorities for FY19
Continue to drive profitable growth
Improve efficiency and optimize working capital
Leverage digitalization
Drive customer centricity and innovate to meet market demands

Thank you for your trust and continued support!
Thank you for your trust and continued support!
