narragansett bay hydrodynamics, water quality, sediment flux and water clarity by mohamed a....
TRANSCRIPT
Narragansett Bay Hydrodynamics, Water Quality, Sediment Flux and
Water ClarityBy Mohamed A. Abdelrhman, PhD, PE
USEPA-AEDCHRP-EPA Workshop
July 7, 2015
Topics Covered
I. Hydrodynamics II. Water QualityIII. Benthic Sediment Quality & FluxIV. Light Attenuation& Water Clarity
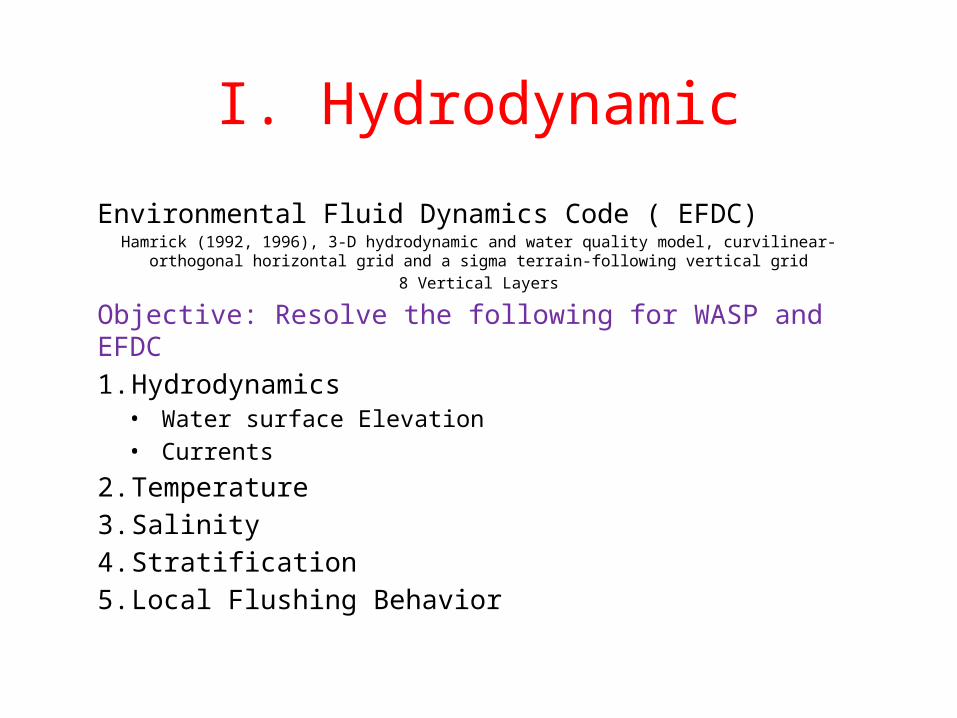
I. Hydrodynamic
Environmental Fluid Dynamics Code ( EFDC)Hamrick (1992, 1996), 3-D hydrodynamic and water quality model, curvilinear-orthogonal horizontal grid
and a sigma terrain-following vertical grid8 Vertical Layers
Objective: Resolve the following for WASP and EFDC1. Hydrodynamics
• Water surface Elevation• Currents
2. Temperature3. Salinity4. Stratification 5. Local Flushing Behavior
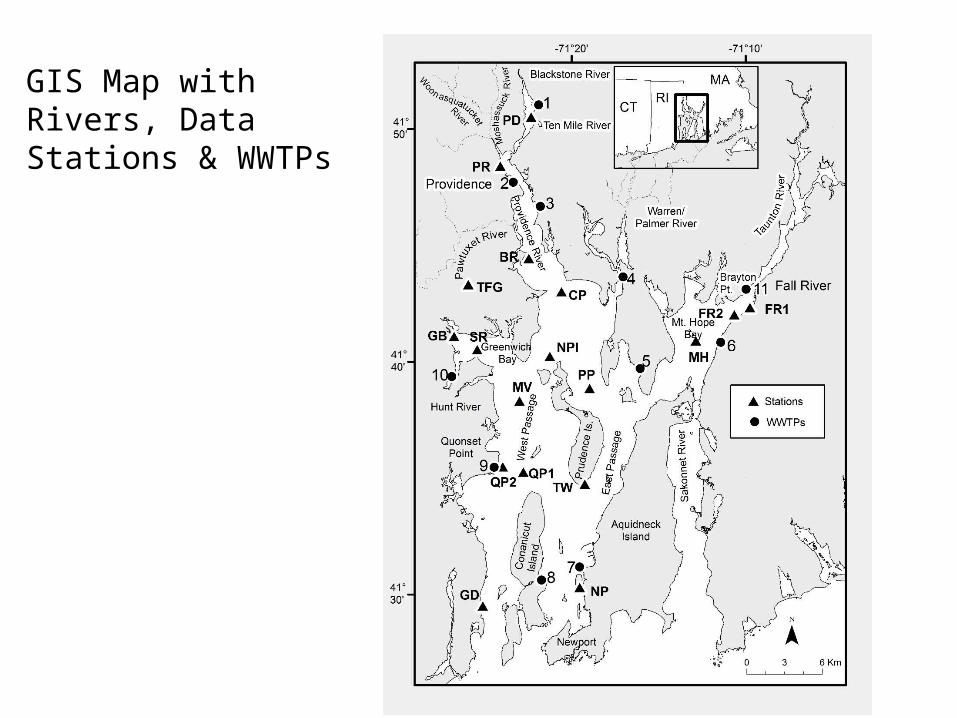
GIS Map withRivers, Data Stations & WWTPs
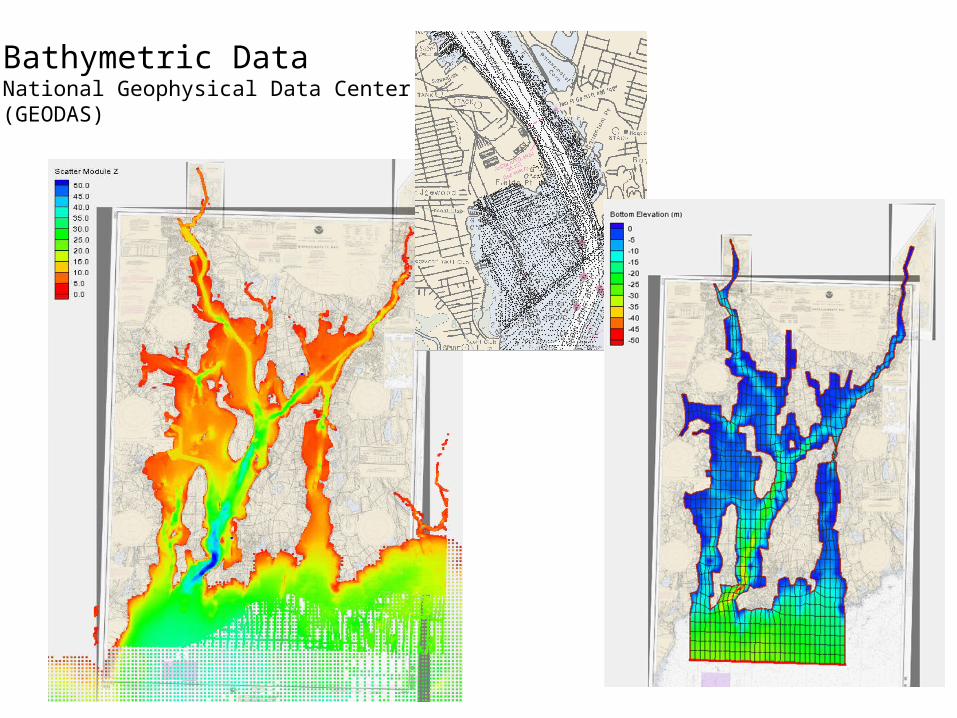
Bathymetric DataNational Geophysical Data Center(GEODAS)
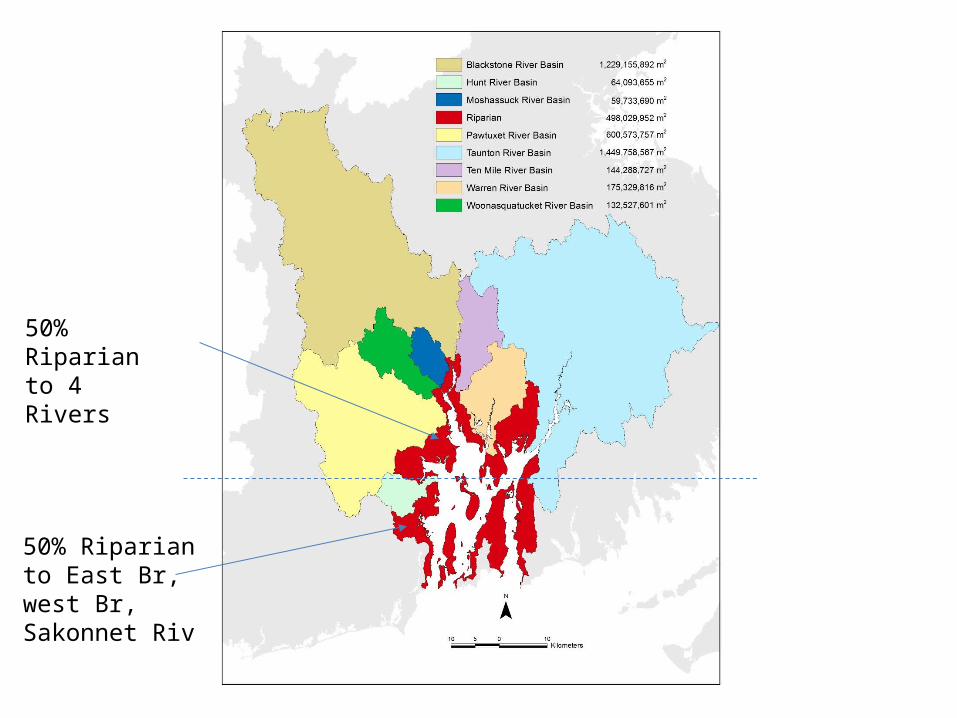
50% Riparianto 4 Rivers
50% Riparian to East Br, west Br, Sakonnet Riv

Freshwater Inflow WWTPsRivers
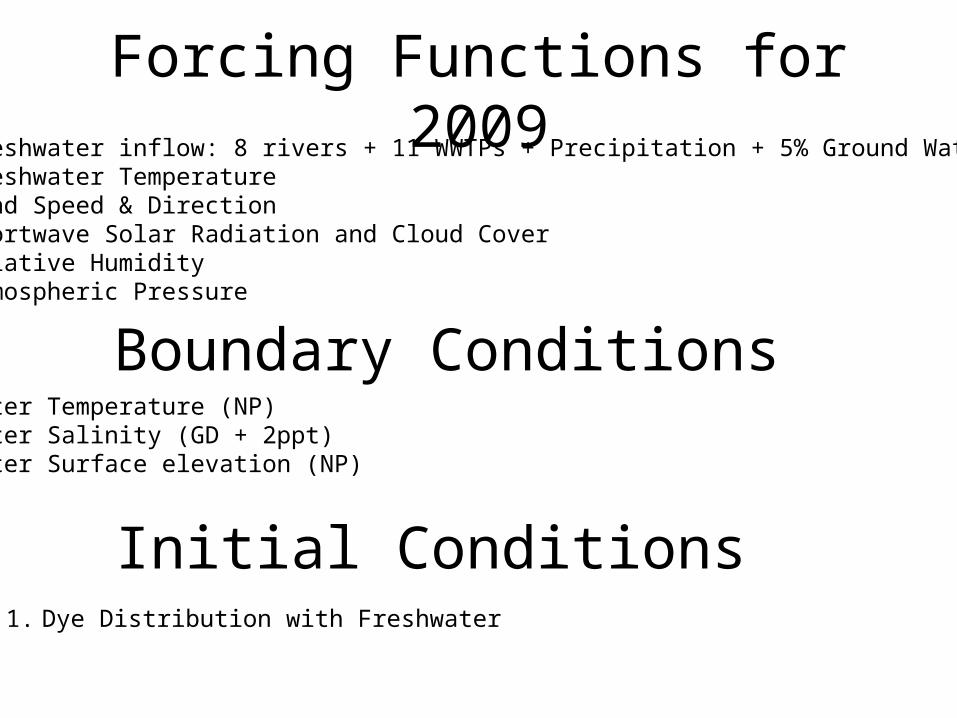
Forcing Functions for 20091. Freshwater inflow: 8 rivers + 11 WWTPs + Precipitation + 5% Ground Water2. Freshwater Temperature3. Wind Speed & Direction4. Shortwave Solar Radiation and Cloud Cover5. Relative Humidity6. Atmospheric Pressure
7. Water Temperature (NP)8. Water Salinity (GD + 2ppt)9. Water Surface elevation (NP)
Boundary Conditions
Initial Conditions1. Dye Distribution with Freshwater

Tidal Elevation Example
Calibration of Hydrodynamics
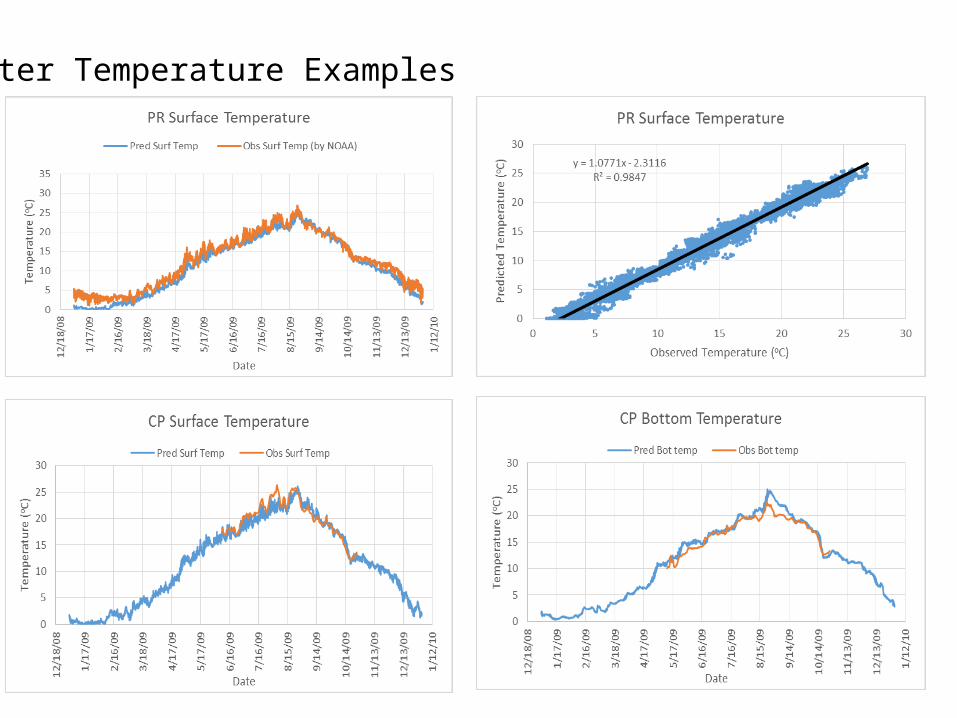
Water Temperature Examples
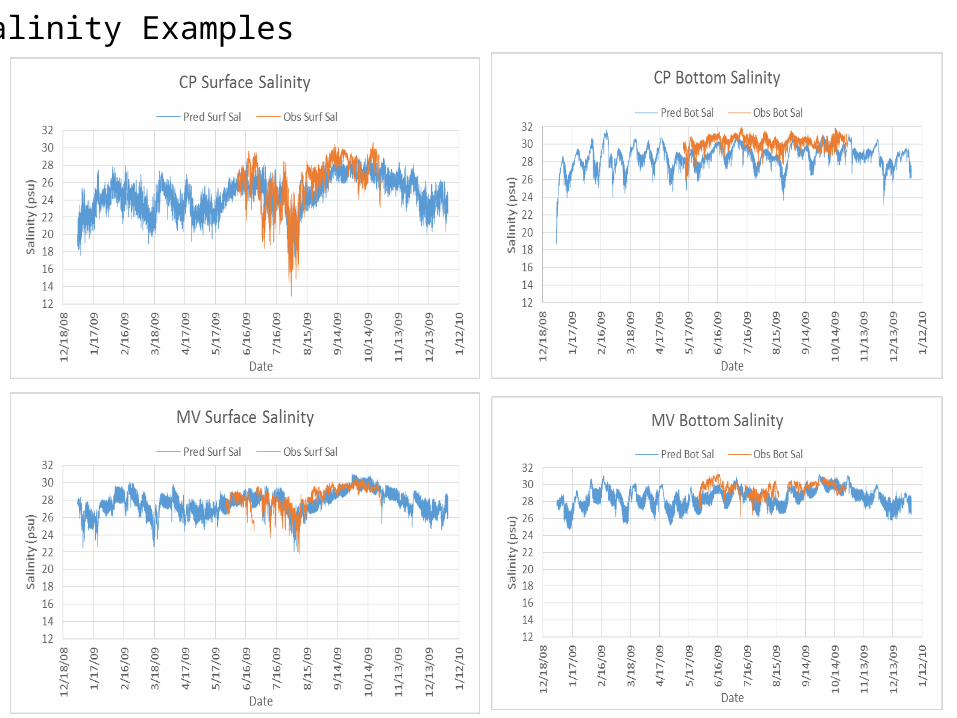
Salinity Examples
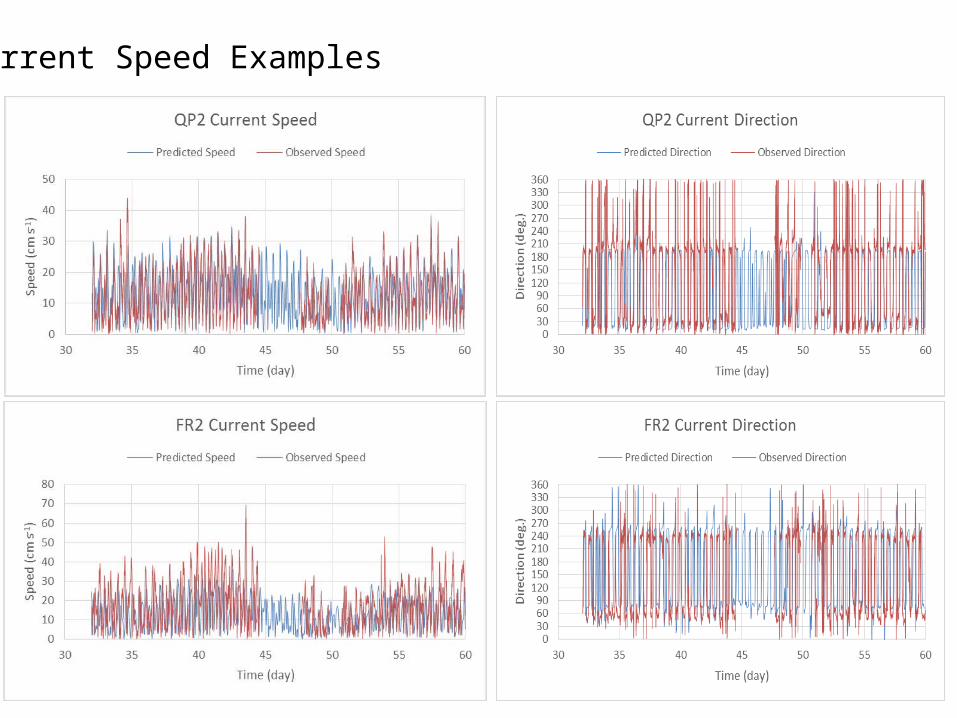
Current Speed Examples
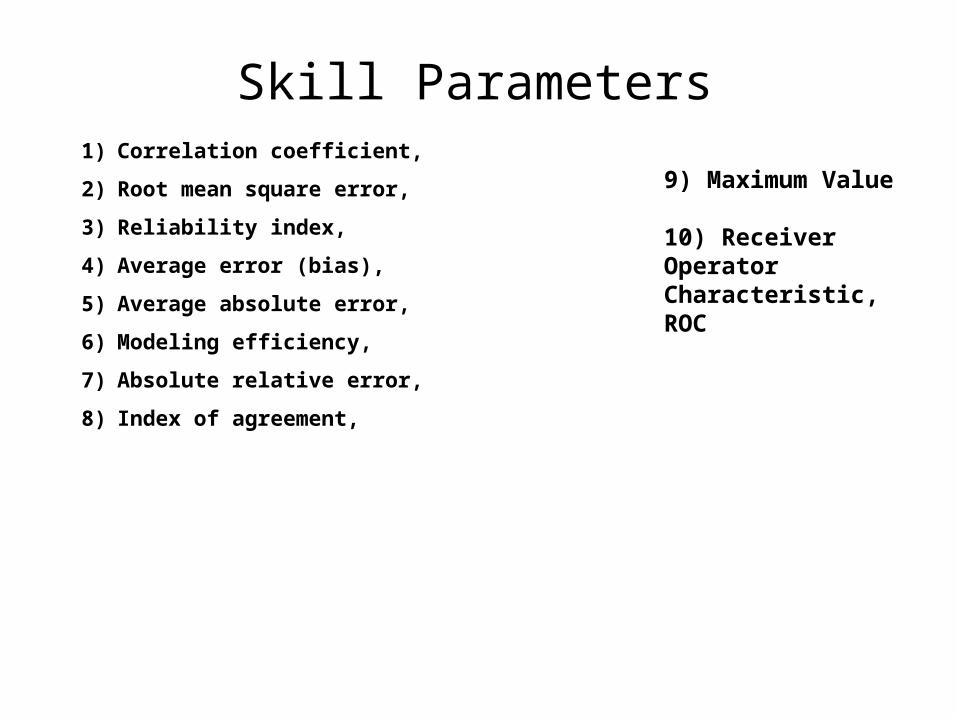
Skill Parameters9) Maximum Value
10) Receiver Operator Characteristic, ROC
1) Correlation coefficient,
2) Root mean square error,
3) Reliability index,
4) Average error (bias),
5) Average absolute error,
6) Modeling efficiency,
7) Absolute relative error,
8) Index of agreement,
ParameterCorrelation Coefficient (non-dim)
Root mean square error (dim)
Reliability indexb
(non-dim)
Average error (dim)
Average absolute error (dim)
Modeling efficiency (non-dim)
Absolute relative error
(non-dim)
Index of agreement (non-dim)
Observed maximum
(dim)
Predicted maximum (dim)
Number of observationsdescription
Parameterar
[1.0]RMSE[zero]
%RI
[1.0]AE
[zero]%
AAE[zero]
%MEF[1.0]
ARE[zero]
d[1.0]
O P % n
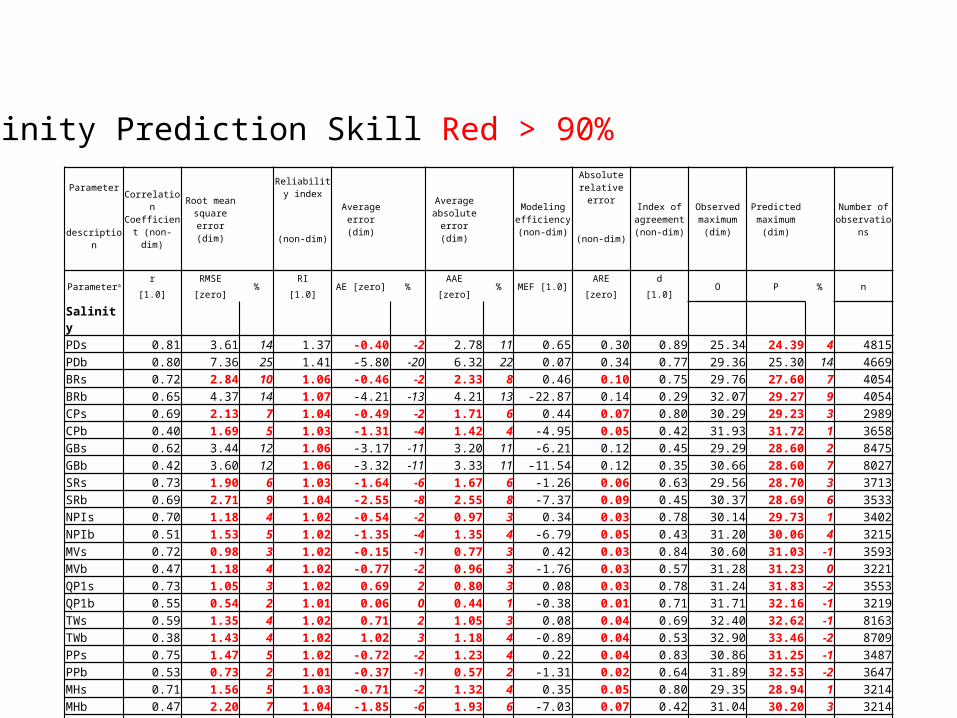
Salinity
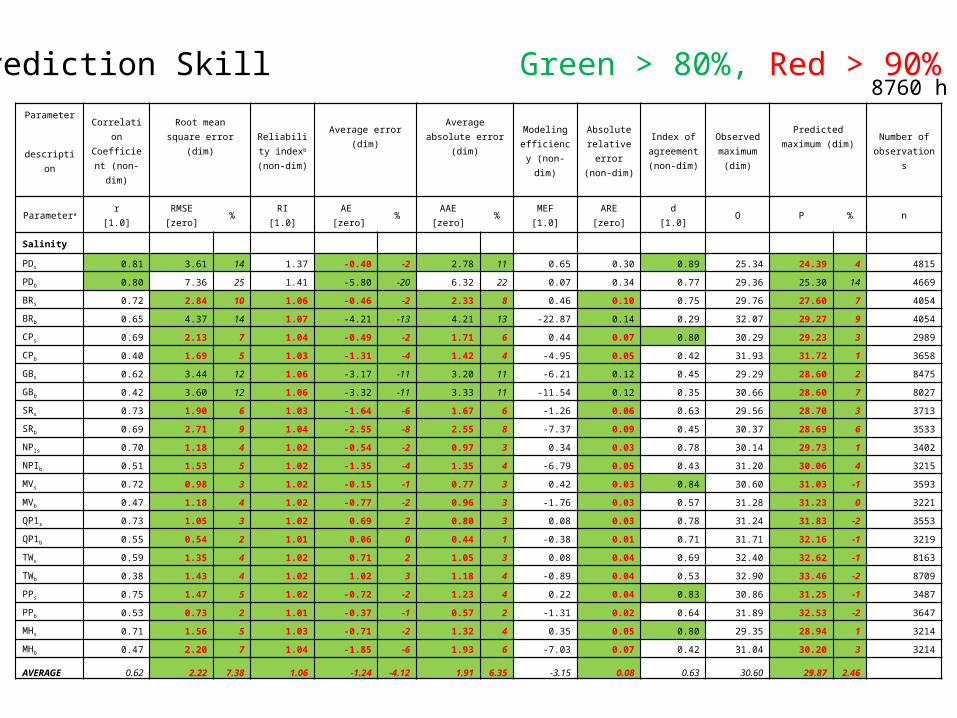
PDs 0.81 3.61 14 1.37 -0.40 -2 2.78 11 0.65 0.30 0.89 25.34 24.39 4 4815
PDb 0.80 7.36 25 1.41 -5.80 -20 6.32 22 0.07 0.34 0.77 29.36 25.30 14 4669
BRs 0.72 2.84 10 1.06 -0.46 -2 2.33 8 0.46 0.10 0.75 29.76 27.60 7 4054
BRb 0.65 4.37 14 1.07 -4.21 -13 4.21 13 -22.87 0.14 0.29 32.07 29.27 9 4054
CPs 0.69 2.13 7 1.04 -0.49 -2 1.71 6 0.44 0.07 0.80 30.29 29.23 3 2989
CPb 0.40 1.69 5 1.03 -1.31 -4 1.42 4 -4.95 0.05 0.42 31.93 31.72 1 3658
GBs 0.62 3.44 12 1.06 -3.17 -11 3.20 11 -6.21 0.12 0.45 29.29 28.60 2 8475
GBb 0.42 3.60 12 1.06 -3.32 -11 3.33 11 -11.54 0.12 0.35 30.66 28.60 7 8027
SRs 0.73 1.90 6 1.03 -1.64 -6 1.67 6 -1.26 0.06 0.63 29.56 28.70 3 3713
SRb 0.69 2.71 9 1.04 -2.55 -8 2.55 8 -7.37 0.09 0.45 30.37 28.69 6 3533
NPIs 0.70 1.18 4 1.02 -0.54 -2 0.97 3 0.34 0.03 0.78 30.14 29.73 1 3402
NPIb 0.51 1.53 5 1.02 -1.35 -4 1.35 4 -6.79 0.05 0.43 31.20 30.06 4 3215
MVs 0.72 0.98 3 1.02 -0.15 -1 0.77 3 0.42 0.03 0.84 30.60 31.03 -1 3593
MVb 0.47 1.18 4 1.02 -0.77 -2 0.96 3 -1.76 0.03 0.57 31.28 31.23 0 3221
QP1s 0.73 1.05 3 1.02 0.69 2 0.80 3 0.08 0.03 0.78 31.24 31.83 -2 3553
QP1b 0.55 0.54 2 1.01 0.06 0 0.44 1 -0.38 0.01 0.71 31.71 32.16 -1 3219
TWs 0.59 1.35 4 1.02 0.71 2 1.05 3 0.08 0.04 0.69 32.40 32.62 -1 8163
TWb 0.38 1.43 4 1.02 1.02 3 1.18 4 -0.89 0.04 0.53 32.90 33.46 -2 8709
PPs 0.75 1.47 5 1.02 -0.72 -2 1.23 4 0.22 0.04 0.83 30.86 31.25 -1 3487
PPb 0.53 0.73 2 1.01 -0.37 -1 0.57 2 -1.31 0.02 0.64 31.89 32.53 -2 3647
MHs 0.71 1.56 5 1.03 -0.71 -2 1.32 4 0.35 0.05 0.80 29.35 28.94 1 3214
MHb 0.47 2.20 7 1.04 -1.85 -6 1.93 6 -7.03 0.07 0.42 31.04 30.20 3 3214
AVERAGE 0.62 2.22 7.38 1.06 -1.24 -4.12 1.91 6.35 -3.15 0.08 0.63 30.60 29.87 2.46
Salinity Prediction Skill Green > 80%, Red > 90%8760 h
ParameterCorrelation Coefficient (non-dim)
Root mean square error
(dim)
Reliability index
Average error (dim)
Average absolute
error (dim)
Modeling efficiency (non-dim)
Absolute relative error Index of
agreement (non-dim)
Observed maximum
(dim)
Predicted maximum
(dim)
Number of
observationsdescription (non-dim) (non-dim)
Parameterar RMSE
%RI
AE [zero] %AAE
% MEF [1.0]ARE d
O P % n[1.0] [zero] [1.0] [zero] [zero] [1.0]
Salinity PDs 0.81 3.61 14 1.37 -0.40 -2 2.78 11 0.65 0.30 0.89 25.34 24.39 4 4815PDb 0.80 7.36 25 1.41 -5.80 -20 6.32 22 0.07 0.34 0.77 29.36 25.30 14 4669BRs 0.72 2.84 10 1.06 -0.46 -2 2.33 8 0.46 0.10 0.75 29.76 27.60 7 4054BRb 0.65 4.37 14 1.07 -4.21 -13 4.21 13 -22.87 0.14 0.29 32.07 29.27 9 4054CPs 0.69 2.13 7 1.04 -0.49 -2 1.71 6 0.44 0.07 0.80 30.29 29.23 3 2989CPb 0.40 1.69 5 1.03 -1.31 -4 1.42 4 -4.95 0.05 0.42 31.93 31.72 1 3658GBs 0.62 3.44 12 1.06 -3.17 -11 3.20 11 -6.21 0.12 0.45 29.29 28.60 2 8475GBb 0.42 3.60 12 1.06 -3.32 -11 3.33 11 -11.54 0.12 0.35 30.66 28.60 7 8027SRs 0.73 1.90 6 1.03 -1.64 -6 1.67 6 -1.26 0.06 0.63 29.56 28.70 3 3713SRb 0.69 2.71 9 1.04 -2.55 -8 2.55 8 -7.37 0.09 0.45 30.37 28.69 6 3533NPIs 0.70 1.18 4 1.02 -0.54 -2 0.97 3 0.34 0.03 0.78 30.14 29.73 1 3402NPIb 0.51 1.53 5 1.02 -1.35 -4 1.35 4 -6.79 0.05 0.43 31.20 30.06 4 3215MVs 0.72 0.98 3 1.02 -0.15 -1 0.77 3 0.42 0.03 0.84 30.60 31.03 -1 3593MVb 0.47 1.18 4 1.02 -0.77 -2 0.96 3 -1.76 0.03 0.57 31.28 31.23 0 3221QP1s 0.73 1.05 3 1.02 0.69 2 0.80 3 0.08 0.03 0.78 31.24 31.83 -2 3553QP1b 0.55 0.54 2 1.01 0.06 0 0.44 1 -0.38 0.01 0.71 31.71 32.16 -1 3219TWs 0.59 1.35 4 1.02 0.71 2 1.05 3 0.08 0.04 0.69 32.40 32.62 -1 8163TWb 0.38 1.43 4 1.02 1.02 3 1.18 4 -0.89 0.04 0.53 32.90 33.46 -2 8709PPs 0.75 1.47 5 1.02 -0.72 -2 1.23 4 0.22 0.04 0.83 30.86 31.25 -1 3487PPb 0.53 0.73 2 1.01 -0.37 -1 0.57 2 -1.31 0.02 0.64 31.89 32.53 -2 3647MHs 0.71 1.56 5 1.03 -0.71 -2 1.32 4 0.35 0.05 0.80 29.35 28.94 1 3214MHb 0.47 2.20 7 1.04 -1.85 -6 1.93 6 -7.03 0.07 0.42 31.04 30.20 3 3214
AVERAGE 0.62 2.22 7.38 1.06 -1.24 -4.12 1.91 6.35 -3.15 0.08 0.63 30.60 29.87 2.46
Salinity Prediction Skill Red > 90%
ParameterCorrelation Coefficient (non-dim)
Root mean square error (dim)
Reliability indexb
(non-dim)
Average error (dim)
Average absolute error (dim)
Modeling efficiency (non-dim)
Absolute relative error
(non-dim)
Index of agreement (non-dim)
Observed maximum
(dim)
Predicted maximum (dim)
Number of observationsdescription
Parameterar
[1.0]RMSE[zero]
%RI
[1.0]AE
[zero]%
AAE[zero]
%MEF [1.0]
ARE[zero]
d[1.0]
O P % n
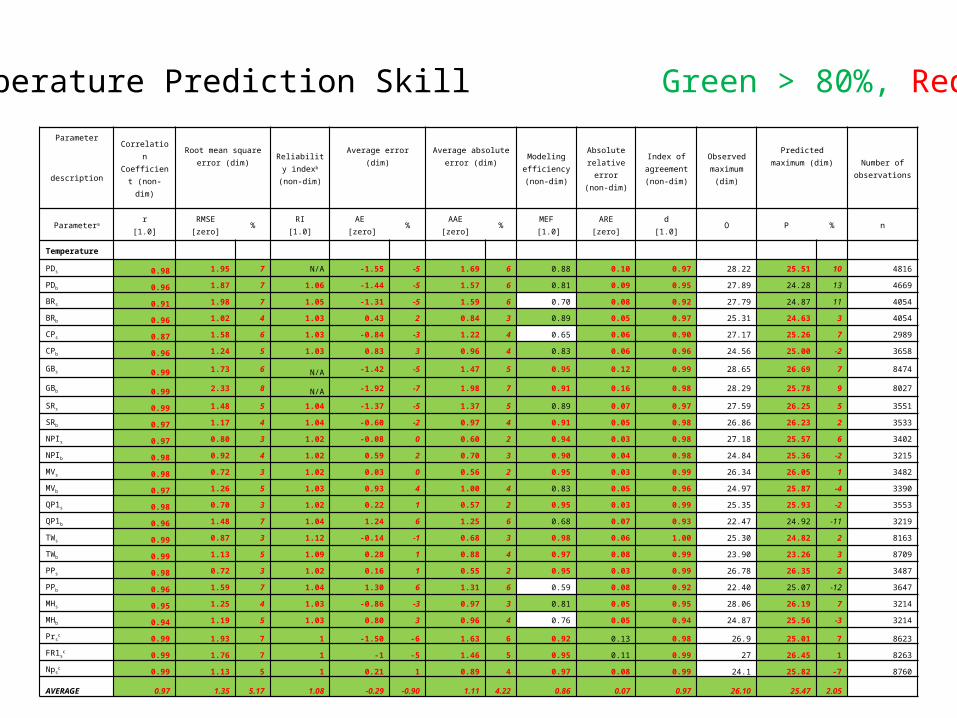
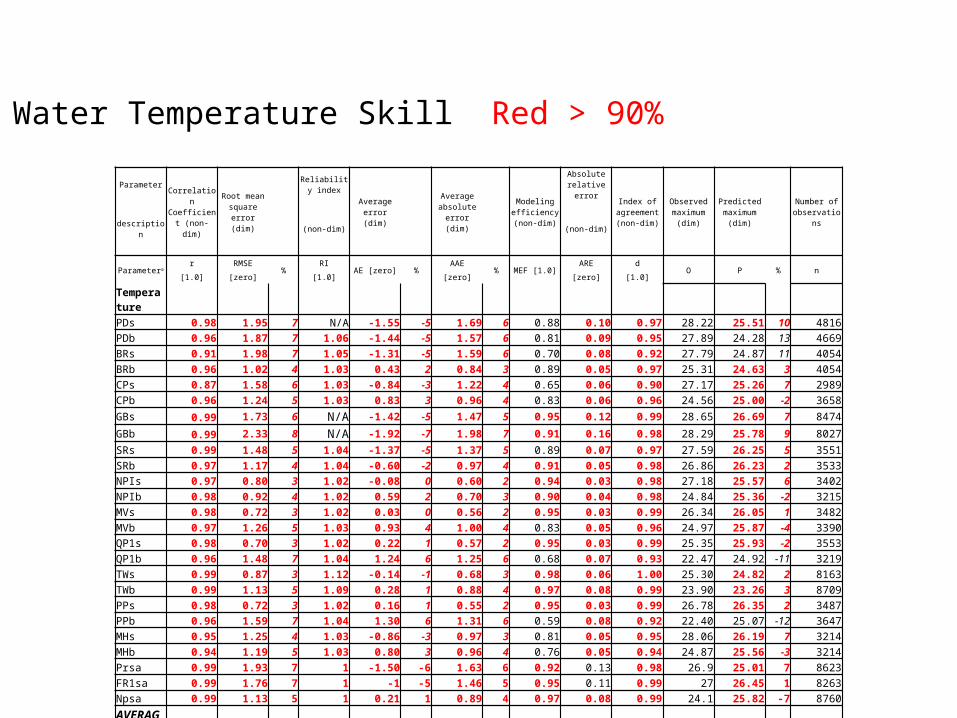
Temperature
PDs 0.98 1.95 7 N/A -1.55 -5 1.69 6 0.88 0.10 0.97 28.22 25.51 10 4816
PDb 0.96 1.87 7 1.06 -1.44 -5 1.57 6 0.81 0.09 0.95 27.89 24.28 13 4669
BRs 0.91 1.98 7 1.05 -1.31 -5 1.59 6 0.70 0.08 0.92 27.79 24.87 11 4054
BRb 0.96 1.02 4 1.03 0.43 2 0.84 3 0.89 0.05 0.97 25.31 24.63 3 4054
CPs 0.87 1.58 6 1.03 -0.84 -3 1.22 4 0.65 0.06 0.90 27.17 25.26 7 2989
CPb 0.96 1.24 5 1.03 0.83 3 0.96 4 0.83 0.06 0.96 24.56 25.00 -2 3658
GBs 0.991.73 6
N/A-1.42 -5 1.47 5 0.95 0.12 0.99 28.65 26.69 7 8474
GBb 0.992.33 8
N/A-1.92 -7 1.98 7 0.91 0.16 0.98 28.29 25.78 9 8027
SRs 0.99 1.48 5 1.04 -1.37 -5 1.37 5 0.89 0.07 0.97 27.59 26.25 5 3551
SRb 0.97 1.17 4 1.04 -0.60 -2 0.97 4 0.91 0.05 0.98 26.86 26.23 2 3533
NPIs 0.97 0.80 3 1.02 -0.08 0 0.60 2 0.94 0.03 0.98 27.18 25.57 6 3402
NPIb 0.98 0.92 4 1.02 0.59 2 0.70 3 0.90 0.04 0.98 24.84 25.36 -2 3215
MVs 0.98 0.72 3 1.02 0.03 0 0.56 2 0.95 0.03 0.99 26.34 26.05 1 3482
MVb 0.97 1.26 5 1.03 0.93 4 1.00 4 0.83 0.05 0.96 24.97 25.87 -4 3390
QP1s 0.98 0.70 3 1.02 0.22 1 0.57 2 0.95 0.03 0.99 25.35 25.93 -2 3553
QP1b 0.96 1.48 7 1.04 1.24 6 1.25 6 0.68 0.07 0.93 22.47 24.92 -11 3219
TWs 0.99 0.87 3 1.12 -0.14 -1 0.68 3 0.98 0.06 1.00 25.30 24.82 2 8163
TWb 0.99 1.13 5 1.09 0.28 1 0.88 4 0.97 0.08 0.99 23.90 23.26 3 8709
PPs 0.98 0.72 3 1.02 0.16 1 0.55 2 0.95 0.03 0.99 26.78 26.35 2 3487
PPb 0.96 1.59 7 1.04 1.30 6 1.31 6 0.59 0.08 0.92 22.40 25.07 -12 3647
MHs 0.95 1.25 4 1.03 -0.86 -3 0.97 3 0.81 0.05 0.95 28.06 26.19 7 3214
MHb 0.94 1.19 5 1.03 0.80 3 0.96 4 0.76 0.05 0.94 24.87 25.56 -3 3214
Prsc
0.99 1.93 7 1 -1.50 -6 1.63 6 0.92 0.13 0.98 26.9 25.01 7 8623
FR1sc
0.99 1.76 7 1 -1 -5 1.46 5 0.95 0.11 0.99 27 26.45 1 8263
Npsc
0.99 1.13 5 1 0.21 1 0.89 4 0.97 0.08 0.99 24.1 25.82 -7 8760
AVERAGE 0.97 1.35 5.17 1.08 -0.29 -0.90 1.11 4.22 0.86 0.07 0.97 26.10 25.47 2.05
Water Temperature Prediction Skill Green > 80%, Red > 90%
ParameterCorrelation Coefficient (non-dim)
Root mean square error
(dim)
Reliability index
Average error (dim)
Average absolute
error (dim)
Modeling efficiency (non-dim)
Absolute relative error Index of
agreement (non-dim)
Observed maximum
(dim)
Predicted maximum
(dim)
Number of
observationsdescription (non-dim) (non-dim)
Parameterar RMSE
%RI
AE [zero] %AAE
% MEF [1.0]ARE d
O P % n[1.0] [zero] [1.0] [zero] [zero] [1.0]
Temperature PDs 0.98 1.95 7 N/A -1.55 -5 1.69 6 0.88 0.10 0.97 28.22 25.51 10 4816PDb 0.96 1.87 7 1.06 -1.44 -5 1.57 6 0.81 0.09 0.95 27.89 24.28 13 4669BRs 0.91 1.98 7 1.05 -1.31 -5 1.59 6 0.70 0.08 0.92 27.79 24.87 11 4054BRb 0.96 1.02 4 1.03 0.43 2 0.84 3 0.89 0.05 0.97 25.31 24.63 3 4054CPs 0.87 1.58 6 1.03 -0.84 -3 1.22 4 0.65 0.06 0.90 27.17 25.26 7 2989CPb 0.96 1.24 5 1.03 0.83 3 0.96 4 0.83 0.06 0.96 24.56 25.00 -2 3658
GBs 0.99 1.73 6 N/A -1.42 -5 1.47 5 0.95 0.12 0.99 28.65 26.69 7 8474
GBb 0.99 2.33 8 N/A -1.92 -7 1.98 7 0.91 0.16 0.98 28.29 25.78 9 8027
SRs 0.99 1.48 5 1.04 -1.37 -5 1.37 5 0.89 0.07 0.97 27.59 26.25 5 3551SRb 0.97 1.17 4 1.04 -0.60 -2 0.97 4 0.91 0.05 0.98 26.86 26.23 2 3533NPIs 0.97 0.80 3 1.02 -0.08 0 0.60 2 0.94 0.03 0.98 27.18 25.57 6 3402NPIb 0.98 0.92 4 1.02 0.59 2 0.70 3 0.90 0.04 0.98 24.84 25.36 -2 3215MVs 0.98 0.72 3 1.02 0.03 0 0.56 2 0.95 0.03 0.99 26.34 26.05 1 3482MVb 0.97 1.26 5 1.03 0.93 4 1.00 4 0.83 0.05 0.96 24.97 25.87 -4 3390QP1s 0.98 0.70 3 1.02 0.22 1 0.57 2 0.95 0.03 0.99 25.35 25.93 -2 3553QP1b 0.96 1.48 7 1.04 1.24 6 1.25 6 0.68 0.07 0.93 22.47 24.92 -11 3219TWs 0.99 0.87 3 1.12 -0.14 -1 0.68 3 0.98 0.06 1.00 25.30 24.82 2 8163TWb 0.99 1.13 5 1.09 0.28 1 0.88 4 0.97 0.08 0.99 23.90 23.26 3 8709PPs 0.98 0.72 3 1.02 0.16 1 0.55 2 0.95 0.03 0.99 26.78 26.35 2 3487PPb 0.96 1.59 7 1.04 1.30 6 1.31 6 0.59 0.08 0.92 22.40 25.07 -12 3647MHs 0.95 1.25 4 1.03 -0.86 -3 0.97 3 0.81 0.05 0.95 28.06 26.19 7 3214MHb 0.94 1.19 5 1.03 0.80 3 0.96 4 0.76 0.05 0.94 24.87 25.56 -3 3214Prsa 0.99 1.93 7 1 -1.50 -6 1.63 6 0.92 0.13 0.98 26.9 25.01 7 8623FR1sa 0.99 1.76 7 1 -1 -5 1.46 5 0.95 0.11 0.99 27 26.45 1 8263Npsa 0.99 1.13 5 1 0.21 1 0.89 4 0.97 0.08 0.99 24.1 25.82 -7 8760
AVERAGE 0.97 1.35 5.17 1.08 -0.29 -0.90 1.11 4.22 0.86 0.07 0.97 26.10 25.47 2.05
Water Temperature Skill Red > 90%
ParameterCorrelation Coefficient (non-dim)
Root mean square error
(dim)
Reliability
indexb
Average error (dim)
Average absolute
error (dim)
Modeling efficiency (non-dim)
Absolute relative
errorIndex of
agreement (non-dim)
Observed maximum
(dim)
Predicted maximum
(dim)
Number of
observations
description (non-dim) (non-dim)
Parameterar RMSE
%RI
AE [zero] %AAE
% MEF [1.0]ARE d
O P % n[1.0] [zero] [1.0] [zero] [zero] [1.0]
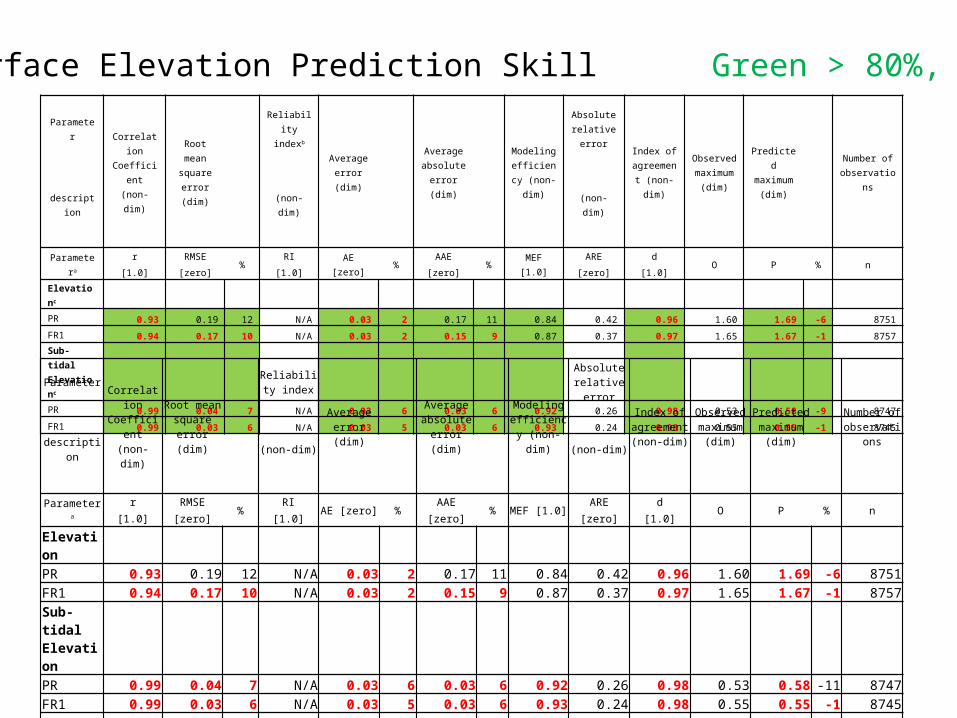
Elevationc
PR 0.93 0.19 12 N/A 0.03 2 0.17 11 0.84 0.42 0.96 1.60 1.69 -6 8751
FR1 0.94 0.17 10 N/A 0.03 2 0.15 9 0.87 0.37 0.97 1.65 1.67 -1 8757
Sub-tidal Elevationc
PR 0.99 0.04 7 N/A 0.03 6 0.03 6 0.92 0.26 0.98 0.53 0.58 -9 8747
FR1 0.99 0.03 6 N/A 0.03 5 0.03 6 0.93 0.24 0.98 0.55 0.55 -1 8745
ParameterCorrelation Coefficient (non-dim)
Root mean square error
(dim)
Reliability index
Average error (dim)
Average absolute
error (dim)
Modeling efficiency (non-dim)
Absolute relative
error Index of agreement (non-dim)
Observed maximum
(dim)
Predicted maximum
(dim)
Number of observation
sdescription (non-dim) (non-dim)
Parameterar RMSE
%RI
AE [zero] %AAE
% MEF [1.0]ARE d
O P % n[1.0] [zero] [1.0] [zero] [zero] [1.0]
Elevation PR 0.93 0.19 12 N/A 0.03 2 0.17 11 0.84 0.42 0.96 1.60 1.69 -6 8751FR1 0.94 0.17 10 N/A 0.03 2 0.15 9 0.87 0.37 0.97 1.65 1.67 -1 8757
Sub-tidal Elevation
PR 0.99 0.04 7 N/A 0.03 6 0.03 6 0.92 0.26 0.98 0.53 0.58 -11 8747FR1 0.99 0.03 6 N/A 0.03 5 0.03 6 0.93 0.24 0.98 0.55 0.55 -1 8745 Salinity GD 0.05 1.90 6 1 1.47 4 1.57 5 -1.27 0.05 0.16 32.70 33.96 -4 8761
Water Surface Elevation Prediction Skill Green > 80%, Red > 90%
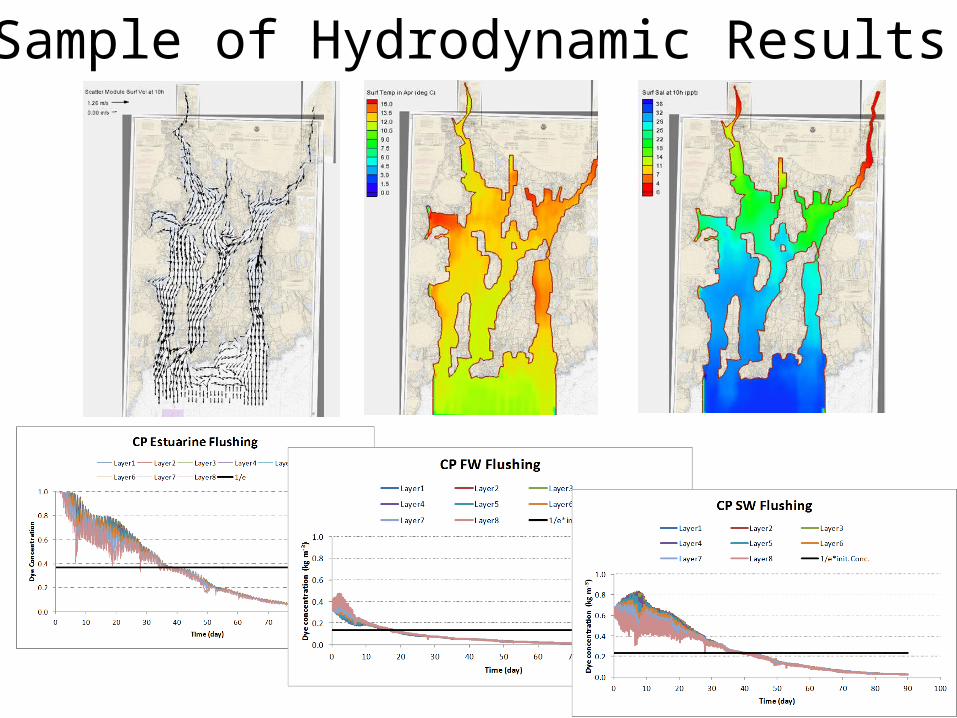
Sample of Hydrodynamic Results

Example of Stratification
Sample of Hydrodynamic Results

1. Introduction 1.1. Background 1.2. Objectives 1.3. Approach 1.4. Water Quality Setting 1.5. Data
1.5.1. River point source loads 1.5.2. WWTP point source load 1.5.3. Non-point source loads 1.5.4. Historic observations
2. The Water Quality Model 2.1. Algae
2.1.1. Production 2.1.1.1. Effect of nutrients 2.1.1.2. Effect of light 2.1.1.3. Effect of temperature 2.1.1.4. Effect of salinity on cyanobacteria
2.1.2. Basal metabolism 2.1.3. Predation 2.1.4. Settling
2.2. Organic Carbon 2.2.1. Particulate Organic Carbon 2.2.2. Dissolved organic Carbon
2.3. Phosphorus 2.3.1. Particulate Organic Phosphorus 2.3.2. Dissolved Organic Phosphorus 2.3.3. Total Phosphate
2.4. Nitrogen 2.4.1. Particulate Organic Nitrogen 2.4.2. Dissolved Organic Nitrogen 2.4.3. Ammonium Nitrogen 2.4.4. Nitrate Nitrogen
2.5. Silica 2.5.1. Particulate Biogenic Silica 2.5.2. Available Silica
2.6. Chemical Oxygen Demand 2.7. Dissolved Oxygen 2.8. Total Active Metal 2.9. Fecal Coliform Bacteria
II. Water Quality
Three-dimensional Modeling of Water Quality and Ecology in Narragansett Bay
By: Mohamed A. Abdelrhman 3. Model Configuration
3.1. Numerical grid 3.2. Initial and boundary conditions 3.3. Point-source loadings 3.4. Time step and run duration 3.5. Input files
4. Model Calibration, Validation, and Skill 4.1. Validation of dissolved oxygen 4.2. Validation of Chl-a 4.3. Skill Analysis
5. Sample of model predictions 5.1. Contemporary DO and hypoxia 5.2. DO and hypoxia without direct loads from WWTPs 5.3. Chl-a with and without WWTPs 5.4. Contemporary monthly vertical profiles of DO 5.5. Contemporary vertical profiles of Chl-a 5.6. Contemporary hourly vertical profiles of DO at CP on day 240 5.7. Contemporary hourly vertical profiles of Chl-a at CP on day 240
6. Summary and Conclusion 6.1. Future work
REFERENCES Appendix A: Point-source loading from WWTPs Appendix B: Dissolved oxygen concentration in riverine inflow Appendix C: ROC graphs Appendix D: Sample of model result Appendix E: Values of water quality parameters used for Narragansett Bay
Now
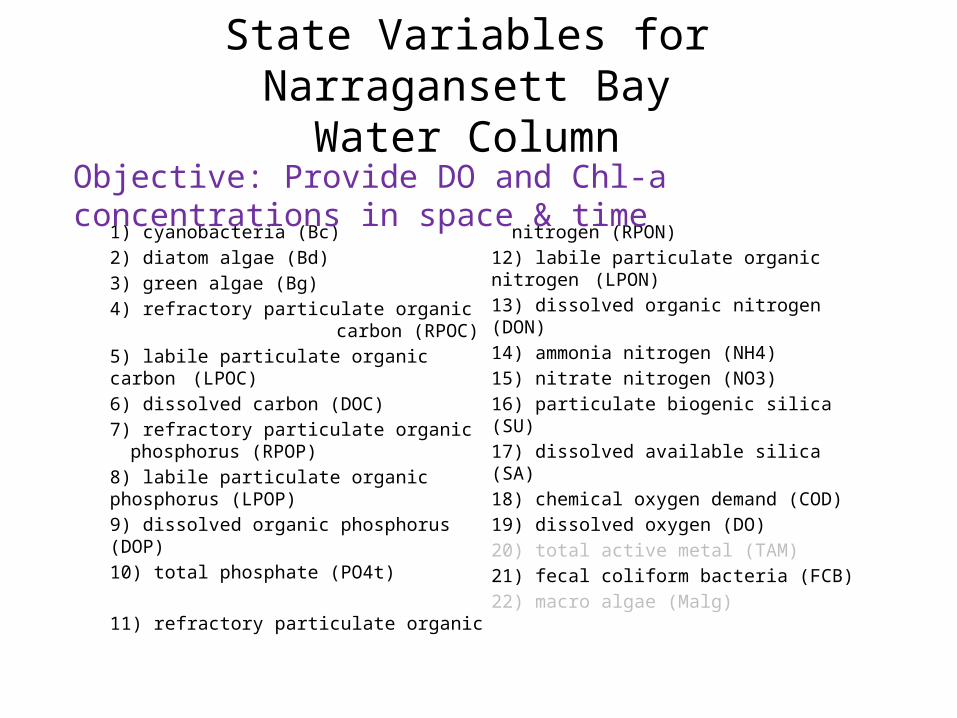
State Variables for Narragansett BayWater Column
1) cyanobacteria (Bc)2) diatom algae (Bd)3) green algae (Bg)4) refractory particulate organic
carbon (RPOC)5) labile particulate organic carbon (LPOC)6) dissolved carbon (DOC)7) refractory particulate organic phosphorus (RPOP)8) labile particulate organic phosphorus (LPOP)9) dissolved organic phosphorus (DOP)10) total phosphate (PO4t)
11) refractory particulate organic nitrogen (RPON)12) labile particulate organic nitrogen (LPON)13) dissolved organic nitrogen (DON)14) ammonia nitrogen (NH4)15) nitrate nitrogen (NO3)16) particulate biogenic silica (SU)17) dissolved available silica (SA)18) chemical oxygen demand (COD)19) dissolved oxygen (DO)20) total active metal (TAM) 21) fecal coliform bacteria (FCB)22) macro algae (Malg)
Objective: Provide DO and Chl-a concentrations in space & time
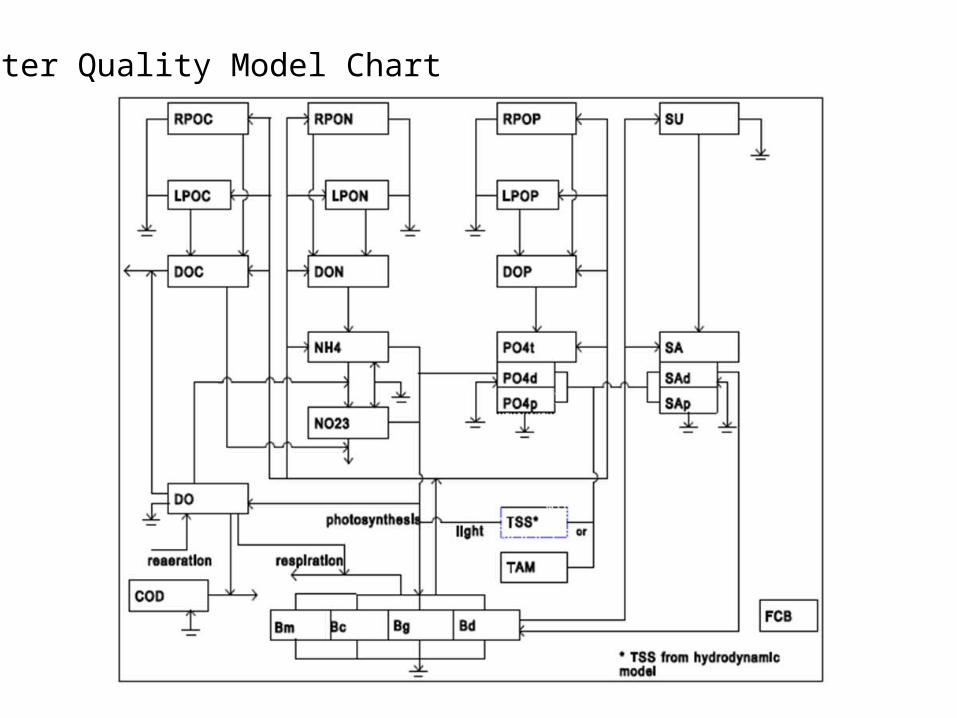
Water Quality Model Chart
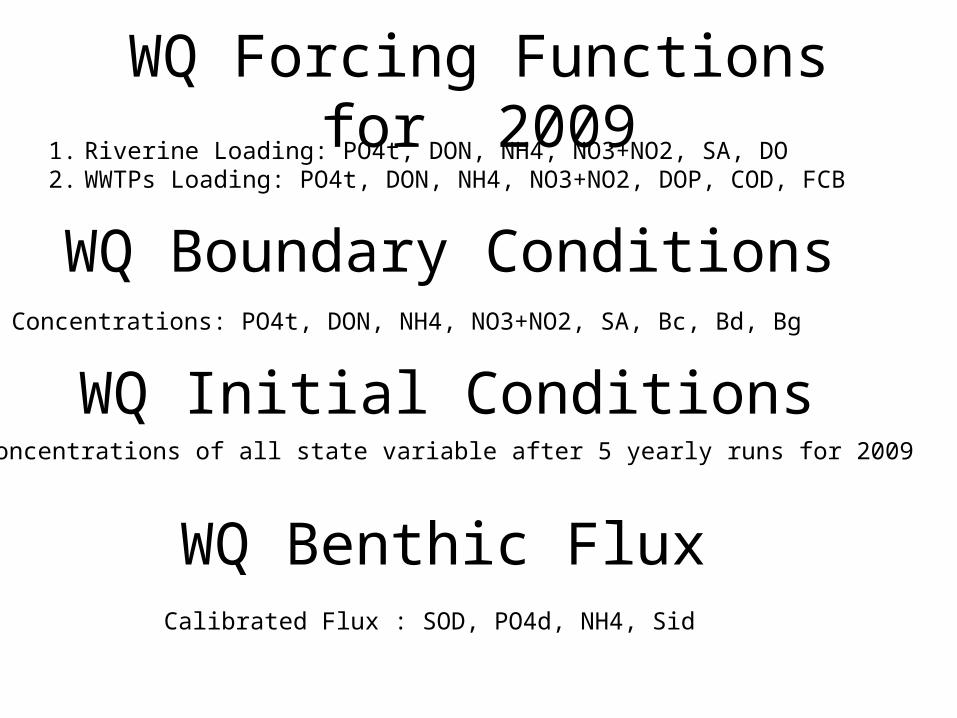
WQ Forcing Functions for 20091. Riverine Loading: PO4t, DON, NH4, NO3+NO2, SA, DO2. WWTPs Loading: PO4t, DON, NH4, NO3+NO2, DOP, COD, FCB
WQ Boundary ConditionsConcentrations: PO4t, DON, NH4, NO3+NO2, SA, Bc, Bd, Bg
WQ Initial ConditionsConcentrations of all state variable after 5 yearly runs for 2009
WQ Benthic FluxCalibrated Flux : SOD, PO4d, NH4, Sid

Sample of DO Results Before Final Calibration
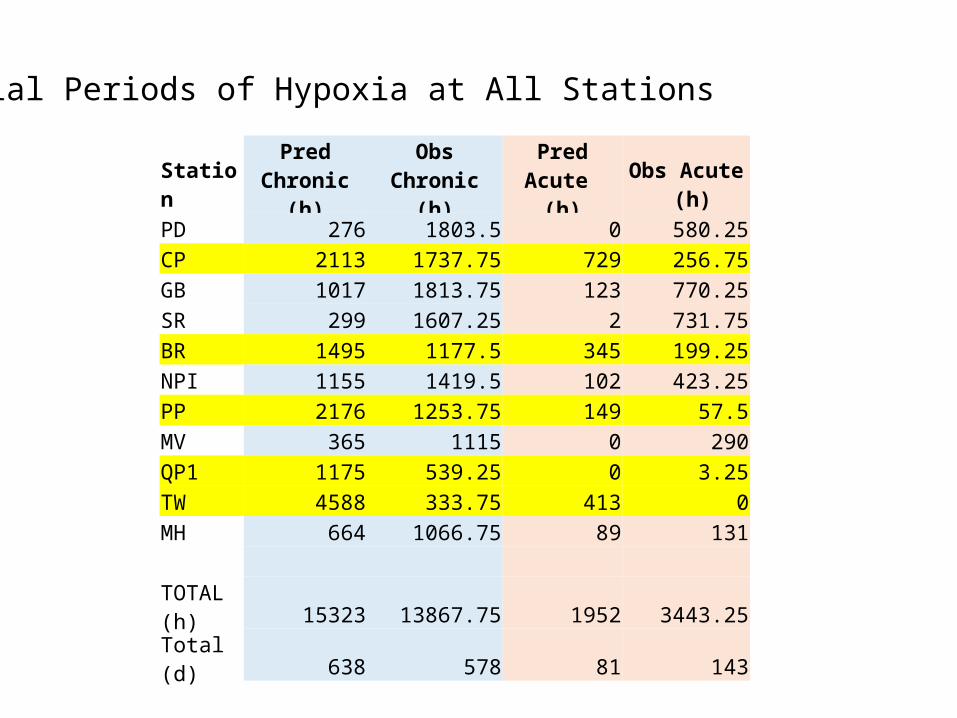
Initial Periods of Hypoxia at All Stations
StationPred Chronic
(h)Obs Chronic
(h)Pred Acute
(h)Obs Acute
(h)PD 276 1803.5 0 580.25CP 2113 1737.75 729 256.75GB 1017 1813.75 123 770.25SR 299 1607.25 2 731.75BR 1495 1177.5 345 199.25NPI 1155 1419.5 102 423.25PP 2176 1253.75 149 57.5MV 365 1115 0 290QP1 1175 539.25 0 3.25TW 4588 333.75 413 0MH 664 1066.75 89 131
TOTAL (h) 15323 13867.75 1952 3443.25Total (d) 638 578 81 143
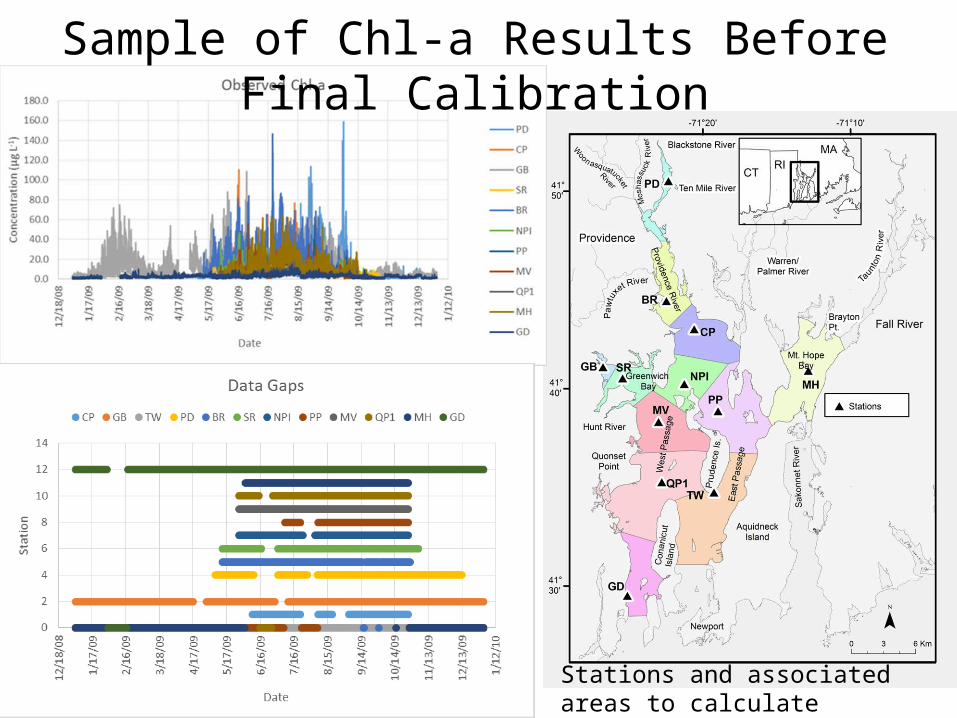
Stations and associated areas to calculatearea-weighted Chl-a concentrations
Sample of Chl-a Results Before Final Calibration
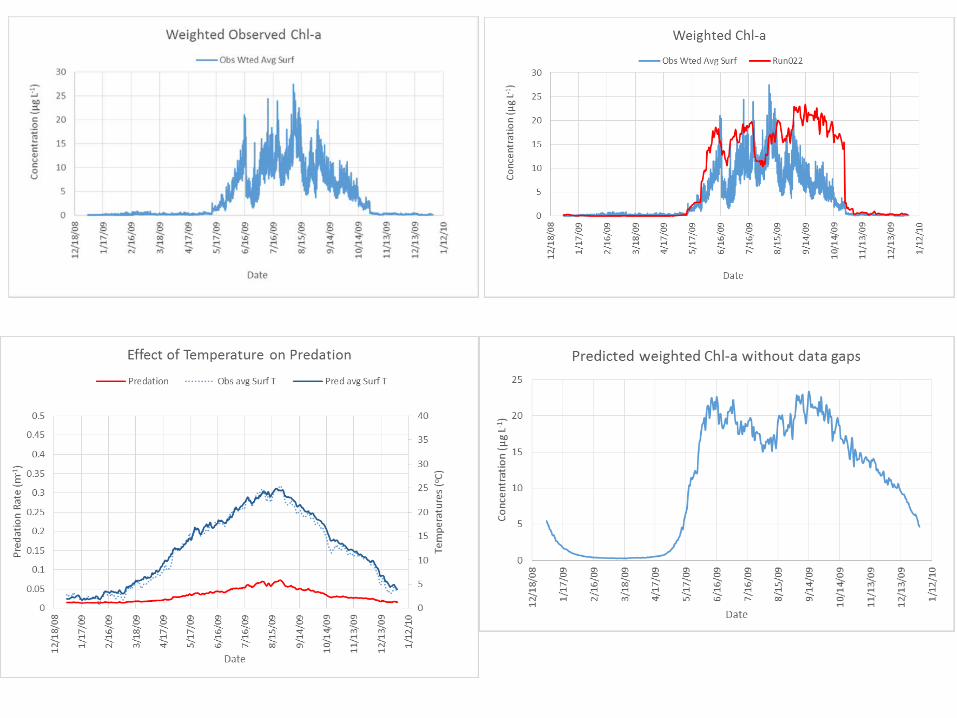

Sample Chl-a Results Before Final Calibration
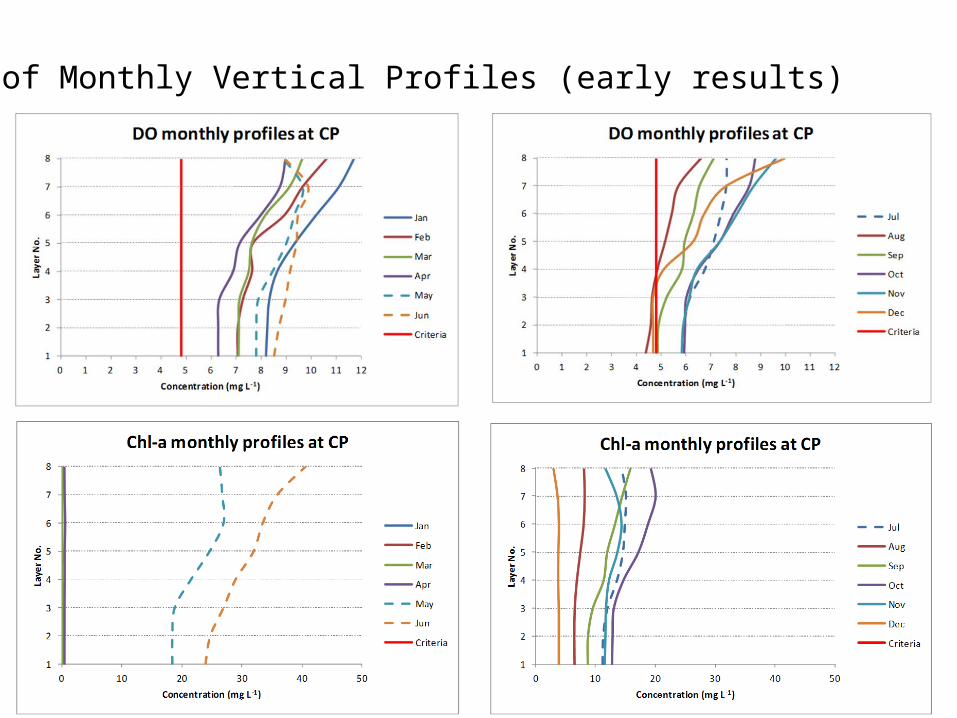
Sample of Monthly Vertical Profiles (early results)
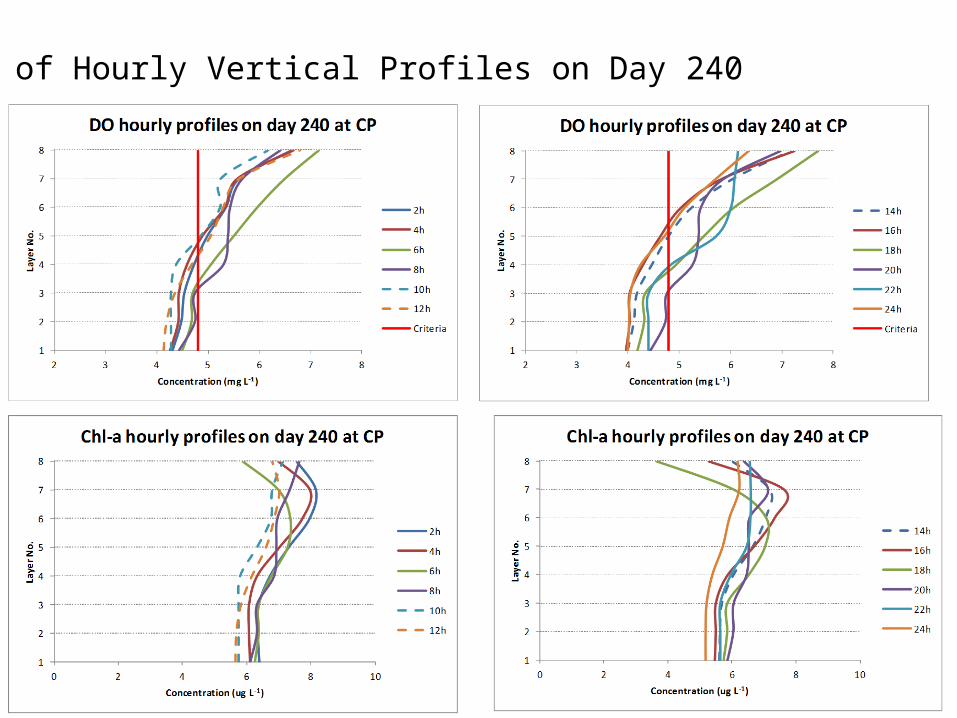
Sample of Hourly Vertical Profiles on Day 240

III. Benthic Sediment Quality & Flux
Modeling Benthic Sediment Processes to Predict Water Quality and Ecology in Narragansett Bay
By Mohamed A. Abdelrhman
From Park et al. (1995), Based on the model of DiToro and Fitzpatrick (1993)
Coupled with CE-QUAL-ICM (Cerco and Cole, 1993)
Objective: Provide benthic fluxes in space and time
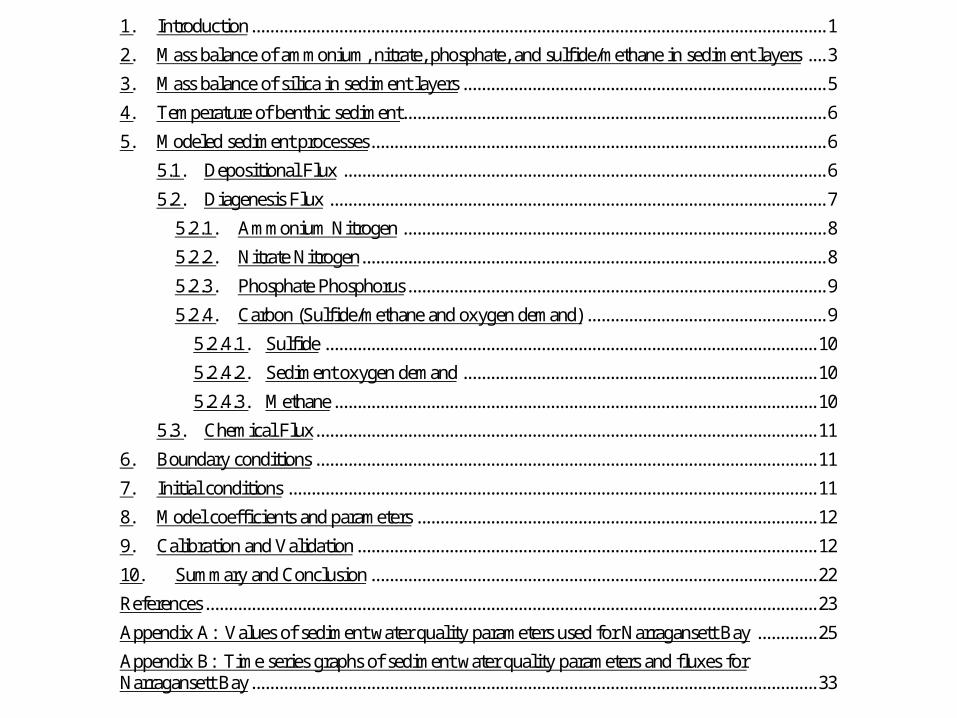
1. Introduction ............................................................................................................................. 1
2. Mass balance of ammonium, nitrate, phosphate, and sulfide/methane in sediment layers .... 3
3. Mass balance of silica in sediment layers ............................................................................... 5
4. Temperature of benthic sediment ............................................................................................ 6
5. Modeled sediment processes................................................................................................... 6
5.1. Depositional Flux ......................................................................................................... 6
5.2. Diagenesis Flux ............................................................................................................ 7
5.2.1. Ammonium Nitrogen ............................................................................................ 8
5.2.2. Nitrate Nitrogen..................................................................................................... 8
5.2.3. Phosphate Phosphorus ........................................................................................... 9
5.2.4. Carbon (Sulfide/methane and oxygen demand) .................................................... 9
5.2.4.1. Sulfide ........................................................................................................... 10
5.2.4.2. Sediment oxygen demand ............................................................................. 10
5.2.4.3. Methane ......................................................................................................... 10
5.3. Chemical Flux............................................................................................................. 11
6. Boundary conditions ............................................................................................................. 11
7. Initial conditions ................................................................................................................... 11
8. Model coefficients and parameters ....................................................................................... 12
9. Calibration and Validation .................................................................................................... 12
10. Summary and Conclusion ................................................................................................. 22
References ..................................................................................................................................... 23
Appendix A: Values of sediment water quality parameters used for Narragansett Bay ............. 25
Appendix B: Time series graphs of sediment water quality parameters and fluxes for Narragansett Bay ........................................................................................................................... 33

Flow chartFully Coupled Sediment& Water Quality Model
Layer 1 cmOxic, Anoxic
Layer 2 = 80 cmAnoxicG1 Labile HL 20d
G2 Refractory HL 1yrG3 Inert

State VariablesState variable number and description Name
(1) particulate organic carbon G1 class in layer 2 POC1
(2) particulate organic carbon G2 class in layer 2 POC2
(3) particulate organic carbon G3 class in layer 2 POC3
(4) particulate organic nitrogen G1 class in layer 2 PON1
(5) particulate organic nitrogen G2 class in layer 2 PON2
(6) particulate organic nitrogen G3 class in layer 2 PON3
(7) particulate organic phosphorus G1 class in layer 2 POP1
(8) particulate organic phosphorus G2 class in layer 2 POP2
(9) particulate organic phosphorus G3 class in layer 2 POP3
(10) particulate biogenic silica in layer 2 PSi
(11) sulfide/methane in layer 1 H2S1
(12) sulfide/methane in layer 2 H2S2
(13) ammonium nitrogen in layer 1a NH41
(14) ammonium nitrogen in layer 2 NH42
(15) nitrate nitrogen in layer 1 NO31
(16) nitrate nitrogen in layer 2 NO32
(17) phosphate phosphorus in layer 1 PO41
(18) phosphate phosphorus in layer 2 PO42
(19) available silica in layer 1 SI1
(20) available silica in layer 2 SI2
(21) ammonium nitrogen flux FNH4
(22) nitrate nitrogen flux FNO3
(23) phosphate phosphorus flux FPO4D
(24) silica flux FSAD
(25) sediment oxygen demand (flux) BFO2
(26) release of chemical oxygen demand (flux) BFCOD
(27) sediment temperature SMT
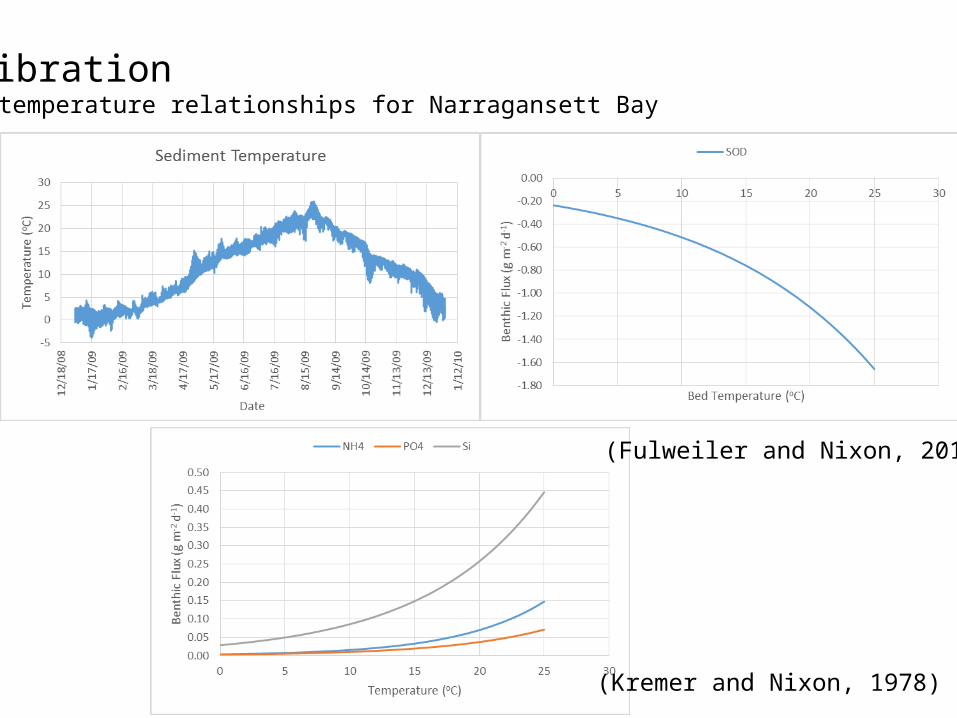
CalibrationFlux temperature relationships for Narragansett Bay
(Kremer and Nixon, 1978)
(Fulweiler and Nixon, 2010)
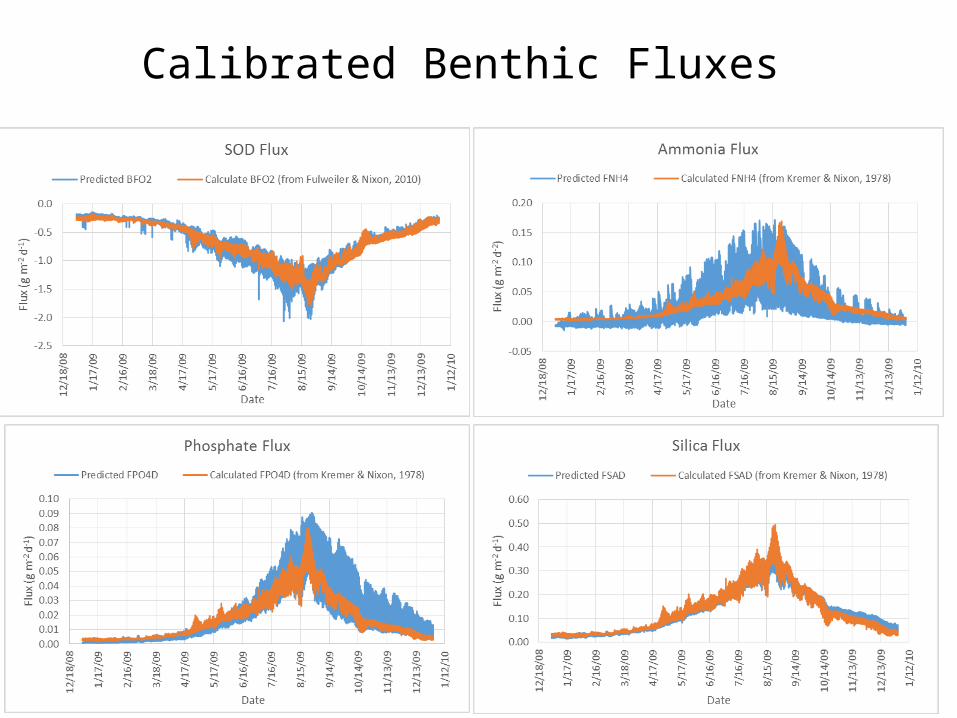
Calibrated Benthic Fluxes
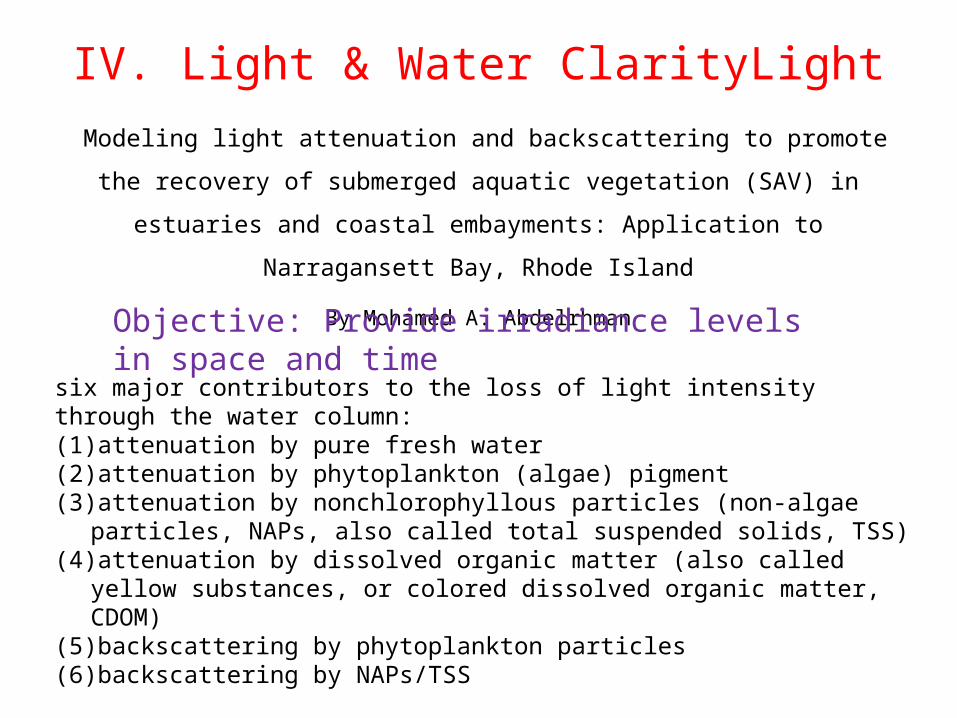
IV. Light & Water ClarityLight Modeling light attenuation and backscattering to promote the recovery of submerged
aquatic vegetation (SAV) in estuaries and coastal embayments: Application to
Narragansett Bay, Rhode Island
By Mohamed A. Abdelrhman
six major contributors to the loss of light intensity through the water column: (1) attenuation by pure fresh water(2) attenuation by phytoplankton (algae) pigment(3) attenuation by nonchlorophyllous particles (non-algae particles, NAPs, also called
total suspended solids, TSS)(4) attenuation by dissolved organic matter (also called yellow substances, or colored
dissolved organic matter, CDOM)(5) backscattering by phytoplankton particles(6) backscattering by NAPs/TSS
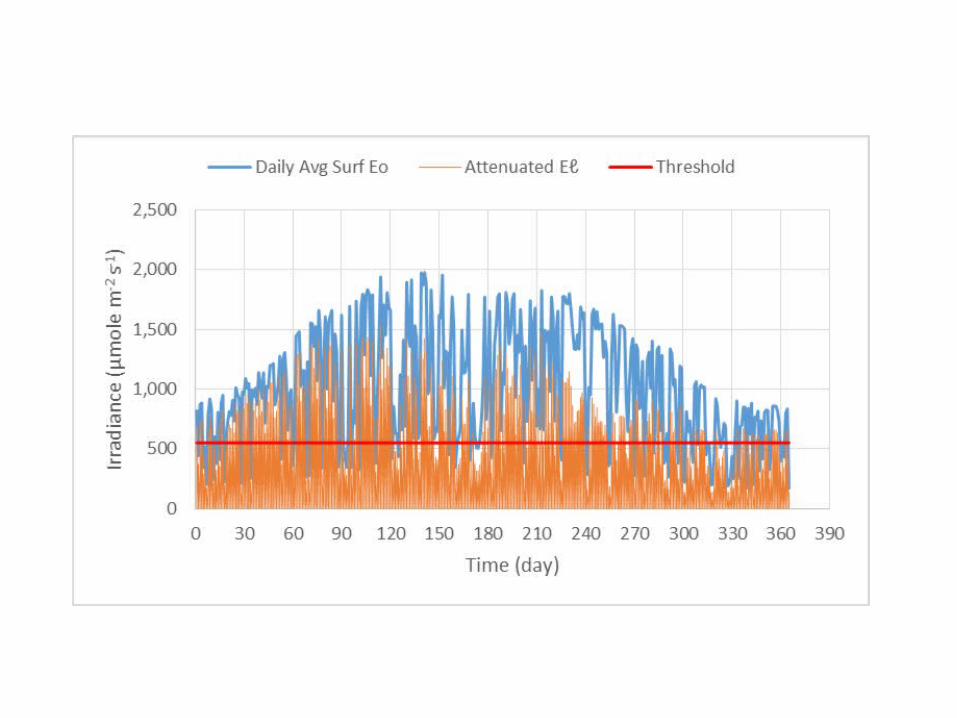
Objective: Provide irradiance levels in space and time
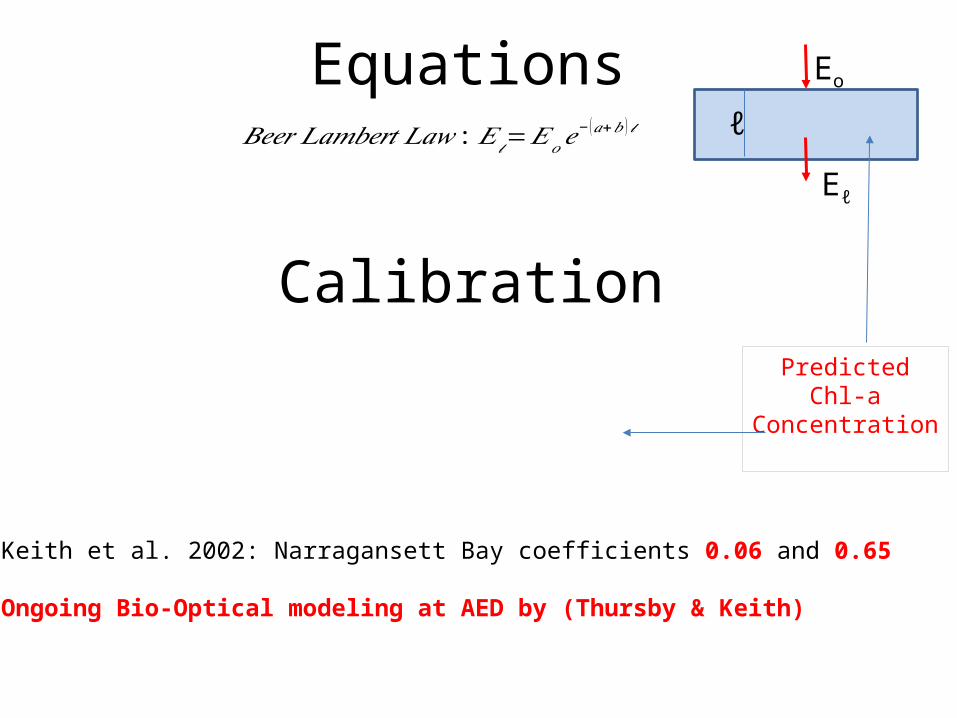
𝐵𝑒𝑒𝑟 𝐿𝑎𝑚𝑏𝑒𝑟𝑡 𝐿𝑎𝑤 : 𝐸𝓁=𝐸𝑜𝑒− (𝑎+𝑏 ) 𝓁
Equations Eo
Eℓ
ℓ
Calibration
Keith et al. 2002: Narragansett Bay coefficients 0.06 and 0.65
Ongoing Bio-Optical modeling at AED by (Thursby & Keith)
PredictedChl-a
Concentration

PredictedChl-a Concentration
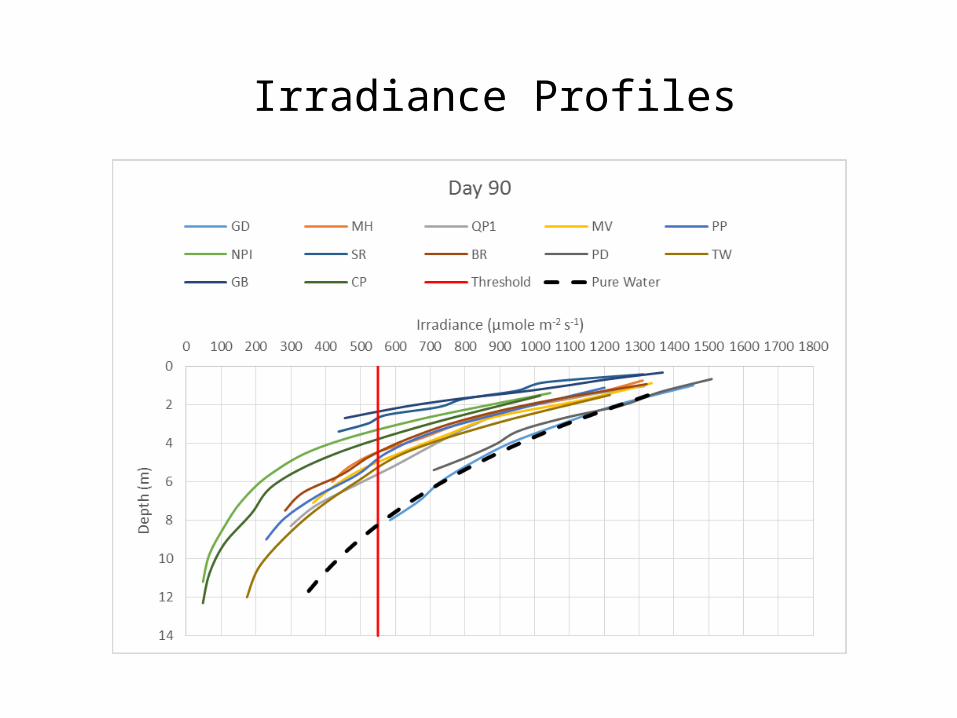
Irradiance Profiles
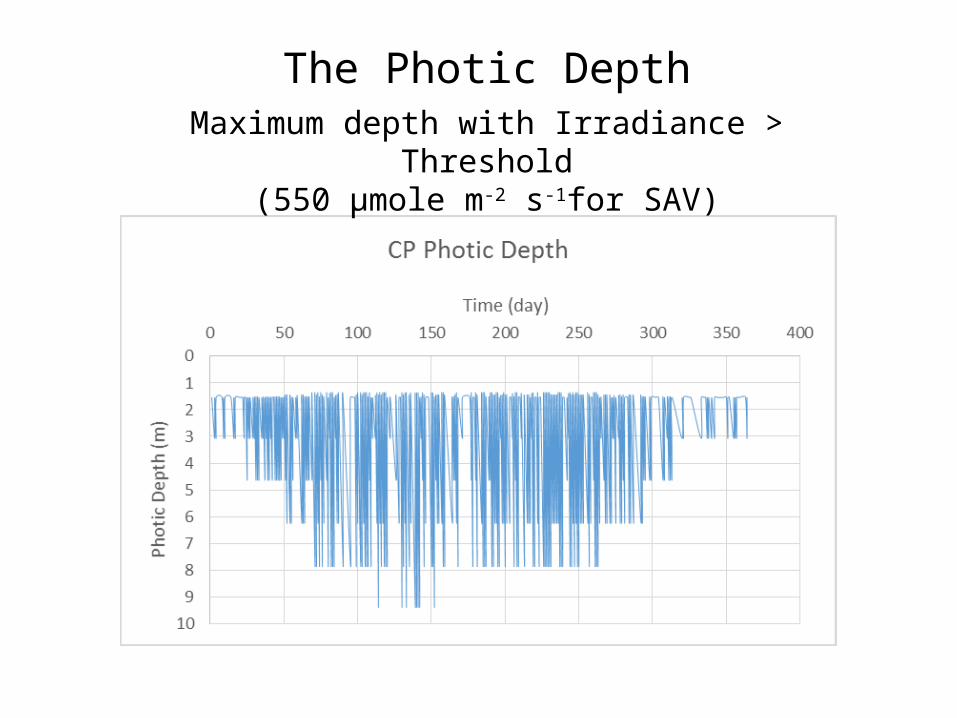
The Photic DepthMaximum depth with Irradiance > Threshold
(550 μmole m-2 s-1for SAV)
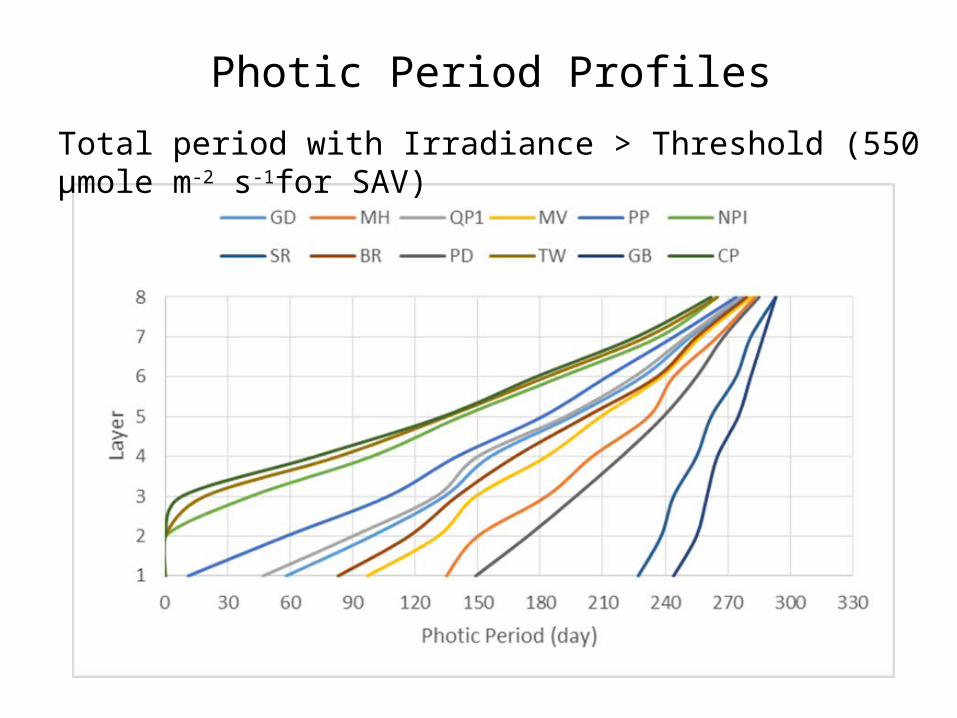
Photic Period Profiles
Total period with Irradiance > Threshold (550 μmole m-2 s-1for SAV)
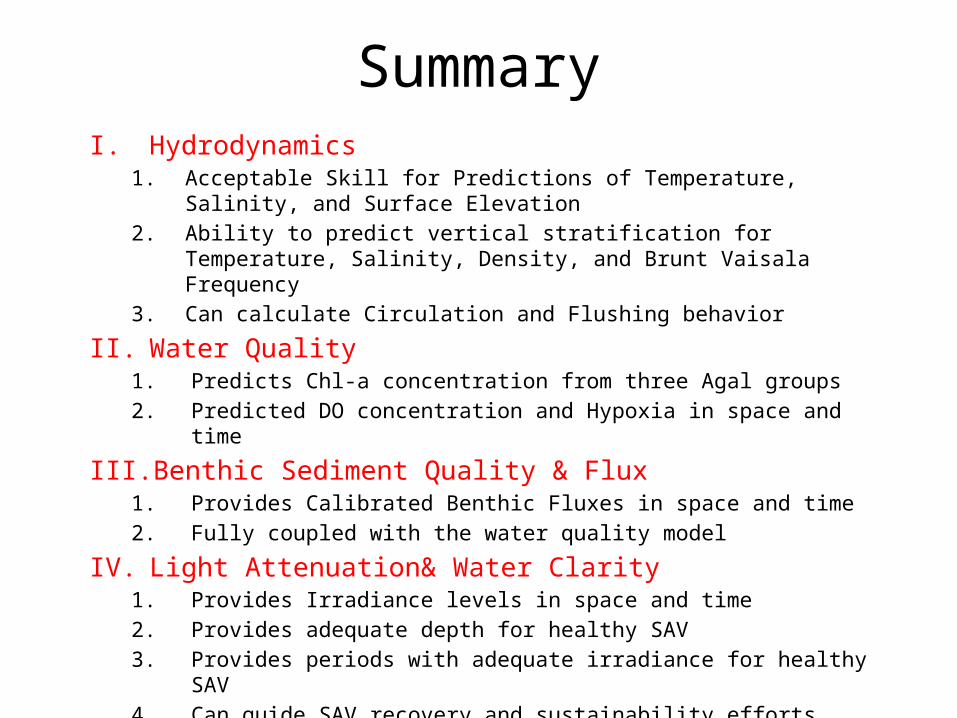
SummaryI. Hydrodynamics
1. Acceptable Skill for Predictions of Temperature, Salinity, and Surface Elevation2. Ability to predict vertical stratification for Temperature, Salinity, Density, and
Brunt Vaisala Frequency3. Can calculate Circulation and Flushing behavior
II. Water Quality1. Predicts Chl-a concentration from three Agal groups2. Predicted DO concentration and Hypoxia in space and time
III. Benthic Sediment Quality & Flux1. Provides Calibrated Benthic Fluxes in space and time2. Fully coupled with the water quality model
IV. Light Attenuation& Water Clarity1. Provides Irradiance levels in space and time2. Provides adequate depth for healthy SAV 3. Provides periods with adequate irradiance for healthy SAV4. Can guide SAV recovery and sustainability efforts